Digital, Media & Technology Industry Report: Buckle Your Seat Belts

Monday, April 24, 2022

Michael Kupinski, Director of Research, Noble Capital Markets, Inc.

Jacob Mutchler, Research Associate, Noble Capital Markets, Inc.

Refer to the bottom of the report for important disclosures

Overview: Key takeaways from the NAB. Media investors are unpacking the information from the National Association of Broadcaster’s (NAB) convention. While there are promising new technologies that are sure to create shiny new objects to catch investor’s attention, particularly AI, the chatter is about the current advertising environment. Looking for the key takeaways? Sign up here for the virtual conference on April 27th. 

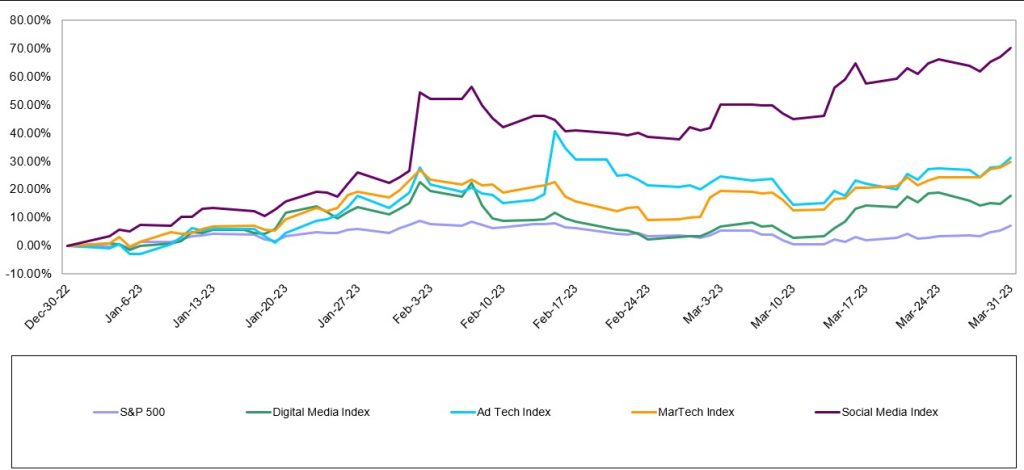
Digital Media & Technology: Head fake? Every one of Noble’s Internet and Digital Media Indices not only finished the quarter up, but significantly outperformed the S&P 500.  The best performing index was Noble’s Social Media Index, which increased by 70% in the first quarter of 2023, followed by Noble’s Ad Tech Index (+31%), MarTech Index (+30%), and Digital Media Index (+18%). 

Television Broadcasting: Weak current revenue trends. While auto advertising appears to be faring better, the weight of the economic challenges appear to be causing further moderation in advertising. Will auto and, potentially Political, carry the second half 2023 revenue performance?

Radio Broadcasting: All out of love. The industry is reeling from a Wall Street research downgrade to an underperform on iHeart Media, which sent all radio stocks tumbling. Some stocks performed better than others. What’s behind the downgrade and which stocks performed better? 

Publishing:Advertising takes a hit. After a period of moderating revenue trends, Publishers reported a weakened advertising environment. The downturn was due to Print advertising which took a nose dive. As a result, publishing companies implemented another round of expense cuts to bolster cash flow. There is a bright spot as Digital continues to perform strongly. 

Overview

The NAB Show Stopper

Media investors are unpacking all of the information from last week’s National Association of Broadcaster’s (NAB) convention. There is a lot to digest given that there were over 1,400 exhibits, 140 new exhibitors this year. Because of the overwhelming number of exhibitors, many that go to Vegas for this annual convention do not go to the convention floor. It is a shame. There was a lot to see and learn. As Noble’s Media & Entertainment Analyst I walked the convention floor, which covers 4.6 million square feet of exhibit halls and meeting rooms. I stopped by booths and taped presentations to explain the new technologies, the plan for implementation of new services, and the prospect for revenue monetization. One important demonstration focused on the new broadcast standard, ATSC 3.0, the hope for a bright future for the television industry. This new standard should allow the industry to become more contemporary in terms of how its audience consumes video and information. In addition, it offers the ability for the industry to participate in new revenue streams, including Datacasting, which may become bigger than Retransmission revenue in the future. 

In addition to touring the floor, I attended NAB panel discussions and hosted meetings with media management teams in a fireside chat format to discuss current business trends, the new technologies (including Artificial Intelligence (AI) and the new broadcast standard). In addition, these C-suite management teams provided their key takeaways from the NAB convention and offered why they participated in the conference this year. These discussions are available to you for free on Channelchek.com on April 27th in a virtual conference. In this upcoming Channelchek Takeaway Series on the NAB Show, I offer my key takeaways, including the current advertising outlook, my take on the monetization of the new technologies and what media investors should do now given the current economic and advertising environment. Your free registration to this informative event is available here

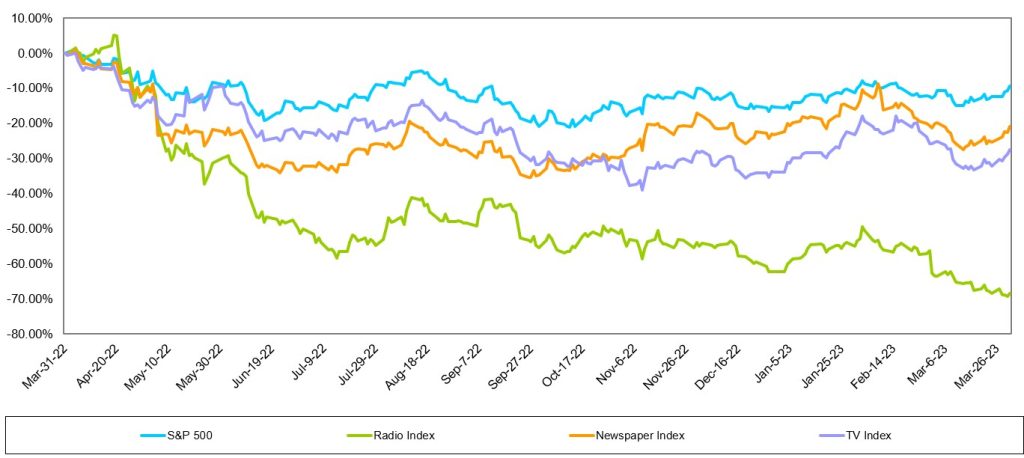
This report highlights the performance of the media sectors over the past 12 months and past quarter. Overall, media stocks struggled in the past year, but there has been some improved quarterly performance, particularly in Digital Media and Broadcast Television, discussed later. All media stocks are struggling to offset losses over the course of the past year with trailing 12 months stocks down in the range of 5% on the low end to down 68% on the high end. The best performing sector in the past 12 months were Social Media stocks, down 5% versus the general market decline of 9% over the comparable period.

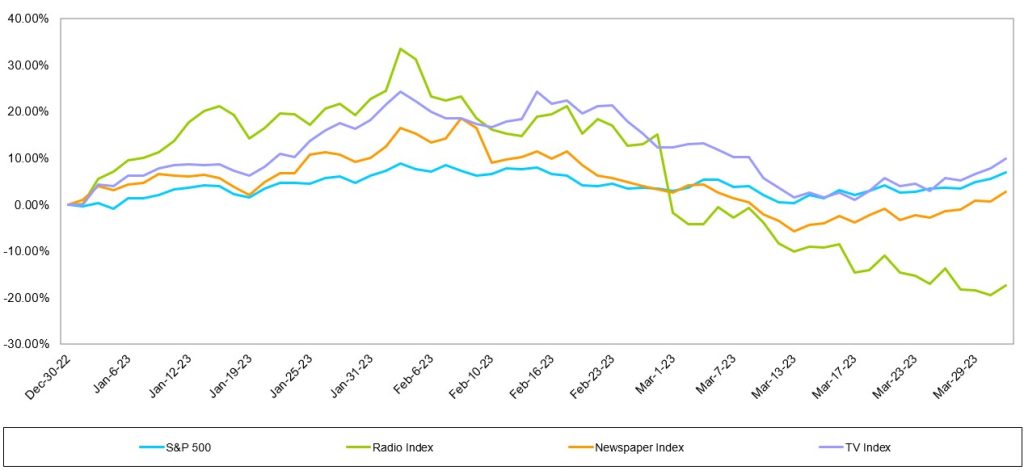
In the first quarter, stock performance was mixed. The best performers in the traditional media sectors were Broadcast Television stocks, up nearly 10% versus the general market which increased 7% in the comparable period. But, the individual TV stock performance reflected a different story, explained later in this report. The worse performer for the quarter were the radio stocks, driven by a Wall Street downgrade of one of the leading radio broadcasters. The Digital Media stocks had another good performance. We believe that stock performance will be a roller coaster for at least another quarter or two as the weight of the Fed rate increases begin to adversely affect the economy.

While National advertising has remained weak, we believe that Local advertising is now beginning to moderate as well. The Local advertising weakness appears to be in the smaller markets as well as the larger markets. This is somewhat different than the most recent economic cycles whereby the smaller markets were somewhat resilient. It seems that the smaller markets are feeling the adverse affects from inflation, rising employment costs and tightening bank credit. In our view, the disappointing advertising outlook likely will cause second quarter revenue estimates to come down, creating a difficult environment for media stocks. As such, we encourage investors to be opportunistic and take an accumulation approach to building positions for the prospective economic and advertising improvement. Our favorites have digital media exposure, given that we expect Digital Advertising (while softening as well) will be more resilient than traditional advertising mediums. Our favorites include Travelzoo (TZOO), Townsquare Media (TSQ), Harte Hanks (HHS), E.W. Scripps (SSP), and Direct Digital (DRCT)

Digital Media

Head fake?

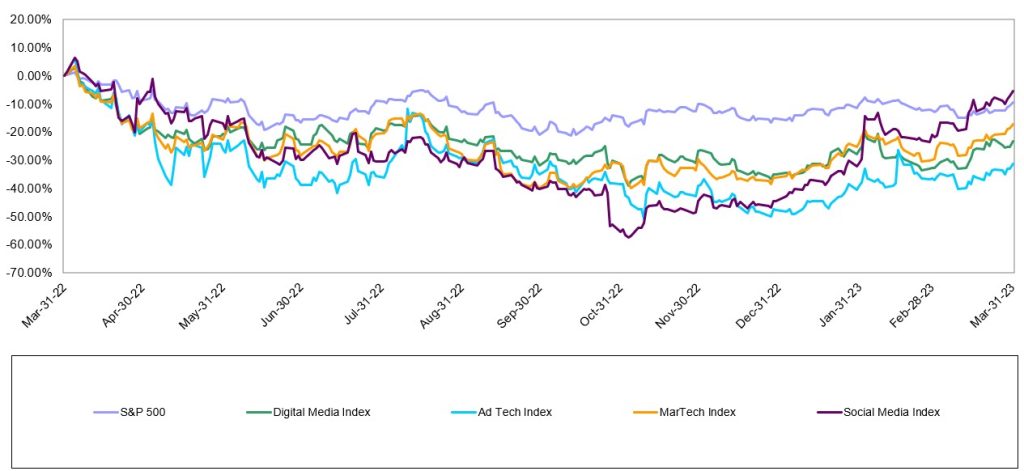
Last quarter we wrote that the S&P 500 increased for the first time since the fourth quarter of 2021 and that we were beginning to see signs of life in Noble’s Internet and Digital Media Indices as well.  Those signs of life continued to bear fruit throughout the first quarter, as every one of Noble’s Internet and Digital Media Indices not only finished the quarter up, but significantly outperformed the S&P 500. Figure #1 LTM Digital Media Performance highlights that many of the Digital Media sectors are now approaching year earlier levels given the most recent favorable performance. The best performing index was Noble’s Social Media Index, which increased by 70% in the first quarter of 2023, followed by Noble’s Ad Tech Index (+31%), MarTech Index (+30%), and  Digital Media Index (+18%). 

Figure #1 LTM Digital Media Performance
Source: Capital IQ 

Noble’s Indices are market cap weighted, and we attribute the strength of the Social Media Index to its largest constituent, Meta Platforms (META; a.k.a. Facebook) whose shares increased by 76% in the first quarter. Figure #2 Q1 Digital Media Performancehighlights the first quarter performance for the digital stocks.Meta’s management stirred interest in the shares from its 4Q 2022 earnings call when they spent most of their time talking about “efficiency”, which investors interpreted to mean that Meta was newly focused on profitability.  After a relatively disastrous 3Q 2022 earnings call, after which shares fell by 25%, the company demonstrated on its 4Q 2022 earnings call that it clearly had gotten the message:  investors were not enamored about the company’s plans in October 2022 to spend billions of dollars to develop its Metaverse initiatives. Rather, on its fourth quarter call, management focused on driving its short form video initiative, Reels (i.e., becoming more TikTok like), reducing its headcount by reducing layers of management, lowering its operating expenses and reducing its capital expenditures. Investors applauded this newfound focus on profitability and shares rebounded from a low of $88.90 per share in early November to $211.94 at the March quarter-end.   

The next best performing index was Noble’s Ad Tech Index which increased by 31% during 1Q 2023.  Fourteen of the 23 stocks in the index were up in the first quarter. Standouts during the quarter were Integral Ad Science (IAS; +62%) and Perion Networks (PERI; +56%).  Integral Ad Science exceeded expectations in its fourth quarter results and guided to better-than-expected results in 1Q 2023.  The company continues to expand its product suite, scale its social media offerings (i.e., for TikTok) and is well positioned to continue to benefit from the shift from linear TV to connected TV (CTV).  Perion shares continued their winning:  Perion was the only ad tech stock whose shares were up in 2022.  Perion’s 56% increase in 1Q 2023 reflected beat on both revenues (by 2%) and EBITDA (by 10%) as well as improved guidance for 1Q 2023.  Perion’s profitability increased significantly in 2022, with EBITDA nearly doubling (+90%) from 2021 ($70M) to 2022 ($132M).

Noble’s MarTech Index increased by 30% with 14 of the 22 stocks in the index posting increases in 1Q 2023.  The best performing stocks were Qualtrics (XM; +70%) Sprinklr (CXM; +59%), Salesforce (CRM; +51%), Hubspot (HUBS; +48%) and Yext (YEXT; +47%). Qualtrics agreed to be acquired for $12.5 billion by Silver Lake and the Canadian Pension Plan Investment Board, which came at a 73% premium to its 30-day volume weighted stock price. Sprinklr beat revenue expectations and significantly beat EBITDA expectations (doubling the Street expectations) and guided to a current year forecast that focuses more on efficiency and profitability.

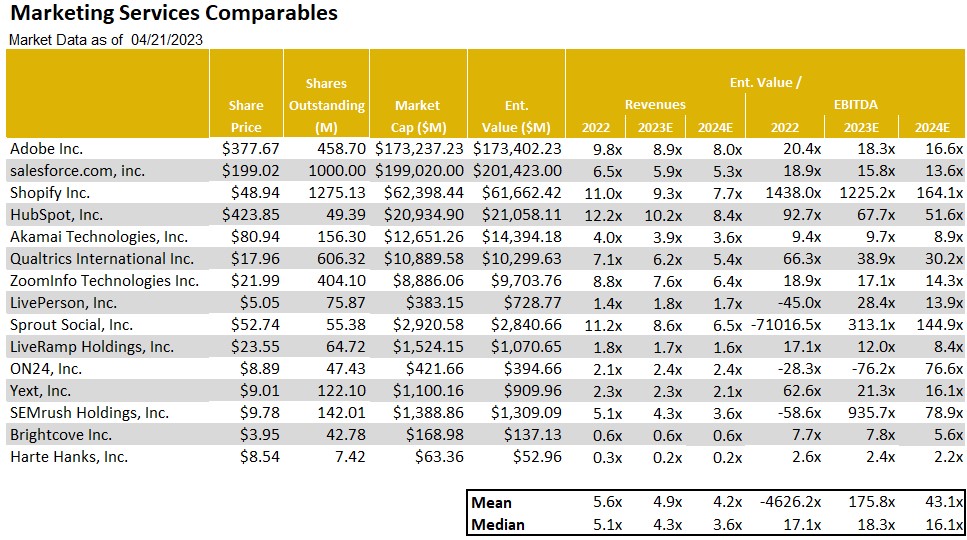
MarTech stocks have been victims of their own success. Two years ago at this time the sector was trading at 11.3x forward revenue estimates, and a year ago the group was trading at 6.5x forward revenues. Today the group trades at 4x forward revenues and investors appear to be wading back into the sector. Figure #3 Marketing Tech Comparables highlights the compelling stock valuations.One of the laggards in the sector has been Harte Hanks (HHS), which declined 20% in the first quarter. We believe that the shares have not gained traction following the successful rebound toward profitability in 2022. The shares advanced a powerful 136% in 2022 from lows in May to highs achieved in August 2022. Since that time, investors appear to be taking chips off the table. In our view, the HHS shares appear to be oversold. Its business appears to be resilient. Given the recent weakness in the shares, the shares appear to be undervalued and offer a favorable risk reward relationship. As such, the HHS shares are among our favorites in the sector.  

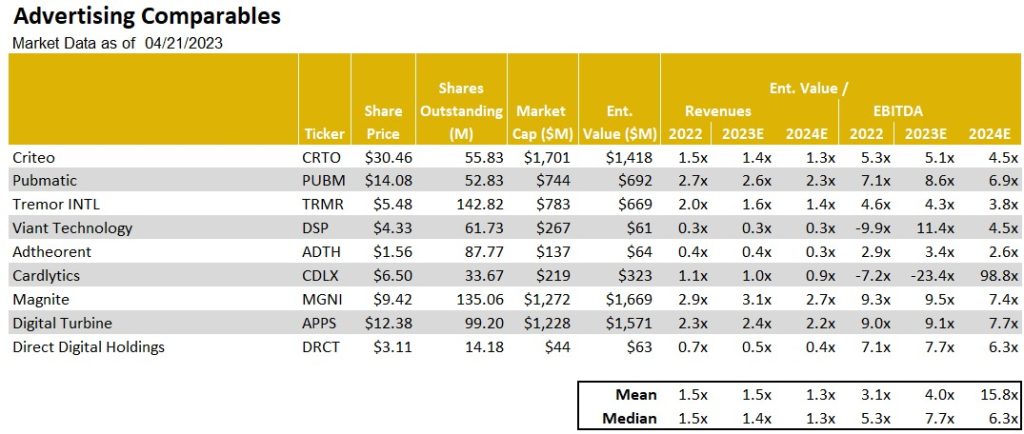
Another one of our current favorites is Direct Digital Holdings (DRCT). As Figure #4 Advertising Tech Comparables illustrates, the DRCT shares trade in line with the averages for the group at roughly 5.4 times 2024 adj. EBITDA. Notably, the company recently restated upward its 2022 full year revenue and adj. EBITDA results. Given the favorable operating momentum, we raised our full year 2023 and 2024 revenue and adj. EBITDA estimates, keeping our previous growth estimates. With the higher 2024 adj. EBITDA, we tweaked upward our price target from $5.50 to $6.00. Given a favorable fundamental outlook and compelling stock valuation, we view the shares as among our favorites.  

Finally, Noble’s Digital Media Index, while lagging that of its digital peers at an 18% increase, significantly outperformed the S&P 500 (+7%), with a broad based recovery in which 9 of the sector’s 11 stocks increased during 1Q 2023.  The best performing stock was Spotify (SPOT; +69%), whose revenues fell short of expectations by less than 1%, significantly beat consensus Street EBITDA expectations by $58M and more importantly pivoted towards demonstrating operating leverage.  Spotify, which posted an EBITDA loss of nearly $500 billion in 2022, is expected to generate $650 billion in EBITDA in 2024, according to Street estimates. A deteriorating ad market in 2022 combined with higher interest rates likely prompted the company to shift its priorities to running a profitable company and doing it more quickly and with some urgency.  The second best performing stock was Travelzoo (TZOO; +36%), as the company’s 4Q 2022 revenues and EBITDA increased by 31% and 328%, respectively.  Notably, Travelzoo’s EBITDA came in 58% higher than Street consensus. The company appears to be benefiting from pent up travel demand for travel and management highlighted the opportunity for margin expansion in the coming quarters. Given the favorable outlook, we raised our price target to $10. Near current levels, the TZOO shares appear to offer above average returns and we reiterate our Outperform rating.    

Figure #2 Q1 Digital Media Performance 
Source: Capital IQ

Figure #3 Marketing Tech Comparables 
Source: Eikon, Company filings & Noble estimates

Figure #4 Advertising Tech Comparables
Source: Eikon, Company filings & Noble estimates 

Traditional Media 

As Figure #5 LTM Traditional Media Performance illustrates, these stocks have struggled to gain sea legs, trending lower over the course of the past year. All traditional media sectors have underperformed over the past year, with Radio the poorest performing group. As Figure #6 Q1 Traditional Media Performance illustrates, only the TV Broadcast stocks edged out the general market performance in the latest quarter. 

Figure #5 LTM Traditional Media Performance
Source: Capital IQ

Figure #6 Q1 Traditional Media Performance
Source: Capital IQ

Television Broadcast 

Weak current revenue trends 

As illustrated in the previous chart, the TV stocks outperformed the general market in the first quarter. This market cap weighted index masked the performance of many poor performing stocks in the quarter.  Sinclair Broadcasting (SBGI; up 10%), Entravision (EVC; up a strong 26%), and Fox (FOX; up 12%) were among the best performing stocks and favorably influenced the TV index in the quarter. But, there were many poor performing stocks including E.W. Scripps (SSP; down 29%), Gray Television (GTN; down 22%) and Tegna (TGNA; down 20%). We believe that there was heightened interest in Entravision given its favorable Q1 results which was fueled by its fast growing Digital business. Figure #7 TV Q4 YoY Revenue Growth illustrates the Entravision’s Q4 revenue performance was among the best in the industry. While Entravision was among the best revenue performers, its margins are below that of its peer group as illustrated in Figure #8 TV Q4 EBITDA Margins. This is due to the accounting treatment of its Digital revenues given that it is an agency business. Given that Digital represents roughly 80% of the company’s total company revenue, we plan to put the EVC shares into the Digital Media sector to more accurately reflect its business. The poorer performing stocks are among the higher debt levered in the industry. As such, we believe the underperformance reflects concern of a slowing economy and investors flight to quality in the sector. 

We do not believe that we are out of the woods with the TV stocks and the market is expected to be volatile. The advertising environment appears to be deteriorating given weakening economic conditions. There are bright spots which include some improvement in the Auto category. Dealerships appear to be stepping up advertising given higher inventory levels. In addition, broadcasters appear optimistic about Political advertising, which could begin in the third quarter 2023. There is a planned Republican presidential candidate debate scheduled in August. As such, there is some promise that candidates will advertise in advance of that debate and into the fourth quarter given the early primary season. We do not believe that Political and Auto will be enough to offset the weakness in National and in the weakening Local category. In our view, Q2 and full year 2023 estimates are likely to come down. Furthermore, we believe that broadcasters will be shy about predicting Political advertising even into 2024 given the past disappointments in management forecasts in the last Political cycle. 

We encourage investors to take an accumulation approach to the sector. Notably, as Figure #9 TV Comparables highlights, nearly all of the stocks are trading near each other, with the exception of the larger media stocks. In our view, the valuations are near recession type valuations and appear to have limited downside risk. Our current favorite is E.W. Scripps (SSP). While the company is not immune to the current weak advertising environment, we believe that there is a favorable Retransmission revenue opportunity as 75% of its subscribers are due in the next 12 months. In addition, we believe that Retransmission margins will improve. Given the relatively small float for the shares, the SSP shares tend to underperform when the industry is out of favor, but then outperform when the industry is back in favor. In our view, the SSP shares offer a favorable risk/reward relationship and top our favorites in the sector. 

Figure #7 TV Q4 YoY Revenue Growth

Source: Eikon & Company filings

Figure #8 TV Q4 EBITDA Margins

Source: Eikon & Company filings

Figure #9 TV Comparables 

Source: Noble Estimates & Eikon

Radio Broadcasting

All out of love

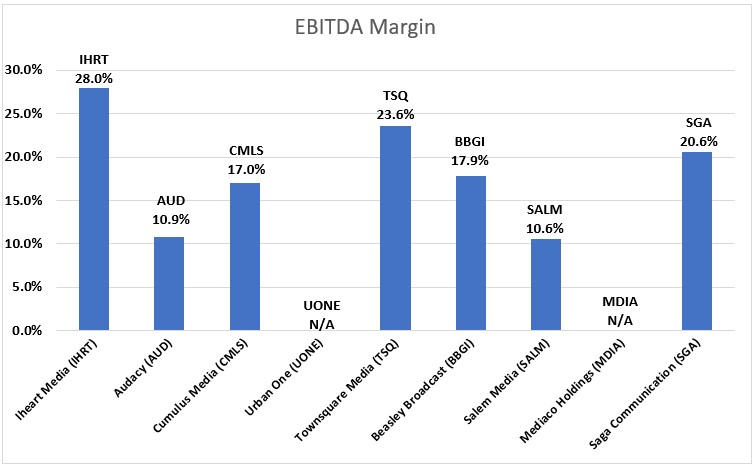
The Radio stocks had another tough quarter, down 17% versus a 7% gain for the general market. Notably, there was a wide variance in the individual stock performance, with the largest stocks in the group having the worst performance in the quarter, including Audacy (AUD; down 40%), Cumulus Media (CMLS; down 41%) and iHeart Media (IHRT; down 36%). The first quarter stock performance did not appear to reflect the fourth quarter results. As Figure #10 Radio Industry Q4 YoY Revenue Growth illustrates, revenues were relatively okay, with some exceptions. Some of the larger Radio companies which have a large percentage of National advertising, underperformed relative to the more diversified Radio companies, especially those with a strong Digital segment presence. Figure #11 Radio Industry Q4 YoY EBITDA Margins illustrate that the margins for the industry remain relatively healthy. 

The weakness in the Radio stocks was fueled in the quarter from a downgrade to under perform on the shares of iHeart by a Wall Street firm. Many radio stocks were down in sympathy. The analyst attributed the downgrade to the current macro environment and its heavy floating rate debt burden. The company is not expected to generate enough free cash flow to de-lever its balance sheet. We believe the downgrade as well as the excessive debt profile of Audacy, another industry leader which likely will need to restructure, sent all radio stocks tumbling. Some stocks performed better than others. While Cumulus Media’s debt profile is not as levered as iHeart or Audacy, the shares were caught in the net of a weak advertising outlook. Cumulus is among the most sensitive to National advertising, which currently continues to be weak. 

Some of our favorite stocks which are diversified and have developing digital businesses performed better. Those stocks included Townsquare Media (TSQ; up 10%), and Salem Media (SALM; up 4%). Notably, while the shares of Beasley Broadcasting (BBGI) were down 10%, the shares performed better than the 17% decline for the industry in the quarter. Importantly, Beasley recently provided favorable updated Q1 guidance for the first quarter. Q1 revenues are expected to increase 1% to 2.5% and EBITDA growth is expected to be in the range of 40% to 50%, significantly better than our estimates. Furthermore, management provided a sanguine outlook for 2023 and 2024. Digital revenue is expected to reach 20% to 30% of total revenue with a goal of reaching 40% in 2024. By comparison, Digital revenue was 17% of total revenue in the fourth quarter 2022. Furthermore, the company is sitting on roughly $35 million in cash. It has opportunistically repurchased $10 million of its bonds at a significant discount. We believe that it is likely to maintain a strong cash position given the economic uncertainty. 

We view Townsquare Media (TSQ), Salem Media (SALM) and Beasley Broadcast (BBGI) as among our favorites in the industry given the diverse revenue streams. While these companies are not immune to the economic headwinds, we believe that its Digital businesses should offer some ballast to its more sensitive Radio business. In the case of Salem, 30% of its revenues are relatively stable with block programming. As Figure #12 Broadcast Radio Comparables illustrates, the shares of Townsquare are among the cheapest in the industry, trading below peer group averages. Notably, the company instituted a hefty dividend. As a result, investors get paid while we await a favorable upturn in fundamentals. As such, the shares of TSQ tops our list of favorites. 

Figure #10 Radio Industry Q4 YoY Revenue Growth

Source: Eikon & Company filings

Figure #11 Radio Industry Q4 YoY EBITDA Margins
Source: Eikon & Company filings

Figure #12 Broadcast Radio Comparables 

Source: Noble estimates & Eikon

Publishing 

Advertising takes a hit  

After a period of moderating revenue trends, Publishers reported a weakened advertising environment. As illustrated in Figure #13 Publishing Industry YOY Revenue Growth, illustrates that revenue trends deteriorated with Print advertising taking a nose dive. This trend was illustrative in the results from Lee Enterprises, one of our current favorites in the sector. After a fiscal fourth quarter flat revenue performance, the company reported a 8.5% decline in its fiscal first quarter. The Q1 revenue performance reflected an 18.5% decrease in Print advertising, an acceleration in the rate of the 11% decline in the previous quarter. 

The surprisingly weak quarter hit the company’s adj. EBITDA margins. Traditionally, Lee maintained some of the best margins in the industry. As Figure #14 Q4 Publishing Industry EBITDA Margins illustrates, the company fell in ranking to among the lowest in the sector. Importantly, in spite of the revenue weakness, the company maintains its previous adj. EBITDA guidance of $94 million to $100 million. To achieve its cash flow target in light of the soft revenue outlook, Lee implemented a round of expense cuts to bolster cash flow. Cost reductions are expected to result in $40 million of savings in FY23, and $60 million in annualized savings going forward. While we are disappointed that the company’s Print business is not moderating as previously expected, the company’s Digital businesses remain favorably robust. In addition, its Digital business is turning toward contributing margins. As such, we remain sanguine about the company’s digital transition. 

As Figure #15 Publishing Comparables highlights, there is a wide gap between the valuation of the New York Times (NYT) and the rest of the industry, including Lee. While the highly debt levered shares of Gannett appear cheaper, we believe that Lee has a more favorable debt profile with a fixed 9% annual rate, no fixed principal payments, no performance covenants and a 25 year maturity. With the shares trading at 5.3 times our 2024 adj. EBITDA estimate compared with 15.4 times at the New York Times, we believe that there is limited downside risk in the LEE shares. Furthermore, we believe that the company is well positioned as economic and advertising prospects improve. Given the company’s favorable outlook for its Digital transition, we believe that the shares should close the gap in valuations with the leadership stock in the group. Consequently, the shares of LEE are among our favorite play for an improving economic outlook. 

Figure #13 Publishing Industry YoY Revenue Growth 

Source: Eikon & Company filings

Figure #14 Q4 Publishing Industry EBITDA Margins

Source: Eikon & Company filings

Figure #15 Publishing Comparables 

Source: Noble estimates & Eikon

For more information on companies mentioned in this report click on the following:

Beasley Broadcast

Cumulus Media

Direct Digital

Entravision

E.W. Scripps

Harte Hanks

Lee Enterprises

Salem Media Group

Townsquare Media

Travelzoo

GENERAL DISCLAIMERS

All statements or opinions contained herein that include the words “we”, “us”, or “our” are solely the responsibility of Noble Capital Markets, Inc.(“Noble”) and do not necessarily reflect statements or opinions expressed by any person or party affiliated with the company mentioned in this report. Any opinions expressed herein are subject to change without notice. All information provided herein is based on public and non-public information believed to be accurate and reliable, but is not necessarily complete and cannot be guaranteed. No judgment is hereby expressed or should be implied as to the suitability of any security described herein for any specific investor or any specific investment portfolio. The decision to undertake any investment regarding the security mentioned herein should be made by each reader of this publication based on its own appraisal of the implications and risks of such decision.

This publication is intended for information purposes only and shall not constitute an offer to buy/sell or the solicitation of an offer to buy/sell any security mentioned in this report, nor shall there be any sale of the security herein in any state or domicile in which said offer, solicitation or sale would be unlawful prior to registration or qualification under the securities laws of any such state or domicile. This publication and all information, comments, statements or opinions contained or expressed herein are applicable only as of the date of this publication and subject to change without prior notice. Past performance is not indicative of future results. Noble accepts no liability for loss arising from the use of the material in this report, except that this exclusion of liability does not apply to the extent that such liability arises under specific statutes or regulations applicable to Noble. This report is not to be relied upon as a substitute for the exercising of independent judgement. Noble may have published, and may in the future publish, other research reports that are inconsistent with, and reach different conclusions from, the information provided in this report. Noble is under no obligation to bring to the attention of any recipient of this report, any past or future reports. Investors should only consider this report as single factor in making an investment decision.

IMPORTANT DISCLOSURES

This publication is confidential for the information of the addressee only and may not be reproduced in whole or in part, copies circulated, or discussed to another party, without the written consent of Noble Capital Markets, Inc. (“Noble”). Noble seeks to update its research as appropriate, but may be unable to do so based upon various regulatory constraints. Research reports are not published at regular intervals; publication times and dates are based upon the analyst’s judgement. Noble professionals including traders, salespeople and investment bankers may provide written or oral market commentary, or discuss trading strategies to Noble clients and the Noble proprietary trading desk that reflect opinions that are contrary to the opinions expressed in this research report.
The majority of companies that Noble follows are emerging growth companies. Securities in these companies involve a higher degree of risk and more volatility than the securities of more established companies. The securities discussed in Noble research reports may not be suitable for some investors and as such, investors must take extra care and make their own determination of the appropriateness of an investment based upon risk tolerance, investment objectives and financial status.

Company Specific Disclosures

The following disclosures relate to relationships between Noble and the company (the “Company”) covered by the Noble Research Division and referred to in this research report.
Noble is not a market maker in any of the companies mentioned in this report. Noble intends to seek compensation for investment banking services and non-investment banking services (securities and non-securities related) with any or all of the companies mentioned in this report within the next 3 months

ANALYST CREDENTIALS, PROFESSIONAL DESIGNATIONS, AND EXPERIENCE

Senior Equity Analyst focusing on Basic Materials & Mining. 20 years of experience in equity research. BA in Business Administration from Westminster College. MBA with a Finance concentration from the University of Missouri. MA in International Affairs from Washington University in St. Louis.
Named WSJ ‘Best on the Street’ Analyst and Forbes/StarMine’s “Best Brokerage Analyst.”
FINRA licenses 7, 24, 63, 87

WARNING

This report is intended to provide general securities advice, and does not purport to make any recommendation that any securities transaction is appropriate for any recipient particular investment objectives, financial situation or particular needs. Prior to making any investment decision, recipients should assess, or seek advice from their advisors, on whether any relevant part of this report is appropriate to their individual circumstances. If a recipient was referred to Noble Capital Markets, Inc. by an investment advisor, that advisor may receive a benefit in respect of
transactions effected on the recipients behalf, details of which will be available on request in regard to a transaction that involves a personalized securities recommendation. Additional risks associated with the security mentioned in this report that might impede achievement of the target can be found in its initial report issued by Noble Capital Markets, Inc.. This report may not be reproduced, distributed or published for any purpose unless authorized by Noble Capital Markets, Inc..

RESEARCH ANALYST CERTIFICATION

Independence Of View
All views expressed in this report accurately reflect my personal views about the subject securities or issuers.

Receipt of Compensation
No part of my compensation was, is, or will be directly or indirectly related to any specific recommendations or views expressed in the public
appearance and/or research report.

Ownership and Material Conflicts of Interest
Neither I nor anybody in my household has a financial interest in the securities of the subject company or any other company mentioned in this report.

The Coming War Between AI Generated Spam and Junk Mail Filters

Image Credit: This is Engineering (Pexels)

AI-Generated Spam May Soon Be Flooding Your Inbox – It Will Be Personalized to Be Especially Persuasive

Each day, messages from Nigerian princes, peddlers of wonder drugs and promoters of can’t-miss investments choke email inboxes. Improvements to spam filters only seem to inspire new techniques to break through the protections.

Now, the arms race between spam blockers and spam senders is about to escalate with the emergence of a new weapon: generative artificial intelligence. With recent advances in AI made famous by ChatGPT, spammers could have new tools to evade filters, grab people’s attention and convince them to click, buy or give up personal information.

This article was republished with permission from The Conversation, a news site dedicated to sharing ideas from academic experts. It represents the research-based findings and thoughts of John Licato, Assistant Professor of Computer Science and Director of AMHR Lab, University of South Florida.

As director of the Advancing Human and Machine Reasoning lab at the University of South Florida, I research the intersection of artificial intelligence, natural language processing and human reasoning. I have studied how AI can learn the individual preferences, beliefs and personality quirks of people.

This can be used to better understand how to interact with people, help them learn or provide them with helpful suggestions. But this also means you should brace for smarter spam that knows your weak spots – and can use them against you.

Spam, Spam, Spam

So, what is spam?

Spam is defined as unsolicited commercial emails sent by an unknown entity. The term is sometimes extended to text messages, direct messages on social media and fake reviews on products. Spammers want to nudge you toward action: buying something, clicking on phishing links, installing malware or changing views.

Spam is profitable. One email blast can make US$1,000 in only a few hours, costing spammers only a few dollars – excluding initial setup. An online pharmaceutical spam campaign might generate around $7,000 per day.

Legitimate advertisers also want to nudge you to action – buying their products, taking their surveys, signing up for newsletters – but whereas a marketer email may link to an established company website and contain an unsubscribe option in accordance with federal regulations, a spam email may not.

Spammers also lack access to mailing lists that users signed up for. Instead, spammers utilize counter-intuitive strategies such as the “Nigerian prince” scam, in which a Nigerian prince claims to need your help to unlock an absurd amount of money, promising to reward you nicely. Savvy digital natives immediately dismiss such pleas, but the absurdity of the request may actually select for naïveté or advanced age, filtering for those most likely to fall for the scams.

Advances in AI, however, mean spammers might not have to rely on such hit-or-miss approaches. AI could allow them to target individuals and make their messages more persuasive based on easily accessible information, such as social media posts.

Future of Spam

Chances are you’ve heard about the advances in generative large language models like ChatGPT. The task these generative LLMs perform is deceptively simple: given a text sequence, predict which token – think of this as a part of a word – comes next. Then, predict which token comes after that. And so on, over and over.

Somehow, training on that task alone, when done with enough text on a large enough LLM, seems to be enough to imbue these models with the ability to perform surprisingly well on a lot of other tasks.

Multiple ways to use the technology have already emerged, showcasing the technology’s ability to quickly adapt to, and learn about, individuals. For example, LLMs can write full emails in your writing style, given only a few examples of how you write. And there’s the classic example – now over a decade old – of Target figuring out a customer was pregnant before her father knew.

Spammers and marketers alike would benefit from being able to predict more about individuals with less data. Given your LinkedIn page, a few posts and a profile image or two, LLM-armed spammers might make reasonably accurate guesses about your political leanings, marital status or life priorities.

Our research showed that LLMs could be used to predict which word an individual will say next with a degree of accuracy far surpassing other AI approaches, in a word-generation task called the semantic fluency task. We also showed that LLMs can take certain types of questions from tests of reasoning abilities and predict how people will respond to that question. This suggests that LLMs already have some knowledge of what typical human reasoning ability looks like.

If spammers make it past initial filters and get you to read an email, click a link or even engage in conversation, their ability to apply customized persuasion increases dramatically. Here again, LLMs can change the game. Early results suggest that LLMs can be used to argue persuasively on topics ranging from politics to public health policy.

Good for the Gander

AI, however, doesn’t favor one side or the other. Spam filters also should benefit from advances in AI, allowing them to erect new barriers to unwanted emails.

Spammers often try to trick filters with special characters, misspelled words or hidden text, relying on the human propensity to forgive small text anomalies – for example, “c1îck h.ere n0w.” But as AI gets better at understanding spam messages, filters could get better at identifying and blocking unwanted spam – and maybe even letting through wanted spam, such as marketing email you’ve explicitly signed up for. Imagine a filter that predicts whether you’d want to read an email before you even read it.

Despite growing concerns about AI – as evidenced by Tesla, SpaceX and Twitter CEO Elon Musk, Apple founder Steve Wozniak and other tech leaders calling for a pause in AI development – a lot of good could come from advances in the technology. AI can help us understand how weaknesses in human reasoning might be exploited by bad actors and come up with ways to counter malevolent activities.

All new technologies can result in both wonder and danger. The difference lies in who creates and controls the tools, and how they are used.

Why the IPO Market is Picking Up

Image Credit: Steve Jurvetson (Flickr)

IPO Market Accelerating – Especially Overseas

The amount of investment in initial public offerings (IPOs) during March-April has jumped from January-February levels. Globally, the pick-up in IPOs is linked to the uptick in stock prices, which has allowed companies to tap into investor appetite for newer listings. A sizeable percentage of the offerings are in Asia, but Europe and the U.S. have experienced a surge as well. Activity during the first two months of 2023 had ground to a halt; new data compiled by Bloomberg demonstrates a much faster trend.

To date, there has been $25 billion worth of IPOs worldwide in March and April; this is nearly twice the amount transacted during the prior two months of the year. Companies headquartered from Hong Kong to Milan have put up their “Going Public”  signs up as market volatility declined. The uptick in IPOs in Asia substantially moved the needle as non-U.S. exchanges accounted for nearly 80% of new share sales during April.

The uptick in Europe can’t be ignored either; European listings are higher by a wide margin compared to earlier in the year. The activity in the U.S. is not as robust but also noteworthy, as concern about a recession had been creating caution among potential U.S. issuers.

In a quote published by Bloomberg News, Jason Manketo global co-head of the law firm Linklaters’ equities practice said, “We are beginning to see green shoots of activity with companies restarting processes that were on hold, but there is still a fair degree of uncertainty in the market.” Mankel added, “The buy side is keen to see results for a couple of quarters before committing to an IPO. This means the potential pipeline of some 2023 deals has been moved out to 2024.”

Leaders

Statistically, Asia is where a great deal of the action is in the world today. But the activity is different, perhaps more appealing, than last year. In 2022 the vast majority of large deals were concentrated in mainland China; over the past two months, issuance is coming from a broader representation of Asia.

“The IPO market is coming back gradually and slowly. It is not 100% back yet, but there are signs of life and renewed vigor,” said James Wang, co-head of equity capital markets at Goldman Sachs Group Inc. in Asia ex-Japan.

A couple of nickel producers from Indonesia surged as they went public. And in Japan, as part of the country’s largest IPO since 2018,  Rakuten Bank Ltd. soared after it raised 83.3 billion yen ($623 million). And KKR & Co.-backed Chinese liquor company ZJLD Group Inc. as recently as April 20th, priced Hong Kong’s largest offering in 2023.

Europe Wakes Up

Europe’s IPO market had been dragging, with activity in 2023 down about 12% from the same period last year as Russia’s invasion of Ukraine brought new listings to a screeching halt.

Also weighing on the market, poor IPO returns have been a deterrent for investors. Portfolio managers had been in the drivers seat insisting on bargains for less proven companies. In  March the sudden meltdown of financial firm Credit Suisse, ignited a global market rout, this added to investor worries about interest rates and inflation; the event also made it less attractive for companies to try and attract a favorable price.

But there are growing signs of fear lifting. Most notably, Lottomatica SpA, the Italian gambling company backed by Apollo Global Management Inc., opened the books last week for a €600 million ($657 million) IPO, becoming the third large firm to tap European exchanges this year. Additionally, German web-hosting company Ionos SE and electric motor component maker EuroGroup Laminations SpA have managed to raise more than $400 million in the region, though both stocks have struggled after debuting.

U.S. Uptick

While IPO activity in the U.S. is not as robust, there has been a huge uptick as well. The IPO calendar for U.S. exchanges shows 20 priced deals totalling $751.5 billion, and 29 new filings. This is an acceleration after only $4.1 billion had been raised for companies listing on U.S. exchanges during the first two months of 2023.

Take Away

Globally companies are finding it more worthwhile to tap capital from the equity markets via IPO. While the most growth is greater Asia, Europe and the U.S. see a significant uptick as well. Whether this trend continues and represents, a buying opportunity seems to hinge on recession concerns. Many forecasters are now calling for a much more mild recession than previously expected.

Paul Hoffman

Managing Editor, Channelchek

Sources:

https://www.bloomberg.com/news/articles/2023-04-23/ipo-market-shows-signs-of-life-even-as-recession-fears-persist?srnd=markets-vp&sref=8GWybyo5&leadSource=uverify%20wall

https://www.nasdaq.com/market-activity/ipos

https://www.bloomberg.com/profile/company/LTT:IM

Noble Capital Markets Media Sector Review – Q1 2023

INTERNET AND DIGITAL MEDIA COMMENTARY

A Focus on Profitability Drives A Strong Start to the Year 

Last quarter we wrote that the S&P 500 increased for the first time since the fourth quarter of 2021 and that we were beginning to see signs of life in Noble’s Internet and Digital Media Indices as well.  Those signs of life continued to bear fruit throughout the first quarter, as every one of Noble’s Internet and Digital Media Indices not only finished the quarter up, but significantly outperformed the S&P 500.  The best performing index was Noble’s Social Media Index, which increased by 70% in the first quarter of 2023, followed by Noble’s eSports & iGaming Index (+32%), Ad Tech Index (+31%), MarTech Index (+30%), and  Digital Media Index (+18%).

Noble’s Indices are market cap weighted, and we attribute the strength of the Social Media Index to its largest constituent, Meta Platforms (META; a.k.a. Facebook) whose shares increased by 76% in the first quarter. We attribute this increase to management’s 4Q 2022 earnings call when they spent most of their time talking about “efficiency”, which investors interpreted to mean that Meta was newly focused on profitability. After a relatively disastrous 3Q 2022 earnings call, after which shares fell by 25%, the company demonstrated on its 4Q 2022 earnings call that it clearly had

gotten the message:  investors were not enamored about the company’s plans in October 2022 to spend billions of dollars to develop its Metaverse initiatives. Rather, on its fourth quarter call, management focused on driving its short form video initiative Reels (i.e., becoming more TikTok like), reducing its headcount by reducing layers of management, lowering its operating expenses and reducing its capital expenditures.  Investors applauded this newfound focus on profitability and shares rebounded from a low of $88.90 per share in early November to $211.94 at the March quarter-end.   

Noble’s eSports and iGaming Index increased by 32% as 9 of the 16 stocks in the index posted gains, the two largest market cap weighted stocks. Shares of the largest stock in the index, Flutter Entertainment (FLTR) increased by 31%) while shares of the second largest stock in the index, DraftKings (DKNG) increased by 70%.  Flutter’s improvement is likely due to an improved inflection point in the company’s U.S. operations which include its FanDuel operations.  DraftKings also beat revenue and EBITDA expectations in 4Q 2022 and appears to be proving out its path to profitability.  In both cases, investors are rewarding companies who are accelerating their path to profitability. 

The next best performing index was Noble’s Ad Tech Index which increased by 31% during 1Q 2023.  Fourteen of the 23 stocks in the index were up in the first quarter.  Standouts during the quarter were Integral Ad Science (IAS; +62%) and Perion Networks (PERI; +56%).  Integral Ad Science exceeded expectations in its fourth quarter results and guided to better-than-expected results in 1Q 2023.  The company continues to expand its product suite, scale its social media offerings (i.e., for TikTok) and is well positioned to continue to benefit from the shift from linear TV to connected TV (CTV).  Perion shares continued their winning streak:  Perion was the only ad tech stock whose shares were up in 2022.  Perion’s 56% increase in 1Q 2023 reflected beat on both revenues (by 2%) and EBITDA (by 10%) as well as improved guidance for 1Q 2023.  Perion’s profitability increased significantly in 2022, with EBITDA nearly doubling (+90%) from $70 million in 2021 to $132 million in 2022.

Noble’s MarTech Index increased by 30% with 14 of the 22 stocks in the index posting increases in 1Q 2023.  The best performing stocks were Qualtrics (XM; +70%) Sprinklr (CXM; +59%), Salesforce (CRM; +51%), Hubspot (HUBS; +48%) and Yext (YEXT; +47%).  Qualtrics agreed to be acquired for $12.5 billion by Silver Lake and the Canadian Pension Plan Investment Board, which came at a 73% premium to its 30-day volume weighted stock price.  Sprinklr beat revenue expectations and significantly beat EBITDA expectations (doubling the Street expectations) and guided to a current year forecast that focuses more on efficiency and profitability.  MarTech stocks have been victims of their own success.  Two years ago at this time the sector was trading at 11.3x forward revenue estimates, and a year ago the group was trading at 6.5x forward revenues.  Today the group trades at 4.1x forward revenues and investors appear to be wading back into the sector.

Finally, Noble’s Digital Media Index, while lagging that of its digital peers posted an 18% increase and significantly outperformed the S&P 500 (+7%) with a broad based recovery in which 9 of the sector’s 11 stocks increase during 1Q 2023.  The best performing stock was Spotify (SPOT; +69%), whose revenues fell short of expectations by less than 1%, significantly beat consensus Street EBITDA expectations by $58M and more importantly pivoted towards demonstrating operating leverage.  Spotify, which posted an EBITDA loss of nearly $500 million 2022 is expected to generate $650 million in EBITDA in 2024, according Street estimates.  A deteriorating ad market 2022 combined with higher interest rates likely prompted the company to shift its priorities to running a profitable company and doing it more quickly.  The second best performing stock was Travelzoo (TZOO; +36%), as the company’s 4Q 2022 revenues and EBITDA increased by 31% and 328%, respectively.  Notably, Travelzoo’s EBITDA came in 58% higher than Street consensus.  The company appears to be benefiting from pent up demand for travel and management highlighted the opportunity for margin expansion in the coming quarters

Sluggish M&A Market Carries Over into 2023

Last quarter we remarked that M&A deals in the Internet and Digital Media sector had held up well through the first three quarters of 2022 despite economic headwinds.  However, the number of deals slowed in 4Q 2022 (by 17%) and total deal value fell dramatically (by 70%).  The slowdown carried over into 1Q 2023.  According to Dealogic, Global M&A fell by 48% to $575 billion in 1Q 2023 compared to $1.1 trillion in 1Q 2022.  Global M&A dollar values fell to their lowest level in a decade.  In the U.S., deal values fell by 44% to $283 billion from $176 billion in 1Q 2022. 

The M&A market had weathered stock price declines, Fed rate hikes, elevated inflation, and geopolitical conflict in 2022.  In 1Q 2023, to this “recession that never comes” economic environment we added increased volatility and uncertainty caused by banking failures.  One of the biggest impediments to deals is debt financing.  Private equity firms have had to write larger check in lieu of a robust debt financing market.  Banks have been less willing to provide financing because some have had to hold loans on their balance sheet or take losses when selling debt to investors while smaller regional banks have seen deposits flee to larger banks, especially those considered too big to fail. 

Finally, increased antitrust scrutiny likely has played a role in the M&A deal slowdown.  Lengthy merger reviews resulted in three public transactions being blocked by regulators:  Standard General’s acquisition of Tegna; JetBlue’s acquisition of Spirit Airlines, and Intercontinental Exchange’s acquisition of Black Knight, Inc. 

1Q 2023 Internet and Digital Media M&A:  A Dearth of Large Deals

Based on Noble’s analysis, deal making in the first quarter of 2023 in the Internet and Digital Media sectors actually increased by 11% compared to 1Q 2022.  The total number of deals we tracked in the Internet and Digital Media space increased to 202 deals in 1Q 2023 compared to 182 deals in 1Q 2022.  On a sequential basis, the total number of deals increased by 39% compared to 145 deals in 4Q 2022.  The only explanation we can provide for this is that with the expectation that an economic slowdown was pending, many companies likely made the decision to sell in mid-2022, with the deals being announced in 1Q 2023.

The biggest change was in the first quarter’s M&A deal value, where the total dollar value of deals fell by 95% to $5.4 billion of announced deals in 1Q 2023 compared to $108.5 billion in announced deals in 1Q 2022.  On a sequential basis, deal value fell by 40% from $9.1 billion in deal value in 4Q 2022.

From a deal volume perspective, the most active sectors we tracked were Digital Content (59 deals), Agency & Analytics (51 deals), and MarTech (39), followed by Information Services (17 deals), Ad Tech (11 deals) and eCommerce sectors (10 deals).  From a dollar value perspective, MarTech led the way with $1.6 billion in transactions, followed by Information Services ($1.4 billion), Digital Content ($922 million) and Agency and Analytics ($875 million).  The largest deals in the quarter by dollar value are shown below.    

Notably, there were no mega deals ($10B+) in the first quarter of 2023, compared to the first quarter of 2022 when Microsoft agreed to by Activision Blizzard for $68 billion and Take-Two Interactive agreed to acquire Zynga for $12 billion.  Once the Fed stops hiking rates and visibility into operating trends returns, we may begin to see an environment in which mega deals will be contemplated again. 

TRADITIONAL MEDIA COMMENTARY

The following is an excerpt from a recent note by Noble’s Media Equity Research Analyst Michael Kupinski

The NAB Show Stopper

Media investors are unpacking all of information from last week’s National Association of Broadcasters (NAB) convention. There is a lot to digest given that there were over 1,400 exhibits, and 140 new exhibitors this year. Because of the overwhelming number of exhibitors, many that go to Vegas for this annual convention do not go to the convention floor. It is a shame. There is a lot to see and learn. Noble’s Media & Entertainment Analyst Michael Kupinski walked the convention floor, which covers 4.6 million square feet of exhibit halls and meeting rooms. He stopped by booths and taped presentations to explain the new technologies, the plan for implementation of new services, and the prospect for revenue monetization. One important demonstration focused on the new broadcast standard, ATSC 3.0, the hope for a bright future for the television industry. This new standard should allow the industry to become more contemporary in terms of how its audience consumes video and information. In addition, it offers the ability for the industry to participate in new revenue streams, including datacasting, which may become bigger than Retransmission revenue in the future. 

In addition to touring the floor, he participated in NAB panel discussions and hosted meetings with media management teams in a fireside chat format to discuss current business trends, the new technologies (including Artificial Intelligence (AI)) and the new broadcast standard. In addition, these C-suite management teams provided their key takeaways from the NAB convention and offered why they participated in the conference this year. These discussions will be available for free to Channelchek users on Channelchek.com on April 27th as a virtual conference. In this upcoming Channelchek Takeaway Series on the NAB Show, Michael offers his key takeaways, including the current advertising outlook, his take on the monetization of the new technologies and what media investors should do now given the current economic and advertising environment. Free registration to this informative event is available here

This report highlights the performance of the media sectors over the past 12 months and past quarter. Overall, media stocks struggled in the past year, but there has been some improved quarterly performance, particularly in Digital Media and Broadcast Television, discussed later. All media stocks are struggling to offset losses over the course of the past year with trailing 12 months stocks down in the range of 5% on the low end to as high as down 68%.

In the first quarter, stock performance was mixed. The best performers in the traditional media sectors were Broadcast Television stocks, up nearly 10% versus the general market which increased 7% in the comparable period. However, the individual TV stock performance reflected a different story, explained later in this report. The worse performer for the quarter were the radio stocks, driven by a Wall Street downgrade of one of the leading radio broadcasters. We believe that stock performance will be a roller coaster for at least another quarter or two as the weight of the Fed rate increases begin to adversely affect the economy.

While national advertising has remained weak, we believe that local advertising is now beginning to moderate as well. The local advertising weakness appears to be in the smaller markets as well as the larger markets. This is somewhat different than the most recent economic cycles whereby the smaller markets were somewhat resilient. It seems that the smaller markets are feeling the adverse affects from inflation, rising employment costs and tightening bank credit. In our view, the disappointing advertising outlook likely will cause second quarter revenue estimates to come down, creating a difficult environment for media stocks.

Broadcast Television

Weak Current Revenue Trends 

TV stocks outperformed the general market in the first quarter. This market cap weighted index masked the performance of many poor performing stocks in the quarter.  Sinclair Broadcasting (up 10%), Entravision (up a strong 26%), and Fox (up 12%) were the best performing stocks and favorably influenced the TV index in the quarter. But, there were many poor performing stocks including E.W. Scripps (down 29%), Gray Television (down 22%) and Tegna (down 20%). We believe that there was heightened interest in Entravision given its favorable Q1 results which was fueled by its fast growing digital advertising business. Entravision’s Q4 revenue performance was among the best in the industry. While Entravision was among the best revenue performer, its margins are below that of its peer group  EBITDA Margins. This is due to the accounting treatment of its digital revenues given that it is an agency business.. The poorer performing stocks are among the higher debt levered in the industry. The underperformance reflects concern of a slowing economy and investors flight to quality in the sector. 

We do not believe that we are out of the woods with the TV stocks and the market is expected to be volatile. The advertising environment appears to be deteriorating given weakening economic conditions. There are bright spots which include some improvement in the Auto category. Dealerships appear to be stepping up advertising given higher inventory levels. In addition, broadcasters appear optimistic about political advertising, which could begin in the third quarter 2023. There is a planned Republican presidential candidate debate schedule in August. There is some promise that candidates will advertise in advance of that debate and into the fourth quarter given the early primary season. We do not believe that political and auto will be enough to offset the weakness in national and  Local advertising. In our view, Q2 and full year 2023 estimates are likely to come down. Furthermore, we believe that broadcasters will be shy about predicting political advertising even into 2024 given the past disappointments in management forecasts in the last political cycle. 

Broadcast Radio

All Out of Love

Radio stocks had another tough quarter, down 17% versus a 7% gain for the general market. Notably, there was a wide variance in the individual stock performance, with the largest stocks in the group having the worst performance in the quarter, including Audacy (AUD down 40%), Cumulus Media (CMLS down 41%) and iHeart Media (IHRT down 36%). The first quarter stock performance did not appear to reflect the fourth quarter results, during which  revenues were relatively okay, with some exceptions. Some of the larger radio companies which have a large percentage of national advertising, underperformed relative to the more diversified radio companies, especially those with a strong digital segment presence. Margins for the industry remain relatively healthy. 

The weakness in the Radio stocks was fueled in the quarter from a downgrade to Underperform on the shares of iHeart by a Wall Street firm. Many radio stocks were down in sympathy. The analyst attributed the downgrade to the current macro environment and its heavy floating rate debt burden. The company is not expected to generate enough free cash flow to de-lever its balance sheet. We believe the downgrade as well as the excessive debt profile of Audacy, another industry leader which likely will need to restructure, sent all radio stocks tumbling. Some stocks performed better than others. While Cumulus Media’s debt profile is not as levered as iHeart or Audacy, the shares were caught in the net of a weak advertising outlook. Cumulus is among the most sensitive to national advertising, which currently continues to be weak. 

Some of our favorite stocks which are diversified and have developing digital businesses performed better. Those stocks included Townsquare Media (TSQ, up 10%), and Salem Media (SALM, up 4%). Notably, while the shares of Beasley Broadcasting (BBGI) were down 10%, the shares performed better than the 17% decline for the industry in the quarter. Importantly, Beasley recently provided favorable updated Q1 guidance for the first quarter. Q1 revenues are expected to increase 1% to 2.5% and EBITDA growth is expected to be in the range of 40% to 50%, significantly better than our estimates. Furthermore, management provided a sanguine outlook for 2023 and 2024. Digital revenue is expected to reach 20% to 30% of total revenue with a goal of reaching 40% in 2024. By comparison, digital revenue was 17% of total revenue in the fourth quarter 2022. Furthermore, the company is sitting on roughly $35 million in cash. It has opportunistically repurchased $10 million of its bonds at a significant discount. We believe that it is likely to maintain a strong cash position given the economic uncertainty. 

Townsquare Media (TSQ), Salem Media (SALM) and Beasley Broadcast (BBGI) are all diversifying their revenue streams. While these companies are not immune to the economic headwinds, we believe theirdigital businesses should offer some ballast to its more sensitive Radio business. In the case of Salem, 30% of its revenues are relatively stable with block programming.

Publishing

After a period of moderating revenue trends, publishers reported a weakened advertising environment. Revenue trends deteriorated with print advertising taking a nose dive. This trend was illustrative in the results from Lee Enterprises. After a fiscal fourth quarter flat revenue performance, the company reported a 8.5% decline in its fiscal first quarter. The Q1 revenue performance reflected an 18.5% decrease in print advertising, an acceleration in the rate of the 11% decline in the previous quarter. 

The surprisingly weak quarter hit the company’s adj. EBITDA margins. Traditionally, Lee maintained some of the best margins in the industry., but the company fell in ranking to among the lowest in the sector. Importantly, in spite of the revenue weakness, the company maintained its previous adj. EBITDA guidance of $94 million to $100 million for F2023. To achieve its cash flow target in light of the soft revenue outlook, Lee implemented a round of expense cuts to bolster cash flow. Cost reductions are expected to result in $40 million of savings in FY 23, and $60 million in annualized savings going forward. While the company’s print business declined more than expected , the company’s digital businesses remains favorably robust. In addition, its digital business is turning toward contributing margins; another step in the company’s digital evolution.

DOWNLOAD THE FULL REPORT (PDF)

View the PDF version for segment analysis, M&A activity, and more…

Noble Capital Markets Media Newsletter Q1 2023

This newsletter was prepared and provided by Noble Capital Markets, Inc. For any questions and/or requests regarding this news letter, please contact Chris Ensley

DISCLAIMER

All statements or opinions contained herein that include the words “ we”,“ or “ are solely the responsibility of NOBLE Capital Markets, Inc and do not necessarily reflect statements or opinions expressed by any person or party affiliated with companies mentioned in this report Any opinions expressed herein are subject to change without notice All information provided herein is based on public and non public information believed to be accurate and reliable, but is not necessarily complete and cannot be guaranteed No judgment is hereby expressed or should be implied as to the suitability of any security described herein for any specific investor or any specific investment portfolio The decision to undertake any investment regarding the security mentioned herein should be made by each reader of this publication based on their own appraisal of the implications and risks of such decision This publication is intended for information purposes only and shall not constitute an offer to buy/ sell or the solicitation of an offer to buy/sell any security mentioned in this report, nor shall there be any sale of the security herein in any state or domicile in which said offer, solicitation or sale would be unlawful prior to registration or qualification under the securities laws of any such state or domicile This publication and all information, comments, statements or opinions contained or expressed herein are applicable only as of the date of this publication and subject to change without prior notice Past performance is not indicative of future results.

Please refer to the above PDF for a complete list of disclaimers pertaining to this newsletter

Release – CVG Announces First Quarter 2023 Earnings Call

Research News and Market Data on CVGI

APRIL, 21, 2023

NEW ALBANY, Ohio, April 21, 2023 (GLOBE NEWSWIRE) — CVG (NASDAQ: CVGI) will hold its quarterly conference call on Wednesday, May 3, 2023, at 10:00 a.m. ET, to discuss first quarter 2023 financial results. CVG will issue a press release and presentation prior to the conference call.

Toll-free participants dial (888) 886-7786 using conference code 74688048. International participants dial (416) 764-8658 using conference code 74688048. This call is being webcast and can be accessed through the “Investors” section of CVG’s website at ir.cvgrp.com where it will be archived for one year.

A telephonic replay of the conference call will be available until May 17, 2023. To access the replay, toll-free callers can dial (877) 674-7070 using access code 688048.

About CVG

At CVG, we deliver real solutions to complex design, engineering and manufacturing problems while creating positive change for our customers, industries, and communities we serve. Information about the Company and its products is available on the internet at www.cvgrp.com.

Investor Relations Contact:
Ross Collins or Stephen Poe
Alpha IR Group
CVGI@alpha-ir.com

Source: Commercial Vehicle Group, Inc.

Release – ACCO Brands Corporation Announces First Quarter 2023 Earnings Webcast

Research News and Market Data on ACCO

04/21/2023

LAKE ZURICH, Ill.–(BUSINESS WIRE)– ACCO Brands Corporation (NYSE: ACCO) today announced that it will release its first quarter 2023 earnings after the market close on May 4, 2023. The Company will host a conference call and webcast to discuss the results on May 5 at 8:30 a.m. EST. The webcast can be accessed through the Investor Relations section of www.accobrands.com and will be available for replay.

About ACCO Brands Corporation

ACCO Brands, the Home of Great Brands Built by Great People, designs, manufactures and markets consumer and end-user products that help people work, learn, play and thrive. Our widely recognized brands include AT-A-GLANCE®, Five Star®, Kensington®, Leitz®, Mead®, PowerA®, Swingline®, Tilibra® and many others. More information about ACCO Brands Corporation (NYSE: ACCO) can be found at www.accobrands.com.

Christopher McGinnis
Investor Relations
(847) 796-4320

Julie McEwan
Media Relations
(937) 974-8162

Source: ACCO Brands Corporation

Labrador Gold Corp. (NKOSF) – Growing in Size and Mineral Potential


Friday, April 21, 2023

Mark Reichman, Managing Director, Natural Resources Analyst, Noble Capital Markets, Inc.

Refer to the full report for the price target, fundamental analysis, and rating.

Big Vein strike length extended to 722 meters. Labrador Gold released results from five drill holes at the Big Vein target within the company’s 100%-owned Kingsway project. Step out drilling to the northeast and southwest continue to intersect gold mineralization at Big Vein which has now been extended to 722 meters in strike length and remains open in both directions. Hole K-23-216 intersected 3.69 grams of gold per tonne over 2.97 meters from 389.41 meters including 12.05 grams of gold per tonne over 0.59 meters, while Hole K-23-218 returned 1.95 grams of gold per tonne over 9 meters including 8.97 grams of gold per tonne over 1.6 meters. Hole K-23-225, a 100-meter step-out to the northeast intersected 1 gram of gold per tonne over 10.1 meters from 46.9 meters, that included an interval of 2.28 grams of gold per tonne over 2.26 meters containing visible gold.

Discovery of a new mineralized zone. Hole K-22-214B returned 5.22 grams of gold per tonne over 2.80 meters from 418.6 meters that included 22.02 grams of gold per tonne over 0.4 meters, along with 8.62 grams of gold per tonne over 0.7 meters from 496 meters. Both it and Hole K-22-214 are associated with a new mineralized zone, the Greenmantle Zone, that lies below the HTC Zone at a vertical depth of 415 meters. The discovery of the Greenmantle zone demonstrates the potential for continued mineralization at depth.


Get the Full Report

Equity Research is available at no cost to Registered users of Channelchek. Not a Member? Click ‘Join’ to join the Channelchek Community. There is no cost to register, and we never collect credit card information.

This Company Sponsored Research is provided by Noble Capital Markets, Inc., a FINRA and S.E.C. registered broker-dealer (B/D).

*Analyst certification and important disclosures included in the full report. NOTE: investment decisions should not be based upon the content of this research summary. Proper due diligence is required before making any investment decision. 

Hemisphere Energy Corporation (HMENF) – Hemisphere completed year full of growth


Friday, April 21, 2023

Michael Heim, Senior Energy & Transportation Analyst, Noble Capital Markets, Inc.

Refer to the full report for the price target, fundamental analysis, and rating.

Results demonstrate strong production growth and a sharp increase in cash flow and earnings. Production rates (preannounced) increased 55%. Increased production was partially offset by a drop in energy prices. Lower-than-expected prices were partially offset by a decrease in royalty rates. Production costs (excluding transportation costs) remain somewhat elevated as they were in the September quarter. We look for production costs per barrel to decrease modestly as new production comes on line in 2023.

As netbacks rose, so did the company’s Adjusted Fund Flow (AFF). The margin between prices and costs is high. Operating netbacks (realized prices less royalties and operating costs) is leading to strong cash flow which management is turning their focus toward returning to shareholders now that debt is virtually eliminated and drilling programs have been accelerated.


Get the Full Report

Equity Research is available at no cost to Registered users of Channelchek. Not a Member? Click ‘Join’ to join the Channelchek Community. There is no cost to register, and we never collect credit card information.

This Company Sponsored Research is provided by Noble Capital Markets, Inc., a FINRA and S.E.C. registered broker-dealer (B/D).

*Analyst certification and important disclosures included in the full report. NOTE: investment decisions should not be based upon the content of this research summary. Proper due diligence is required before making any investment decision. 

Russell Reconstitution 2023, What Investors Should Know

Image Credit: SL (Noble Capital Mkts)

 The Annual Russell Index Revision and Dates to Watch (2023)

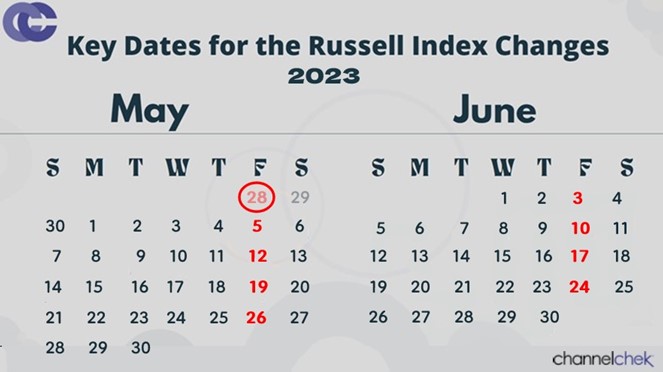
The yearly process of recasting the Russell Indexes begins on Friday April 28 and will be complete by market opening on June 26. During the period in between, FTSE Russell will rank stocks for additions, for deletions and evaluate the companies to make sure they conform overall. The methodology for inserting and removing tickers in the Russell 3000, Russell 2000, and Russell 1000 is intentionally transparent to help eliminate price shocks. Price movements do of course occur along the way, and investors try to foresee and capitalize on them. Channelchek will be providing updates that may uncover opportunities, or at least provide an understanding of stock price swings during this period.

Background

Russell index products are widely used by institutional and retail investors throughout the world. There is more than $20.1 trillion currently benchmarked to a Russell index. This includes approximately $12.1 trillion benchmarked to the Russell US Equity indexes. The trading volume of some companies moving into an index will heighten around the last Friday in June as fund managers seek to maintain level tracking with their benchmark target.

Opportunity

For non-passive investing, determining which stocks may benefit from moving up to a large-cap index, down to a smaller one, or into or out of the measurements is an annual event causing volatility around stocks. There has, of course, the potential for very profitable long and short trades. And the potential for an unwitting investor to be holding a company moving out of an index, which could cause less interest in the stock, and perhaps unfortunate performance.

Active investors should make themselves aware of the forces at play so they may either get out of the way or determine if they should become involved by taking positions with those being added or those at the end of their reign within one of the Russell measurements.

Dramatic Valuation Shifts

The leading industries and altered market-cap of companies of a year ago have changed dramatically from last year’s reconstitution. This will be reflected in the 2023 rebalancing and is going to impact a much larger number of companies than most years. That is to say, a higher percentage of companies than normal will move in, out, or to another index, and may be subject to amplified price movement.

The 2023 Russell Reconstitution Schedule:

• Friday, April 28 – “Rank Day” – Index membership eligibility for 2023 Russell Reconstitution determined from constituent market capitalization at market close.

• Friday, May 19 – Preliminary index additions & deletions membership lists posted to the FTSE Russell website after 6 PM US eastern time.

•   Friday, May 26th, June 2nd, 9th and 16th – Preliminary membership lists (reflecting any updates) posted to the FTSE Russell website after 6 PM US eastern time.

• Monday, June 5th – “Lock-down” period begins with the updates to reconstitution membership considered to be final.

• Friday, June 24 – Russell Reconstitution is final after the close of the US equity markets.

• Monday, June 27 – Equity markets open with the newly reconstituted Russell US Indexes.

Take-Away

The annual reconstitution is a significant driver of dramatic shifts in some stock prices as portfolio managers have their holding needs shifted within a very short period of time. Longer-term demand for certain equities is altered as well. Sizable price movements and volatility are expected, especially around the last week in June. In fact, the opening day of the reconstitution is typically one of the highest trading-volume days of the year in the US equity markets.

The market event impacts more than $9 trillion of investor assets benchmarked to or invested in products based on the Russell US Indexes. Portfolio managers that are required to track one of these indexes will work to have minimal portfolio slippage away from their benchmark.  The days and weeks from April 28 through the last Monday in June can create opportunities for investors seeking to benefit from price moves, Channelchek will be covering the event as stocks to be added to, or removed from this year’s Russell Reconstitution and other information plays out.

Be sure to register to receive Channelchek updates and information.

Paul Hoffman

Managing Editor, Channelchek

Release – 1-800-FLOWERS.COM, Inc. to Release Results for its Fiscal 2023 Third Quarter on Thursday, May 11, 2023

Research News and Market Data on FLWS

Apr 20, 2023

JERICHO, N.Y.–(BUSINESS WIRE)– 1-800-FLOWERS.COM, Inc. (NASDAQ: FLWS) (the “Company”),a leading provider of gifts designed to help inspire customers to give more, connect more, and build more and better relationships, today announced that the Company will release financial results for its fiscal 2023 third quarter on Thursday, May 11, 2023. The press release will be issued prior to market opening and will be followed by a conference call with members of senior management at 8:00 a.m. (ET).

The conference call will be available via live webcast from the Investors section of the Company’s website at 1800flowersinc.com. A recording of the call will be posted on the website within two hours of the call’s completion. A telephonic replay of the call can be accessed beginning at 2:00 p.m. (ET) on May 11, 2023, through May 18, 2023, at: (US) 1-877-344-7529; (Canada) 855-669-9658; (International) 1-412-317-0088; enter conference ID: #4785326.

Special Note Regarding Forward-Looking Statements:

Some of the statements contained in the Company’s scheduled Thursday, May 11, 2023, press release and conference call regarding its results for its fiscal 2023 third quarter, other than statements of historical fact, may be forward-looking within the meaning of the Private Securities Litigation Reform Act of 1995. These statements involve risks and uncertainties that could cause actual results to differ materially from those expressed or implied in the applicable statements. For a more detailed description of these and other risk factors, please refer to the Company’s SEC filings including its Annual Reports and Forms 10K and 10Q available at the Investor Relations section of the Company’s website at 1800flowersinc.com. The Company expressly disclaims any intent or obligation to update any of the forward-looking statements made in the scheduled conference call and any recordings thereof, or in any of its SEC filings, except as may be otherwise stated by the Company.

About 1-800-FLOWERS.COM, Inc.

1-800-FLOWERS.COM, Inc. is a leading provider of gifts designed to help inspire customers to give more, connect more, and build more and better relationships. The Company’s e-commerce business platform features an all-star family of brands, including: 1-800-Flowers.com®, 1-800-Baskets.com®, Cheryl’s Cookies®, Harry & David®, PersonalizationMall.com®, Shari’s Berries®, FruitBouquets.com®, Things Remembered®, Moose Munch®, The Popcorn Factory®, Wolferman’s Bakery®, Vital Choice®, Stock Yards® and Simply Chocolate®. Through the Celebrations Passport® loyalty program, which provides members with free standard shipping and no service charge across our portfolio of brands, 1-800-FLOWERS.COM, Inc. strives to deepen relationships with customers. The Company also operates BloomNet®, an international floral and gift industry service provider offering a broad-range of products and services designed to help members grow their businesses profitably; Napco℠, a resource for floral gifts and seasonal décor; DesignPac Gifts, LLC, a manufacturer of gift baskets and towers; and Alice’s Table®, a lifestyle business offering fully digital livestreaming and on demand floral, culinary and other experiences to guests across the country. 1-800-FLOWERS.COM, Inc. was recognized among the top 5 on the National Retail Federation’s 2021 Hot 25 Retailers list, which ranks the nation’s fastest-growing retail companies, and was named to the Fortune 1000 list in 2022. Shares in 1-800-FLOWERS.COM, Inc. are traded on the NASDAQ Global Select Market, ticker symbol: FLWS. For more information, visit 1800flowersinc.com or follow @1800FLOWERSInc on Twitter.

FLWS-COMP
FLWS-FN

Investor:

Andy Milevoj

(516) 237-4617

amilevoj@1800flowers.com


Media:

Cherie Gallarello

cgallarello@1800flowers.com

Source: 1-800-FLOWERS.COM, Inc.

Release – Direct Digital Holdings to Report First Quarter 2023 Financial Results

Research News and Market Data on DRCT

April 20, 2023 9:00am EDTDownload as PDF

HOUSTON, April 20, 2023 /PRNewswire/ — Direct Digital Holdings, Inc. (Nasdaq: DRCT) (“Direct Digital Holdings” or the “Company”), a leading advertising and marketing technology platform operating through its companies Colossus Media, LLC (“Colossus SSP”), Huddled Masses LLC (“Huddled Masses”) and Orange142, LLC (“Orange142”), today announced that the Company will report financial results for the first quarter of fiscal year 2023 ended March 31, 2023 on Thursday, May 11, 2023 after the U.S. stock market closes. Management will host a conference call and webcast on the same day at 5:00 PM ET to discuss the results.

The live webcast and replay can be accessed at https://ir.directdigitalholdings.com/.

About Direct Digital Holdings
Direct Digital Holdings (Nasdaq: DRCT), owner of operating companies Colossus SSP, Huddled Masses, and Orange 142, brings state-of-the-art sell- and buy-side advertising platforms together under one umbrella company. Direct Digital Holdings’ sell-side platform, Colossus SSP, offers advertisers of all sizes extensive reach within general market and multicultural media properties. The company’s subsidiaries Huddled Masses and Orange142 deliver significant ROI for middle market advertisers by providing data-optimized programmatic solutions at scale for businesses in sectors that range from energy to healthcare to travel to financial services. Direct Digital Holdings’ sell- and buy-side solutions manage over 100,000 clients monthly, generating over 100 billion impressions per month across display, CTV, in-app and other media channels. Direct Digital Holdings is the ninth black-owned company to go public in the U.S and was named a top minority-owned business by The Houston Business Journal.

View original content to download multimedia:https://www.prnewswire.com/news-releases/direct-digital-holdings-to-report-first-quarter-2023-financial-results-301802480.html

SOURCE Direct Digital Holdings

Released April 20, 2023

Release – Labrador Gold Intersects 5.22g/t Au Over 2.8M Including 22.02g/t Over 0.4M

Research News and Market Data on NKOSF

Extends Big Vein to 722 Metres Strike Length

April 20, 2023 08:00 ET

TORONTO, April 20, 2023 (GLOBE NEWSWIRE) — Labrador Gold Corp. (TSX.V:LAB | OTCQX:NKOSF | FNR: 2N6) (“LabGold” or the “Company”) is pleased to announce results from recent drilling targeting the highly prospective Appleton Fault Zone. The drilling is part of the Company’s ongoing 100,000 metre diamond drilling program at its 100% owned Kingsway Project.

Highlights of the drilling include an intersection of 5.22g/t Au over 2.80 metres from 418.6 metres that included 22.02g/t Au over 0.4 metres in Hole K-22-214B which also included 8.62 g/t Au over 0.7 metres from 496 metres. This hole was a wedge off Hole K-22-214 that was previously abandoned in mineralization at 486 metres due to excessive fracturing after intersecting 1.19g/t Au over 41.8 metres from 397 metres that included 2.32g/t Au over 18.6 metres including 61.15g/t Au over 0.3 metres (see news release dated March 2, 2023). Thes two holes form part of a new mineralized zone, the Greenmantle Zone, that lies below the HTC Zone at a vertical depth of 415 metres.

Hole K-23-225, a 100m step out to the northeast intersected 1g/t Au over 10.1 metres from 46.9 metres, that included an interval of 2.28g/t over 2.26 metres containing visible gold.

The Big Vein SW zone was extended a further 60 metres to the southwest with intersections of 3.69g/t Au over 2.97 metres from 389.41 metres including 12.05g/t Au over 0.59 metres in Hole K-23-216 and 1.95g/t Au over 9 metres including 8.97g/t Au over 1.6 metres in Hole K-23-218.

“Our aggressive step outs to the northeast and southwest continue to intersect gold mineralization at Big Vein which has now been extended to 722 metres in strike length and remains open in both directions. In addition, the discovery of the Greenmantle zone demonstrates the potential for continued mineralization at depth,” said Roger Moss, President and CEO of Labrador Gold Corp. “Recent 3D modelling has given us a much better understanding of the structural complexity and controls on gold distribution at Big Vein. Mineralization is closely associated with splays off the Appleton Fault Zone which we now believe to run through Big Vein. This interpretation will guide our drilling as we seek to continue to expand Big Vein along strike and at depth.”

Hole IDFrom (m)To (m)Width (m)Au (g/t)Zone
K-23-22546.9057.0010.101.00Big Vein
including47.6449.902.262.28
K-23-218104.70105.701.001.56Big Vein SW
 385.00394.009.001.95
including386.10387.701.608.97
including386.10387.000.9012.18
K-23-216267.00268.001.003.24Big Vein SW
 389.41392.382.973.69
including389.41390.000.5912.05
K-22-215137.00140.003.002.75Big Vein
including137.77138.240.4714.37
K-22-214B400.40411.0010.601.06Green Mantle
including407.00408.301.302.53
 418.60421.402.805.22
including419.75420.150.4022.02
 442.65448.005.351.19
 473.00475.402.401.20
 496.00496.700.708.62

Table 1. Summary of assay results. All intersections are downhole length as there is insufficient Information to calculate true width.

Over 69,000 metres have been drilled to date out of the planned 100,000 metre program. Assays are pending for samples from approximately 3,500 metres of core.

The Company has approximately $15 million in cash and is well funded to carry out the remaining 31,000 metres of the planned drill program as well as further exploration to add to the current pipeline of drill targets on the property.

Figure 1. Plan map of Big Vein showing significant intersections.

Hole IDEastingNorthingElevation (m)AzimuthInclinationDepth (m)
K-23-225661623543546047.714550275
K-23-218661249.3543486042.814045572
K-23-21666129954348844214045526.24
K-22-215661297.1543488046.613045565
K-22-214 B661579543537048.614560676

Table 2. Drill hole collar details

QA/QC

True widths of the reported intersections have yet to be calculated. Assays are uncut. Samples of HQ split core are securely stored prior to shipping to Eastern Analytical Laboratory in Springdale, Newfoundland for assay. Eastern Analytical is an ISO/IEC17025 accredited laboratory. Samples are routinely analyzed for gold by standard 30g fire assay with atomic absorption finish as well as by ICP-OES for an additional 34 elements. Samples containing visible gold are assayed by metallic screen/fire assay, as are any samples with fire assay results greater than 1g/t Au. The company submits blanks and certified reference standards at a rate of approximately 5% of the total samples in each batch.

Qualified Person

Roger Moss, PhD., P.Geo., President and CEO of LabGold, a Qualified Person in accordance with Canadian regulatory requirements as set out in NI 43-101, has read and approved the scientific and technical information that forms the basis for the disclosure contained in this release.

The Company gratefully acknowledges the Newfoundland and Labrador Ministry of Natural Resources’ Junior Exploration Assistance (JEA) Program for its financial support for exploration of the Kingsway property.

About Labrador Gold
Labrador Gold is a Canadian based mineral exploration company focused on the acquisition and exploration of prospective gold projects in Eastern Canada.

Labrador Gold’s flagship property is the 100% owned Kingsway project in the Gander area of Newfoundland. The three licenses comprising the Kingsway project cover approximately 12km of the Appleton Fault Zone which is associated with gold occurrences in the region, including those of New Found Gold immediately to the south of Kingsway. Infrastructure in the area is excellent located just 18km from the town of Gander with road access to the project, nearby electricity and abundant local water. LabGold is drilling a projected 100,000 metres targeting high-grade epizonal gold mineralization along the Appleton Fault Zone with encouraging results. The Company has approximately $15 million in working capital and is well funded to carry out the planned program.

The Hopedale property covers much of the Florence Lake greenstone belt that stretches over 60 km. The belt is typical of greenstone belts around the world but has been underexplored by comparison. Work to date by Labrador Gold show gold anomalies in rocks, soils and lake sediments over a 3 kilometre section of the northern portion of the Florence Lake greenstone belt in the vicinity of the known Thurber Dog gold showing where grab samples assayed up to 7.8g/t gold. In addition, anomalous gold in soil and lake sediment samples occur over approximately 40 km along the southern section of the greenstone belt (see news release dated January 25th 2018 for more details). Labrador Gold now controls approximately 40km strike length of the Florence Lake Greenstone Belt.

The Company has 170,009,979 common shares issued and outstanding and trades on the TSX Venture Exchange under the symbol LAB.

For more information please contact:             

Roger Moss, President and CEO Tel: 416-704-8291

Or visit our website at: www.labradorgold.com

Twitter: @LabGoldCorp

Neither TSX Venture Exchange nor its Regulation Services Provider (as that term is defined in policies of the TSX Venture Exchange) accepts responsibility for the adequacy or accuracy of this release.

Forward-Looking Statements: This news release contains forward-looking statements that involve risks and uncertainties, which may cause actual results to differ materially from the statements made. When used in this document, the words “may”, “would”, “could”, “will”, “intend”, “plan”, “anticipate”, “believe”, “estimate”, “expect” and similar expressions are intended to identify forward-looking statements. Such statements reflect our current views with respect to future events and are subject to risks and uncertainties. Many factors could cause our actual results to differ materially from the statements made, including those factors discussed in filings made by us with the Canadian securities regulatory authorities. Should one or more of these risks and uncertainties, such as actual results of current exploration programs, the general risks associated with the mining industry, the price of gold and other metals, currency and interest rate fluctuations, increased competition and general economic and market factors, occur or should assumptions underlying the forward looking statements prove incorrect, actual results may vary materially from those described herein as intended, planned, anticipated, or expected. We do not intend and do not assume any obligation to update these forward-looking statements, except as required by law. Shareholders are cautioned not to put undue reliance on such forward-looking statements.

A photo accompanying this announcement is available at https://www.globenewswire.com/NewsRoom/AttachmentNg/6a933fde-2567-42e1-b694-134f973d74c2

Release – Ocugen To Present at Association For Research In Vision And Ophthalmology 2023 Annual Meeting

Research News and Market Data on OCGN

April 20, 2023

PDF Version

MALVERN, Pa., April 20, 2023 (GLOBE NEWSWIRE) — Ocugen, Inc. (Ocugen or the Company) (NASDAQ: OCGN), a biotechnology company focused on discovering, developing, and commercializing novel gene and cell therapies, biologics, and vaccines, today announced that the Company will present on its innovative modifier gene therapy platform, including OCU400 for the treatment of retinitis pigmentosa and Leber congenital amaurosis, OCU410 for the treatment of dry age-related macular degeneration (dry AMD), and OCU410ST for the treatment of Stargardt disease; along with OCU200, a novel biologic candidate to treat diabetic macular edema (DME), at The Association for Research in Vision and Ophthalmology (ARVO) 2023 Annual Meeting in New Orleans from April 23-27, 2023.

“We are thrilled to share more detail on our unique modifier gene therapy platform, as well as our novel biologics ophthalmic product pipeline with the professional community at ARVO,” commented Arun Upadhyay, PhD, Chief Scientific Officer and Head of Research, Development and Medical at Ocugen. “It is especially exciting to be at ARVO just following positive preliminary safety and efficacy results from the Phase 1/2 trial of OCU400 for the treatment of retinitis pigmentosa. We look forward to highlighting this most recent news along with the work we are doing across our ophthalmology portfolio to combat hard-to-treat blindness diseases affecting millions of patients globally,” Dr. Upadhyay concluded.

Poster Presentation:

Title: Modifier Gene Approach Using OCU410 for Dry AMD Therapy: One Gene—Multiple Targets 
Authors: Dinesh Singh, Mohamed Nsaibia, Sree Kattala, Subechhya Neupane, Matthew Ritts, Arun Upadhyay
Presenter: Dinesh Singh, Associate Director, Discovery, Ocugen
Presentation Type/Number: Poster Session, 755-C0356
Location: Exhibit Hall
Date: Sunday, April 23, 2023
Time: Noon – 1:45 p.m. CDT

Exhibitor Presentations (Exhibitor Education Lounge):

Title: Ocugen—OCU400—Modifier Gene Therapy for Treatment of Inherited Retinal Diseases: Retinitis Pigmentosa & Leber Congenital Amaurosis
Presenter: Arun Upadhyay, PhD, CSO and Head of Research, Development and Medical, Ocugen
Date: Monday, April 24, 2023
Time: 2 p.m. CDT

Title: Ocugen—OCU410 & OCU410ST—Nuclear Receptor Gene RORA as a Potential Therapeutic for Dry AMD and Stargardt disease
Presenter: Dinesh Singh, Associate Director, Discovery, Ocugen
Date: Tuesday, April 25, 2023
Time: 2 p.m. CDT

Title: Ocugen—OCU200—A Novel Biologic for the Treatment of DME, DR, and Wet AMD
Presenter: Pushpendra Singh, Director, Cell and Gene Therapy, Ocugen
Date: Wednesday, April 26, 2023
Time: 2 p.m. CDT

About OCU400
OCU400 is the Company’s gene-agnostic modifier gene therapy product based on NHR gene, NR2E3NR2E3 regulates diverse physiological functions within the retina—such as photoreceptor development and maintenance, metabolism, phototransduction, inflammation and cell survival networks. Through its drive functionality, OCU400 resets altered/affected cellular gene-networks and establishes homeostasis—a state of balance, which has potential to improve retinal health and function in patients with inherited retinal diseases. These diseases, combined, account for approximately 125,000 cases in the U.S.

About OCU410 and OCU410ST
OCU410 is a modifier gene therapy product candidate being developed for the treatment of dry AMD. OCU410 utilizes an AAV delivery platform for the retinal delivery of the RORA (RAR Related Orphan Receptor A) gene. Various genes associated with AMD are regulated by RORA. The RORA protein plays an important role in lipid metabolism and demonstrates an anti-inflammatory role, which we believe could be a potential therapeutic candidate for dry AMD based on in-vitro and in-vivo (animal model) studies. Using the same technology as OCU410, Ocugen plans to submit an IND for Stargardt disease, an orphan eye disease, in Q2 2023.

About OCU200
OCU200 is a novel fusion protein consisting of human transferrin linked to human tumstatin. It exerts anti-proliferative, anti-inflammatory, and anti-oxidative effects by selective targeting to the retinal and choroidal tissues. OCU200 potentially showcases better bioavailability and tissue penetrance than tumstatin alone due to transferrin and provides distinct MOA binding through αVβ3 integrin pathways that can potentially reduce the number of injections for patients. OCU200 can potentially be used for the treatment of DME, diabetic retinopathy, and wet age-related macular degeneration. These diseases, combined, account for approximately 10 million cases in the U.S.

About Ocugen, Inc.
Ocugen, Inc. is a biotechnology company focused on discovering, developing, and commercializing novel gene and cell therapies, biologics, and vaccines that improve health and offer hope for patients across the globe. We are making an impact on patient’s lives through courageous innovation—forging new scientific paths that harness our unique intellectual and human capital. Our breakthrough modifier gene therapy platform has the potential to treat multiple retinal diseases with a single product, and we are advancing research in infectious diseases to support public health and orthopedic diseases to address unmet medical needs. Discover more at www.ocugen.com and follow us on Twitter and LinkedIn.

Cautionary Note on Forward-Looking Statements
This press release contains forward-looking statements within the meaning of The Private Securities Litigation Reform Act of 1995, which are subject to risks and uncertainties. We may, in some cases, use terms such as “predicts,” “believes,” “potential,” “proposed,” “continue,” “estimates,” “anticipates,” “expects,” “plans,” “intends,” “may,” “could,” “might,” “will,” “should,” or other words that convey uncertainty of future events or outcomes to identify these forward-looking statements. Such statements are subject to numerous important factors, risks, and uncertainties that may cause actual events or results to differ materially from our current expectations. These and other risks and uncertainties are more fully described in our periodic filings with the Securities and Exchange Commission (SEC), including the risk factors described in the section entitled “Risk Factors” in the quarterly and annual reports that we file with the SEC. Any forward-looking statements that we make in this press release speak only as of the date of this press release. Except as required by law, we assume no obligation to update forward-looking statements contained in this press release whether as a result of new information, future events, or otherwise, after the date of this press release.

Contact:
Tiffany Hamilton
Head of Communications
Tiffany.Hamilton@ocugen.com