Comtech Telecommunications Corp. engages in the design, development, production, and marketing of products, systems, and services for advanced communications solutions in the United States and internationally. It operates in three segments: Telecommunications Transmission, Mobile Data Communications, and RF Microwave Amplifiers. The Telecommunications Transmission segment provides satellite earth station equipment and systems, over-the-horizon microwave systems, and forward error correction technology, which are used in various commercial and government applications, including backhaul of wireless and cellular traffic, broadcasting (including HDTV), IP-based communications traffic, long distance telephony, and secure defense applications. The Mobile Data Communications segment provides mobile satellite transceivers, and computers and satellite earth station network gateways and associated installation, training, and maintenance services; supplies and operates satellite packet data networks, including arranging and providing satellite capacity; and offers microsatellites and related components. The RF Microwave Amplifiers segment designs, develops, manufactures, and markets satellite earth station traveling wave tube amplifiers (TWTA) and broadband amplifiers. Its amplifiers are used in broadcast and broadband satellite communication; defense applications, such as telecommunications systems and electronic warfare systems; and commercial applications comprising oncology treatment systems, as well as to amplify signals carrying voice, video, or data for air-to-satellite-to-ground communications. The company serves satellite systems integrators, wireless and other communication service providers, broadcasters, defense contractors, military, governments, and oil companies. Comtech markets its products through independent representatives and value-added resellers. The company was founded in 1967 and is headquartered in Melville, New York.
Joe Gomes, CFA, Managing Director, Equity Research Analyst, Generalist , Noble Capital Markets, Inc.
Joshua Zoepfel, Research Associate, Noble Capital Markets, Inc.
Refer to the full report for the price target, fundamental analysis, and rating.
Contract Resigned. Yesterday, Comtech announced that the Commonwealth of Massachusetts approved the execution of a contract with Comtech to continue operations and maintenance of its Next Generation 911 system within the state. The contract follows the renewal of the Washington contract earlier in the year.
Some Needed Good News. Given the recent negative news, the renewal of the Massachusetts contract is some welcomed good news. Significantly, the Massachusetts announcement, combined with the earlier Washington announcement, indicates clients are continuing to work with Comtech even given the turmoil. We view this positively.
Equity Research is available at no cost to Registered users of Channelchek. Not a Member? Click ‘Join’ to join the Channelchek Community. There is no cost to register, and we never collect credit card information.
This Company Sponsored Research is provided by Noble Capital Markets, Inc., a FINRA and S.E.C. registered broker-dealer (B/D).
*Analyst certification and important disclosures included in the full report. NOTE: investment decisions should not be based upon the content of this research summary. Proper due diligence is required before making any investment decision.
SEPTA pilots Conduent’s solution with plans to expand the number of fare gates in the future
Conduent’s 3D Fare Gate Solution is designed to detect, deter and quantify fare evasion, benefiting both agencies and riders
FLORHAM PARK, N.J. — Conduent Transportation, a global provider of smart mobility technology solutions and business unit of Conduent Incorporated (Nasdaq: CNDT), today announced a pilot program by the Southeastern Pennsylvania Transportation Authority (SEPTA) using Conduent’s 3D Fare Gate Solution at a Philadelphia area transit station. The pilot aims to track and curb incidents of fare evasion, which costs SEPTA an estimated $30 million to $40 million annually.
“We’re excited to be part of this important pilot for SEPTA to help detect, deter and quantify fare evasion, while simultaneously offering both the agency and riders increased security and convenience”
SEPTA selected the 69th Street station in Upper Darby as its test location for riders traveling on the Market-Frankford and Norristown High Speed lines. The gates, each measuring 7 feet, 8 inches tall, began operating in April. Following the three-month pilot program, the agency plans to expand the fare gates’ availability to other stations, including those with high reported incidents of fare evasion.
“We’re excited to be part of this important pilot for SEPTA to help detect, deter and quantify fare evasion, while simultaneously offering both the agency and riders increased security and convenience,” said Adam Appleby, President, Transportation Solutions at Conduent. “As transit agencies across the country and around the world grapple with how to curb fare evasion, Conduent is poised and ready to deliver our solution, which has shown to deliver meaningful results and helps ensure riders pay their fares.”
Conduent’s 3D Fare Gate Solution uses innovative 3D detection optical sensors, allowing travelers fast and convenient access while detecting and deterring ticketing fraud. The gates also provide transit authorities quick access to reporting and analytics, aiding in enforcement decisions by identifying precisely when and where fare evasion occurs.
The gates, which were also implemented in Paris by Transilien SNCF in 2019, are designed to detect the most common types of fare evasion using advanced, sensor-based feedback mechanisms. The solution, which is ADA-compliant and adaptable to meet agency needs, improves equity in transportation by improving accessibility for all riders as well as helping to ensure passengers pay their share.
SEPTA is one of the largest transit systems in the country, serving five counties in the Greater Philadelphia area and connecting to Delaware and New Jersey transit systems. It operates across six transportation modes and has 2,800 vehicles in service, 285 subway and rail stations, plus 13,000 bus and trolley stops.
Conduent Transportation is a leading provider of streamlined, high-volume mobility services and solutions, spanning road usage charging and advanced transit systems, that enhance the services provided by transportation agencies to benefit the citizens who use them. For over 50 years, the company has helped clients advance transportation solutions in more than 20 countries.
About Conduent Conduent delivers digital business solutions and services spanning the commercial, government and transportation spectrum – creating valuable outcomes for its clients and the millions of people who count on them. The Company leverages cloud computing, artificial intelligence, machine learning, automation and advanced analytics to deliver mission-critical solutions. Through a dedicated global team of approximately 59,000 associates, process expertise and advanced technologies, Conduent’s solutions and services digitally transform its clients’ operations to enhance customer experiences, improve performance, increase efficiencies and reduce costs. Conduent adds momentum to its clients’ missions in many ways including disbursing approximately $100 billion in government payments annually, enabling 2.3 billion customer service interactions annually, empowering millions of employees through HR services every year and processing nearly 13 million tolling transactions every day. Learn more at www.conduent.com.
Trademarks Conduent is a trademark of Conduent Incorporated in the United States and/or other countries. Other names may be trademarks of their respective owners.
NEW YORK, May 16, 2024 (GLOBE NEWSWIRE) — AdTheorent Holding Company, Inc. (“AdTheorent” or the “Company”) (Nasdaq: ADTH), a machine learning pioneer delivering measurable value for programmatic advertisers, today announced that the third party that had submitted a non-binding acquisition proposal to acquire the Company for $3.35 per share has withdrawn such proposal, and has informed the Company that it does not intend to submit another acquisition proposal. This proposal had been submitted during the go-shop period that followed AdTheorent’s announcement of the execution of a definitive merger agreement (the “Merger Agreement”) pursuant to which Cadent, LLC (“Cadent”), a leading provider of platform-based converged TV advertising solutions and a portfolio company of Novacap, one of North America’s established private equity firms, agreed to acquire all outstanding shares of AdTheorent common stock for $3.21 per share in cash, or approximately $324 million.
The Company recently disclosed that the waiting period under the Hart-Scott-Rodino (“HSR”) Antitrust Improvements Act of 1976 expired on May 6, 2024. Expiration of the HSR waiting period was a condition to the closing of the pending transaction with Cadent.
The Company and Cadent continue to remain subject to the Merger Agreement, and pursuant thereto, the Company intends to mail as promptly as reasonably practicable a definitive proxy statement to its stockholders in connection with a special meeting of stockholders to approve the Cadent transaction.
About AdTheorent:
AdTheorent uses advanced machine learning technology and privacy-forward solutions to deliver impactful advertising campaigns for marketers. AdTheorent’s advanced machine learning-powered media buying platform powers its predictive targeting, predictive audiences, geo-intelligence, audience extension solutions and in-house creative capability, Studio A\T. Focused on the predictive value of machine learning models, AdTheorent’s product suite and flexible transaction models allow advertisers to identify the most qualified potential consumers coupled with the optimal creative experience to deliver superior results, measured by each advertiser’s real-world business goals. AdTheorent is headquartered in New York, with fourteen locations across the United States and Canada.
AdTheorent is consistently recognized with numerous technology, product, growth and workplace awards. AdTheorent was named “Best Buy-Side Programmatic Platform” in the 2023 Digiday Technology Awards and was honored with an AI Breakthrough Award and “Most Innovative Product” (B.I.G. Innovation Awards) for six consecutive years. Additionally, AdTheorent is the only seven-time recipient of Frost & Sullivan’s “Digital Advertising Leadership Award.” In September 2023, evidencing its continued prioritization of its team, AdTheorent was named a Crain’s Top 100 Best Place to Work in NYC for the tenth consecutive year. AdTheorent ranked tenth in the Large Employer Category and 26th Overall in 2023. For more information, visit adtheorent.com.
Additional Information and Where to Find It:
This release may be deemed to be solicitation material in respect of the transaction contemplated by the Merger Agreement (the “proposed merger”). In connection with the proposed merger, the Company filed its Preliminary Proxy Statement on April 30, 2024. This communication is not a substitute for the Preliminary Proxy Statement or any other document that AdTheorent may file with the SEC or send to its stockholders in connection with the proposed merger. When the Company files its proxy statement in definitive form (the “Definitive Proxy Statement”) with the SEC, the Company will mail the Definitive Proxy Statement and a proxy card to each stockholder entitled to vote at the special meeting relating to the proposed merger. INVESTORS AND STOCKHOLDERS OF THE COMPANY ARE URGED TO READ ALL RELEVANT DOCUMENTS FILED WITH THE SEC, INCLUDING THE COMPANY’S DEFINITIVE PROXY STATEMENT (WHEN AVAILABLE), BECAUSE THEY CONTAIN OR WILL CONTAIN IMPORTANT INFORMATION ABOUT THE PROPOSED MERGER. Investors and security holders are or will be able to obtain the documents (when available) free of charge at the SEC’s website at www.sec.gov, or free of charge from the Company by directing a request to David DeStefano, Investor Relations at [email protected] or (203) 682-8383.
Participants in the Solicitation:
AdTheorent, Cadent, and their respective directors, executive officers and other members of management and employees, under SEC rules, may be deemed to be “participants” in the solicitation of proxies from stockholders of AdTheorent in favor of the proposed merger. Additional information about AdTheorent’s directors and executive officers is set forth in AdTheorent’s Form 10-K/A for the year ended December 31, 2023, which was filed with the SEC on April 25, 2024 (the “Form 10-K/A”). To the extent holdings of AdTheorent’s securities by its directors or executive officers have changed since the amounts set forth in the Form 10-K/A, such changes have been or will be reflected on Initial Statements of Beneficial Ownership on Form 3 or Statements of Change in Ownership on Form 4 filed with the SEC. Additional information concerning the interests of AdTheorent’s participants in the solicitation, which may, in some cases, be different than those of AdTheorent’s stockholders generally, will be set forth in the Definitive Proxy Statement relating to the proposed merger when it becomes available.
No Offer or Solicitation:
This release is not intended to and shall not constitute an offer to buy or sell or the solicitation of an offer to buy or sell any securities, or a solicitation of any vote or approval, nor shall there be any offer, solicitation or sale of securities in any jurisdiction in which such offer, solicitation or sale would be unlawful prior to registration or qualification under the securities laws of any such jurisdiction. No offer of securities shall be made in the United States absent registration under the Securities Act of 1933, as amended, or pursuant to an exemption from, or in a transaction not subject to, such registration requirements.
Forward Looking Statements:
This release contains “forward-looking statements” within the meaning of the safe harbor provisions of the U.S. Private Securities Litigation Reform Act of 1995. Forward-looking statements include, without limitation, any statement that may predict, forecast, indicate or imply future results, performance or achievements, and may contain words such as “believe,” “anticipate,” “expect,” “estimate,” “intend,” “project,” “plan,” or words or phrases with similar meaning. Such statements may also include statements regarding the completion of the proposed merger and the expected timing of the completion of the proposed merger, the management of AdTheorent upon completion of the proposed merger and AdTheorent’s plans upon completion of the proposed merger. Forward-looking statements should not be read as a guarantee of future performance or results and will not necessarily be accurate indications of the times at, or by, which such performance or results will be achieved. Forward-looking statements are based on current expectations, forecasts and assumptions that involve risks and uncertainties, including, but not limited to, the market for programmatic advertising developing slower or differently than AdTheorent’s expectations, the demands and expectations of clients and the ability to attract and retain clients and other economic, competitive, governmental and technological factors outside of AdTheorent’s control, that may cause AdTheorent’s business, strategy or actual results to differ materially from the forward-looking statements. Actual future results, performance or achievements may differ materially from historical results or those anticipated depending on a variety of factors, some of which are beyond the control of AdTheorent, including, but not limited to, the occurrence of any event, change or other circumstances that could give rise to the termination of the Merger Agreement, including under circumstances that would require the Company to pay a termination fee; the inability to complete the proposed merger due to the failure to obtain stockholder approval for the proposed merger or the failure to satisfy other conditions to completion of the proposed merger; risks related to disruption of management’s attention from AdTheorent’s ongoing business operations due to the proposed merger; unexpected costs, charges or expenses resulting from the proposed merger; AdTheorent’s ability to retain and hire key personnel in light of the proposed merger; certain restrictions during the pendency of the proposed merger that may impact AdTheorent’s ability to pursue certain business opportunities or strategic transactions; the ability of the buyer to obtain the necessary financing arrangements set forth in the commitment letters received in connection with the proposed merger; potential litigation relating to the proposed merger that could be instituted against the parties to the Merger Agreement or their respective directors, managers or officers, including the effects of any outcomes related thereto; the effect of the announcement of the proposed merger on AdTheorent’s relationships with its customers, operating results and business generally; and the risk that the proposed merger will not be consummated in a timely manner, if at all. AdTheorent refers you to the “Risk Factors” and “Management’s Discussion and Analysis of Financial Condition and Results of Operations” sections of the Company’s Form 10-K for the fiscal year ended December 31, 2023, and comparable sections of the Company’s Quarterly Reports on Form 10-Q and other filings, which have been filed with the SEC and are available on the SEC’s website at www.sec.gov. All of the forward-looking statements made in this report are expressly qualified by the cautionary statements contained or referred to herein. The actual results or developments anticipated may not be realized or, even if substantially realized, they may not have the expected consequences to or effects on AdTheorent or its business or operations. Readers are cautioned not to rely on the forward-looking statements contained in this report. Forward-looking statements speak only as of the date they are made and AdTheorent does not undertake any obligation to update, revise or clarify these forward-looking statements, whether as a result of new information, future events or otherwise, except as may be required by applicable law.
PHOENIX, May 13, 2024 (GLOBE NEWSWIRE) — QuoteMedia, Inc. (OTCQB: QMCI), a leading provider of market data and financial applications, announced financial results for the quarter ended March 31, 2024.
QuoteMedia provides banks, brokerage firms, private equity firms, financial planners and sophisticated investors with a more economical, higher quality alternative source of stock market data and related research information. We compete with several larger legacy organizations and a modest community of other smaller companies. QuoteMedia provides comprehensive market data services, including streaming data feeds, on-demand request-based data (XML/JSON), web content solutions (financial content for website integration) and applications such as Quotestream Professional desktop and mobile.
Highlights for Q1 2024 include the following:
Quarterly revenue decreased by $70,848 (1%) to $4,679,200 in Q1 2024 from $4,750,048 in 2023.
Adjusted EBITDA for Q1 2024 was $676,886 compared to $829,585 in Q1 2023, a reduction of $152,699.
Our net loss for Q1 2024 was $28,176 compared to net income of $113,290 in Q1 2023, a decrease in profitability of $141,466.
“This was a challenging quarter for QuoteMedia,” said Robert J. Thompson, Chairman of the Board. “Economic conditions forced a few clients to reduce or discontinue their spending with QuoteMedia, offsetting the revenue from new clients added during the quarter. There are, however, several exciting prospective clients in the pipeline. While the sales cycles for these large-scale deployments can be quite long, we expect to see improved revenue growth as the year progresses.”
QuoteMedia will host a conference call Tuesday, May 14, 2024, at 2:00 PM Eastern Time to discuss the Q1 2024 financial results and provide a business update.
Conference Call Details:
Date: May 14, 2024
Time: 2:00 PM Eastern Time
Dial-in number: 888-632-3384; 785-424-1794
Conference ID: QUOTEMEDIA
An audio rebroadcast of the call will be available later at: www.quotemedia.com
About QuoteMedia
QuoteMedia is a leading software developer and cloud-based syndicator of financial market information and streaming financial data solutions to media, corporations, online brokerages, and financial services companies. The Company licenses interactive stock research tools such as streaming real-time quotes, market research, news, charting, option chains, filings, corporate financials, insider reports, market indices, portfolio management systems, and data feeds. QuoteMediaprovides industry leading market data solutions and financial services for companies such as the Nasdaq Stock Exchange, TMX Group (TSX Stock Exchange), Canadian Securities Exchange (CSE), London Stock Exchange Group, FIS, IEX Data Services LLC, U.S. Bank, Bank of Montreal (BMO), Broadridge Financial Systems, JPMorgan Chase, Scotiabank, CI Financial, Canaccord Genuity Corp., Hilltop Securities, Avantax, Zacks Investment Research, S&P Global Market Intelligence Inc., Business Wire, Cision (PR Newswire, CNW Group), The Goldman Sachs Group, TheStreet.com, Motley Fool, Regal Securities, ChoiceTrade, Cetera Financial Group, Dynamic Trend, Inc., Aviso Financial Inc., iA Private Wealth, Leede Jones Gable, Firstrade Securities, Charles Schwab, Lightspeed Financial Services Group LLC, Equisolve, Stock-Trak and others. Quotestream®, QMod TM and Quotestream Connect TM are trademarks of QuoteMedia. For more information, please visit www.quotemedia.com .
Statements about QuoteMedia’s future expectations, including future revenue, earnings, and transactions, as well as all other statements in this press release other than historical facts are “forward-looking statements” within the meaning of the Private Securities Litigation Reform Act of 1995. QuoteMedia intends that such forward-looking statements be subject to the safe harbors created thereby. These statements involve risks and uncertainties that are identified from time to time in the Company’s SEC reports and filings and are subject to change at any time. QuoteMedia’s actual results and other corporate developments could differ materially from that which has been anticipated in such statements.
Below are the specific forward-looking statements included in this press release:
There are, however, several exciting prospective clients in the pipeline. While the sales cycles for these large-scale deployments can be quite long, we expect to see improved revenue growth as the year progresses.
We believe that Adjusted EBITDA, as a non-GAAP pro forma financial measure, provides meaningful information to investors in terms of enhancing their understanding of our operating performance and results, as it allows investors to more easily compare our financial performance on a consistent basis compared to the prior year periods. This non-GAAP financial measure also corresponds with the way we expect investment analysts to evaluate and compare our results. Any non-GAAP pro forma financial measures should be considered only as supplements to, and not as substitutes for or in isolation from, or superior to, our other measures of financial information prepared in accordance with GAAP, such as net income attributable to QuoteMedia, Inc.
We define and calculate Adjusted EBITDA as net income attributable to QuoteMedia, Inc., plus: 1) depreciation and amortization, 2) stock compensation expense, 3) interest expense, 4) foreign exchange loss (or minus a foreign exchange gain), and 5) income tax expense. We disclose Adjusted EBITDA because we believe it is a useful metric by which to compare the performance of our business from period to period. We understand that measures similar to Adjusted EBITDA are broadly used by analysts, rating agencies, investors and financial institutions in assessing our performance. Accordingly, we believe that the presentation of Adjusted EBITDA provides useful information to investors. The table below provides a reconciliation of Adjusted EBITDA to net income attributable to QuoteMedia, Inc., the most directly comparable GAAP financial measure.
QuoteMedia, Inc. Adjusted EBITDA Reconciliation to Net Income:
Upcoming ISG Provider Lens™ report will evaluate providers offering a range of capabilities to improve the efficiency and agility of customers’ financial processes
STAMFORD, Conn.–(BUSINESS WIRE)– Information Services Group (ISG) (Nasdaq: III), a leading global technology research and advisory firm, has launched a research study examining outsourcing services that help enterprises improve their finance and accounting operations and business decision-making.
The study results will be published in a comprehensive ISG Provider Lens™ report, called Finance and Accounting Outsourcing Services (FAO), scheduled to be released in October. The report will cover the global market for services related to procurement, reporting, budgeting, financial planning and other functions.
Enterprise buyers will be able to use information from the report to evaluate their current vendor relationships, potential new engagements and available offerings, while ISG advisors use the information to recommend providers to the firm’s buy-side clients.
Cost reduction, enhanced speed and higher levels of accuracy continue to be the primary drivers of FAO. But as the sector has matured over the last decade, enterprises are expecting their providers to be more consultative and partner-oriented, while leveraging advanced technologies such as AI, machine learning, automation and, most recently, GenAI to deliver more impactful outcomes. Such technologies streamline processes and enable predictive analysis and sophisticated decision-making capabilities essential for strategic planning and competitive advantage.
“Enterprises are looking for FAO providers that act not just as service executors but as advisors and collaborators able to navigate and leverage the broader ecosystem of partners and industry experts,” said Namratha Dharshan, chief business leader, ISG Research. “Providers are expected to understand and align themselves with their customers’ long-term business objectives.”
ISG has distributed surveys to more than 40 finance and accounting outsourcing providers. Working in collaboration with ISG’s global advisors, the research team will produce four quadrants representing the finance and accounting outsourcing services the typical enterprise is buying, based on ISG’s experience working with its clients. The four quadrants are:
Procure to Pay (P2P), evaluating providers of services across the accounts payable process, including paying suppliers, reconciling accounts, tracking expenses and spending patterns and negotiating contracts. P2P providers use new technologies including AI and machine learning to automate processes and increase efficiency.
Order to Cash (O2C),assessing providers of end-to-end O2C operations, including processing customer orders, ensuring payments are received promptly, managing credit risk and providing customer support. Clients look to these partners to streamline operations, often through automation to reduce manual processes.
Record to Report (R2R), covering providers that manage clients’ financial record-keeping and reporting, including complex processes such as managing the end-of-period close process, preparing financial statements and assessing clients’ internal control systems.
Financial Planning and Analysis (FP&A), evaluating providers of high-end financial functions including budgeting, forecasting, financial planning and M&A. These providers act as partners to clients, delivering comprehensive and meaningful data and insights.
The report resulting from this study will cover the global finance and accounting outsourcing market. ISG analysts Gaurang Pagdi and Sneha Jayanth will serve as authors of the report.
A list of identified providers and vendors and further details on the study are available in this digital brochure. Companies not listed as finance and accounting outsourcing providers can contact ISG and ask to be included in the study.
All 2024 ISG Provider Lens™ evaluations feature expanded customer experience (CX) data that measures actual enterprise experience with specific provider services and solutions, based on ISG’s continuous CX research. Enterprise customers wishing to share their experience about a specific provider or vendor are encouraged to register here to receive a personalized survey URL. Participants will receive a copy of this report in return for their feedback.
About ISG Provider Lens™ Research
The ISG Provider Lens™ Quadrant research series is the only service provider evaluation of its kind to combine empirical, data-driven research and market analysis with the real-world experience and observations of ISG’s global advisory team. Enterprises will find a wealth of detailed data and market analysis to help guide their selection of appropriate sourcing partners, while ISG advisors use the reports to validate their own market knowledge and make recommendations to ISG’s enterprise clients. The research currently covers providers offering their services globally, across Europe, as well as in the U.S., Canada, Brazil, the U.K., France, Benelux, Germany, Switzerland, the Nordics, Australia and Singapore/Malaysia, with additional markets to be added in the future. For more information about ISG Provider Lens research, please visit this webpage.
About ISG
ISG (Information Services Group) (Nasdaq: III) is a leading global technology research and advisory firm. A trusted business partner to more than 800 clients, including more than 75 of the world’s top 100 enterprises, ISG is committed to helping corporations, public sector organizations, and service and technology providers achieve operational excellence and faster growth. The firm specializes in digital transformation services, including AI and automation, cloud and data analytics; sourcing advisory; managed governance and risk services; network carrier services; strategy and operations design; change management; market intelligence and technology research and analysis. Founded in 2006, and based in Stamford, Conn., ISG employs more than 1,300 digital-ready professionals operating in more than 20 countries—a global team known for its innovative thinking, market influence, deep industry and technology expertise, and world-class research and analytical capabilities based on the industry’s most comprehensive marketplace data. For more information, visit www.isg-one.com.
In a $6.9 billion megadeal that underscores private equity’s rekindled appetite for undervalued tech assets, website builder Squarespace is being taken private by European investment giant Permira. This blockbuster buyout could have major reverberations across the small-cap software landscape as the No-Code movement continues disrupting how businesses establish digital presences.
For small and micro-cap investors attuned to sifting out overlooked gems, the Squarespace acquisition shines a spotlight on a vital but often-neglected corner of the tech universe. Despite its ubiquity in helping small businesses, freelancers, and entrepreneurs create web presences, the versatile platform had seen its public market value plummet from pandemic-era highs over $8 billion to just $2 billion last year.
Permira’s acquisition at a nearly $7 billion valuation represents both validation of Squarespace’s resilient business model and the turnaround potential achievable under private ownership insulated from quarterly earnings pressures. It’s a staggering premium to where shares traded for much of the past 18 months.
At the heart of Squarespace’s appeal is its flagship website builder offering an intuitive, drag-and-drop interface enabling rapid launches of customized online storefronts, portfolios, and digital hubs. This democratization of web development tooling has fueled Squarespace’s growth into a over $1 billion annual revenue business catering to small and medium enterprises (SMEs).
However, Squarespace is far more than just websites. It encompasses a full ecosystem powering e-commerce transactions, online marketing campaigns, appointment booking, analytics and other capabilities critical for SMEs to effectively run digital operations. Its recent exploration of generative AI to automate content creation and email campaigns makes Squarespace a prime platform for capitalizing on the latest tech disruptors reshaping modern business workflows.
This is the type of robust, diversified product suite often valued at premium multiples in large-cap counterparts. Yet Squarespace languished in public market purgatory as Wall Street consistently underappreciated the depth of its platform and upside potential to cross-sell new offerings across its vast installed SME customer base.
For Permira, taking the company private removes constraints imposed by quarterly earnings whiplash and nearsighted market mentalities. It gives Squarespace’s visionary founder and CEO Anthony Casalena — who is staying aboard — considerable flexibility to focus resources on longer-term initiatives like AI, fin-tech, and verticalized solutions to create more enduring competitive advantages.
From the acquirer’s standpoint, Squarespace represents a savvy, well-timed bet on secularly ingrained tech trends expected to drive durable growth for years to come. The democratization of business tools for an entire generation of entrepreneurs and small enterprises is underpinned by rising self-employment, gig-economy dynamics, and startup formation catalyzing demand for easy, affordable website builders and marketing automations.
It’s little surprise Permira sees the opportunity to build a true industry juggernaut by capitalizing on Squarespace’s headstart in capturing this coveted market as digital transformation initiatives proliferate. The PE firm has a proven playbook for propelling verticalized software champions forward through its investments across sectors like cybersecurity, fintech, and manufacturing.
For smaller investors able to scour opportunities more nimbly than institutional counterparts, the Squarespace deal highlights several key themes to monitor going forward:
First, differentiated innovators commercializing technologies that flatten the digital playing field consistently fetch premium valuations, even amidst broader tech routs. As entrepreneurship and SME formation remain robust, enablers of this ecosystem will stay in hot demand.
Secondly, the abundance of depressed small-cap software valuations creates fertile ground for well-capitalized consolidators to pounce. Many unloved public companies commanding strong niches and cash flows could become prime targets for buyouts aiming to revitalize growth trajectories away from quarterly investor scrutiny.
Finally, generational tech disruptors like no-code platforms, AI, fin-tech and vertical SaaS models are seen as highly strategic assets warranting aggressive investments from value-conscious buyers. As industry convergence intensifies, small-caps effectively straddling multiple megatrends could emerge as diamonds in the rough.
The Squarespace saga underscores why diligent small-cap investors must maintain a watchful eye for overlooked assets with compelling runway stories. In today’s environment of dizzying tech change and plentiful private capital awaiting deployment, the most unassuming names may harbor some of the market’s most extraordinary upside opportunities.
Want small cap opportunities delivered straight to your inbox?
Channelchek’s free newsletter will give you exclusive access to our expert research, news, and insights to help you make informed investment decisions.
ISG (Information Services Group) (Nasdaq: III) is a leading global technology research and advisory firm. A trusted business partner to more than 700 clients, including more than 75 of the world’s top 100 enterprises, ISG is committed to helping corporations, public sector organizations, and service and technology providers achieve operational excellence and faster growth. The firm specializes in digital transformation services, including automation, cloud and data analytics; sourcing advisory; managed governance and risk services; network carrier services; strategy and operations design; change management; market intelligence and technology research and analysis. Founded in 2006, and based in Stamford, Conn., ISG employs more than 1,300 digital-ready professionals operating in more than 20 countries—a global team known for its innovative thinking, market influence, deep industry and technology expertise, and world-class research and analytical capabilities based on the industry’s most comprehensive marketplace data. For additional information, visit www.ISG-One.com
Joe Gomes, Managing Director, Equity Research Analyst, Generalist , Noble Capital Markets, Inc.
Joshua Zoepfel, Research Associate, Noble Capital Markets, Inc.
Refer to the full report for the price target, fundamental analysis, and rating.
Continued Slow Environment. ISG’s performance continued to be impacted by slower client decision making. Clients are taking longer to commit to new investments and are developing their AI strategy. We believe that the decision making will continue to affect the Company over the fiscal year, however, the impact will lessen over the quarters as clients start to spend more.
Recurring Revenue. Management’s focus on increasing its recurring revenue continues to be showcased, as half the revenue during the quarter was recurring. The Company’s services on platforms such as GovernX and ProBenchmark continue to experience increased demand and the addition of Ventana Research is providing new relationships, potentially increasing opportunities for cross-selling, in our view. With AI looming, ISG is poised to strike with its AI services when businesses start to invest more in the technology.
Equity Research is available at no cost to Registered users of Channelchek. Not a Member? Click ‘Join’ to join the Channelchek Community. There is no cost to register, and we never collect credit card information.
This Company Sponsored Research is provided by Noble Capital Markets, Inc., a FINRA and S.E.C. registered broker-dealer (B/D).
*Analyst certification and important disclosures included in the full report. NOTE: investment decisions should not be based upon the content of this research summary. Proper due diligence is required before making any investment decision.
In a move that epitomizes the AI revolution’s inexorable rise and its rippling effects across economic sectors, Sam Altman’s advanced nuclear company Oklo has gone public through a SPAC deal. The transaction netted over $306 million for the fledgling firm to propel its quest to deliver miniaturized, modular nuclear reactors to power everything from military bases to the server farms underpinning large language models like ChatGPT.
Altman, the high-profile CEO of OpenAI, has been vocal about prioritizing sustainable energy solutions like nuclear to meet ballooning computational demands across the AI landscape. Oklo represents a manifestation of that vision, an audacious startup aiming to disrupt antiquated nuclear plant designs with smaller, more nimble fission reactors enclosed in A-frame structures.
As revolutionary AI systems smash through prior technical constraints, their insatiable appetite for energy poses both an opportunity and existential risk. Without abundant, reliable, and climate-friendly power sources, the sector’s terrific growth could stumble or succumb to overreliance on carbon-intensive alternatives. Nascent AI companies embracing pioneers like Oklo could leapfrog that hurdle entirely.
The company’s unconventional public debut via a SPAC merger, while risky, underscores the urgency around securing capital and resources to outpace competing nuclear upstarts and legacy utilities. It also spotlights intensifying investor zeal around potential disruptors servicing the unique infrastructure needs of AI.
At the vanguard are deep-pocketed tech titans like Microsoft, Amazon, and Google parent Alphabet, all operating gargantuan data centers tasked with training and running large language models, computer vision, and myriad other AI workloads. These digital refineries have grown so prodigious they now rank among the world’s top consumers of electricity.
In recent years, the likes of Microsoft and Google have inked deals with nuclear upstarts while voicing public support for next-generation reactors to enhance sustainability and feed AI growth. Amazon cloud chief Andy Jassy has advocated exploring nuclear at scale as a critical lever.
Oklo positions itself as an ideal partner straddling these ambitions. In addition to the company’s modular nuclear plants aimed at localized power generation, the startup’s energy-dense reactors could be co-located at data center campuses requiring immense on-site capacity. Its small-scale model obviates the hazards and complexities of colossal conventional nuclear facilities situated far from demand.
This dystopian vision — fleets of miniature, mobile nuclear generators powering the AI revolution’s factories — may spark backlash from environmental groups wary of distributed radiation risks. But the reality is computing’s ecological footprint has become too ravenous to ignore.
According to one estimate, the energy already consumed by AI could produce the emissions of the entire country of Spain. Left unfettered, ML training workloads alone may comprise a third of the world’s total power demands by 2030. Nuclear proponents cast reactors like Oklo’s as potentially vital circuit-breakers preventing a climate catastrophe.
Altman’s multi-front assault on solving AI’s existential scaling crisis doesn’t stop at Oklo. Through OpenAI and his investment vehicles, the tech mogul is betting big on a range of startups pushing the boundaries in fields like nuclear fusion, data center chips, and ultra-dense computing. Audacious ventures once relegated to science fiction now rank among the most coveted opportunities for VCs and growth investors.
Whether Oklo and its ilk can clear the considerable technical and regulatory hurdles to commercial viability fast enough remains an open question. The challenges of improving nuclear economics, public perception, and building an adept workforce remain immense.
But as AI continues its relentless expansion defying prior predictions, the companies capable of architecting sustainable infrastructure solutions may prove as indispensable to the revolution as the algorithms and models powering the systems themselves. Altman is among the growing chorus sounding that clarion call to action.
Information Services Group Announces First-Quarter 2024 Results
Reports first-quarter GAAP revenues of $64 million
Reports first-quarter net loss of $3.4 million, GAAP loss per share of $0.07 and adjusted net income per share of $0.01
Reports first-quarter adjusted EBITDA of $4 million
Generates $2.3 million of cash from operations
Declares second-quarter dividend of $0.045 per share, payable July 5, 2024, to shareholders of record as of June 14, 2024
Sets second-quarter guidance: revenues between $65 million and $67 million and adjusted EBITDA between $7.0 million and $8.0 million
STAMFORD, Conn.–(BUSINESS WIRE)– Information Services Group (ISG) (Nasdaq: III), a leading global technology research and advisory firm, today announced its financial results for the first quarter ended March 31, 2024.
“As anticipated, we saw market uncertainty impact the broader global technology industry during the first quarter,” said Michael P. Connors, chairman and CEO. “With that said, our opportunity pipeline is growing, so we believe the worst is behind us. We see the market turning and gaining momentum over the course of the year.”
Connors said clients slowed their pace of spending and generally have been taking longer to decide on new investments, as they weigh economic conditions and wait to see how AI shapes the technology landscape before committing to major new initiatives.
“As the market transitions from the planning to the execution phase of AI, there will be significant investments in infrastructure and implementation,” Connors said. “Additionally, we see a notable increase in demand for cost and spend transformation, as companies continue to adapt to uncertain macroeconomic conditions. Early indicators, such as a rise in sourcing activity, suggest the demand environment is evolving and will accelerate going forward.”
Connors also said ISG is encouraged by the continuing growth of its recurring revenue business. “Demand for our research, governance and platforms continues, as clients seek market intelligence and governance solutions to shape their future investment decisions,” Connors said. “Our next-gen sourcing platform, ISG Tango™, launched in March, has been well-received, with over $2.6 billion of contract value already running on the platform.”
Connors noted that recurring revenues represented about half of the firm’s revenues in the first quarter and totaled $126 million for the trailing 12 months, up 10 percent from the previous 12-month period.
First-Quarter 2024 Results
Reported revenues for the first quarter were $64.3 million, down 18 percent from $78.5 million in the prior year’s first quarter. Reported revenues were $40.8 million in the Americas, down 16 percent; $17.8 million in Europe, down 23 percent; and $5.6 million in Asia Pacific, down 20 percent, all versus the prior year.
ISG reported a first-quarter operating loss of $2.4 million, compared with operating income of $7.1 million in the prior year. The firm’s reported first-quarter net loss was $3.4 million, compared with net income of $3.5 million in the prior year. Loss per fully diluted share was $0.07, compared with income per fully diluted share of $0.07 in the prior year.
Adjusted net income (a non-GAAP measure defined below under “Non-GAAP Financial Measures”) for the first quarter was $0.7 million, or $0.01 per share on a fully diluted basis, compared with adjusted net income of $6.0 million, or $0.12 per share on a fully diluted basis, in the prior year’s first quarter.
First-quarter adjusted EBITDA (a non-GAAP measure defined below under “Non-GAAP Financial Measures”) was $4.4 million, down 60 percent from the prior-year first quarter. Adjusted EBITDA margin (a non-GAAP measure calculated by dividing adjusted EBITDA by reported revenues) was 6.9 percent, compared with 14.0 percent in the prior year.
Other Financial and Operating Highlights
ISG generated $2.3 million of cash from operations in the first quarter, compared with using $3.4 million of cash in the first quarter last year. The firm’s cash balance totaled $14.0 million at March 31, 2024, down from $22.6 million at December 31, 2023.
During the first quarter, ISG paid dividends of $2.4 million, repurchased $2.5 million of shares and paid down debt of $5.0 million. As of March 31, 2024, ISG had $74.2 million in debt outstanding, down from $79.2 million at the end of last year.
2024 Second-Quarter Revenue and Adjusted EBITDA Guidance
“For the second quarter, ISG is targeting revenues of between $65 million and $67 million and adjusted EBITDA of between $7.0 million and $8.0 million. We will continue to monitor the macroeconomic environment, including the impact of FX, inflation and other factors, and adjust our business plans accordingly,” said Connors.
Quarterly Dividend
The ISG Board of Directors declared a second-quarter dividend of $0.045 per share, payable on July 5, 2024, to shareholders of record as of June 14, 2024.
“ISG remains committed to a disciplined capital allocation strategy that includes reinvesting in our business, managing our debt, returning capital to shareholders in the form of dividends and share repurchases, and supplementing our organic growth with strategic acquisitions to drive long-term shareholder value,” Connors said.
Conference Call
ISG has scheduled a call for 9 a.m., U.S. Eastern Time, Friday, May 10, 2024, to discuss the firm’s first-quarter results. The call can be accessed by dialing +1 (800) 715-9871, or, for international callers, by dialing +1 (646) 307-1963. The access code is 7294332. A recording of the conference call will be accessible on ISG’s website (www.isg-one.com ) for approximately four weeks following the call.
Forward-Looking Statements
This communication contains “forward-looking statements” which represent the current expectations and beliefs of management of ISG concerning future events and their potential effects. Statements contained herein including words such as “anticipate,” “believe,” “contemplate,” “plan,” “estimate,” “target,” “expect,” “intend,” “will,” “continue,” “should,” “may,” and other similar expressions are “forward-looking statements” under the Private Securities Litigation Reform Act of 1995. These forward-looking statements are not guarantees of future results and are subject to certain risks and uncertainties that could cause actual results to differ materially from those anticipated. Those risks relate to inherent business, economic and competitive uncertainties and contingencies relating to the businesses of ISG and its subsidiaries, including without limitation: (1) failure to secure new engagements or loss of important clients; (2) ability to hire and retain enough qualified employees to support operations; (3) ability to maintain or increase billing and utilization rates; (4) management of growth; (5) success of expansion internationally; (6) competition; (7) ability to move the product mix into higher margin businesses; (8) general political and social conditions such as war, political unrest and terrorism; (9) healthcare and benefit cost management; (10) ability to protect ISG and its subsidiaries’ intellectual property or data and the intellectual property or data of others; (11) currency fluctuations and exchange rate adjustments; (12) ability to successfully consummate or integrate strategic acquisitions; (13) outbreaks of diseases, including coronavirus, or similar public health threats or fear of such an event; and (14) potential terminations of engagements, delays or reductions in scope by clients. Certain of these and other applicable risks, cautionary statements and factors that could cause actual results to differ from ISG’s forward-looking statements are included in ISG’s filings with the U.S. Securities and Exchange Commission. ISG undertakes no obligation to update or revise any forward-looking statements to reflect subsequent events or circumstances.
Non-GAAP Financial Measures
ISG reports all financial information required in accordance with U.S. generally accepted accounting principles (GAAP). In this release, ISG has presented both GAAP financial results as well as non-GAAP information for the three months ended March 31, 2024, and March 31, 2023. ISG believes that evaluating its ongoing operating results will be enhanced if it discloses certain non-GAAP information. These non-GAAP financial measures exclude non-cash and certain other special charges that many investors believe may obscure the user’s overall understanding of ISG’s current financial performance and the Company’s prospects for the future. ISG believes that these non-GAAP measures provide useful information to investors because they improve the comparability of the financial results between periods and provide for greater transparency of key measures used to evaluate the Company’s performance.
ISG provides adjusted EBITDA (defined as net income, plus interest, taxes, depreciation and amortization, foreign currency transaction gains/losses, non-cash stock compensation, interest accretion associated with contingent consideration, acquisition-related costs, and severance, integration and other expense), adjusted net income (defined as net income, plus amortization of intangible assets, non-cash stock compensation, foreign currency transaction gains/losses, interest accretion associated with contingent consideration, acquisition-related costs, write-off of deferred financing cost and severance, integration and other expense on a tax-adjusted basis), adjusted net income per diluted share, adjusted EBITDA margin, and selected financial data on a constant currency basis which are non-GAAP measures that the Company believes provide useful information to both management and investors by excluding certain expenses and financial implications of foreign currency translations, which management believes are not indicative of ISG’s core operations. These non-GAAP measures are used by ISG to evaluate the Company’s business strategies and management’s performance.
We evaluate our results of operations on both an as reported and a constant currency basis. The constant currency presentation, which is a non-GAAP financial measure, excludes the impact of year-over-year fluctuations in foreign currency exchange rates. We believe providing constant currency information provides valuable supplemental information regarding our results of operations, thereby facilitating period-to-period comparisons of our business performance, and is consistent with how management evaluates the Company’s performance. We calculate constant currency percentages by converting our current and prior periods’ local currency financial results using the same point in time exchange rates and then comparing the adjusted current and prior period results. This calculation may differ from similarly titled measures used by others and, accordingly, the constant currency presentation is not meant to be a substitution for recorded amounts presented in conformity with GAAP, nor should such amounts be considered in isolation.
Management believes this information facilitates comparison of underlying results over time. Non-GAAP financial measures, when presented, are reconciled to the most closely applicable GAAP measure. Non-GAAP measures are provided as additional information and should not be considered in isolation or as a substitute for results prepared in accordance with GAAP. A reconciliation of the forward-looking non-GAAP estimates contained herein to the corresponding GAAP measures is not being provided, due to the unreasonable efforts required to prepare it.
About ISG
ISG (Information Services Group) (Nasdaq: III) is a leading global technology research and advisory firm. A trusted business partner to more than 900 clients, including more than 75 of the world’s top 100 enterprises, ISG is committed to helping corporations, public sector organizations, and service and technology providers achieve operational excellence and faster growth. The firm specializes in digital transformation services, including AI and automation, cloud and data analytics; sourcing advisory; managed governance and risk services; network carrier services; strategy and operations design; change management; market intelligence and technology research and analysis. Founded in 2006, and based in Stamford, Conn., ISG employs 1,600 digital-ready professionals operating in more than 20 countries—a global team known for its innovative thinking, market influence, deep industry and technology expertise, and world-class research and analytical capabilities based on the industry’s most comprehensive marketplace data. For more information, visit www.isg-one.com.
ESCONDIDO, Calif., May 09, 2024 (GLOBE NEWSWIRE) — One Stop Systems, Inc. (“OSS” or the “Company”) (Nasdaq: OSS), a leader in rugged Enterprise Class compute for artificial intelligence (AI), machine learning (ML) and sensor processing at the edge, reported results for the first quarter ended March 31, 2024. All quarterly comparisons are to the same year-ago period unless otherwise noted.
“Over the past year, we have focused on transitioning our business away from legacy media and niche enterprise customers to pursue emerging opportunities within large and growing defense and commercial markets,” stated OSS President and CEO, Mike Knowles. “While we expect the transition to take a couple more quarters to complete, I am encouraged by our performance during the 2024 first quarter, as consolidated revenue, bookings, gross margin, and EBITDA met or exceeded our plan. This is a testament to the focus we have employed and the investments we have made over the past year within our sales and product teams, and the diverse sales pipeline we are building. I want to thank everyone at OSS for their continued hard work during the quarter.”
“As we look to the remainder of 2024, we are excited by the long-term strategies we are pursuing to scale our business and drive profitable growth. Our OSS segment ended the first quarter with a book-to-bill ratio of 1.1 and we anticipate positive order trends will continue throughout the remainder of the year as our growing pipeline successfully converts to orders. In addition, we continue to focus on improving working capital efficiencies. Our efforts in the quarter generated $2.0 million of operating cash flow, increasing net cash and short-term investments by over $1 million from December 31, 2023. While certain market challenges in the short term may impact our second quarter results, we are focused on successfully returning to year-over-year revenue growth in the second half of 2024 and positive consolidated EBITDA in the coming quarters,” concluded Mr. Knowles.
First Quarter Operating and Customer Momentum
Won a pilot project to provide a liquid immersion-cooled data storage system for use on a deployable ground station. The project has begun, and is expected to lead to follow-on production orders in the coming quarters.
Received an order from an existing customer to design and manufacture a new ruggedized Liquid Cooling System for cooling self-driving technology in a commercial autonomous truck deployment. The initial order was valued at $300,000 for prototypes, and OSS expects to begin shipments later this year, with an additional order to follow this year.
Started shipping its latest Gen 5 4U Pro Accelerator System to a large composable infrastructure provider and expects shipments of this compute accelerator to total between $4 million and $6 million over the next three years.
Craig Powell, a proven sales executive bringing over 20 years of experience within international defense and C5ISR market verticals, joined the Company as Business Development Executive.
2024 First Quarter Financial Summary
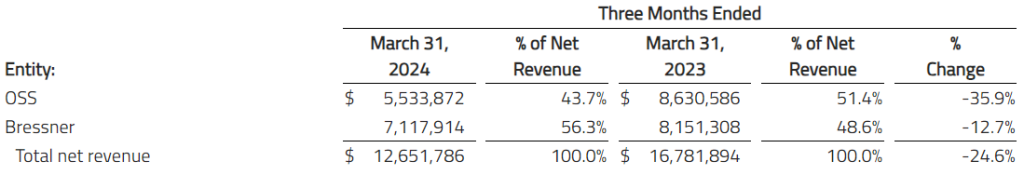
Consolidated revenue was $12.7 million, a 24.6% decline from the prior year period. The year-over-year reduction in revenue was primarily a result of quarterly order fluctuations from a large defense customer and approximately $1.5 million related to a former media customer. Lower first-quarter revenue was partially offset by approximately $1.9 million in incremental revenue to an existing aerospace customer, and $0.6 million in additional revenue to an existing autonomous truck customer. Bressner segment revenue was $7.1 million, a 12.7% decline from the prior year period, primarily due to the expected discontinuance of and delays in certain programs.
The following table sets forth net revenue by product category for the three months ended March 31, 2024, and March 31, 2023, by segment:
Gross margin percentage was 29.4%, as compared to 30.2% in the same year-ago quarter. OSS segment gross margin was 34.2%, a reduction of 2.1 percentage points from the same period a year ago, primarily due to a less profitable mix of revenue. Bressner gross margin improved 1.9 percentage points to 25.7%, primarily due to a more favorable mix of revenue.
Total operating expenses decreased 5.4% to $5.0 million. This decrease was predominantly attributable to the elimination of costs associated with organizational restructuring and outside professional services, as well as reduced R&D expenses, partially offset by higher marketing and selling expenses during the quarter.
OSS reported a net loss of $1.3 million, or $0.06 per share, as compared to a net loss of $401,000, or $0.02 per share in the prior year. The Company reported a non-GAAP net loss of $931,000, or $0.04 per share, compared to non-GAAP net income of $90,000, or $0.00 per diluted share.
Adjusted EBITDA, a non-GAAP metric, was a loss of $456,000, a decrease from adjusted EBITDA of $633,000 in the prior year first quarter.
As of March 31, 2024, OSS reported cash and short-term investments of $12.9 million, and total working capital of $34.3 million, compared to cash and short-term investments of $11.8 million, and total working capital of $35.6 million at December 31, 2023.
Outlook
The Company anticipates revenue of approximately $13.0 million in the second quarter of 2024. The Company’s revenue guidance for the second quarter of 2024 includes expected program delays from certain defense customers as a result of the prolonged U.S. government budgeting process and continuing resolution for fiscal year 2024, and softer European customer demand over the near-term.
While the Company expects revenue in the second quarter will be down on a year-over-year basis, management anticipates sequential revenue growth throughout the year. This will be supported by a continued positive book-to-bill ratio, as OSS executes on converting its growing opportunity pipeline. In addition, European demand is expected to improve in the second half of 2024, and higher bookings in the Company’s core OSS business is expected to support year-over-year revenue growth and positive consolidated EBITDA in the coming quarters.
Conference Call
OSS will hold a conference call to discuss its results for the first quarter of 2024 followed by a question-and-answer period.
Date: Thursday, May 9, 2024 Time: 5:00 p.m. ET (2:00 p.m. PT) Toll-free dial-in: 800-901-2707 International dial-in: 785-424-1629 Conference ID: ONESTOP (required for entry) Webcast: https://viavid.webcasts.com/starthere.jsp?ei=1667836&tp_key=45b15714d0
A replay of the call will be available after 8:00 p.m. ET on May 9, 2024, through May 23, 2024.
Toll-free replay: 844-512-2921 International replay: 412-317-6671 Passcode: 11155784
About One Stop Systems
One Stop Systems, Inc. (Nasdaq: OSS) is a leader in AI enabled solutions for the demanding ‘edge’. OSS designs and manufactures Enterprise Class compute and storage products that enable rugged AI, sensor fusion and autonomous capabilities without compromise. These hardware and software platforms bring the latest data center performance to harsh and challenging applications, whether they are on land, sea or in the air.
OSS products include ruggedized servers, compute accelerators, flash storage arrays, and storage acceleration software. These specialized compact products are used across multiple industries and applications, including autonomous trucking and farming, as well as aircraft, drones, ships and vehicles within the defense industry.
OSS solutions address the entire AI workflow, from high-speed data acquisition to deep learning, training and large-scale inference, and have delivered many industry firsts for industrial OEM and government customers.
As the fastest growing segment of the multi-billion-dollar edge computing market, AI enabled solutions require-and OSS delivers-the highest level of performance in the most challenging environments without compromise.
OSS products are available directly or through global distributors. For more information, go to www.onestopsystems.com. You can also follow OSS on X, YouTube, and LinkedIn.
Non-GAAP Financial Measures
We believe that the use of adjusted earnings before interest, taxes, depreciation and amortization, or adjusted EBITDA, is helpful for an investor to assess the performance of the Company. The Company defines adjusted EBITDA as income (loss) before interest, taxes, depreciation, amortization, acquisition expenses, impairment of long-lived assets, financing costs, fair value adjustments from purchase accounting, stock-based compensation expense and expenses related to discontinued operations.
Adjusted EBITDA is not a measurement of financial performance under generally accepted accounting principles in the United States, or GAAP. Because of varying available valuation methodologies, subjective assumptions and the variety of equity instruments that can impact a company’s non-cash operating expenses, we believe that providing a non-GAAP financial measure that excludes non-cash and non-recurring expenses allows for meaningful comparisons between our core business operating results and those of other companies, as well as providing us with an important tool for financial and operational decision making and for evaluating our own core business operating results over different periods of time.
Our adjusted EBITDA measure may not provide information that is directly comparable to that provided by other companies in our industry, as other companies in our industry may calculate non-GAAP financial results differently, particularly related to non-recurring, unusual items. Our adjusted EBITDA is not a measurement of financial performance under GAAP and should not be considered as an alternative to operating income or as an indication of operating performance or any other measure of performance derived in accordance with GAAP. We do not consider adjusted EBITDA to be a substitute for, or superior to, the information provided by GAAP financial results.
One Stop Systems, Inc. (OSS) designs and manufactures innovative AI Transportable edge computing modules and systems, including ruggedized servers, compute accelerators, expansion systems, flash storage arrays, and Ion Accelerator™ SAN, NAS, and data recording software for AI workflows. These products are used for AI data set capture, training, and large-scale inference in the defense, oil and gas, mining, autonomous vehicles, and rugged entertainment applications. OSS utilizes the power of PCI Express, the latest GPU accelerators and NVMe storage to build award-winning systems, including many industry firsts, for industrial OEMs and government customers. The company enables AI on the Fly® by bringing AI datacenter performance to ‘the edge,’ especially on mobile platforms, and by addressing the entire AI workflow, from high-speed data acquisition to deep learning, training, and inference. OSS products are available directly or through global distributors. For more information, go to www.onestopsystems.com.
Joe Gomes, Managing Director, Equity Research Analyst, Generalist , Noble Capital Markets, Inc.
Joshua Zoepfel, Research Associate, Noble Capital Markets, Inc.
Refer to the full report for the price target, fundamental analysis, and rating.
Ongoing Transition. The transition of OSS towards opportunities in growing defense and commercial markets and away from the legacy media company is ongoing, although the uncertain economic environment and delayed federal government budget approvals are slowing the process down. Nonetheless, we expect OSS to return to y-o-y revenue growth in the second half. Notably, book-to-bill in the OSS segment was 1.1x for the quarter.
1Q24 Results. Revenue of $12.7 million declined 24.6%, partly due to the absence of Disguise revenue but also delays in orders from a key customer. Gross margin of 29.4% declined 80bp y-o-y. OSS reported a GAAP net loss of $1.34 million, or a loss of $0.06/sh and an adjusted loss of $0.04/sh, compared to a net loss of $400,500, or a loss of $0.02/sh and an adjusted breakeven, in 1Q23. We had estimated revenue of $12.5 million, a GAAP loss of $0.07/sh, and adjusted loss of $0.04/sh.
Equity Research is available at no cost to Registered users of Channelchek. Not a Member? Click ‘Join’ to join the Channelchek Community. There is no cost to register, and we never collect credit card information.
This Company Sponsored Research is provided by Noble Capital Markets, Inc., a FINRA and S.E.C. registered broker-dealer (B/D).
*Analyst certification and important disclosures included in the full report. NOTE: investment decisions should not be based upon the content of this research summary. Proper due diligence is required before making any investment decision.
ISG (Information Services Group) (Nasdaq: III) is a leading global technology research and advisory firm. A trusted business partner to more than 700 clients, including more than 75 of the world’s top 100 enterprises, ISG is committed to helping corporations, public sector organizations, and service and technology providers achieve operational excellence and faster growth. The firm specializes in digital transformation services, including automation, cloud and data analytics; sourcing advisory; managed governance and risk services; network carrier services; strategy and operations design; change management; market intelligence and technology research and analysis. Founded in 2006, and based in Stamford, Conn., ISG employs more than 1,300 digital-ready professionals operating in more than 20 countries—a global team known for its innovative thinking, market influence, deep industry and technology expertise, and world-class research and analytical capabilities based on the industry’s most comprehensive marketplace data. For additional information, visit www.ISG-One.com
Joe Gomes, Managing Director, Equity Research Analyst, Generalist , Noble Capital Markets, Inc.
Joshua Zoepfel, Research Associate, Noble Capital Markets, Inc.
Refer to the full report for the price target, fundamental analysis, and rating.
Results. Revenue was reported at $64.3 million, down 18% from $78.5 million in the previous year. We estimated revenue of $66 million. Continued slower client decision making meant revenue is being pushed into later quarters. Net loss for the quarter was $3.4 million, or a loss of $0.07 per share, compared to net income of $3.5 million, or $0.07 per share last year. We estimated a net loss of $0.7 million, or a loss of $0.01 per share.
Recurring Revenue and Tango. Recurring revenues for the Company continue to grow, accounting for about half of ISG’s revenues in 1Q24. For the trailing 12 months, recurring revenues totaled $126 million, up 10% from the previous 12-month period. We expect recurring revenues to continue to grow with management’s focus on growing platforms such as ISG GovernX and ISG ProBenchmark. With the launch of the next-gen sourcing platform ISG Tango in March, the Company is already seeing the platform gaining interest, as over $2.6 billion of contract value is already running on the platform.
Equity Research is available at no cost to Registered users of Channelchek. Not a Member? Click ‘Join’ to join the Channelchek Community. There is no cost to register, and we never collect credit card information.
This Company Sponsored Research is provided by Noble Capital Markets, Inc., a FINRA and S.E.C. registered broker-dealer (B/D).
*Analyst certification and important disclosures included in the full report. NOTE: investment decisions should not be based upon the content of this research summary. Proper due diligence is required before making any investment decision.
Third Quarter of Fiscal Year 2024 – Consolidated Earnings Highlights
Revenue of $376.4 million
Net income of $8.6 million
Adjusted EBITDA* of $46.6 million
Raising Fiscal Year 2024 Guidance Ranges:
Revenue expected in a range of $1.25 billion to $1.3 billion vs prior range of $1.23 billion to $1.3 billion
Net loss expected in a range of $34 million to $21 million vs prior range of $45 million to $22 million
Adjusted EBITDA* expected in a range of $100 million to $110 million vs prior range of $90 million to $105 million
Third Quarter of Fiscal Year 2024 – Segment Highlights
Senior
Revenue of $204.3 million
Adjusted EBITDA* of $61.5 million
Approved Medicare Advantage policies of 185,716
Healthcare Services
Revenue of $124.2 million
Adjusted EBITDA* of $1.6 million
Over 75,000 SelectRx members
Life
Revenue of $40.7 million
Adjusted EBITDA* of $3.1 million
Auto & Home
Revenue of $9.1 million
Adjusted EBITDA* of $3.6 million
OVERLAND PARK, Kan.–(BUSINESS WIRE)– SelectQuote, Inc. (NYSE: SLQT) reported consolidated revenue for the third quarter of fiscal year 2024 of $376.4 million, compared to consolidated revenue for the third quarter of fiscal year 2023 of $299.4 million. Consolidated net income for the third quarter of fiscal year 2024 was $8.6 million, compared to consolidated net income for the third quarter of fiscal year 2023 of $9.3 million. Finally, consolidated Adjusted EBITDA* for the third quarter of fiscal year 2024 was $46.6 million, compared to consolidated Adjusted EBITDA* for the third quarter of fiscal year 2023 of $44.0 million.
Chief Executive Officer Tim Danker commented, “SelectQuote outperformed our own expectations for the 9th consecutive quarter, and the company has never been better positioned to drive shareholder value. We firmly believe SelectQuote can amplify the strong operating results achieved over the past two years since our foundational strategic redesign.”
“Our Senior business completed another highly successful Medicare Advantage busy season in the quarter, which produced stable and attractive economics across both policy growth, LTV expansion, and operating efficiency. The segment’s core tenured agents helped over 185,000 Americans find the right Medicare Advantage policy and did so with strong overall cost per policy and efficient close rates, which drove a Senior Adjusted EBITDA margin above 30% in one of our highest open enrollment period (OEP) quarters for revenue in company history. The success in our Senior business also enhanced the continued expansion of our Healthcare Services business, which saw SelectRx grow by over 12,000 members, significantly exceeding our original outlook. Overall, our holistic healthcare platform created new customers at a highly efficient revenue to customer acquisition cost of over 4x, which will drive significant Adjusted EBITDA contribution as Healthcare Services continues to scale.”
Mr. Danker concluded, “The teams at SelectQuote and our leadership are energized about the successes experienced year-to-date. We have conviction that 2024 will prove to be an inflection point in our company’s history, and SelectQuote is poised to leverage our unique healthcare platform to drive attractive returns for our shareholders in the quarters and years ahead.”
Segment Results
We currently report on four segments: 1) Senior, 2) Healthcare Services, 3) Life, and 4) Auto & Home. The performance measures of the segments include total revenue, Adjusted EBITDA,* and Adjusted EBITDA Margin.* Costs of revenue, cost of goods sold-pharmacy revenue, marketing and advertising, selling, general, and administrative, and technical development operating expenses that are directly attributable to a segment are reported within the applicable segment. Indirect costs of revenue, marketing and advertising, selling, general, and administrative, and technical development operating expenses are allocated to each segment based on varying metrics such as headcount. Adjusted EBITDA is calculated as total revenue for the applicable segment less direct and allocated costs of revenue, cost of goods sold, marketing and advertising, technical development, and selling, general, and administrative operating costs and expenses, excluding depreciation and amortization expense; gain or loss on disposal of property, equipment, and software; share-based compensation expense; and non-recurring expenses such as severance payments and transaction costs.
Senior
Financial Results
The following table provides the financial results for the Senior segment for the periods presented:
Three Months Ended March 31,
Nine Months Ended March 31,
(in thousands)
2024
2023
% Change
2024
2023
% Change
Revenue
$
204,259
$
185,200
10
%
$
541,705
$
486,541
11
%
Adjusted EBITDA*
61,494
59,166
4
%
138,871
138,933
—
%
Adjusted EBITDA Margin*
30
%
32
%
26
%
29
%
Operating Metrics
Submitted Policies
Submitted policies are counted when an individual completes an application with our licensed agent and provides authorization to the agent to submit the application to the insurance carrier partner. The applicant may have additional actions to take before the application will be reviewed by the insurance carrier.
The following table shows the number of submitted policies for the periods presented:
Three Months Ended March 31,
Nine Months Ended March 31,
2024
2023
% Change
2024
2023
% Change
Medicare Advantage
226,692
196,372
15
%
602,936
538,247
12
%
Medicare Supplement
650
675
(4
)%
2,334
2,905
(20
)%
Dental, Vision and Hearing
16,588
21,175
(22
)%
48,892
59,513
(18
)%
Prescription Drug Plan
665
416
60
%
2,696
2,082
29
%
Other
774
1,864
(58
)%
3,724
5,402
(31
)%
Total
245,369
220,502
11
%
660,582
608,149
9
%
*See “Non-GAAP Financial Measures” below.
Approved Policies
Approved policies represents the number of submitted policies that were approved by our insurance carrier partners for the identified product during the indicated period. Not all approved policies will go in force.
The following table shows the number of approved policies for the periods presented:
Three Months Ended March 31,
Nine Months Ended March 31,
2024
2023
% Change
2024
2023
% Change
Medicare Advantage
185,716
165,530
12
%
517,973
467,540
11
%
Medicare Supplement
445
557
(20
)%
1,578
2,184
(28
)%
Dental, Vision and Hearing
14,042
16,968
(17
)%
41,474
47,940
(13
)%
Prescription Drug Plan
1,114
521
114
%
2,684
1,794
50
%
Other
789
1,029
(23
)%
2,834
3,932
(28
)%
Total
202,106
184,605
9
%
566,543
523,390
8
%
Lifetime Value of Commissions per Approved Policy
Lifetime value of commissions per approved policy represents commissions estimated to be collected over the estimated life of an approved policy based on multiple factors, including but not limited to, contracted commission rates, carrier mix and expected policy persistency with applied constraints. The lifetime value of commissions per approved policy is equal to the sum of the commission revenue due upon the initial sale of a policy, and when applicable, an estimate of future renewal commissions.
The following table shows the lifetime value of commissions per approved policy for the periods presented:
Three Months Ended March 31,
Nine Months Ended March 31,
(dollars per policy):
2024
2023
% Change
2024
2023
% Change
Medicare Advantage
$
995
$
965
3
%
$
923
$
888
4
%
Medicare Supplement
1,271
871
46
%
1,108
994
11
%
Dental, Vision and Hearing
101
91
11
%
100
95
5
%
Prescription Drug Plan
237
194
22
%
237
211
12
%
Other
36
123
(71
)%
(3
)
100
(103
)%
Healthcare Services
Financial Results
The following table provides the financial results for the Healthcare Services segment for the periods presented:
Three Months Ended March 31,
Nine Months Ended March 31,
(in thousands)
2024
2023
% Change
2024
2023
% Change
Revenue
$
124,207
$
70,725
76
%
$
333,284
$
169,270
97
%
Adjusted EBITDA*
1,609
(3,366
)
148
%
6,911
(24,456
)
128
%
Adjusted EBITDA Margin*
1
%
(5
)%
2
%
(14
)%
*See “Non-GAAP Financial Measures” below.
Operating Metrics
Total Members
The total number of SelectRx members represents the amount of customers to which an order has been shipped, as this is the primary key driver of revenue for Healthcare Services.
The following table shows the total number of SelectRx members for the date presented:
March 31, 2024
March 31, 2023
Total SelectRx Members
75,074
44,993
Prescriptions Per Day
Prescriptions per day represents the total average prescriptions shipped per business day, as this is a primary key driver of revenue for Healthcare Services.
The following table shows the prescriptions shipped per day for the periods presented:
Three Months Ended March 31,
Nine Months Ended March 31,
2024
2023
2024
2023
Prescriptions Per Day
20,216
11,737
17,582
9,753
Combined Senior and Healthcare Services – Consumer Per Unit Economics
The opportunity to leverage our existing database and distribution model to improve access to healthcare services for our consumers has created a need for us to review our key metrics related to our per unit economics. As we think about the revenue and expenses for Healthcare Services, we note that they are derived from the marketing acquisition costs associated with the sale of an MA or MS policy, some of which costs are allocated directly to Healthcare Services, and therefore determined that our per unit economics measure should include components from both Senior and Healthcare Services. See details of revenue and expense items included in the calculation below.
Combined Senior and Healthcare Services consumer per unit economics represents total MA and MS commissions; other product commissions; other revenues, including revenues from Healthcare Services; and operating expenses associated with Senior and Healthcare Services, each shown per number of approved MA and MS policies over a given time period. Management assesses the business on a per-unit basis to help ensure that the revenue opportunity associated with a successful policy sale is attractive relative to the marketing acquisition cost. Because not all acquired leads result in a successful policy sale, all per-policy metrics are based on approved policies, which is the measure that triggers revenue recognition.
The MA and MS commission per MA/MS policy represents the LTV for policies sold in the period. Other commission per MA/MS policy represents the LTV for other products sold in the period, including DVH prescription drug plan, and other products, which management views as additional commission revenue on our agents’ core function of MA/MS policy sales. Pharmacy revenue per MA/MS policy represents revenue from SelectRx, and other revenue per MA/MS policy represents revenue from Population Health, production bonuses, marketing development funds, lead generation revenue, and adjustments from the Company’s reassessment of its cohorts’ transaction prices. Total operating expenses per MA/MS policy represents all of the operating expenses within Senior and Healthcare Services. The revenue to customer acquisition cost (“CAC”) multiple represents total revenue as a multiple of total marketing acquisition costs, which represents the direct costs of acquiring leads. These costs are included in marketing and advertising expense within the total operating expenses per MA/MS policy.
The following table shows combined Senior and Healthcare Services consumer per unit economics for the periods presented. Based on the seasonality of Senior and the fluctuations between quarters, we believe that the most relevant view of per unit economics is on a rolling 12-month basis. All per MA/MS policy metrics below are based on the sum of approved MA/MS policies, as both products have similar commission profiles.
Twelve Months Ended March 31,
(dollars per approved policy):
2024
2023
Medicare Advantage and Medicare Supplement approved policies
630,013
586,238
Medicare Advantage and Medicare Supplement commission per MA/MS policy
$
907
$
886
Other commission per MA/MS policy
10
15
Pharmacy revenue per MA/MS policy
641
320
Other revenue per MA/MS policy
126
66
Total revenue per MA/MS policy
1,684
1,287
Total operating expenses per MA/MS policy
(1,425
)
(1,167
)
Adjusted EBITDA per MA/MS policy (1)
$
259
$
120
Adjusted EBITDA Margin per MA/MS policy (1)
15
%
9
%
Revenue/CAC multiple
4.2
X
3.5
X
(1) These financial measures are not calculated in accordance with GAAP. See “Management’s Discussion and Analysis of Financial Condition and Results of Operations—Non-GAAP Financial Measures” in the Company’s Quarterly Report on Form 10-Q for information regarding our use of these non-GAAP financial measures and a reconciliation of such measures to their nearest comparable financial measures calculated and presented in accordance with GAAP.
Total revenue per MA/MS policy increased 31% for the twelve months ended March 31, 2024, compared to the twelve months ended March 31, 2023, primarily due to the increase in pharmacy revenue. Total operating expenses per MA/MS policy increased 22% for the twelve months ended March 31, 2024, compared to the twelve months ended March 31, 2023, primarily driven by increase in cost of goods sold-pharmacy revenue for SelectRx due to the growth of the business.
Life
Financial Results
The following table provides the financial results for the Life segment for the periods presented:
Three Months Ended March 31,
Nine Months Ended March 31,
(in thousands)
2024
2023
% Change
2024
2023
% Change
Revenue
$
40,686
$
36,950
10
%
$
115,855
$
107,780
7
%
Adjusted EBITDA*
3,138
5,303
(41
)%
12,945
16,371
(21
)%
Adjusted EBITDA Margin*
8
%
14
%
11
%
15
%
Operating Metrics
Life premium represents the total premium value for all policies that were approved by the relevant insurance carrier partner and for which the policy document was sent to the policyholder and payment information was received by the relevant insurance carrier partner during the indicated period. Because our commissions are earned based on a percentage of total premium, total premium volume for a given period is the key driver of revenue for our Life segment.
*See “Non-GAAP Financial Measures” below.
The following table shows term and final expense premiums for the periods presented:
Three Months Ended March 31,
Nine Months Ended March 31,
(in thousands)
2024
2023
% Change
2024
2023
% Change
Term Premiums
$
16,788
$
17,512
(4
)%
$
52,376
$
48,433
8
%
Final Expense Premiums
23,724
19,308
23
%
62,811
58,766
7
%
Total
$
40,512
$
36,820
10
%
115,187
107,199
7
%
Auto & Home
Financial Results
The following table provides the financial results for the Auto & Home segment for the periods presented:
Three Months Ended March 31,
Nine Months Ended March 31,
(in thousands)
2024
2023
% Change
2024
2023
% Change
Revenue
$
9,134
$
8,238
11
%
$
28,649
$
23,128
24
%
Adjusted EBITDA*
3,609
2,591
39
%
11,654
7,315
59
%
Adjusted EBITDA Margin*
40
%
31
%
41
%
32
%
Operating Metrics
Auto & Home premium represents the total premium value of all new policies that were approved by our insurance carrier partners during the indicated period. Because our commissions are earned based on a percentage of total premium, total premium volume for a given period is the key driver of revenue for our Auto & Home segment.
The following table shows premiums for the periods presented:
Three Months Ended March 31,
Nine Months Ended March 31,
(in thousands):
2024
2023
% Change
2024
2023
% Change
Premiums
$
14,180
$
12,828
11
%
$
42,746
$
36,456
17
%
Amendment to Credit Agreement
On May 8, 2024, the Company and its lenders agreed to amend the Company’s credit agreement to extend the maturity date with respect to $683.8 million of extended term loans from February 15, 2025 to May 15, 2025. The amendment also provides for a minimum asset coverage ratio and minimum liquidity requirements for the extension period. Additional information regarding the amendment will be included in the Company’s Quarterly Report on Form 10-Q for the period ended March 31, 2024.
Earnings Conference Call
SelectQuote, Inc. will host a conference call with the investment community today, Thursday, May 9, 2024, beginning at 9:00 a.m. ET. To register for this conference call, please use this link: https://www.netroadshow.com/events/login?show=2a79382d&confId=63927. After registering, a confirmation will be sent via email, including dial-in details and unique conference call codes for entry. Registration is open through the live call, but to ensure you are connected for the full call we suggest registering at least 10 minutes before the start of the call. The event will also be webcasted live via our investor relations website https://ir.selectquote.com/investor-home/default.aspx.
*See “Non-GAAP Financial Measures” below.
Non-GAAP Financial Measures
This release includes certain non-GAAP financial measures intended to supplement, not substitute for, comparable GAAP measures. To supplement our financial statements presented in accordance with GAAP and to provide investors with additional information regarding our GAAP financial results, we have presented in this release Adjusted EBITDA and Adjusted EBITDA Margin, which are non-GAAP financial measures. These non-GAAP financial measures are not based on any standardized methodology prescribed by GAAP and are not necessarily comparable to similarly titled measures presented by other companies. We define Adjusted EBITDA as income (loss) before interest expense, income tax expense (benefit), depreciation and amortization, and certain add-backs for non-cash or non-recurring expenses, including restructuring and share-based compensation expenses. The most directly comparable GAAP measure is net income (loss). We define Adjusted EBITDA Margin as Adjusted EBITDA divided by revenue. The most directly comparable GAAP measure is net income margin. We monitor and have presented in this release Adjusted EBITDA and Adjusted EBITDA Margin because they are key measures used by our management and Board of Directors to understand and evaluate our operating performance, to establish budgets and to develop operational goals for managing our business. In particular, we believe that excluding the impact of these expenses in calculating Adjusted EBITDA can provide a useful measure for period-to-period comparisons of our core operating performance.
We believe that these non-GAAP financial measures help identify underlying trends in our business that could otherwise be masked by the effect of the expenses that we exclude in the calculations of these non-GAAP financial measures. Accordingly, we believe these financial measures provide useful information to investors and others in understanding and evaluating our operating results, enhancing the overall understanding of our past performance and future prospects. Reconciliations of the differences between the non-GAAP financial measures included herein and their most directly comparable GAAP financial measures are set forth below beginning on page 12.
Forward Looking Statements
This release contains forward-looking statements. These forward-looking statements reflect our current views with respect to, among other things, future events and our financial performance. These statements are often, but not always, made through the use of words or phrases such as “may,” “should,” “could,” “predict,” “potential,” “believe,” “will likely result,” “expect,” “continue,” “will,” “anticipate,” “seek,” “estimate,” “intend,” “plan,” “projection,” “would” and “outlook,” or the negative version of those words or other comparable words or phrases of a future or forward-looking nature. These forward-looking statements are not historical facts, and are based on current expectations, estimates, and projections about our industry, management’s beliefs and certain assumptions made by management, many of which, by their nature, are inherently uncertain and beyond our control. Accordingly, we caution you that any such forward-looking statements are not guarantees of future performance and are subject to risks, assumptions and uncertainties that are difficult to predict. Although we believe that the expectations reflected in these forward-looking statements are reasonable as of the date made, actual results may prove to be materially different from the results expressed or implied by the forward-looking statements.
There are or will be important factors that could cause our actual results to differ materially from those indicated in these forward-looking statements, including, but not limited to, the following: the impacts of the COVID-19 pandemic and any other public health events, our reliance on a limited number of insurance carrier partners and any potential termination of those relationships or failure to develop new relationships; existing and future laws and regulations affecting the health insurance market; changes in health insurance products offered by our insurance carrier partners and the health insurance market generally; insurance carriers offering products and services directly to consumers; changes to commissions paid by insurance carriers and underwriting practices; competition with brokers, including exclusively online brokers and carriers who opt to sell policies directly to consumers; competition from government-run health insurance exchanges; developments in the U.S. health insurance system; our dependence on revenue from carriers in our senior segment and downturns in the senior health as well as life, automotive and home insurance industries; our ability to develop new offerings and penetrate new vertical markets; risks from third-party products; failure to enroll individuals during the Medicare annual enrollment period; our ability to attract, integrate and retain qualified personnel; our dependence on lead providers and ability to compete for leads; failure to obtain and/or convert sales leads to actual sales of insurance policies; access to data from consumers and insurance carriers; accuracy of information provided from and to consumers during the insurance shopping process; cost-effective advertisement through internet search engines; ability to contact consumers and market products by telephone; global economic conditions, including inflation; disruption to operations as a result of future acquisitions; significant estimates and assumptions in the preparation of our financial statements; impairment of goodwill; potential litigation and other legal proceedings or inquiries; our existing and future indebtedness; our ability to maintain compliance with our debt covenants and meet our scheduled repayment obligations under our debt arrangements; our ability to access additional capital on acceptable terms; failure to protect our intellectual property and our brand; fluctuations in our financial results caused by seasonality; accuracy and timeliness of commissions reports from insurance carriers; timing of insurance carriers’ approval and payment practices; factors that impact our estimate of the constrained lifetime value of commissions per policyholder; changes in accounting rules, tax legislation and other legislation; disruptions or failures of our technological infrastructure and platform; failure to maintain relationships with third-party service providers; cybersecurity breaches or other attacks involving our systems or those of our insurance carrier partners or third-party service providers; our ability to protect consumer information and other data; failure to market and sell Medicare plans effectively or in compliance with laws; and other factors related to our pharmacy business, including manufacturing or supply chain disruptions, access to and demand for prescription drugs, and regulatory changes or other industry developments that may affect our pharmacy operations. For a further discussion of these and other risk factors that could impact our future results and performance, see the section entitled “Risk Factors” in the most recent Annual Report on Form 10-K and subsequent periodic reports filed by us with the Securities and Exchange Commission. Accordingly, you should not place undue reliance on any such forward-looking statements. Any forward-looking statement speaks only as of the date on which it is made, and, except as otherwise required by law, we do not undertake any obligation to publicly update or review any forward-looking statement, whether as a result of new information, future developments or otherwise.
About SelectQuote:
Founded in 1985, SelectQuote (NYSE: SLQT) provides solutions that help consumers protect their most valuable assets: their families, health, and property. The company pioneered the model of providing unbiased comparisons from multiple, highly-rated insurance companies allowing consumers to choose the policy and terms that best meet their unique needs. Two foundational pillars underpin SelectQuote’s success: a strong force of highly-trained and skilled agents who provide a consultative needs analysis for every consumer, and proprietary technology that sources and routes high-quality leads.
With an ecosystem offering high touchpoints for consumers across insurance, medicare, pharmacy, and value-based care, the company now has four core business lines: SelectQuote Senior, SelectQuote Healthcare Services, SelectQuote Life, and SelectQuote Auto and Home. SelectQuote Senior serves the needs of a demographic that sees around 10,000 people turn 65 each day with a range of Medicare Advantage and Medicare Supplement plans. SelectQuote Healthcare Services is comprised of the SelectRx Pharmacy, a Patient-Centered Pharmacy Home™ (PCPH) accredited pharmacy, and Population Health, which proactively connects consumers with a wide breadth of healthcare services supporting their needs..
SELECTQUOTE, INC. AND SUBSIDIARIESCONDENSED CONSOLIDATED BALANCE SHEETS(Unaudited)(In thousands)
March 31, 2024
June 30, 2023
ASSETS
CURRENT ASSETS:
Cash and cash equivalents
$
37,808
$
83,156
Accounts receivable, net of allowances of $6.5 million and $2.7 million, respectively
253,083
154,565
Commissions receivable-current
69,165
111,148
Other current assets
24,115
14,355
Total current assets
384,171
363,224
COMMISSIONS RECEIVABLE—Net
763,958
729,350
PROPERTY AND EQUIPMENT—Net
22,536
27,452
SOFTWARE—Net
13,952
14,740
OPERATING LEASE RIGHT-OF-USE ASSETS
19,341
23,563
INTANGIBLE ASSETS—Net
7,926
10,200
GOODWILL
29,136
29,136
OTHER ASSETS
4,119
21,586
TOTAL ASSETS
$
1,245,139
$
1,219,251
LIABILITIES AND SHAREHOLDERS’ EQUITY
CURRENT LIABILITIES:
Accounts payable
$
61,168
$
27,577
Accrued expenses
21,058
16,993
Accrued compensation and benefits
57,483
49,966
Operating lease liabilities—current
4,663
5,175
Current portion of long-term debt
37,717
33,883
Contract liabilities
3,655
1,691
Other current liabilities
4,227
1,972
Total current liabilities
189,971
137,257
LONG-TERM DEBT, NET—less current portion
648,331
664,625
DEFERRED INCOME TAXES
35,057
39,581
OPERATING LEASE LIABILITIES
22,326
27,892
OTHER LIABILITIES
2,649
2,926
Total liabilities
898,334
872,281
COMMITMENTS AND CONTINGENCIES
SHAREHOLDERS’ EQUITY:
Common stock, $0.01 par value
1,692
1,669
Additional paid-in capital
577,389
567,266
Accumulated deficit
(238,752
)
(235,644
)
Accumulated other comprehensive income
6,476
13,679
Total shareholders’ equity
346,805
346,970
TOTAL LIABILITIES AND SHAREHOLDERS’ EQUITY
$
1,245,139
$
1,219,251
SELECTQUOTE, INC. AND SUBSIDIARIESCONDENSED CONSOLIDATED STATEMENTS OF COMPREHENSIVE LOSS(Unaudited)(In thousands)
Three Months Ended March 31,
Nine Months Ended March 31,
2024
2023
2024
2023
REVENUE:
Commission
$
230,763
$
197,258
$
611,744
533,627
Pharmacy
120,282
66,948
323,865
159,641
Other
25,355
35,192
78,958
87,802
Total revenue
376,400
299,398
1,014,567
781,070
OPERATING COSTS AND EXPENSES:
Cost of revenue
84,315
79,186
254,250
235,827
Cost of goods sold—pharmacy revenue
106,172
62,302
284,360
154,753
Marketing and advertising
109,276
90,205
288,676
237,724
Selling, general, and administrative
34,971
27,544
97,049
86,662
Technical development
8,604
6,434
24,291
18,860
Total operating costs and expenses
343,338
265,671
948,626
733,826
INCOME FROM OPERATIONS
33,062
33,727
65,941
47,244
INTEREST EXPENSE, NET
(24,330
)
(21,105
)
(70,141
)
(58,885
)
OTHER INCOME (EXPENSE,) NET
(12
)
(206
)
(51
)
(118
)
INCOME (LOSS) BEFORE INCOME TAX EXPENSE (BENEFIT)
8,720
12,416
(4,251
)
(11,759
)
INCOME TAX EXPENSE (BENEFIT)
169
3,152
(1,143
)
(1,053
)
NET INCOME (LOSS)
$
8,551
$
9,264
$
(3,108
)
(10,706
)
NET INCOME (LOSS) PER SHARE:
Basic
$
0.05
$
0.06
$
(0.02
)
$
(0.06
)
Diluted
$
0.05
$
0.06
$
(0.02
)
$
(0.06
)
WEIGHTED-AVERAGE COMMON STOCK OUTSTANDING USED IN PER SHARE AMOUNTS:
Basic
169,070
166,543
168,291
165,951
Diluted
170,956
167,905
168,291
165,951
OTHER COMPREHENSIVE INCOME (LOSS) NET OF TAX:
Gain (loss) on cash flow hedge
(1,771
)
(2,661
)
(7,203
)
1,358
OTHER COMPREHENSIVE INCOME (LOSS)
(1,771
)
(2,661
)
(7,203
)
1,358
COMPREHENSIVE INCOME (LOSS)
$
6,780
$
6,603
$
(10,311
)
$
(9,348
)
SELECTQUOTE, INC. AND SUBSIDIARIESCONDENSED CONSOLIDATED STATEMENTS OF CASH FLOWS(Unaudited)(In thousands)
Nine Months Ended March 31,
2024
2023
CASH FLOWS FROM OPERATING ACTIVITIES:
Net loss
$
(3,108
)
$
(10,706
)
Adjustments to reconcile net loss to net cash and cash equivalents used in operating activities:
Depreciation and amortization
18,591
21,087
Loss on disposal of property, equipment, and software
13
390
Share-based compensation expense
10,512
8,525
Deferred income taxes
(2,151
)
(1,416
)
Amortization of debt issuance costs and debt discount
4,863
6,250
Write-off of debt issuance costs
293
710
Accrued interest payable in kind
14,323
8,450
Non-cash lease expense
1,945
3,115
Changes in operating assets and liabilities:
Accounts receivable, net
(98,519
)
(62,738
)
Commissions receivable
7,375
17,092
Other assets
(2,620
)
3,166
Accounts payable and accrued expenses
36,073
6,440
Operating lease liabilities
(3,802
)
(4,331
)
Other liabilities
11,453
(8,869
)
Net cash used in operating activities
(4,759
)
(12,835
)
CASH FLOWS FROM INVESTING ACTIVITIES:
Purchases of property and equipment
(3,114
)
(1,056
)
Proceeds from sales of property and equipment
253
—
Purchases of software and capitalized software development costs
(6,065
)
(5,804
)
Net cash used in investing activities
(8,926
)
(6,860
)
CASH FLOWS FROM FINANCING ACTIVITIES:
Payments on Term Loans
(30,412
)
(17,833
)
Payments on other debt
(112
)
(123
)
Proceeds from common stock options exercised and employee stock purchase plan
8
1,187
Payments of tax withholdings related to net share settlement of equity awards
(374
)
(40
)
Payments of debt issuance costs
(773
)
(10,110
)
Payment of acquisition holdback
—
(2,335
)
Net cash used in financing activities
(31,663
)
(29,254
)
NET DECREASE IN CASH AND CASH EQUIVALENTS
(45,348
)
(48,949
)
CASH AND CASH EQUIVALENTS—Beginning of period
83,156
140,997
CASH AND CASH EQUIVALENTS—End of period
$
37,808
$
92,048
SELECTQUOTE, INC. AND SUBSIDIARIESNet Income (Loss) to Adjusted EBITDA Reconciliation(Unaudited)
Three Months Ended March 31, 2024
(in thousands)
Senior
Healthcare Services
Life
Auto & Home
Corp & Elims
Consolidated
Revenue
$
204,259
$
124,207
$
40,686
$
9,134
$
(1,886
)
$
376,400
Operating expenses
(142,765
)
(122,598
)
(37,548
)
(5,524
)
(21,355
)
(329,790
)
Other income (expense), net
—
—
—
(1
)
(11
)
(12
)
Adjusted EBITDA
$
61,494
$
1,609
$
3,138
$
3,609
$
(23,252
)
$
46,598
Share-based compensation expense
(3,515
)
Transaction costs
(3,325
)
Depreciation and amortization
(6,704
)
Loss on disposal of property, equipment, and software
(4
)
Interest expense, net
(24,330
)
Income tax expense
(169
)
Net income
$
8,551
Three Months Ended March 31, 2023
(in thousands)
Senior
Healthcare Services
Life
Auto & Home
Corp & Elims
Consolidated
Revenue
$
185,200
$
70,725
$
36,950
$
8,238
$
(1,715
)
$
299,398
Operating expenses
(126,034
)
(74,091
)
(31,446
)
(5,648
)
(17,947
)
(255,166
)
Other income (expense), net
—
—
(201
)
1
(6
)
(206
)
Adjusted EBITDA
$
59,166
$
(3,366
)
$
5,303
$
2,591
$
(19,668
)
$
44,026
Share-based compensation expense
(2,959
)
Transaction costs
(433
)
Depreciation and amortization
(7,098
)
Loss on disposal of property, equipment, and software
(15
)
Interest expense, net
(21,105
)
Income tax expense
(3,152
)
Net income
$
9,264
Nine Months Ended March 31, 2024
(in thousands)
Senior
Healthcare Services
Life
Auto & Home
Corp & Elims
Consolidated
Revenue
$
541,705
$
333,284
$
115,855
$
28,649
$
(4,926
)
$
1,014,567
Operating expenses
(402,834
)
(326,373
)
(102,910
)
(16,994
)
(62,770
)
(911,881
)
Other income (expense), net
—
—
—
(1
)
(50
)
(51
)
Adjusted EBITDA
$
138,871
$
6,911
$
12,945
$
11,654
$
(67,746
)
$
102,635
Share-based compensation expense
(10,512
)
Transaction costs
(7,629
)
Depreciation and amortization
(18,591
)
Loss on disposal of property, equipment, and software
(13
)
Interest expense, net
(70,141
)
Income tax benefit
1,143
Net loss
$
(3,108
)
Nine Months Ended March 31, 2023
(in thousands)
Senior
Healthcare Services
Life
Auto & Home
Corp & Elims
Consolidated
Revenue
$
486,541
$
169,270
$
107,780
$
23,128
$
(5,649
)
$
781,070
Operating expenses
(347,608
)
(193,726
)
(91,409
)
(15,812
)
(52,270
)
(700,825
)
Other income (expense), net
—
—
—
(1
)
(117
)
(118
)
Adjusted EBITDA
$
138,933
$
(24,456
)
$
16,371
$
7,315
$
(58,036
)
$
80,127
Share-based compensation expense
(8,525
)
Transaction costs
(3,003
)
Depreciation and amortization
(21,087
)
Loss on disposal of property, equipment, and software
(386
)
Interest expense, net
(58,885
)
Income tax benefit
1,053
Net loss
$
(10,706
)
SELECTQUOTE, INC. AND SUBSIDIARIESNet Loss to Adjusted EBITDA Reconciliation(Unaudited)
Guidance net loss to Adjusted EBITDA reconciliation, year ending June 30, 2024: