Trade Settlement Just Accelerated – What It Means for Your Money

If you trade stocks, bonds or other securities, a major change is coming next week that could significantly impact your transactions and capital. On May 28th, the settlement cycle for trades in U.S. markets is shifting from the longstanding T+2 standard down to T+1.

What does this mean? Instead of having two business days after a trade execution to pay up and settle, you’ll now need to pony up your cash and securities just one day later under the accelerated T+1 timeline.

While seemingly a small change, this compression in the settlement schedule could have big ramifications for how you manage trades and the money involved. The transition is expected to cause disruptions, at least in the short-term, that all investors need to be prepared for.

For one, market participants anticipate a spike in trade settlement failures as brokers, banks and trading firms scramble to comply with the tighter T+1 window. With less time to line up cash and shares, there is higher risk that obligations don’t get met when due. History shows failure rates did jump when the U.S. shifted from T+3 to T+2 settlement back in 2017.

Settlement failures can lead to losses on trades, penalties, and reputational damage. The Securities Industry and Financial Markets Association (SIFMA) expects “small changes” in fail rates initially, but any increase could create snags.

There are also concerns that risks and cash crunches could migrate to other areas like foreign exchange funding markets. Foreign investors holding trillions in U.S. securities may face challenges sourcing dollars for transactions in the compressed T+1 timeframe. This could drive demand for overnight lending at elevated interest rates.

Similarly, the shortened settlement cycle could disrupt securities lending by reducing the availability of shares to borrow if there is less time to recall loaned stocks before settling trades.

While ultimately aimed at reducing risks long-term, the shortened T+1 settlement period represents a monumental operational change that the investing industry has been scrambling to prepare for. Over 1,000 different firms have been coordinating testing, setting up monitoring “command centers”, and adjusting processes.

Even with months of planning, there could still be issues and errors in the first few days and weeks as standard practices adapt to the quicker timeline. Major transition risk points to watch include May 29th when trades from both the final T+2 date and first T+1 date converge, creating an expected settlement volume surge.

For all investors, some key implications are clear – be ready for potential trade failures and funding crunches, have contingency plans in place, and expect a Period of adjustment as the new accelerated T+1 regime takes hold. Flexibility and patience may be required as longstanding settlement processes are overhauled practically overnight.

The shift to T+1 is considered vital to modernizing market plumbing. But adapting to its faster payment cadence will put investors’ operational capabilities and capital management to the test like never before.

Want small cap opportunities delivered straight to your inbox?

Channelchek’s free newsletter will give you exclusive access to our expert research, news, and insights to help you make informed investment decisions.

Get Instant Access

New Highs Across Markets Signal Bull Run For Investors

The stock market is heating up and signaling the return of the bulls, as evidenced by fresh all-time highs in the S&P 500 and a rally across risk assets like Bitcoin and gold. Fueled by booming innovation in artificial intelligence, speculative capital is flowing back into equities in a big way. For investors, it may be time to go hunting for the next big investments.

The S&P 500 broke out to new records this week, finally surpassing the previous highs set back in January 2022 before last year’s punishing bear market. The large-cap index closed at 5233 on Thursday, up over 28% year-to-date. This demonstrates that the decade-plus bull run that began after the 2008 financial crisis may have refreshed legs under it.

The strength comes as AI mania has gripped Wall Street and Main Street. The smash success of OpenAI’s ChatGPT triggered a cascade of investors plowing capital into AI startups and tech giants racing to deploy advanced language models and machine learning systems. Cathie Wood’s Ark Invest funds, which load up on disruptive innovation plays, have surged over 30% in 2023.

Even the traditionally cautious money managers are piling in. Just this week, e-commerce juggernaut Amazon announced a staggering $4 billion investment into AI research firm Anthropic. It shows the FANG giants remain at the vanguard of cutting-edge tech adoption and are more than willing to spend big to stay ahead of the curve.

The AI buzz has spurred a speculative frenzy not seen since the meme stock and SPAC manias of 2021. The heavy inflows, plus robust economic data, have pushed U.S. stock indexes to their most overbought levels since the rally out of the pandemic lows. Technical indicators suggest more volatility and pullbacks could be in store, but the trend remains firmly bullish for now.

The buying spree has spilled over into other risk assets like cryptocurrencies and gold. Bitcoin soared above $70,000 recently to its highest levels ever. The original crypto has rallied over 70% in 2023 as institutions warm back up to the space and the AI buzz rekindles visions of decentralized Web3 applications and business models.

Not to be outdone, gold has surpassed $2,200 per ounce and is trading at levels far greater than what was seen in 2020 during the pandemic turmoil. Bullion is benefiting from growing concerns over persistent inflation and fears the Federal Reserve could push the economy into recession as it keeps raising interest rates aggressively. The yellow metal is increasingly seen as a haven in times of economic and banking system stress.

Combined, the advancing prices and frothy trading action point to the return of the animal spirits last seen at the height of the Robinhood/Reddit meme stock craze from two years ago. Caution is certainly warranted, as downside risk remains with growing chances of an economic hard landing from the Fed’s inflation fight.

But the market often climbs a wall of worry, and the blowout action indicates speculators are back in full force. For investors able to navigate the volatility, this may be an ideal time to put capital to work and research the next big opportunities to ride the bull’s coattails.

As ARK’s Cathie Wood stated, “Given the breakthroughs in AI broadly, we believe we are living in the most profound period of commercial invention ever.” Profound invention tends to create extreme investment returns for those with the foresight to invest early in transformative technologies.

For investors searching for the potential 100-baggers of tomorrow across sectors like AI, quantum computing, biotech, fintech, and cybersecurity, buying dips and dollar-cost averaging into high-conviction positions could pay massive dividends down the road. The market mania may only be just beginning.

Stock Markets Rally Back: A Beacon of Hope Emerges

After a tumultuous year marked by soaring inflation, rising interest rates, and economic uncertainty, the stock markets are finally beginning to show signs of recovery. The recent surge in the Russell 2000, a small-cap index, is a particularly encouraging sign, indicating that investors are regaining confidence and seeking out growth opportunities. This positive momentum is fueled by several factors, including signs of inflation subsiding, the likelihood of no further rate hikes from the Federal Reserve, and renewed interest in small-cap companies.

Inflation Under Control

The primary driver of the market’s recent rally is the easing of inflationary pressures. After reaching a 40-year high in June, inflation has been steadily declining, with the latest Consumer Price Index (CPI) report showing a year-over-year increase of 6.2%. This moderation in inflation is a welcome relief for investors and consumers alike, as it reduces the burden on household budgets and businesses’ operating costs.

No More Rate Hikes on the Horizon

In response to the surge in inflation, the Federal Reserve embarked on an aggressive monetary tightening campaign, raising interest rates at an unprecedented pace. These rate hikes were necessary to curb inflation but also had a dampening effect on economic growth and put downward pressure on stock prices. However, with inflation now on a downward trajectory, the Fed is expected to slow down its rate-hiking cycle. This prospect is positive for the stock market, as it reduces the uncertainty surrounding future interest rate decisions and allows businesses and investors to plan accordingly.

Capital Flows Back to Small Caps

The recent rally in the Russell 2000 is a testament to the renewed interest in small-cap companies. These companies, often considered to be more sensitive to economic conditions than their larger counterparts, have been hit hard by the market volatility of the past year. However, as investors become more optimistic about the economic outlook, they are turning their attention back to small caps, which offer the potential for higher growth and returns.

Light at the End of the Tunnel

The stock market’s recent rally is a promising sign that the worst may be over for investors. While there may still be challenges ahead, the easing of inflation, the prospect of no further rate hikes, and the renewed interest in small-cap companies suggest that there is light at the end of the tunnel. As investors regain confidence and seek out growth opportunities, the stock market is poised for a continued recovery.

Additional Factors Contributing to the Rally

In addition to the factors mentioned above, there are a few other developments that are contributing to the stock market’s recovery. These include:

  • Strong corporate earnings: Despite the economic slowdown, many companies have reported better-than-expected earnings in recent quarters. This suggests that businesses are able to navigate the current challenges and remain profitable.
  • Improved investor sentiment: Investor sentiment has improved in recent months, as investors become more optimistic about the economic outlook and the prospects for corporate earnings.
  • Increased retail investor participation: Retail investors have been a major force in the stock market in recent years, and their continued participation is helping to support the rally.

The Road Ahead

While the stock market has shown signs of recovery, there are still some risks that investors should be aware of. These include:

  • The possibility of a recession: While the economy is slowing down, there is still a possibility that it could tip into a recession. This would have a negative impact on corporate earnings and stock prices.
  • Geopolitical tensions: The war in Ukraine and other geopolitical tensions are creating uncertainty and could lead to market volatility.
  • Rising interest rates: Even if the Fed slows down its rate-hiking cycle, interest rates are still expected to be higher than they were before the pandemic. This could continue to put pressure on stock prices.

Despite these risks, the overall outlook for the stock market is positive. The easing of inflation, the prospect of no further rate hikes, and the renewed interest in small-cap companies are all positive signs that suggest the market is on a path to recovery. As investors regain confidence and seek out growth opportunities, the stock market is poised to continue its upward trajectory.

10-Year Treasury Yield Surpasses 5%: Implications for Markets, Investors, and Beyond

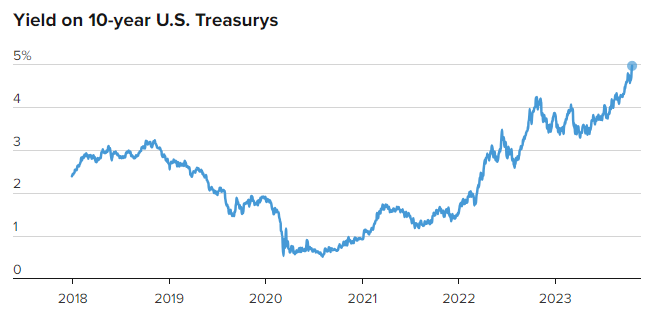
The yield on the 10-year Treasury note has once again crossed the 5% threshold. This benchmark yield has far-reaching implications for both the financial markets and the general public, serving as a barometer of economic conditions and influencing investment decisions, interest rates, and the cost of borrowing for governments, businesses, and individuals.

Source: U.S. Department of the Treasury
Data as of Oct. 20, 2023

Why Does the 10-Year Treasury Yield Matter?

The 10-year Treasury yield is a crucial indicator of the economy’s health and the state of the financial markets. It reflects the interest rate that the U.S. government pays on its debt with a 10-year maturity, which is considered a relatively safe investment. As such, it provides a reference point for other interest rates in the financial system.

Impact on Investors:

  • Fixed-Income Investments: The 10-year Treasury yield directly impacts the pricing and performance of bonds and other fixed-income investments. When the yield rises, the value of existing bonds tends to decrease, which can lead to capital losses for bondholders.
  • Stock Market: Higher Treasury yields can put pressure on stock prices. As bond yields increase, investors may shift from equities to bonds in search of better returns with lower risk. This shift can lead to stock market volatility and corrections.
  • Cost of Capital: Rising Treasury yields can increase the cost of capital for businesses. This may result in higher borrowing costs for companies, which can impact their profitability and, subsequently, their stock prices.

Impact on the General Public:

  • Mortgage Rates: Mortgage rates are closely tied to the 10-year Treasury yield. When yields rise, mortgage rates tend to follow suit. As a result, homebuyers may face higher borrowing costs, potentially limiting their ability to purchase homes or leading to higher monthly payments for existing homeowners with adjustable-rate mortgages.
  • Consumer Loans: The yield on the 10-year Treasury note also influences interest rates for various consumer loans, including auto loans and personal loans. When yields rise, the cost of borrowing for individuals increases, affecting their spending capacity.
  • Inflation Expectations: An increase in the 10-year Treasury yield can signal rising inflation expectations. In response, consumers may anticipate higher prices for goods and services, which can impact their spending and savings decisions.
  • Retirement and Savings: For retirees and savers, rising Treasury yields can be a mixed bag. While it can translate into higher returns on savings accounts and CDs, it can also result in increased volatility in investment portfolios, which may be a concern for those relying on their investments for income.

Market Sentiment and Economic Outlook:

A sustained rise in the 10-year Treasury yield is often seen as an indication of a strengthening economy. However, if the yield surges too quickly, it can raise concerns about the pace of economic growth and the potential for the Federal Reserve to implement tighter monetary policy to combat inflation.

In conclusion, the 10-year Treasury yield is not just a number on a financial ticker; it’s a critical metric that touches the lives of investors, borrowers, and everyday consumers. Its movements provide valuable insights into the state of the economy and financial markets, making it a figure closely watched by experts and the public alike.

Small Cap, Big Potential: Capitalizing on The Widening Valuation Gap

As we progress through earnings season, a concerning trend is becoming more apparent – the widening valuation gap between small and large cap companies. Across sectors like biotech, construction, media and more, large cap stocks are trading at significantly higher valuation multiples compared to their small and mid cap peers. For long-term investors, this divergence could signal an opportunity to start positioning in overlooked parts of the market.

Valuation refers to the process of determining the current worth of an asset or company. The most common valuation metric used by investors is the price-to-earnings (P/E) ratio. This compares a company’s current stock price to its earnings per share, giving a sense of how much investors are willing to pay for each dollar of earnings.

Typically, investors are willing to pay higher multiples for larger companies perceived as higher quality investments. However, the gap in P/E ratios between large caps and small caps has expanded dramatically over the past year. The sizable disparity between the two classes is the largest it has been in over 20 years.  

For example, Pfizer trades around 13x forward earnings expectations. But the average forward P/E for biotech stocks with market caps under $500 million is only 5x. This means investors are valuing each dollar of Pfizer’s earnings twice as highly as the average small cap biotech peer. 

We see similar trends in other sectors. In construction & engineering, Jacobs Engineering trades at 25x forward earnings versus under 10x for small cap marine construction firms like Orion Group Holdings and Great Lakes Dredge & Dock. Media giants like Disney (14x) and Fox Corp (11x) also command far higher valuations than small cap peers like Direct Digital Media (DRCT), Entravision (EVC), or Townsquare Media (TSQ). 

What explains this growing divergence in how the market is pricing future earnings potential?

For one, large cap companies often have broader business diversification that allows them to navigate volatile economic conditions. Pfizer’s COVID vaccine gave revenues a shot in the arm during the pandemic. Meanwhile, smaller biotechs with narrower clinical pipelines carry more binary risk around drug development outcomes.

Bigger balance sheets also provide an advantage. Large caps can leverage financial strength to pursue acquisitions, ramp up buybacks and maintain dividends during downturns. With higher cash reserves and access to capital, they are better equipped to weather tightening financial conditions.

Many large caps also benefit from durable competitive advantages like strong branding, pricing power, high barriers to entry and economies of scale. This allows them to consistently deliver high returns on invested capital and cash flows sought by investors.

Smaller companies tend to deliver more volatile financial results. They lack established competitive positions and have less excess cash. Weaker balance sheets increase vulnerability to supply chain disruptions, rising input costs and tight financing conditions.

While these factors help explain higher valuations for large caps, the magnitude of the gap suggests investors may be overlooking the long-term potential of small and micro cap stocks.

Though more volatile, smaller companies offer greater growth potential. They can deliver exponential returns if new innovations gain traction or they carve out niche industry positions. With valuations already compressed, their risk/reward profiles appear skewed to the upside.

Noble Capital Markets’ Director of Research, Michael Kupinski states in his Q3 2023 Media Sector Review, “We believe that there is higher risk in the small cap stocks, especially given that some companies may not be cash flow positive, have capital needs, or have limited share float.  But investors seem to have thrown the baby out with the bathwater. While those small cap stocks are on the more speculative end of the scale, many small cap stocks are growing revenues and cash flow, have capable balance sheets, and/or are cash flow positive.  For attractive emerging growth companies, the trading activity will resolve itself over time.  Some market strategists suggest that small cap stocks trade at the most undervalued in the market, as much as a 30% to 40% discount to fair value.” 

Astute investors know that future unicorns often hide among today’s small and micro caps. Many current large cap leaders like Apple, Amazon and Tesla began as small companies trading at single digit earnings multiples. Yet these stocks generated huge returns for early investors.

Just because a company is small does not necessarily mean it is distressed. Many smaller firms boast solid fundamentals and growth drivers that are simply not apparent to short-term traders. Their lower valuations present a compelling entry point for long-term investors.

While large caps will remain a core portfolio holding for many, today’s environment presents a unique opportunity. The extreme valuation divergence has created asymmetric upside potential in overlooked small cap names. As legendary investor Warren Buffett said, “Be fearful when others are greedy and greedy when others are fearful.”

Digging Deeper into Valuation Metrics

When assessing valuation gaps between small and large caps, it helps to look beyond simple price-to-earnings ratios. Other useful metrics can provide additional context on relative value.

For example, the price-to-sales (P/S) ratio compares a company’s market capitalization to total revenue. High growth companies with minimal earnings often trade at elevated P/S multiples. However, small caps today trade at an average P/S ratio of just 0.7x versus 2.3x for large caps. Again, a sizable gap that favors small companies.

Enterprise value to EBITDA (EV/EBITDA) is another meaningful valuation yardstick. By incorporating debt levels and focusing on cash profits, EV/EBITDA provides a more holistic view of a company’s valuation. Currently, small caps trade at an average forward EV/EBITDA of 6x – roughly half that of large cap peers.

Across an array of valuation metrics, small and mid caps trade at substantial discounts relative to large caps. This suggests underlying fundamentals and growth prospects may not be fully reflected in their beaten-down share prices.

Small Cap Opportunities Across Industries

While small caps appear broadly undervalued, some industries stand out as particularly compelling hunting grounds.

For example, junior mining stocks have been ravaged during the recent crypto/tech selloff. But with inflation soaring and geopolitical tensions rising, demand for precious metals should strengthen. Many miners are generating robust cash flows at today’s elevated commodity prices. Yet their shares trade at deep discounts to book value.

Biotech is another area laden with small cap opportunities. Developing novel drugs carries substantial risk, so setbacks in clinical trials can decimate share prices. However, the sector remains ripe for M&A. Larger pharmas need to replenish pipelines, providing takeout potential. Investors can balance risks via diversification across promising development stage companies.

Oil and gas producers offer further value among small energy firms. Strong demand and restricted supply has sent oil prices surging. Many smaller E&Ps focused on prolific shale basins sport attractive cash flows and reserves value. Yet their shares lag larger counterparts, despite superior growth outlooks.

The bottom line is that while risks are higher with small caps, their depressed valuations provide a margin of safety. Reward far exceeds risk for selective investors focused on fundamentals.

Mitigating Volatility

Small caps carry well-known risks, including elevated volatility. Information flow and analyst coverage is more sparse for smaller companies. Major drawdowns can rattle investor nerves and sink long-term performance if not adequately prepared for. Resources like Channelchek is a great tool to help provide data to investors in the small cap space. 

Based on your age, time horizon, and risk tolerance, here are some tips to mitigate volatility while still capturing small cap upside:

  • Maintain reasonable portfolio allocation – small and microcaps should represent a smaller portion of your equity holdings
  • Diversify across sectors, industries and market caps to smooth volatility
  • Maintain a long-term mindset – don’t panic sell on temporary declines

With prudent risk controls, small caps can boost portfolio returns while diversifying away from large cap shares. Their more attractive valuations provide a compelling opportunity during these volatile times.

“In the equity markets history tends to repeat itself. At some point the smart money will start allocating more portfolio weight into these undervalued equities, which will narrow this historic valuation gap, offering potential for above average returns for small and microcaps,” said Nico Pronk, CEO of Noble Capital Markets.


What Happens to Your Stock Holding When it is Added to a Major Index?

Index Inclusion or Deletion Can Send Shockwaves Through Stocks

With the massive amount of assets in mutual funds and exchange-traded funds (ETFs) that are geared to return the same performance as a major index, there’s been a lot of investor focus on the addition and subtraction of stocks from indexes, especially the widely followed, S&P 500, Nasdaq, Russell, and Dow Industrials. This is because many institutional investors attempt to mirror the performance of these indexes by buying the same stocks. Some funds are even required by their charter or offering prospectus to hold the same stocks. This produces “unnatural” price movements in companies as they are moved in or out of an index. Self-directed investors, not beholden to a set of investing rules, may find opportunities by recognizing, then positioning themselves before institutions are required to buy or sell a company name.

Rebalancing of the most followed indices is a reality for individual investors, so it’s good to understand the timing and dynamics, and valuing a stock based on what stock index it may be in.

Dynamics

When a stock is added to a broad index, millions or billions of investment dollars flow into that stock, typically driving its price higher. And the reverse is also true; when a stock is removed from an index, it’s often sold by fund managers, which decreases demand and causes its price to weaken. There are conflicting studies that in some cases, indicate the added strength by inclusion is short-lived, and others that indicate that the stock begins to trade with an emphasis on whether or not money is flowing into the index it is included in, or out. All studies agree that there is typically an initial change in the stock’s valuation.    


Timing

When a stock is added to a major index, as will happen with the Russell 3000, Russell 2000, and Russell 1000 on June 27,  it has historically had positive effects on its trading demand, this has impacted its price. As the Russell will reshuffle, or in their jargon “reconstitute” its indexes this month (June) let’s use the Russell 2000, which captures the performance of approximately 2,000 small-cap stocks in the United States. Here are the potential impacts of a stock being added to the index:

Price impact is what concerns investors most. The announcement of a stocks addition to an index can lead to a price impact. This is because investors who track the index may need to purchase the stock to align their portfolios with the index composition. The increased demand can push the stock’s price higher.

It could also lead to investor recognition or Increased Visibility. Inclusion in a major index can come with increased visibility and recognition for a company. This can attract the attention of investors, including index funds, mutual funds, and other institutional investors who track or invest in the index. As a result, the stock may experience increased trading volume and better liquidity.

Institutional buying may increase. Index funds and other institutional investors that track the Russell 2000 (or other indices) may need to purchase the stock to replicate the index’s performance. This can lead to increased buying pressure from these large investors, potentially driving the stock’s price higher.

A nod by an index can bring overall positive sentiment. Being added to a major index can create a positive sentiment around a stock, signaling that the company is growing and gaining prominence. This positive sentiment may attract additional investors who believe the stock’s inclusion in the index validates its prospects, potentially leading to further price appreciation.

Trading Activity usually escalates with inclusion. Inclusion in the Russell 2000 can result in increased trading activity as the stock becomes part of a widely tracked benchmark. More market participants are likely to trade the stock, increasing its overall trading volume.

When Are the Other (Non-Russell) Indexes Rebalanced?

While the FTSE Russell has a strict and easily understood set of rules and guidelines that make it easy to understand, the S&P, Dow, and Nasdaq also rebalance under their own timeline.

The S&P 500 is reviewed and rebalanced on a quarterly basis. During these reviews, S&P Dow Jones Indices assess the constituents of the index and consider changes based on the selection criteria and market developments. They don’t follow hard and strict rules.

The Nasdaq 100 is a market-capitalization-weighted index that includes 100 of the largest non-financial companies listed on the Nasdaq stock market. The index is maintained by Nasdaq, and its rebalancing process involves an annual evaluation to determne eligibility, and potential rebalancing.

The annual evaluation involves Nasdaq reviewing the composition of the Nasdaq 100, this typically occurs in December. During this evaluation, companies are assessed based on their market capitalization, liquidity, and other factors. The top 100 eligible companies by market capitalization become or remain constituents of the index. They must be traded n the Nasdaq exchange.

Eligibility for companies is determined by their meeting certain criteria to allow inclusion in the Nasdaq 100. These include being listed on the Nasdaq Global Select Market, having a minimum average daily trading volume, and meeting liquidity requirements.

If rebalancing is necessary, Nasdaq conducts this during an annual rebalancing in December. Companies that no longer meet the eligibility criteria may be removed, and new companies that meet the criteria may be added. The weightings of the index constituents may also be adjusted based on their market caps.

The Dow 30, also known as the Dow Jones Industrial Average (DJIA), is a price-weighted index that represents the performance of 30 large, publicly traded companies in the United States. The index is maintained by S&P Dow Jones Indices, and its rebalancing process is different from market-capitalization-weighted indices like the S&P 500 or Nasdaq 100. It includes price weighting and selective changes.

Price-weighted for the Dow 30 index is based on the stock prices of its constituents rather than their market capitalizations. The impact investors should be aware of is that higher-priced stocks have a larger impact on the index’s movements.

Selective changes is best defined knowing the Dow 30 does not undergo regular rebalancing like other indices. Instead, changes in the index composition are infrequent and typically occur when a constituent company experiences a significant corporate action, such as a merger, acquisition, or bankruptcy. When such changes occur, the index committee at S&P Dow Jones Indices makes a decision to replace the affected company with another suitable candidate.

It’s important to note that the impact of being added to an index can vary depending on factors such as the stock’s size, liquidity, and investor sentiment. Additionally, market conditions and investor behavior can influence the stock’s performance. Therefore, while inclusion in a major index can have positive effects, it doesn’t guarantee a specific outcome for the stock’s price. And being removed from an index may only create potential.

Take Away

There is activity surrounding stocks as they are added or deleted from a major market index. Investors should be aware of when the index is being reconstituted or altered, so they may either benefit, stand clear, or be sure that they are not in harms way. The Russell indexes will be reconstituted at the close of the last Friday of this month (June).

Paul Hoffman

Managing Editor, Channelchek

https://www.ftserussell.com/

If Bad Expectations are Fully Priced Into Stocks, Which Ones Could Outperform This Year 

Image Credit:Maarten Takens (Flickr)

Highly Regarded Analyst Tells Investors How to Position for the Upturn   

Are recession worries fully baked into stock prices? At least one Wall Street analyst has publicly made her case this may be accurate. And she offers tips on what sectors may have more upside and on those that have factors working against them. While a recession still may occur before year-end, forward-looking stock investors may have fully priced that risk in – forward-looking investors may also be the reason the overall market is up on the year despite greater expectations of a recession. They are looking past any slowdown.

Stock market participants, many still down on last year’s price moves, have been extremely cautious in front of a Fed that is playing catch up in a fight against inflation. The rapid Fed Funds rate increases that began in March 2022, coupled with quantitative tightening, sank stocks, bonds, and even cryptocurrency holdings. While the economy did shrink for two consecutive quarters last year, there are many that expect a mild recession will begin at some point this year.

Those that do expect a bumpy economic ride and a rough landing point to high-interest rates, a weakening dollar, tech industry layoffs, and a Federal Reserve that is resolved to get inflation down as soon as possible.

Savita Subramanian, equity and quant strategist at Bank of America Securities, proposed to investors in a research note published on April 24, that these fears and recession worries have been in place for a while and may be largely baked into the market. She says, barring a sudden shock to the economy, it makes sense for investors to reintroduce riskier assets into their portfolios.

Her guidance on finding value is well thought out. Subramanian, proposes investors own stocks over bonds and cyclical stocks over defensive names. The reason given is that hedge funds and long-only funds are near maximum exposure in defensive industries such as health care, utilities, and consumer staples. The suggestion here is that the probabilities would lean toward a better risk-reward payoff for cyclical names.

Ms. Subramanian does not say an economic slowdown won’t occur; instead, her thinking seems to be that after raising the Federal Funds rate from near-zero to a range of 4.75% to 5%, there is more control should a downturn need to be dealt with by easing. When rates are at or near zero percent, there is less the Fed can do to stimulate growth. So far, we’ve made it through the first quarter, and now April with only a few disruptions in the banking sector.

“Even if a recession is imminent, the Fed has latitude to soften the impact after pushing rates up by 5%. And after the fastest hiking cycle ever, the only thing to ‘break’ so far is SVB,” Subramanian wrote.

In an article published in Barron’s this week the investment news publication wrote, “Some corners of Wall Street are feeling confident that there will be no recession and that the very things that make a recession appear likely–the inverted yield curve, inflation, and the recent banking crisis–actually guarantee that one won’t happen.”

This could be good news for investors that have been nervous about having money in a market that has been given much to be concerned about, and ver little to be jubilant about.

On Thursday, GDP (Gross Domestic Product) for the first quarter will be released. No one expects this to indicate a recession began then. Forecasters expect that the economy will show 2% growth, following growth of 3.2% and 2.6% in the third and fourth quarters of 2022. This is one of the cases where if the number surprises much higher, the market may expect the Fed to make bigger rate moves. If it surprises on the low side, markets may see it as a sign of an approaching recession.

Take Away

A highly regarded analyst joins others with thoughts that the market could be priced for a recession; this could be good for stocks. If true, investors may want to start looking past a recession. Those she is most positive on are riskier names. While funds and other investors are near maxed out in lower-risk holdings, there is far less upside for them. The bigger upswings can occur in the industries, market-cap sectors, and companies that have been given less attention due to recession fears.

Paul Hoffman

Managing Editor, Channelchek

Michael Burry Appears Negative on Cryptocurrency and Positive on Gold Investments

Image Credit: Michael Steinberg (Pexels)

If Cryptocurrency is not the Safe Haven it was Expected to Be, Will Assets Move Into Gold Investments?

In addition to any information discovered from Michael Burry’s 13F filing earlier this week, he’s been coming out in support of gold. He seems to expect that those that were seeking a “safe harbor investment” in various crypto-related investments are now having a change of mind. Despite his long positions held on September 30 and made public on November 14, he has teased that he could be extremely short the market; presumably, this could include any tradeable asset when you’re an investment analyst of this caliber.

Will Investors Rediscover Gold?

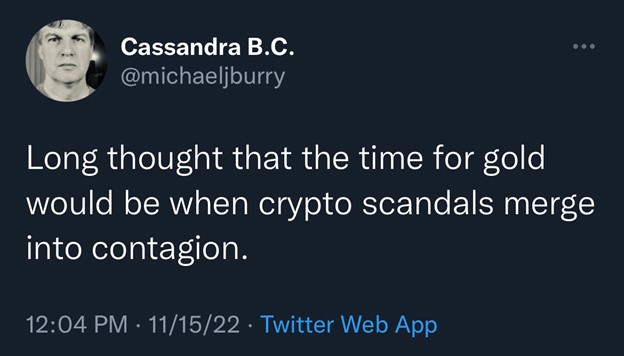
“Long thought that the time for gold would be when crypto scandals merge into contagion,” Burry wrote in a tweet this week.

@michaeljburry

The financial pressures spreading across the crypto industry that have helped destroy the crypto exchange FTX and exposed characters like Sam Bankman-Fried that may have been given too much trust, are causing reduced trust in digital assets.

Supporters and believers in the benefit of crypto had been using bitcoin and other tokens as a means of storage outside of securities. Their expectation has been that crypto is superior as a store of value during periods of inflation, currency depreciation, and economic turmoil.

Crypto prices have not offered much protection against plunging stock, bond, and real estate values. In fact, relative to the strong US dollar, crypto’s value has fallen off a cliff, offering no protection. The overall outstanding crypto worth has gone from $2.2 trillion to around $830 billion. Gold has not been rising during this period, but relative to US dollars, it is down only 3%. 

Burry’s likely message is that the escalating cryptocurrency negatives will reduce demand for coins, yet demand for a safe haven asset would not be reduced. This could make gold again one of the only games in town for investors looking to protect against asset erosion.

Is Burry Short?

“You have no idea how short I am,” Burry said in a tweet this week.

@michaeljburry

He does not say he is short at all in this tweet. However, against the backdrop of many previous tweets warning against a market he believes will become more bearish, coupled with a holding report released that has five long holdings, the hedge fund manager of The Big Short fame is likely warning investors not to read too much positive into his fund’s holdings report.  That report was released just before the tweet.

The value of long securities held in his roughly $292 million AUM was $41 million. As he demonstrated during the financial crisis, there are non-publicly reported ways to be short, even short beyond your AUM. Fund managers with assets over $100 million only have to disclose US-listed stocks in their 13F filings with the SEC each quarter. Excluded in the reporting are shares sold short, overseas-listed stocks, and other assets such as commodities.

In actuality, Burry’s increased positions in prison stocks and exposure to the company involved in making Artemis’ rocket boosters is more likely a sign that he likes the prospects of some companies while at the same time doesn’t like the broader market outlook.

Positive Tweets

In addition to his positive tweet on gold, Burry has suggested the Federal Reserve’s interest-rate hikes, which have weighed on market prices, could end in the spring. This was reflected in his October 24 tweet “Still think the Fed back off on QT early next year.”

Investing in Gold

Investors that look to gain exposure to gold, will typically buy gold bullion, gold funds, gold futures, and the stocks of gold mining companies. All have unique advantages. Investors looking to research junior miners of gold and other precious metals and natural resources, find Channelchek as an excellent resource to discover and research many different unique, actionable possibilities. Start here.

Paul Hoffman

Managing Editor, Channelchek

Will Equity Investors Return Back to the Future?

Image: Statue of Liberty Torch, Circa 1882 – Ron Cogswell (Flickr)

Current Technology May Be Leading the Next Shift in Stock Market Investing

Investor exposure to the stock market has grown and evolved through different iterations over the years. There is no reason to believe that it isn’t evolving still. The main drivers of change have been the cost of ownership, technology, and convenience, which are related to the other two drivers. There seems to be a new transformation that has been happening over the past few years. And with each change, there will be those that benefit and those that fall short. So it’s important for an investor to be aware of changes that may be taking place around them.

Recent History

Your grandfather probably didn’t own stocks. If he did, he bought shares in companies his broker researched, and he then speculated they would out-earn alternative uses of his capital – this was expensive. Mutual funds later grew in popularity as computer power expanded, and an increased number of investors flocked to these managed funds – the price of entry was less than buying individual stocks. Charles Schwab and other discount brokers sprang up – they offered lower commissions than traditional brokers. Mutual funds were able to further reduce fees charged by offering easier to manage indexed funds or funds linked to a market index like the Dow 30 or S&P 500. Indexed exchange-traded funds (ETF) took the indexed fund idea one step further – they have a much lower cost of entry than either mutual funds or even discount brokerage accounts. An added benefit to indexed ETFs is they can be traded at intraday prices and provide tax benefits.

Just as Schwab ushered in an era of low-commission trades, Robinhood busted the doors open to no-commission trades, and most large online brokers followed. This change allows for almost imperceptible costs in most stock market transactions. It also changed the concept of a round-lot, or transacting in increments of 100 shares. In fact, the most popular brokers all offer fractional share ownership now.

Are Index ETFs Becoming Dinosaurs?

Funds made sense for those seeking diversification of holdings, it used to take a large sum of money to do that; investors with a $10,000 account or more can easily achieve acceptable diversification with odd-lots and fractional shares ability.

Today investors can create their own index-like “fund,” or as they called it in your grandparent’s day, “portfolio management.”

One big advantage to creating your own portfolio, even if you rely heavily on stocks from a specific index to choose from, is that you can adapt it more toward your sector or company expectations. Indexed funds are stuck with their index holdings, they have no ability to change. One may increase or decrease risk by leaving out stocks or even whole industry groups. Also, it can be managed with greater tax efficiency than an index fund tailored to your situation.

There is also the DIY thrill that one gets from creating anything themselves rather than to just buying one off the shelf. There have been a number of renowned investors like Peter Lynch and Michael Burry warning that indexed funds no longer provide expected diversification and that many of the stocks are valued higher because so many dollars are on “auto-invest” into indexes that the bad has been pushed up with the good.  

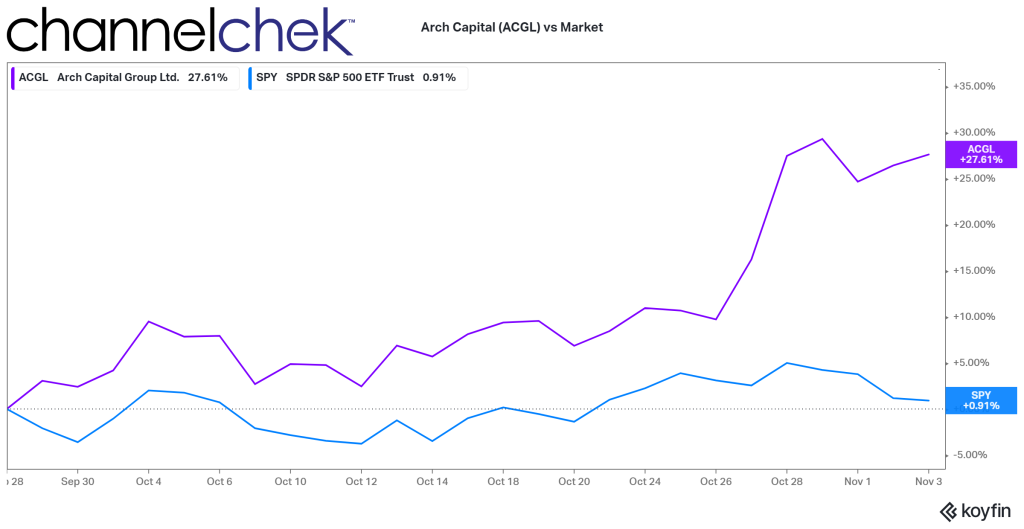
An example of what added demand does to the valuation of a company when being added to an index can be seen over the last month when it became clear that Twitter would be leaving an empty slot that would be filled by Arch Capital (ACGL). The added demand for ACGL pushed up the value by an estimated 25%. Was it undervalued before (when stand-alone), or is it over-valued now? Some stocks that are getting more attention because they are in an index could, as Michael Burry warned, be in bubble territory.

Source: Koyfin

Setting Up a Portfolio

The more you do to ensure your portfolio weightings mimic an index, the closer your performance is likely to be to that index. You may want to limit your holdings to names that are actually in the index and shift the weightings for return enhancement. Another concern often cited with indexes is the way that they weight holdings; you may choose to weight your portfolio using the market capitalization of each company to own the same percentage of the company’s value or use another method like pure cost measures or cost per P/E.

Picking Stocks

While studies suggest that market diversification can be achieved by owning as few as five stocks and doesn’t improve much after 30 holdings, the more you own, providing they aren’t overweighted in a sector, it stands to reason the more diversification protection you can achieve.

As a DIY, self-directed investor, it makes sense not to chase after whatever YouTube influencer, loud-mouthed-TV analyst, or Stocktwit tells you. This is your baby, and the results, good or bad, are yours. Do what you can to make informed decisions, even if some turn out unexpected. The benefit of this is you can lean away from stocks that are still in indexes that don’t have good future prospects and lean into more companies that do.

I’m hearing from more of my self-directed investor friends and investment advisors that more people are looking to own companies that have non-financial objectives they, as an investor, support. And for some of them, there is no standard ESG framework that they support. They have decided, because they do care, to do more portfolio management with individual stocks than before. This is so they can individually look under the hood at employee policies, or environmental stature, etc. While ESG funds exist, the investor or client of the investment advisor would prefer not to own anything they oppose if they can avoid it. What better way than being able to say no to $XYZ company because they do this, this, and this that is against my own fabric?

Channelchek is a great resource for any percentage of your personally managed fund that includes stocks in the small-cap or microcap categories. These stocks could add a bit more potential for return but could also change your risk characteristics. Sign-up to get research from FINRA-licensed analysts.

Take Away

Stock investing has evolved and become more inclusive. But the future may be more like the past, with individuals creating portfolios of stocks for themselves. You don’t have to be rich anymore to buy stocks, and you don’t have to own a fund to get affordable diversification on nearly any size account. There’s a trend toward building one’s own personalized, diversified, low-transaction portfolio. Channelchek is helping investors find possible fits with its free research platform.

Paul Hoffman

Managing Editor, Channelchek

Why Biotech May Finish out 2022 Very Strong

Image Credit: Jason Mrachina (Flickr)

The Reasons Biotech is Gaining Ground on the Field

Similar to their watching a horse race, with a sense that their horse is starting to come from behind and may even be moving toward the front of the pack, biotech investors are leaning over the rail, watching their sector’s increased pace. This week biotechs, as measured by the ETF $XBI, crossed above its 200-day moving average – only last week the biotech sector’s momentum took it above its 50-day moving average. Does this technical indicator demonstrate the growing strength will continue, or does this indicate that it may be approaching overbought?

Technical analysis is not usually clear on this; below, we look for clues in the sector’s fundamentals to better handicap its chances.

Source: Koyfin

Pace of Deals

In 2021, the overall healthcare sector experienced record merger and acquisition activity. The first half of 2022 also had significant activity; however, at $92.4 billion in value and 481 deals announced, the pace of activity was down 51% from the same period in 2021. This may feel slow but is well ahead of the pre-pandemic pace for these companies.  For example, it’s a 37% increase from the first half of 2020. This could be seen as fundamentally positive for a sector that is trading below its 2021 levels and even below the second half of 2020. 

One catalyst for this continued high pace of deals which may even help accelerate it, is that big pharmacies are flush with cash. This cash serves them best if invested in the next generation of medicine or valuable patent. Fortunately for big pharma, small and mid-sized biotech companies are more likely now to form financial partnerships, agree to merger arrangements, or be outright purchased in order to help with their need for cash to continue operations.

This dynamic is easy to understand; there is less money flowing into the smaller incubator-type companies than the big pharmaceutical companies that have had money pouring in from generous pandemic-related government contracts. These small companies, many working on what may be life-changing science, rarely have sizeable sales. Sales and revenue come after the final phase of testing, FDA approval, and marketing. A small biotech company that sees its research and development possibly making a difference a few years from now, but is currently burning through capital at a pace where it may only last another 12 months, might welcome partnership or acquisition talks with a cash-rich suitor.

News of any injection of cash or capital in these smaller biotechs is usually an event that pushes the price up by percentage points in a short period of time. A full buyout can do much more.

XBI provides exposure to US biotech stocks, as defined by GICS, from a universe that invests across the market-cap spectrum. The fund equal-weights its portfolio, which in turn emphasizes small- and micro-caps and greatly reduces single-name risk. Thus, the weighted-average market-cap is much smaller than some competitors. Unlike other funds in this segment, XBI is a pure biotech play, with relatively small pharma overlap. The index is rebalanced quarterly.  – FactSet

Put yourself in the position of big pharma in 2022 into 2023. Your firm may now be sitting on a huge war chest thanks to the pandemic. This is now being eroded by high inflation. Management’s role is to use resources to provide value to shareholders. In the meantime, biotech is well-priced and motivated to talk.

And then the clock is always ticking on patent cliffs for big pharma. They may be very amenable to shop for acquisition targets as they look out at the expiration of patent rights and the exclusive protection those patents provide. Analysts estimate the top-ten pharmaceutical manufacturers have more than 46 percent of their revenues at risk between 2022 and 2030. Behemoths like Bristol Myers Squibb, Pfizer and Merck will be among the most exposed over the next decade.

Take Away

Watching a thoroughbred that was lagging behind the pack find an opening and begin to gain ground on those around it is exciting. When you have money on the horse, it’s even more enjoyable. The performance of the biotech sector was far behind other industries for much of this year. Moving into fall it has been outperforming its own average and many other investment areas.

There are fundamentals in play that could keep this strength going. What’s more is that these factors have little to do with the overall market, which many now fear

This challenge may catalyze M&A in the industry as large firms look to recoup lost revenue streams and invest in patents.

Paul Hoffman

Managing Editor, Channelchek

Sources

https://www.nasdaq.com/articles/consolidation-case-for-biotech-etf-bbh

https://www.jdsupra.com/legalnews/big-pharma-firms-return-to-the-deal-6580128/

What We Can Learn About Markets from September 11

Image: Jason Powell (Flickr)

September 11, a Retrospective Account of Investment Fallout and Recovery

I wasn’t in New York City on September 11, 2001. Just prior to 911, I had taken a position as CIO for a major Wall Street firm headquartered in lower Manhattan; however, the trading floor I was responsible for was about 50 miles east of ground zero. I took the position outside NYC to be closer to my home and family – the benefit of my decision became apparent all at once, at 8:45 am that Tuesday morning, then reinforced 18 minutes later.

Twenty-one years have passed since then, the children of the deceased are now adults, and financial activity is spread much further than one small area in lower Manhattan. Although much has changed, it’s important to look back and recognize how the investment markets handle devastation and, at the same time, recognize how humans here and around the world will band together when others need help.

Image Credit: Visual Capitalist

September 11, 2001

The opening bells at the New York Stock Exchange (NYSE) and Nasdaq were silent at 9:30 that morning. They remained silent until September 17, as traders and investors feared what their positions would be worth upon the reopening of the financial markets after the longest close on record.

Once reopened, the Dow Jones fell 7.1% or 684 points, setting a record at the time for the highest one-day loss in the exchange’s history. By Friday, the NYSE had experienced the greatest one-week decline in its history. The Dow 30 was down more than 14%, the S&P 500 plunged 11.6%, and the Nasdaq dropped 16%. In all, about $1.4 trillion in wealth disappeared during the five trading days. Since then, this record has only been surpassed once at the early stages of the pandemic.

In hindsight, the industries most negatively impacted make sense. Airlines and the insurance sectors lost tremendous value. A flight to quality made gold popular as the price per ounce leaped 6% to $287.  

Gas and oil prices quickly rose as fears that oil imports from the Middle East would be slowed or stopped altogether. Those fears lasted about a week; then, after no new attacks and a clearer understanding of the intentions of government officials, index levels returned to near their pre-911 levels.

The sectors that experienced major gains after the attacks include technology companies and certainly defense and weapons contractors. Investors anticipated a huge increase in government borrowing and spending as the country prepared to root out terror around the world. Stock prices also spiked for communications and pharmaceutical companies.

On the U.S. options exchanges, volatility in the markets caused put and call volume to increase. Put options, designed to allow an investor to profit if a specific stock declines in price, were purchased in large numbers on airline, banking, and publicly traded insurance companies. Call options, designed to allow an investor to profit from stocks that go up in price, were purchased on defense and military-related companies. Short-term profits were made by investors who were quick to execute.

The terrorism of September 11 will, doubtless, have significant effects on the U.S. economy over the short term. An enormous effort will be required on the part of many to cope with the human and physical destruction. But as we struggle to make sense of our profound loss and its immediate consequences for the economy, we must not lose sight of our longer-run prospects, which have not been significantly diminished by these terrible events. – Fed Chairman Alan Greenspan, September 20, 2001

Since September 11

Over the following 21 years, the major U.S. stock exchanges have taken steps to make physical disruption of trading more difficult. This includes dramatically increasing the percentage of trading that is electronic. While this has made the U.S. markets less vulnerable to physical attacks, it is feared that there is increased potential for cyberattacks. “As we have digitized our lives, which has generally been a great blessing, we have sown the seeds for even greater destruction in terms of the ability to hack into our systems,” said former Securities and Exchange Commission Chairman Harvey Pitt, who led the agency on Sept. 11, 2001. “That is today’s equivalent of a 9/11 attack. There is a potential ‘black swan’ event every single day.”

Major Market Indices Since September 11, 2001 (Source: Koyfin)

The investment markets have enjoyed above-average upward movement, despite the negative short-term impact of the black swan event. In the nearly 20 years since Sept. 11, the S&P 500, Nasdaq 100, and Russell 2000 Small-Cap index has risen more than four-fold. The bond market has also been strong (persistent low rates) despite increased borrowing to fund defense operations to finance America’s 911 response.

The U.S. economy itself has had long periods of expansion since 2021, even with the mortgage market crisis from December 2007 to June 2009, and the economic challenges from the response to the COVID-19 pandemic.

The costs, however, are likely to continue to be borne by taxpayers for generations. Interest-related costs alone on debt which financed military operations, including the long Afghanistan war, which was resolved last year when the U.S. withdrew after 20 years, and the protracted conflict in Iraq from 2003 to 2011, are high. The economic drag of these costs, while not fully measurable, are real.

The U.S. government financed the wars with debt, not taxes. Interest rates have been low, but taxpayers have already helped pay approximately $1 trillion in interest costs on the debt incurred to finance the two wars. These interest costs are expected to balloon to $2 trillion by 2030 and to $6.5 trillion by 2050 (according to the Watson Institute at Brown University). This places upward pressure on interest rates and places downward pressure on economic activity. One reason is that taxes used to fund interest costs take money from the economy without providing any stimulus or new material benefit.

Off Wall Street

September 11 radically changed the national mood and political environment. Polls and surveys taken just before the 911 attacks found Americans growing less certain about the direction of the country as a recession began to weigh down the ability to be optimistic. A full 44 percent of the country thought it was headed in on the wrong direction, according to the August 29-30, 2001 New Models survey.

Logic might suggest that after a successful attack, people’s attitudes toward the direction of the country would trend toward a worse future. Reporters, politicians, and spokespeople all predicted a terrible economic shock; their forecast seemed supported by the first week’s plunge in markets. But the events of that day seemed to give citizens purpose. In fact, statistics that indicated the “direction of the country” showed that optimism surged. An October 25-28 CBS/NY Times survey reported that people felt the country was headed in the right direction by a two-to-one margin. A sense of pride in who we are as a country and as individuals overcame negative economic news in an unprecedented way.

Take Away

It has been over two decades since what many of us think of as recent. The truth is, children born on September 11, 2021 or before are now of drinking age. But history can prepare us for new events. The market’s first reaction to tragic news is always down; when proven temporary, bargain hunters come in, then the market has always resumed its historical growth trend upward.

The markets now trade more digitally with almost no need for runners in lower Manhattan and far less open-outcry and paper jockeying by masses of people working for companies in one small section of Manhattan island. But the new threats are also real, a cyber attack on electronic records or transactions could be devastating in its own way.

Challenges even those caused by tragedy provide opportunity and even purpose. September 11, and its aftermath are proof of this.

Paul Hoffman

Managing Editor, Channelchek

Sources

https://papers.ssrn.com/sol3/papers.cfm?abstract_id=803387

https://www.weforum.org/agenda/2021/09/9-11-timeline-visualized-america-september-terror-attacks/

https://www.federalreserve.gov/boarddocs/speeches/2002/20020111/default.htm

https://www.visualcapitalist.com/wp-content/uploads/2021/09/911-terrorist-attack-timeline-full-size.html

https://www.brookings.edu/articles/flying-colors-americans-face-the-test-of-september-11/

Money Moving Out of Foreign Investments is Supporting U.S. Markets

Image Credit: Andrea Piacqadio (Pexels)

Why So Much Money from Overseas is Flowing to Soft U.S. Markets

In 2016, Mohamed El-Erian, chief economic advisor at Allianz, and President of Queens’ College, Cambridge published a book called The Only Game in Town. It was written during a period approximately halfway between the last big stock market sell-off and the 2022 bear market. In it he suggests the only reason investment dollars from overseas are flocking to U.S. markets is because we are “the cleanest dirty shirt.” In other words,  the U.S. economy and financial system may not be great, but it is far more appealing than the alternatives.  

Labor Day 2022 is now behind us, the S&P 500 is down 16% YTD, the economy receded during the first half of the year and its growth is probably still stunted. The U.S. Treasury index indicates that bonds are down 11% YTD, so why are international money flows moving to U.S. markets? Do investors from overseas think this is a buying opportunity, are we the “cleanest dirty shirt,” or is there something else?

There are probably a number of correct answers, which, when taken together, provides the reason. Investors need to be aware of the dynamics as flows into and out of the U.S. impact all of the country’s markets, including real estate and currency.

“The U.S. looks the least challenged in a very challenging world,” Christopher Smart, chief global strategist at Barings and head of the Barings Investment Institute told the Wall Street Journal. “Everybody is slowing down, but the U.S., because of the continuing strength of the jobs market, still seems to be slowing more slowly,” he added.

And the data shows just how much money is reaching our markets. Assets have been withdrawn from international stock funds for 20 consecutive weeks, according to Refinitiv Lipper data. Money flows have been in to U.S. equity-focused stock and mutual funds for four of the past six weeks.

The U.S., relative to large economies outside of the states is better; employment is strong, there are expectations that a long protracted recession isn’t likely, and consumer spending hasn’t faded, while price increases (inflation) have been tapered. 

Recent performance of U.S. markets has been impressive. Since the low point of the year (June 14), the small-cap Russell 2000 index is up 7.2%, the S&P 500 is up 6.5% and even U.S. Treasuries are positive despite the Fed’s stated intention of higher rates.

The S&P 500 has outpaced major stock indexes in Europe and Asia since hitting its low for the year in mid-June, meanwhile the pan-continental Stoxx Europe 600 has added only 2.9%, Japan’s Nikkei 225 has advanced 4.5%. Germany’s DAX and the Shanghai Composite have slid 1.3% over the same period.

Source: Koyfin

And there is one other self-fulfilling incentive for U.S. dollar-denominated assets; the dollar has surged to a 20-year high relative to a standard basket of global currencies. To date it is 25.2% stronger than the yen, it increased 12.2% higher versus the euro, and gained 15% above the British pound. Even with the U.S. major indices down, investor conversion back to non-U.S. native currency is a big win compared to what they would have lost. And for U.S. investors that were in international markets, they are better off having repatriated their dollars, even if they are down on the year.

The longer the dollar’s strength continues, the more the strength will feed on itself.

What investors should pay particular attention to now is anything that may trigger a turnaround, and money going back into international markets. This does not seem imminent, but it helps to know what is making “other shirts dirtier.”

Among Europe’s challenges are war-related supply shortages which have led to skyrocketing gas and electricity prices. Recently added to the list, Russia’s Gazprom PJSC said Friday (Sept. 2), that it would suspend the Nord Stream natural-gas pipeline to Germany. Winter is coming and the continent is on the path to a worsening energy problem, one that would add to upward inflation pressures for them.

China the world’s second-largest economy, has been severely weakened by the impact of its response to Covid-19. Other factors weighing on its economy are a real-estate downturn, heightened regulation of technology companies, and unusually bad weather. Weakness in China creates problems for economies around the globe since much of the world’s commodities and manufacturing come from the country.

A turnaround in these factors, such as a friendly resolution to the war, increased productivity from China, or lower inflation across Europe and the tide may turn causing more investment to gravitate away from the U.S., creating less demand for assets here. To date, there is no sign that any of these possibilities are imminent, and the longer the U.S. is the only game in town, the more money will be kept in U.S. dollar assets and the more upward pressure there will be on these assets.

Paul Hoffman

Managing Editor, Channelchek

Sources

https://www.amazon.com/The-Only-Game-in-Town-audiobook/

https://www.refinitiv.com/en/financial-data/fund-data

https://en.wikipedia.org/wiki/Mohamed_A._El-Erian

https://www.wsj.com/articles/u-s-dollar-strength-lifts-americans-relative-spending-power-11662304836?mod=Searchresults_pos4&page=1

https://www.wsj.com/articles/investors-are-pouring-into-u-s-stocks-to-avoid-greater-turbulence-overseas-11662421967?mod=Searchresults_pos1&page=1

Will the Dollar and Securities Markets Sink When the War Ends?

Image Credit: Andre Furtado

The Story of War and Peace in the Currency Markets

There is a story of war and peace in the contemporary currency markets. It has a main plot and many subplots. As yet, the story is without end. That may come sooner than many now expect.

The narrator today has a more challenging job than the teller of the story about neutral, Entente, and Central Power currencies during World War I. (See Brown, Brendan “Monetary Chaos in Europe” chapter 2 [Routledge, 2011].)

Today’s Russia war (whether the military conflict in Ukraine or the EU/US-Russia economic war) is not so all-pervasive in global economic and monetary affairs, though it is doubtless prominent. The monetary setting of the story today is much more nuanced than in World War I when the prevailing expectation was that peace would mark the start of a journey where key currencies eventually returned to their prewar gold parities.

In the 1914–18 conflict, any sudden news of a possible end to the conflict—as with the peace notes of President Woodrow Wilson in December 1916—would cause a sharp fall of the neutral currencies (Swiss franc, Dutch guilder, Spanish peseta), a big rise in the German mark and Austrian-Hungarian crown, and lesser rises in sterling and the French franc. Today, in principle, a sudden emergence of peace diplomacy would most plausibly send the euro and British pound higher on the one hand and the Canadian dollar, US dollar, and Swiss franc lower on the other hand.

Mutual exhaustion and military stalemate are a combination from which surprise diplomatic moves to end war can emerge. These circumstances apply today.

Ukraine is falling into an economic abyss—much of its infrastructure reportedly destroyed and its government is resorting to the money printing press to pay its soldiers (see Kenneth Rogoff et al., “Macroeconomic Policies for Wartime Ukraine,” Center for Economic and Policy Research, August 12, 2022). General economic aid from Western donors (as against military aid) is running far short of promises. All these pictures of Russian munitions stores on fire may or may not have excited some potential donors, but they have not heralded any breakthrough.

The human toll—both amongst military personnel and civilians—fans Moscow propaganda that the US and UK are willing to conduct their proxy war against Russia down to the life of the last Ukrainian soldier.

Meanwhile there are these presumably leaked stories in the Washington Post about how President Volodymyr Zelensky betrayed the Ukrainian people by not sharing with them in late 2021 and early 2022 the US intelligence alerts about a looming Russian invasion. According to the stories, many Ukrainians resent that they were not warned by their government and do not accept its shocking excuses (for example, to prevent a flight of capital out of the country).

Is all this preparing ground for a possible power shift in Kiev that might favor an early diplomatic solution even in time for President Joe Biden to claim credit ahead of the midterms? Western Europe will be spared some pain this winter if the initial ceasefire agreement includes a provision that Moscow desist from turning off the gas pipelines.

The purpose here is not to predict the war’s outcome but to describe a peace scenario that is within the mainstream and to map out how the rising likelihood of its realization would influence currency markets.

The main channel of influence on currencies would be the course of the EU/US-Russia economic war. A ceasefire would excite expectations of big relief to the natural gas shortage in Western Europe.

Prices there for natural gas would plunge. In turn, that would lift consumer and business spirits, now depressed by feared astronomic gas bills and even gas rationing this winter. Massive programs to relieve fuel poverty, financed by monetary inflation, would stop in their tracks. The European Central Bank (ECB) could move resolutely to tighten monetary conditions as the depression fears faded.

We could well imagine that the peace scenario would mean the European economies in 2023 would rebound from a winter downturn. That would coincide with the US economy sinking into recession as the “Powell disinflation” works its way through—including continued bubble bursting in the tech space and residential construction sector plus a possible private equity bust.

A big rise of the euro under the peace scenario, though likely, is not a slam-dunk proposition. Russia might delay turning the gas pipelines back on until there is an assurance about its central bank’s frozen deposits in Western Europe. There has been chatter from the top of the Organisation for Economic Co-operation and Development (OECD) down that a reparations commission would sequester these.

More broadly, it could be that most European households are not cutting back their spending to the extent assumed in the consensus economic forecasts. Many individuals may have never believed that the high natural gas prices would persist beyond this winter. Then they faced, in effect, a transitory rather than permanent tax rise. Economic theory suggests that such transitory taxes, paid in this case to North American natural gas producers, have much less impact than permanent ones on spending.

There are still the deep ailments of the euro. How can the ECB ever normalize monetary conditions when so much of the monetary base is backed by loans and credits to weak sovereigns and banks (see Brendan Brown, “ECB’s Long Journey into Currency Collapse Just Got a Lot Shorter,” Mises Wire, July 23, 2022)?

In principle, the US dollar, and even more so the Canadian dollar, would lose from peace as they have gained from war. Both have obtained fuel from the boom in their issuing country’s energy sector. In neither country has there been aggregate real income loss due to the economic war—in fact, there has been a gain in the case of Canada. A further positive for the US dollar has been the boom in the US armaments sector—and this should continue beyond a ceasefire.

Peace will not deflect Europe from seeking to diversify its energy supplies away from Russia and to North American gas and to renewables. But we can imagine that in the long-run, Germany could have a comparative advantage in the renewable space; and North America could lose potential sales outside Europe to Russian gas at discounted prices. Russia is widely expected to prioritize a vamped-up construction program for LNG (liquid natural gas) terminals. These will enable the export of its natural gas to world markets.

Bottom line: peace is likely to be a negative for the US dollar. But transcending this influence is the huge issue of how and when US monetary inflation regains virulence.

About the Author:

Brendan Brown is a founding partner of Macro Hedge Advisors (www.macrohedgeadvisors.com) and senior fellow at Hudson Institute. He is an international monetary and financial economist, consultant, and author, his roles have included Head of Economic Research at Mitsubishi UFJ Financial Group and is also a Senior Fellow of the Mises Institute. Brendan authored Europe’s Century of Crises under Dollar Hegemony: A Dialogue on the Global Tyranny of Unsound Money with Philippe Simonnot.

The article was republished with permission from The Mises Institute. The original version can be found here.