Metals & Mining Spotlight: Rare Earth Elements

Thursday, June 12, 2025

Mark Reichman, Senior Research Analyst, Natural Resources, Noble Capital Markets, Inc.

Refer to the bottom of the report for important disclosures

Demand for rare earth elements expected to grow. Demand for rare earth elements is expected to grow meaningfully through 2030 and beyond, driven by electric vehicles, wind turbines, grid upgrades, and advanced defense technologies. According to the IEA, global rare earth demand could double by 2050 under a net-zero scenario, underscoring the growing strategic relevance in the global energy transition.

China dominates the REE market. According to the 2024 edition of the Energy Institute Statistical Review of World Energy, China accounted for 67.9% of rare earth mineral production in 2023 and 38.1% of rare earth mineral reserves, while accounting for most of the midstream and downstream capacity. While mining activity is gradually diversifying, the refining stage remains concentrated. This level of concentration poses a risk to both the U.S. supply chain and national security.

U.S. policymakers seek to reduce dependence on China. U.S. policymakers are increasingly focused on reducing dependence on China for rare earth elements, viewing it as a national security and industrial resilience issue. Recent actions include invoking the Defense Production Act, funding domestic processing projects, and expanding international partnerships through initiatives like the Minerals Security Partnership. Legislative efforts and strategic investments are aimed at reshoring supply chains and building alternative capacity in allied countries such as Canada and Australia.

Necessity is the mother of invention. While the Trump Administration is taking appropriate action and policy momentum is growing, the path to increasing rare earth supply chain independence is complex and will take time. Policymakers may need to work with allies, such as Canada, to promote a North American supply chain that encompasses all aspects of the REE value chain, including upstream, midstream, and downstream. In addition to supportive public policy, private industry will likely need financial support from governments to kick start the effort.

Metals and Mining Spotlight: Rare Earth Elements

Rare earth elements (REEs) are comprised of 15 elements in the lanthanum series, along with scandium and yttrium. While not lanthanides, scandium and yttrium are classified as rare earth elements because they occur within the same ore deposits and share similar chemical properties. While the actual elements may not be rare, it is often difficult to find them in sufficient concentrations for economic extraction, and they require extensive processing. Cerium, lanthanum, neodymium, praseodymium, and promethium are considered light rare earth elements. Europium, gadolinium, and samarium are often referred to as medium rare earth elements, while dysprosium, erbium, holmium, lutetium, terbium, thulium, and ytterbium are considered heavy rare earth elements. We do not classify scandium (Sc) or yttrium (Y) as light, medium, or heavy. Below is a table summarizing the elements and their symbols.

Figure 1: Rare Earth Elements and Atomic Number and Symbol

Source: Noble Capital Markets, Inc.

One of the many uses of rare earth elements is in the production of permanent magnets which are critical components in electric vehicles, wind turbines, and other communication and defense technologies. Neodymium and praseodymium are critical materials in the manufacturing of neodymium-iron-boron (NdFeB) magnets, which have among the highest magnetic strength among commercially available magnets and promote high energy density and efficiency in energy technologies. They are often referred to as NdPr magnets because they generally contain about one-third neodymium, of which some of that can be replaced by praseodymium. While REEs are used for a variety of applications, the highest value REEs are neodymium and praseodymium, which currently drive the value of mixed rare earth concentrates and precipitates. By economic value, neodymium-praseodymium (NdPr) is the largest segment of the REE market. NdPr is primarily used in neodymium-iron-boron (NdFeB) permanent magnets for electric machines, such as electric vehicle (EV) traction motors, wind power generators, drones, robotics, electronics, and other applications. Given the wide-ranging uses of these component materials in critical infrastructure essential for national security and economic growth, the U.S. government has taken an interest in industry concentration.   

Figure 2: Rare Earth Applications

Source: National Energy Technology Laboratory

According to the 2024 edition of the Energy Institute Statistical Review of World Energy, China accounted for 67.9% of rare earth mineral production in 2023 and 38.1% of rare earth mineral reserves. Conversely, the United States accounted for 12.2% of rare earth mineral production in 2023 and 1.6% of rare earth mineral reserves.

Figure 3: Rare Earth Metals Production and Reserves

Source: Energy Institute Statistical Review of World Energy 2024

Supply Chain and Pricing Overview

The supply chain for rare earths includes upstream, midstream, and downstream components.

Figure 4: Rare Earth Element Supply Chain

Source: Critical Materials Rare Earths Supply Chain: A Situational White Paper, U.S. Department of Energy, Office of Energy Efficiency & Renewable Energy, April 2020

As illustrated in Figure 4, concentration or beneficiation is an extractive metallurgy process that upgrades the value of mineral ores that contain raw REEs by removing low value minerals and resulting in a higher-grade product such as rare-earth concentrate.

Separation is the process of separating individual REEs from one another in the rare earth oxide (REO) concentrates. Separation of REEs is chemically intensive because the REEs are chemically similar. Processing refers to the conversion of REOs to rare earth metals, such as neodymium metal which can then be used to form alloys. China controls most of the midstream separating and processing capacity.

There is no single price for REEs collectively, but numerous prices for REE oxides and compounds individually. Pricing information for rare earths is opaque and generally available by paid subscription. Public information is generally not comprehensive and generally does not provide detailed information as to quality and origin, which makes comparisons difficult. Below we have provided a pricing sample of the most valuable elements as of June 11, 2025.

Figure 5: Pricing Data for Select Rare Earth Elements (REE)

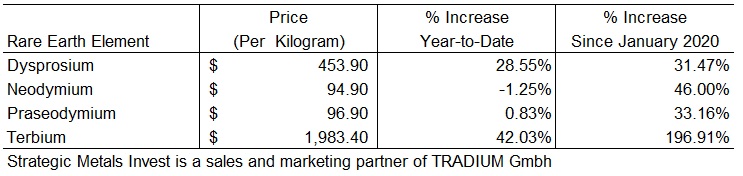
Source: Strategic Metals Invest

U.S. Rare Earth Element Market

According to the U.S. Department of the Interior, the estimated value of rare-earth compounds and metals imported by the United States in 2023 was $190 million, down 7% from $208 million in 2022. Catalysts represented the leading domestic end use for rare earths, followed by applications in ceramics and glass, metallurgical alloys, polishing, and embedded permanent magnets in finished goods. While rare earth recycling is expected to grow in the coming years, current recovery rates from sources such as batteries and permanent magnets remain limited. The table below provides some statistics associated with the rare earths market in the United States.

Figure 6: United States REE Market Statistics

Source: Mineral Commodity Summaries 2024, U.S. Department of the Interior, U.S. Geological Survey

Given the United States’ reliance on imports, we think Canadian producers stand to benefit from a shift away from sources in China. As processing capabilities are developed, the U.S. could be an important destination for Canada sourced materials.

Key REE Market Participants

The global rare earth industry remains defined by a limited number of dominant players, most of which are concentrated in China. China Northern Rare Earth Group (SHH: 600111), and China Minmetals are the largest vertically integrated producers, with strong government alignment and control over both upstream mining and midstream separation capacity. These firms benefit from large-scale infrastructure, domestic demand, and preferential access to processing technology that remains restricted from foreign use.

Outside China, Lynas Rare Earths (ASX: LYC, OTC: LYSDY), in Australia is the largest fully integrated producer, with upstream operations at Mount Weld and a separation plant in Malaysia. Lynas is expanding into heavy rare earth processing in Texas through a strategic partnership with the U.S. Department of Defense.

MP Materials, the most significant rare earth materials producer in the United States, completed a business combination with Fortress Value Acquisition Corp., a special purpose acquisition company and began trading on the New York Stock Exchange on November 18, 2020, under the ticker MP. MP Materials owns and operates the Mountain Pass rare earth mine and processing facility in California which opened in 1952 as a uranium producer, pivoted to one of the largest suppliers of rare earth minerals, but closed in 2002 as environmental restrictions and imports made it difficult to compete. The facility underwent various ownership changes and reopened in 2017 under MP Materials’ ownership. It is North America’s only active and scaled rare earth production site and now has a market capitalization of $4.1 billion as of June 11, 2025.

The Mountain Pass mine in California and is the only active rare-earth mine in the United States. The company has restarted oxide production and is building refining and alloying capacity in Texas. MP has signed multi-year offtake agreements with original equipment manufacturers (OEMs), including General Motors, aimed at creating a vertically integrated domestic supply chain. However, the company still relies on China to assist in the separation process for some of its output, underscoring the current U.S. capabilities gap.

Additional participants working to expand non-Chinese supply chains include Iluka Resources (ASX: ILU, OTC: ILKAF) and Arafura Rare Earths (ASX: ARU, OTC: ARAFF), both based in Australia. Iluka is building a new facility with support from the Australian government, aimed at handling all stages of rare earth production. Arafura is also developing a new project with backing from international lenders, focused on supplying materials used in magnets for electric motors and other technologies. On the downstream side, magnet production is dominated by firms such as Shin-Etsu (TSE: 4063, OTC: SHECY), Hitachi Metals, and JL MAG (SZSC: 300748, OTC: JMREY), with capacity heavily skewed toward Asia. Efforts among U.S. and allied countries to establish domestic magnet manufacturing are progressing but remain in the early stages.

Additional publicly traded companies that have exposure to rare earths include: M2i Global Inc. (OTC: MTWO), Defense Metals (TSX: DEFN, OTC: DFMTF), Energy Fuels (NYSE: UUUU, TSX: EFR), NioCorp Developments (NASDAQ: NB), Aclara Resources (TSX: ARA, OTC: ARAAF), Mkango Resources (TSXV: MKA, OTC: MKNGF), Ucore Rare Metals (TSXV: UCU, OTC: UURAF), Rainbow Rare Earths (LSE: RBW, OTC: RBWRF), Hastings Technology Metals (ASX: HAS, OTC: HSRMF), Pensana Plc (LSE: PRE, OTC: PNSPF), and Neo Performance Materials (TSX: NEO, OTC: NOPMF). 

U.S Policymakers Take Action

China dominates the production of many critical minerals, including rare earth elements. There appears to be an awakening among U.S. policy makers of the dangers of dependence on foreign sources for critical minerals, especially those that are adversarial to the United States. We believe a shift is underway to source REEs from countries that are friendly to the United States, including Canada. As part of its strategy to ensure secure and reliable supplies of critical minerals, the U.S. Department of the Interior identified 35 critical minerals, including the rare earth elements group. The U.S. Government is planning to fund rare earths projects to reduce reliance on China. In January 2022, bipartisan legislation was introduced, the Restoring Essential Energy and Security Holdings Onshore for Rare Earths Act, to protect the U.S. from the threat of rare-earth element supply disruptions, encourage domestic production, and reduce reliance on China. REEs are found in mineral deposits such as bastnaesite and monazite, the two largest sources of REEs. Bastnaesite, a carbonate-fluoride mineral, typically contains cerium, lanthanum, neodymium, and praseodymium. Monazite, a phosphate mineral, typically contains cerium, lanthanum, neodymium, and samarium. Rare earths are mined domestically in the United States. Bastnaesite is extracted at the mine in Mountain Pass, California.

Since January 2025, the Trump administration has significantly expanded its strategic focus on rare earth supply chain security. In April, an executive order initiated an investigation into whether U.S. dependence on foreign sources of rare earths constitutes a national security threat. An additional order opened up new offshore exploration zones for critical minerals, including seabed areas believed to contain rare earth and battery metals.

Furthermore, the administration has invoked the Defense Production Act to allocate capital and permit support to midstream and downstream segments of the rare earth supply chain. MP Materials began producing rare earth metals at its Texas facility, while Lynas advanced its U.S. processing plant with support from the Department of Defense. These efforts are part of a broader strategy to rebuild U.S. capabilities across the rare earth value chain.

International partnerships have also gained momentum. The U.S. is advancing cooperation with Australia, Canada, and Ukraine to secure alternative sources of supply and coordinate project financing through the Minerals Security Partnership. A bilateral agreement with Ukraine is expected to facilitate exploration and development of new deposits, while Australia remains a primary ally for both upstream mining and technical collaboration.

Outlook

The rare earth industry is entering a period of strong growth and growing strategic relevance. According to the International Energy Agency (IEA), magnet-grade rare earth demand could double by 2050, and mining projects could rise by 52% by 2040, under current policy (IEA, Critical Minerals Report, 2024). These forecasts are driven by growth in electric vehicle drivetrains, offshore wind development, and precision defense systems, all of which rely heavily on rare earth magnets for performance, efficiency, and miniaturization. As a result, rare earths have transitioned from niche industrial inputs to core strategic resources.

Figure 7: REE Demand Outlook and Mining Requirements (kt REE)

Source: Global Critical Minerals Outlook 2024, International Energy Agency (IEA)

We note that the IEA’s forecasts are based on three scenarios. These include: 1) the Stated Policies Scenario (STEPS), 2) the Announced Pledges Scenario (APS), and 3) the Net Zero Emissions by 2050 Scenario (NZE). The Stated Policies Scenario is based on current policy settings. The Announced Pledges Scenario assumes that governments will meet all climate-related commitments they have announced, including net zero emissions targets. The Net Zero Emissions by 2050 Scenario represents a pathway for the global energy sector to achieve net zero carbon dioxide emissions by 2050. These are summarized, of course, and readers may consult the IEA’s report for a more detailed description.  

In the short term, challenges will continue to shape how supply chains evolve outside of China. Most new projects in Western countries face long approval timelines due to environmental reviews, local opposition, and infrastructure gaps. While government funding and procurement support are improving, the limited availability of midstream processing remains a key constraint. 

In our view, rare earths are evolving from niche industrial inputs to foundational resources for advanced economies. Although the industry currently operates at a scale that lags its growing strategic importance, recent policy momentum and expanded investment across allied nations are setting the stage for meaningful transformation. Looking ahead, we expect a more balanced and resilient global supply chain to emerge—anchored by deepening cooperation between the United States, Canada, Australia, and European partners. While China will remain a major player in the near term, the diversification of supply chains is gaining traction, signaling a shift toward greater self-sufficiency and long-term security among like-minded nations.


GENERAL DISCLAIMERS

All statements or opinions contained herein that include the words “we”, “us”, or “our” are solely the responsibility of Noble Capital Markets, Inc.(“Noble”) and do not necessarily reflect statements or opinions expressed by any person or party affiliated with the company mentioned in this report. Any opinions expressed herein are subject to change without notice. All information provided herein is based on public and non-public information believed to be accurate and reliable, but is not necessarily complete and cannot be guaranteed. No judgment is hereby expressed or should be implied as to the suitability of any security described herein for any specific investor or any specific investment portfolio. The decision to undertake any investment regarding the security mentioned herein should be made by each reader of this publication based on its own appraisal of the implications and risks of such decision.

This publication is intended for information purposes only and shall not constitute an offer to buy/sell or the solicitation of an offer to buy/sell any security mentioned in this report, nor shall there be any sale of the security herein in any state or domicile in which said offer, solicitation or sale would be unlawful prior to registration or qualification under the securities laws of any such state or domicile. This publication and all information, comments, statements or opinions contained or expressed herein are applicable only as of the date of this publication and subject to change without prior notice. Past performance is not indicative of future results. Noble accepts no liability for loss arising from the use of the material in this report, except that this exclusion of liability does not apply to the extent that such liability arises under specific statutes or regulations applicable to Noble. This report is not to be relied upon as a substitute for the exercising of independent judgement. Noble may have published, and may in the future publish, other research reports that are inconsistent with, and reach different conclusions from, the information provided in this report. Noble is under no obligation to bring to the attention of any recipient of this report, any past or future reports. Investors should only consider this report as single factor in making an investment decision.

IMPORTANT DISCLOSURES

This publication is confidential for the information of the addressee only and may not be reproduced in whole or in part, copies circulated, or discussed to another party, without the written consent of Noble Capital Markets, Inc. (“Noble”). Noble seeks to update its research as appropriate, but may be unable to do so based upon various regulatory constraints. Research reports are not published at regular intervals; publication times and dates are based upon the analyst’s judgement. Noble professionals including traders, salespeople and investment bankers may provide written or oral market commentary, or discuss trading strategies to Noble clients and the Noble proprietary trading desk that reflect opinions that are contrary to the opinions expressed in this research report.
The majority of companies that Noble follows are emerging growth companies. Securities in these companies involve a higher degree of risk and more volatility than the securities of more established companies. The securities discussed in Noble research reports may not be suitable for some investors and as such, investors must take extra care and make their own determination of the appropriateness of an investment based upon risk tolerance, investment objectives and financial status.

Company Specific Disclosures

The following disclosures relate to relationships between Noble and the company (the “Company”) covered by the Noble Research Division and referred to in this research report.
Noble is not a market maker in any of the companies mentioned in this report. Noble intends to seek compensation for investment banking services and non-investment banking services (securities and non-securities related) with any or all of the companies mentioned in this report within the next 3 months

ANALYST CREDENTIALS, PROFESSIONAL DESIGNATIONS, AND EXPERIENCE

Senior Equity Analyst focusing on Basic Materials & Mining. 20 years of experience in equity research. BA in Business Administration from Westminster College. MBA with a Finance concentration from the University of Missouri. MA in International Affairs from Washington University in St. Louis.
Named WSJ ‘Best on the Street’ Analyst and Forbes/StarMine’s “Best Brokerage Analyst.”
FINRA licenses 7, 24, 63, 87

WARNING

This report is intended to provide general securities advice, and does not purport to make any recommendation that any securities transaction is appropriate for any recipient particular investment objectives, financial situation or particular needs. Prior to making any investment decision, recipients should assess, or seek advice from their advisors, on whether any relevant part of this report is appropriate to their individual circumstances. If a recipient was referred to Noble Capital Markets, Inc. by an investment advisor, that advisor may receive a benefit in respect of
transactions effected on the recipients behalf, details of which will be available on request in regard to a transaction that involves a personalized securities recommendation. Additional risks associated with the security mentioned in this report that might impede achievement of the target can be found in its initial report issued by Noble Capital Markets, Inc.. This report may not be reproduced, distributed or published for any purpose unless authorized by Noble Capital Markets, Inc..

RESEARCH ANALYST CERTIFICATION

Independence Of View
All views expressed in this report accurately reflect my personal views about the subject securities or issuers.

Receipt of Compensation
No part of my compensation was, is, or will be directly or indirectly related to any specific recommendations or views expressed in the public
appearance and/or research report.

Ownership and Material Conflicts of Interest
Neither I nor anybody in my household has a financial interest

Government Solutions Industry Report: New ICE Emergency Funding?

Thursday, April 3, 2025

Joe Gomes, Managing Director, Equity Research Analyst, Generalist , Noble Capital Markets, Inc.

Refer to the bottom of the report for important disclosures

Emergency Funding. On Tuesday, the Department of Homeland Security submitted on SAM.gov for an emergency detention and related services strategic sourcing vehicle to bring an additional allotment of detention beds online nationwide, in compliance with the President’s Declaration of a National Emergency at the Southern Border of the United States and related Executive Orders. The maximum ceiling value of the vehicle is $45 billion.

Details. Under the RFP, the government anticipates making multiple indefinite delivery/indefinite quantity (IDIQ) contract awards. It appears the contract will have a two-year period of performance, from April 14, 2025, through April 13, 2027.  Responses are due by April 4th. Under the scope of work, the vendor may be required to provide infrastructure, staffing, services, and/or supplies necessary to provide safe and secure confinement for aliens in the administrative custody of ICE. Ground transportation services may also be required.

Current ICE Population. ICE populations have increased significantly under the new Administration. ADP during the month of October was 38,714, which rose to 40,205 for the month of January. ADP for March 1 through March 22nd was 47,304, while the population on that date was 47,892, according to ICE. There has not yet been a significant change in ATD populations.

Implications. Given the timelines involved and the scope of work required, this ID/IQ would seem to favor the abilities of both CoreCivic and GEO, given their history in the sector and the number of idle facilities that can be brought back online. ICE’s budget in 2024 was $9.7 billion, with about $3.3 billion dedicated to Enforcement and Removal Operations, so a new max of $45 billion is a major jump. If these types of funds are put to use in a timely manner, the current financial projections for both CoreCivic and GEO would prove conservative, in our view.

Research reports on companies mentioned in this report are available by clicking below:

CoreCivic (CXW)

The GEO Group (GEO)


GENERAL DISCLAIMERS

All statements or opinions contained herein that include the words “we”, “us”, or “our” are solely the responsibility of Noble Capital Markets, Inc.(“Noble”) and do not necessarily reflect statements or opinions expressed by any person or party affiliated with the company mentioned in this report. Any opinions expressed herein are subject to change without notice. All information provided herein is based on public and non-public information believed to be accurate and reliable, but is not necessarily complete and cannot be guaranteed. No judgment is hereby expressed or should be implied as to the suitability of any security described herein for any specific investor or any specific investment portfolio. The decision to undertake any investment regarding the security mentioned herein should be made by each reader of this publication based on its own appraisal of the implications and risks of such decision.

This publication is intended for information purposes only and shall not constitute an offer to buy/sell or the solicitation of an offer to buy/sell any security mentioned in this report, nor shall there be any sale of the security herein in any state or domicile in which said offer, solicitation or sale would be unlawful prior to registration or qualification under the securities laws of any such state or domicile. This publication and all information, comments, statements or opinions contained or expressed herein are applicable only as of the date of this publication and subject to change without prior notice. Past performance is not indicative of future results. Noble accepts no liability for loss arising from the use of the material in this report, except that this exclusion of liability does not apply to the extent that such liability arises under specific statutes or regulations applicable to Noble. This report is not to be relied upon as a substitute for the exercising of independent judgement. Noble may have published, and may in the future publish, other research reports that are inconsistent with, and reach different conclusions from, the information provided in this report. Noble is under no obligation to bring to the attention of any recipient of this report, any past or future reports. Investors should only consider this report as single factor in making an investment decision.

IMPORTANT DISCLOSURES

This publication is confidential for the information of the addressee only and may not be reproduced in whole or in part, copies circulated, or discussed to another party, without the written consent of Noble Capital Markets, Inc. (“Noble”). Noble seeks to update its research as appropriate, but may be unable to do so based upon various regulatory constraints. Research reports are not published at regular intervals; publication times and dates are based upon the analyst’s judgement. Noble professionals including traders, salespeople and investment bankers may provide written or oral market commentary, or discuss trading strategies to Noble clients and the Noble proprietary trading desk that reflect opinions that are contrary to the opinions expressed in this research report.
The majority of companies that Noble follows are emerging growth companies. Securities in these companies involve a higher degree of risk and more volatility than the securities of more established companies. The securities discussed in Noble research reports may not be suitable for some investors and as such, investors must take extra care and make their own determination of the appropriateness of an investment based upon risk tolerance, investment objectives and financial status.

Company Specific Disclosures

The following disclosures relate to relationships between Noble and the company (the “Company”) covered by the Noble Research Division and referred to in this research report.
Noble is not a market maker in any of the companies mentioned in this report. Noble intends to seek compensation for investment banking services and non-investment banking services (securities and non-securities related) with any or all of the companies mentioned in this report within the next 3 months

ANALYST CREDENTIALS, PROFESSIONAL DESIGNATIONS, AND EXPERIENCE

Senior Equity Analyst focusing on Basic Materials & Mining. 20 years of experience in equity research. BA in Business Administration from Westminster College. MBA with a Finance concentration from the University of Missouri. MA in International Affairs from Washington University in St. Louis.
Named WSJ ‘Best on the Street’ Analyst and Forbes/StarMine’s “Best Brokerage Analyst.”
FINRA licenses 7, 24, 63, 87

WARNING

This report is intended to provide general securities advice, and does not purport to make any recommendation that any securities transaction is appropriate for any recipient particular investment objectives, financial situation or particular needs. Prior to making any investment decision, recipients should assess, or seek advice from their advisors, on whether any relevant part of this report is appropriate to their individual circumstances. If a recipient was referred to Noble Capital Markets, Inc. by an investment advisor, that advisor may receive a benefit in respect of
transactions effected on the recipients behalf, details of which will be available on request in regard to a transaction that involves a personalized securities recommendation. Additional risks associated with the security mentioned in this report that might impede achievement of the target can be found in its initial report issued by Noble Capital Markets, Inc.. This report may not be reproduced, distributed or published for any purpose unless authorized by Noble Capital Markets, Inc..

RESEARCH ANALYST CERTIFICATION

Independence Of View
All views expressed in this report accurately reflect my personal views about the subject securities or issuers.

Receipt of Compensation
No part of my compensation was, is, or will be directly or indirectly related to any specific recommendations or views expressed in the public
appearance and/or research report.

Ownership and Material Conflicts of Interest
Neither I nor anybody in my household has a financial interest in the securities of the subject company or any other company mentioned in this report.

Energy Industry Report – Energy stocks rise with oil prices

This image has an empty alt attribute; its file name is image-1-1024x232.png

Tuesday, April 2, 2024

Michael Heim, CFA, Senior Research Analyst, Noble Capital Markets, Inc.

Refer to the bottom of the report for important disclosures

Energy stocks outpaced the general overall market in the March quarter due to a rise in oil prices. Higher oil prices reflect improving global economics and Middle East concerns. Natural gas prices continued to fall due to warm weather and high storage levels.

The United States is ramping up the export of oil and liquified natural gas. Oil exports have helped offset a reduction in  OPEC exports. The United States, once a large importer of LNG, is now the largest exporter. LNG exports have helped European countries replace gas from Russia.

Balance sheets have improved and management has become more disciplined. Most energy companies used the recent strength in energy prices to pay down debt and repurchase shares instead of expanding operations. This new-found discipline leaves the companies in a good position to make investments quickly should energy prices rise, which we believe could happen with an improvement in global economic conditions.

We remain positive on the sector. We look for energy companies, especially those focused on oil, to continue to outpace the overall market should energy prices rise.

Energy stocks, as measured by the Energy Select Sector SPDR Fund (XLE), rose 12.9% during the quarter ended March 31, 2024. The increase was slightly higher than the 10.2% increase in the S&P Composite index. Energy stocks were boosted by a 16.1% increase in the May oil futures prices, which more than offset a 29.9% decrease in the May natural gas futures price. 

At current oil prices, domestic producers are able to produce oil at profitable levels. Oil production has grown from 5 million barrels of oil per day (mmboe/d) in 2008 to the current level above 12 mmboe/d. Most of the production has come from increased drilling in the Permian Basin. Rig count has risen steadily in recent years to a level above 500 rigs but remains well below the 1600 rig level seen as recently as 2012. Increase production from fewer rigs demonstrated productivity gains in recent years as well as an increased focus on drilling in the Permian Basin, an area with high initial flow rates.

Figure #1

As domestic production grows, the United States has taken on an increased role supplying oil across the world. Oil exports have grown steadily in recent years. U.S. production has largely replaced the import of oil from OPEC which has declined from 0.20 million barrels of oil per day in 2008 to 0.03 million mmboe/d in January 2024.

Figure #2

An even more dramatic story can be told regarding natural gas production. Production continues to rise even as natural gas prices remain weak. Higher production comes despite a reduction in natural gas rigs from a peak level near 1600 in 2008 to the current level of 112. Once again, increased productivity comes due to a focus on drilling in areas with shale formations where horizontal drilling and fracking greatly increase initial production rates.

Figure #3

The United States has been steadily increasing the amount of liquified natural gas it exports. In fact, the United States has recently become the largest exporter of LNG. This transformation from being the largest importer of LNG to becoming the largest exporter has taken place in less than 20 years. Much of the increase in exports reflects increased deliveries to European countries in response to a decrease in natural gas from Russia.

Figure #4

The increased involvement in the global energy trade has improved the profitability of domestic producers. Most producers are receiving high netbacks at current energy prices. This is especially true for producers focused on oil. With strong balance sheets and a new-found management discipline that focuses on rewarding shareholders over expanding operations, we believe most energy companies are well positioned to grow earnings and cash flow at current prices. At the same time, they are able to expand operations should prices rise, as we believe could happen as global economic conditions improve. We look for energy stocks to continue their strength and maintain our favorable outlook on the group.


GENERAL DISCLAIMERS

All statements or opinions contained herein that include the words “we”, “us”, or “our” are solely the responsibility of Noble Capital Markets, Inc.(“Noble”) and do not necessarily reflect statements or opinions expressed by any person or party affiliated with the company mentioned in this report. Any opinions expressed herein are subject to change without notice. All information provided herein is based on public and non-public information believed to be accurate and reliable, but is not necessarily complete and cannot be guaranteed. No judgment is hereby expressed or should be implied as to the suitability of any security described herein for any specific investor or any specific investment portfolio. The decision to undertake any investment regarding the security mentioned herein should be made by each reader of this publication based on its own appraisal of the implications and risks of such decision.

This publication is intended for information purposes only and shall not constitute an offer to buy/sell or the solicitation of an offer to buy/sell any security mentioned in this report, nor shall there be any sale of the security herein in any state or domicile in which said offer, solicitation or sale would be unlawful prior to registration or qualification under the securities laws of any such state or domicile. This publication and all information, comments, statements or opinions contained or expressed herein are applicable only as of the date of this publication and subject to change without prior notice. Past performance is not indicative of future results. Noble accepts no liability for loss arising from the use of the material in this report, except that this exclusion of liability does not apply to the extent that such liability arises under specific statutes or regulations applicable to Noble. This report is not to be relied upon as a substitute for the exercising of independent judgement. Noble may have published, and may in the future publish, other research reports that are inconsistent with, and reach different conclusions from, the information provided in this report. Noble is under no obligation to bring to the attention of any recipient of this report, any past or future reports. Investors should only consider this report as single factor in making an investment decision.

IMPORTANT DISCLOSURES

This publication is confidential for the information of the addressee only and may not be reproduced in whole or in part, copies circulated, or discussed to another party, without the written consent of Noble Capital Markets, Inc. (“Noble”). Noble seeks to update its research as appropriate, but may be unable to do so based upon various regulatory constraints. Research reports are not published at regular intervals; publication times and dates are based upon the analyst’s judgement. Noble professionals including traders, salespeople and investment bankers may provide written or oral market commentary, or discuss trading strategies to Noble clients and the Noble proprietary trading desk that reflect opinions that are contrary to the opinions expressed in this research report.
The majority of companies that Noble follows are emerging growth companies. Securities in these companies involve a higher degree of risk and more volatility than the securities of more established companies. The securities discussed in Noble research reports may not be suitable for some investors and as such, investors must take extra care and make their own determination of the appropriateness of an investment based upon risk tolerance, investment objectives and financial status.

Company Specific Disclosures

The following disclosures relate to relationships between Noble and the company (the “Company”) covered by the Noble Research Division and referred to in this research report.
Noble is not a market maker in any of the companies mentioned in this report. Noble intends to seek compensation for investment banking services and non-investment banking services (securities and non-securities related) with any or all of the companies mentioned in this report within the next 3 months

ANALYST CREDENTIALS, PROFESSIONAL DESIGNATIONS, AND EXPERIENCE

Senior Equity Analyst focusing on Basic Materials & Mining. 20 years of experience in equity research. BA in Business Administration from Westminster College. MBA with a Finance concentration from the University of Missouri. MA in International Affairs from Washington University in St. Louis.
Named WSJ ‘Best on the Street’ Analyst and Forbes/StarMine’s “Best Brokerage Analyst.”
FINRA licenses 7, 24, 63, 87

WARNING

This report is intended to provide general securities advice, and does not purport to make any recommendation that any securities transaction is appropriate for any recipient particular investment objectives, financial situation or particular needs. Prior to making any investment decision, recipients should assess, or seek advice from their advisors, on whether any relevant part of this report is appropriate to their individual circumstances. If a recipient was referred to Noble Capital Markets, Inc. by an investment advisor, that advisor may receive a benefit in respect of
transactions effected on the recipients behalf, details of which will be available on request in regard to a transaction that involves a personalized securities recommendation. Additional risks associated with the security mentioned in this report that might impede achievement of the target can be found in its initial report issued by Noble Capital Markets, Inc.. This report may not be reproduced, distributed or published for any purpose unless authorized by Noble Capital Markets, Inc..

RESEARCH ANALYST CERTIFICATION

Independence Of View
All views expressed in this report accurately reflect my personal views about the subject securities or issuers.

Receipt of Compensation
No part of my compensation was, is, or will be directly or indirectly related to any specific recommendations or views expressed in the public
appearance and/or research report.

Ownership and Material Conflicts of Interest
Neither I nor anybody in my household has a financial interest in the securities of the subject company or any other company mentioned in this report.

Metals & Mining First Quarter 2024 Review and Outlook

Monday, April 1, 2024

Mark Reichman, Senior Research Analyst, Natural Resources, Noble Capital Markets, Inc.

Refer to the bottom of the report for important disclosures

Relative performance. During the first quarter, mining companies (as measured by the XME) appreciated 0.8% compared to a gain of 10.2% for the S&P 500 index. The VanEck Vectors Gold Miners (GDX) and Junior Gold Miners (GDXJ) ETFs were up 2.0% and 2.2%, respectively. Gold, silver, and copper futures prices gained 8.8%, 4.5%, and 3.1%, respectively, while zinc, lead and nickel declined 5.6%, 1.6%, and 1.2%. Central Banks around the world added to global gold reserves in January with demand expected to remain durable throughout 2024 due in part to a desire among some nations to diversify away from the U.S. dollar as the benchmark reserve currency.

Precious metals outlook. The U.S. Federal Reserve maintained its benchmark overnight borrowing rate at its March meeting and signaled the potential for rate cuts in 2024. Inflation appears to be moderating. The core personal consumption expenditures (PCE) price index, the Fed’s preferred gauge of inflation, was up 2.8% from February 2023 to February 2024, following a 2.9% increase from January 2023 to January 2024. The outlook for the gold price remains constructive due to expectations of one or more rate cuts in 2024, continued geopolitical uncertainty, concerns about the growth in U.S. deficit spending and the national debt, and increasing investments in gold by central banks. To some degree, lower rate expectations may already be factored into the price of gold.

Outlook for industrial and battery metals. Following weakness in 2023 due to lower economic growth expectations, industrial metals prices could strengthen when monetary policy increases the odds for a more durable economic outlook. Inventory re-stocking and longer-term secular trends such as electrification remain supportive of supply and demand fundamentals for metals such as copper. For battery metals, a more gradual path for electric vehicle adoption may lead to continued volatility in lithium, cobalt, and nickel prices although longer-term demand fundamentals remain favorable. During the first quarter, futures prices for battery grade lithium rose 11.4%, while cobalt and nickel prices fell 1.2%.

Putting it all together. Because the performance of precious metals mining equities has lagged the strength in gold prices, equities could offer greater upside at this point as investors take notice of attractive valuations juxtaposed against a strong gold price. Junior companies remain particularly attractive based on valuation, and we expect industry consolidation to accelerate as senior producers seek to replenish reserves and resources.


GENERAL DISCLAIMERS

All statements or opinions contained herein that include the words “we”, “us”, or “our” are solely the responsibility of Noble Capital Markets, Inc.(“Noble”) and do not necessarily reflect statements or opinions expressed by any person or party affiliated with the company mentioned in this report. Any opinions expressed herein are subject to change without notice. All information provided herein is based on public and non-public information believed to be accurate and reliable, but is not necessarily complete and cannot be guaranteed. No judgment is hereby expressed or should be implied as to the suitability of any security described herein for any specific investor or any specific investment portfolio. The decision to undertake any investment regarding the security mentioned herein should be made by each reader of this publication based on its own appraisal of the implications and risks of such decision.

This publication is intended for information purposes only and shall not constitute an offer to buy/sell or the solicitation of an offer to buy/sell any security mentioned in this report, nor shall there be any sale of the security herein in any state or domicile in which said offer, solicitation or sale would be unlawful prior to registration or qualification under the securities laws of any such state or domicile. This publication and all information, comments, statements or opinions contained or expressed herein are applicable only as of the date of this publication and subject to change without prior notice. Past performance is not indicative of future results. Noble accepts no liability for loss arising from the use of the material in this report, except that this exclusion of liability does not apply to the extent that such liability arises under specific statutes or regulations applicable to Noble. This report is not to be relied upon as a substitute for the exercising of independent judgement. Noble may have published, and may in the future publish, other research reports that are inconsistent with, and reach different conclusions from, the information provided in this report. Noble is under no obligation to bring to the attention of any recipient of this report, any past or future reports. Investors should only consider this report as single factor in making an investment decision.

IMPORTANT DISCLOSURES

This publication is confidential for the information of the addressee only and may not be reproduced in whole or in part, copies circulated, or discussed to another party, without the written consent of Noble Capital Markets, Inc. (“Noble”). Noble seeks to update its research as appropriate, but may be unable to do so based upon various regulatory constraints. Research reports are not published at regular intervals; publication times and dates are based upon the analyst’s judgement. Noble professionals including traders, salespeople and investment bankers may provide written or oral market commentary, or discuss trading strategies to Noble clients and the Noble proprietary trading desk that reflect opinions that are contrary to the opinions expressed in this research report.
The majority of companies that Noble follows are emerging growth companies. Securities in these companies involve a higher degree of risk and more volatility than the securities of more established companies. The securities discussed in Noble research reports may not be suitable for some investors and as such, investors must take extra care and make their own determination of the appropriateness of an investment based upon risk tolerance, investment objectives and financial status.

Company Specific Disclosures

The following disclosures relate to relationships between Noble and the company (the “Company”) covered by the Noble Research Division and referred to in this research report.
Noble is not a market maker in any of the companies mentioned in this report. Noble intends to seek compensation for investment banking services and non-investment banking services (securities and non-securities related) with any or all of the companies mentioned in this report within the next 3 months

ANALYST CREDENTIALS, PROFESSIONAL DESIGNATIONS, AND EXPERIENCE

Senior Equity Analyst focusing on Basic Materials & Mining. 20 years of experience in equity research. BA in Business Administration from Westminster College. MBA with a Finance concentration from the University of Missouri. MA in International Affairs from Washington University in St. Louis.
Named WSJ ‘Best on the Street’ Analyst and Forbes/StarMine’s “Best Brokerage Analyst.”
FINRA licenses 7, 24, 63, 87

WARNING

This report is intended to provide general securities advice, and does not purport to make any recommendation that any securities transaction is appropriate for any recipient particular investment objectives, financial situation or particular needs. Prior to making any investment decision, recipients should assess, or seek advice from their advisors, on whether any relevant part of this report is appropriate to their individual circumstances. If a recipient was referred to Noble Capital Markets, Inc. by an investment advisor, that advisor may receive a benefit in respect of
transactions effected on the recipients behalf, details of which will be available on request in regard to a transaction that involves a personalized securities recommendation. Additional risks associated with the security mentioned in this report that might impede achievement of the target can be found in its initial report issued by Noble Capital Markets, Inc.. This report may not be reproduced, distributed or published for any purpose unless authorized by Noble Capital Markets, Inc..

RESEARCH ANALYST CERTIFICATION

Independence Of View
All views expressed in this report accurately reflect my personal views about the subject securities or issuers.

Receipt of Compensation
No part of my compensation was, is, or will be directly or indirectly related to any specific recommendations or views expressed in the public
appearance and/or research report.

Ownership and Material Conflicts of Interest
Neither I nor anybody in my household has a financial interest

Government Solutions Industry Report: Additional Funding for ICE

Thursday, March 28, 2022

Joe Gomes, Managing Director, Equity Research Analyst, Generalist , Noble Capital Markets, Inc.

Joshua Zoepfel, Research Associate, Noble Capital Markets, Inc.

Refer to the bottom of the report for important disclosures

2024 Budget. The 2024 budget signed by President Biden significantly increases ICE funding, which could have positive implications for both CoreCivic and The GEO Group. The ICE budget increased $798 million to $9.6 billion, including $5.1 billion for ICE Enforcement and Removal Operations, a $900 million increase, according to the Homeland Security Fiscal 2024 bill summary. ATD funding increased $27.5 million to $470.2 million.

Additional Beds. Detention beds increased to 41,500 from 34,000 in fiscal 2023. We would note, the number of people detained by ICE has exceeded the 34,000 funding amount since mid-August and was 39,111 as of March 10th. At a minimum, the new budget enables ICE to increase detainees by approximately 3,000 and if the recent past is any indication, the actual number of beds in use could easily top the 41,500 level.

Encounters Still High. The most recent data for Southwest Border Encounters indicated 189,922 people were encountered in February, the second highest level for that month in history. Looking at the first five months of the fiscal year, there were some 1.15 million encounters, an annualized rate of 2.76 million, compared to 2.47 million for all of 2023.

Capacity. Even with the current 39,000 detainee level, there appears to be sufficient bed capacity at existing facilities to absorb the incremental 3,000, if it occurs. However, currently idle CoreCivic and GEO facilities may be in play, based on ICE’s geographic and other needs. We view CoreCivic’s Leavenworth and California City facilities and GEO’s North Lake and D. Ray James facilities as logical options if ICE determines a need for additional facilities.

Implications. While the budget was just signed, we view the increases as an incremental net positive for both CoreCivic and The GEO Group. The increased funding and beds are both positives and if we see another Continuing Resolution in the fall, these elevated numbers will stand until a new budget is passed.

Research reports on companies mentioned in this report are available by clicking below:

CoreCivic (CXW)

The GEO Group (GEO)


GENERAL DISCLAIMERS

All statements or opinions contained herein that include the words “we”, “us”, or “our” are solely the responsibility of Noble Capital Markets, Inc.(“Noble”) and do not necessarily reflect statements or opinions expressed by any person or party affiliated with the company mentioned in this report. Any opinions expressed herein are subject to change without notice. All information provided herein is based on public and non-public information believed to be accurate and reliable, but is not necessarily complete and cannot be guaranteed. No judgment is hereby expressed or should be implied as to the suitability of any security described herein for any specific investor or any specific investment portfolio. The decision to undertake any investment regarding the security mentioned herein should be made by each reader of this publication based on its own appraisal of the implications and risks of such decision.

This publication is intended for information purposes only and shall not constitute an offer to buy/sell or the solicitation of an offer to buy/sell any security mentioned in this report, nor shall there be any sale of the security herein in any state or domicile in which said offer, solicitation or sale would be unlawful prior to registration or qualification under the securities laws of any such state or domicile. This publication and all information, comments, statements or opinions contained or expressed herein are applicable only as of the date of this publication and subject to change without prior notice. Past performance is not indicative of future results. Noble accepts no liability for loss arising from the use of the material in this report, except that this exclusion of liability does not apply to the extent that such liability arises under specific statutes or regulations applicable to Noble. This report is not to be relied upon as a substitute for the exercising of independent judgement. Noble may have published, and may in the future publish, other research reports that are inconsistent with, and reach different conclusions from, the information provided in this report. Noble is under no obligation to bring to the attention of any recipient of this report, any past or future reports. Investors should only consider this report as single factor in making an investment decision.

IMPORTANT DISCLOSURES

This publication is confidential for the information of the addressee only and may not be reproduced in whole or in part, copies circulated, or discussed to another party, without the written consent of Noble Capital Markets, Inc. (“Noble”). Noble seeks to update its research as appropriate, but may be unable to do so based upon various regulatory constraints. Research reports are not published at regular intervals; publication times and dates are based upon the analyst’s judgement. Noble professionals including traders, salespeople and investment bankers may provide written or oral market commentary, or discuss trading strategies to Noble clients and the Noble proprietary trading desk that reflect opinions that are contrary to the opinions expressed in this research report.
The majority of companies that Noble follows are emerging growth companies. Securities in these companies involve a higher degree of risk and more volatility than the securities of more established companies. The securities discussed in Noble research reports may not be suitable for some investors and as such, investors must take extra care and make their own determination of the appropriateness of an investment based upon risk tolerance, investment objectives and financial status.

Company Specific Disclosures

The following disclosures relate to relationships between Noble and the company (the “Company”) covered by the Noble Research Division and referred to in this research report.
Noble is not a market maker in any of the companies mentioned in this report. Noble intends to seek compensation for investment banking services and non-investment banking services (securities and non-securities related) with any or all of the companies mentioned in this report within the next 3 months

ANALYST CREDENTIALS, PROFESSIONAL DESIGNATIONS, AND EXPERIENCE

Senior Equity Analyst focusing on Basic Materials & Mining. 20 years of experience in equity research. BA in Business Administration from Westminster College. MBA with a Finance concentration from the University of Missouri. MA in International Affairs from Washington University in St. Louis.
Named WSJ ‘Best on the Street’ Analyst and Forbes/StarMine’s “Best Brokerage Analyst.”
FINRA licenses 7, 24, 63, 87

WARNING

This report is intended to provide general securities advice, and does not purport to make any recommendation that any securities transaction is appropriate for any recipient particular investment objectives, financial situation or particular needs. Prior to making any investment decision, recipients should assess, or seek advice from their advisors, on whether any relevant part of this report is appropriate to their individual circumstances. If a recipient was referred to Noble Capital Markets, Inc. by an investment advisor, that advisor may receive a benefit in respect of
transactions effected on the recipients behalf, details of which will be available on request in regard to a transaction that involves a personalized securities recommendation. Additional risks associated with the security mentioned in this report that might impede achievement of the target can be found in its initial report issued by Noble Capital Markets, Inc.. This report may not be reproduced, distributed or published for any purpose unless authorized by Noble Capital Markets, Inc..

RESEARCH ANALYST CERTIFICATION

Independence Of View
All views expressed in this report accurately reflect my personal views about the subject securities or issuers.

Receipt of Compensation
No part of my compensation was, is, or will be directly or indirectly related to any specific recommendations or views expressed in the public
appearance and/or research report.

Ownership and Material Conflicts of Interest
Neither I nor anybody in my household has a financial interest in the securities of the subject company or any other company mentioned in this report.

Digital, Media & Technology Industry Report: Expecting A Bounce In TV Stocks As The Dust Settles

Thursday, February 8, 2024

Michael Kupinski, Director of Research, Noble Capital Markets, Inc.

Jacob Mutchler, Research Associate, Noble Capital Markets, Inc.

Refer to the bottom of the report for important disclosures

A proposed new sports streaming service. The Walt Disney Company, Fox Corporation, and Warner Bros. Discovery announced that it plans to launch a new live sports streaming service in the fall 2024. The new service is expected to be offered directly to consumers through an app on a subscription basis. 

A lot to work out. There are a number of variables that need to be worked out, including the pricing of the new services. Recent media reports have the streaming service priced at a hefty $40 per month. The app will not include all sports programming and is expected to target sports fans that do not subscribe to a pay-TV package. As such, there will be a limited audience and could even help to expand the reach of local TV stations. 

An over-reaction? Television stocks, including our current covered companies, E.W. Scripps (SSP) and Gray Television (GTN) dropped 24% and 15%, respectively. Investors seem to expect that the new service will be a threat to the companies’ retransmission revenue. And, in the case of Scripps, investors may believe that the new potential service will be in competition of Scripps’ Sports strategy.

Impact on Retrans revenue? The service could accelerate cable subscriber declines, but cord cutters likely will subscribe to a virtual service or connected TV for local channels. Such a move would be neutral to TV broadcasters given that broadcasters are paid Retrans on these platforms as well.  In terms of Scripps Sports, we believe that it likely will not affect its local sports strategy and that it could offer opportunities for partnerships on it national sports strategy. 

 Compelling opportunity. We believe that the sell-off in TV stocks is over done. There appears to be a favorable risk/reward relationship for an industry cycling into an improving fundamental story in 2024, with the influx of high margin Political advertising, a swing toward favorable Retrans revenue growth, lowered debt leverage, and compelling stock valuations. Our favorites are E.W. Scripps and Gray Television. Please see our recent reports on SSP and GTN for stock valuations, ratings, price targets and important disclosure information. 

GENERAL DISCLAIMERS

All statements or opinions contained herein that include the words “we”, “us”, or “our” are solely the responsibility of Noble Capital Markets, Inc.(“Noble”) and do not necessarily reflect statements or opinions expressed by any person or party affiliated with the company mentioned in this report. Any opinions expressed herein are subject to change without notice. All information provided herein is based on public and non-public information believed to be accurate and reliable, but is not necessarily complete and cannot be guaranteed. No judgment is hereby expressed or should be implied as to the suitability of any security described herein for any specific investor or any specific investment portfolio. The decision to undertake any investment regarding the security mentioned herein should be made by each reader of this publication based on its own appraisal of the implications and risks of such decision.

This publication is intended for information purposes only and shall not constitute an offer to buy/sell or the solicitation of an offer to buy/sell any security mentioned in this report, nor shall there be any sale of the security herein in any state or domicile in which said offer, solicitation or sale would be unlawful prior to registration or qualification under the securities laws of any such state or domicile. This publication and all information, comments, statements or opinions contained or expressed herein are applicable only as of the date of this publication and subject to change without prior notice. Past performance is not indicative of future results. Noble accepts no liability for loss arising from the use of the material in this report, except that this exclusion of liability does not apply to the extent that such liability arises under specific statutes or regulations applicable to Noble. This report is not to be relied upon as a substitute for the exercising of independent judgement. Noble may have published, and may in the future publish, other research reports that are inconsistent with, and reach different conclusions from, the information provided in this report. Noble is under no obligation to bring to the attention of any recipient of this report, any past or future reports. Investors should only consider this report as single factor in making an investment decision.

IMPORTANT DISCLOSURES

This publication is confidential for the information of the addressee only and may not be reproduced in whole or in part, copies circulated, or discussed to another party, without the written consent of Noble Capital Markets, Inc. (“Noble”). Noble seeks to update its research as appropriate, but may be unable to do so based upon various regulatory constraints. Research reports are not published at regular intervals; publication times and dates are based upon the analyst’s judgement. Noble professionals including traders, salespeople and investment bankers may provide written or oral market commentary, or discuss trading strategies to Noble clients and the Noble proprietary trading desk that reflect opinions that are contrary to the opinions expressed in this research report.
The majority of companies that Noble follows are emerging growth companies. Securities in these companies involve a higher degree of risk and more volatility than the securities of more established companies. The securities discussed in Noble research reports may not be suitable for some investors and as such, investors must take extra care and make their own determination of the appropriateness of an investment based upon risk tolerance, investment objectives and financial status.

Company Specific Disclosures

The following disclosures relate to relationships between Noble and the company (the “Company”) covered by the Noble Research Division and referred to in this research report.
Noble is not a market maker in any of the companies mentioned in this report. Noble intends to seek compensation for investment banking services and non-investment banking services (securities and non-securities related) with any or all of the companies mentioned in this report within the next 3 months

ANALYST CREDENTIALS, PROFESSIONAL DESIGNATIONS, AND EXPERIENCE

Senior Equity Analyst focusing on Basic Materials & Mining. 20 years of experience in equity research. BA in Business Administration from Westminster College. MBA with a Finance concentration from the University of Missouri. MA in International Affairs from Washington University in St. Louis.
Named WSJ ‘Best on the Street’ Analyst and Forbes/StarMine’s “Best Brokerage Analyst.”
FINRA licenses 7, 24, 63, 87

WARNING

This report is intended to provide general securities advice, and does not purport to make any recommendation that any securities transaction is appropriate for any recipient particular investment objectives, financial situation or particular needs. Prior to making any investment decision, recipients should assess, or seek advice from their advisors, on whether any relevant part of this report is appropriate to their individual circumstances. If a recipient was referred to Noble Capital Markets, Inc. by an investment advisor, that advisor may receive a benefit in respect of
transactions effected on the recipients behalf, details of which will be available on request in regard to a transaction that involves a personalized securities recommendation. Additional risks associated with the security mentioned in this report that might impede achievement of the target can be found in its initial report issued by Noble Capital Markets, Inc.. This report may not be reproduced, distributed or published for any purpose unless authorized by Noble Capital Markets, Inc..

RESEARCH ANALYST CERTIFICATION

Independence Of View
All views expressed in this report accurately reflect my personal views about the subject securities or issuers.

Receipt of Compensation
No part of my compensation was, is, or will be directly or indirectly related to any specific recommendations or views expressed in the public
appearance and/or research report.

Ownership and Material Conflicts of Interest
Neither I nor anybody in my household has a financial interest in the securities of the subject company or any other company mentioned in this report.

Digital, Media & Technology Industry Report: Outlook For 2024

Tuesday, January 16, 2024

Michael Kupinski, Director of Research, Noble Capital Markets, Inc.

Jacob Mutchler, Research Associate, Noble Capital Markets, Inc.

Refer to the bottom of the report for important disclosures

Optimism For A Good 2024. In this report, we provide our advertising outlook for 2024 and provide our best picks to play the expected advertising rebound. Our take on the year is based on an improving economic outlook, particularly in the second half of the year, and heavy influx of Political advertising. Our favorable advertising outlook is based on a resilient labor market and lower interest rates to avoid a recession in 2024.

Have we seen the trough for this cycleWith our economic scenario in mind, we anticipate an improving economic environment in the second half of 2024. Notably, we believe that advertising trends are improving into the first quarter 2024, with the rate of decline moderating for both Radio and Television. 

National advertising expected to strengthen. The weakness in National was the biggest issue for broadcasters in 2023. We believe that National advertising trends should improve in 2024 both from the perspective of a sluggish consumer in the first half and from an improving economic outlook in the second half.

How big will Political be? We anticipate a strong political advertising environment in 2024, an increase of 13% to roughly $10 billion from 2020 levels. Importantly, about half of the high margin political advertising dollars are expected to be spent with television broadcasters. 

Highlights of favorite picks for 2024. Media stocks are typically early cycle stocks, which tend to outperform in the midst of the economic downturn or trough as investors begin to anticipate economic improvement. We believe media stocks are timely and offer a compelling return potential given depressed valuations. In addition, some companies pay a dividend, offering attractive total return potential.

Investment Appraisal

Optimism For A Good 2024

The fortunes of advertising based companies are driven by the economy and the health of the consumer. As such, we start this report with our take on the economy in 2024. On December 4th, at Florida Atlantic University (FAU) in Boca Raton, Florida, Noblecon19 hosted an economic panel to discuss the business environment outlook for 2024. The economic panel consisted of a diverse group of industry professionals with a wide range of expertise and experience. In our economic outlook for 2024, we take into consideration the perspective of Jose Torres, Senior Economist at Interactive Brokers.

Mr. Torres highlighted 2023 as a resilient year for consumer spending, which was driven by excess pandemic savings accumulated in 2020 and 2021. Mr. Torres anticipates a slowdown in consumer spending and a strong labor market in 2024. Notably, he believes a resilient labor market will keep consumers spending and will keep the country from falling into a recession. Additionally, Mr. Torres highlighted that Personal Consumption Expenditures (PCE) annualized inflation over the last six months is running near 2.5%, which is very close to the FED’s goal of 2.0%. With moderating inflation pressures, Mr. Torres highlighted that the FED is likely to cut rates in March of 2024, which would be beneficial for small and mid-cap companies. While Mr. Torres largely has a positive outlook for 2024 and beyond, a point of concern was the federal government’s growing interest expense on debt, he noted that the government will eventually have to reduce spending or accept 3% – 3.5% inflation over the long-term.

The general U.S. economy is expected to soften in 2024, particularly in the first half, with a prospect that the economy could slip into recession. Our economic scenario for 2024 anticipates the economy will soften in the first half of the year and rebound in the second half of the year due to the prospect of a lower interest rate environment and resilient labor market.

The video of the Economic Perspectives panel may be viewed here

Small Cap Cycle?

Small cap investors have gone through a rough period. For the past several years, investors have anticipated an economic downturn. With these concerns, investors turned toward “safe haven” large cap stocks, which by and large can weather economic downturns and have significant trading volume should investors need to sell their positions. Notably, there is a sizable valuation disparity between the two classes, large cap and small cap, one of the largest since 1999. Some of the small cap stocks we follow trade at a modest 2.5 times Enterprise Value to EBITDA, compared with large cap valuations as high as 15 times. We believe the disparity is due to higher risk in the small cap stocks, given that some companies may not be cash flow positive, have capital needs, or have limited share float. However, investors seem to have overlooked small cap stocks with favorable fundamentals. While small cap stocks are more speculative than large caps, many are growing revenues and cash flow, have capable balance sheets, and/or are cash flow positive. In our view, the valuation gap should resolve itself over time for attractive emerging growth stocks. Some market strategists suggest that small cap stocks trade at the most undervalued in the market.

Dan Thelen, Managing Director of small cap equity at Ancora Advisors, highlighted the valuation gap between small cap and large cap stocks during the economic panel at Noblecon19 on December 5, 2023. Mr. Thelen noted that investors are not recognizing the risk mitigation efforts small cap companies have undertaken in the high interest rate environment. He believes that changes small cap companies have implemented are not reflected in stock prices and should be a tailwind moving forward. Again, his comments can be viewed on the video of the Economic Perspectives panel here

2024 Advertising Outlook

In our advertising outlook for 2024, we take into consideration the perspective of Lisa Knutson, Chief Operating Officer (COO) of E.W Scripps. Ms. Knutson is on the frontline of the economy as one of the largest TV broadcasters in the country. As a speaker on the Noblecon19 economic panel, she depicted the local and national advertising markets as a tale of two cities. Notably, Ms. Knutson highlighted resilience in local advertising and sequential improvement over the past few quarters in the auto advertising category. Additionally, she highlighted green shoots in local advertising, particularly in the services, home improvement and retail advertising categories. Importantly, political ad spend for the 2024 election cycle is expected to be approximately $10 billion, which is roughly a 13% increase from 2020, as illustrated in Figure #1 Political Ad Spend. About half of the high margin political advertising dollars are expected to be spent with television broadcasters. Our advertising forecast for television, radio and digital are highlighted later in this report. 

Figure #1 Political Ad spend

Source: Statista

Stock Recommendations

With our economic scenario in mind, we have identified certain media stocks that should perform well and/or lead the industry as economic prospects improve. Media stocks are typically early cycle stocks. This means that the stocks tend to outperform in the midst of the economic downturn or trough as investors begin to anticipate economic improvement. In addition, small cap stocks in general have been out of favor, with many stocks trading at historic low stock valuations (over the past several economic cycles) and also relative to the valuations of leadership stocks, such as the Magnificent 7 (Apple, Microsoft, Alphabet (Google), Netflix, Amazon, Nvidia and Tesla). This report highlights some of our favorite picks for 2024. Our favorites include companies that are leveraged to benefit from the influx of Political advertising and improving economy, generate positive free cash flow, and have capable balance sheets to invest it growth initiatives. Finally, we recommend stocks that have compelling valuations and/or pay a dividend to provide an attractive total return investment opportunity. 

Digital Media & Technology

Decelerating Revenue Growth, But Faster Than Other Advertising Categories

Digital Advertising has been growing rapidly over the past several years, bolstered by cord-cutting trends and generally, by an increasingly digital world. Digital Advertising includes various categories of advertising, such as audio, video, influencer, search, banner, and others. According to Statista, U.S. Digital Advertising spending is expected to grow at 15% Compound Annual Growth Rate (CAGR), from 2017-2028, from $90.1 billion to $402.1 billion. Figure #2 U.S. Digital Advertising Spend illustrates the 2017-2028 forecast, which is inclusive of the various different sub-categories of Digital Advertising.

Figure #2 U.S. Digital Advertising Spend

Source: Statista

Specifically in 2024, U.S. Digital Advertising is expected to grow a healthy 10% above 2023 levels, according to Statista. There are some categories of Digital Advertising, however, that are expected to grow especially fast in 2024, such as Connected TV (CTV) advertising, programmatic advertising, and influencer advertising. All three categorizations of Digital advertising are estimated to have above-average growth in 2024. According to Statista, influencer advertising in the U.S. will grow at 14% in 2024, while, according to eMarketer, U.S. programmatic and CTV advertising will grow at 13% and 17%, respectively.

In our view, there are several key factors strengthening these verticals. For example, influencer advertising allows brands to reach younger demographics through personalities those audiences trust. Moreover, during a time when there is uncertainty around the future of cookies and other forms of User IDs for targeted advertising, influencer advertising offers an alternative vehicle for audience targeting. Google has indicated plans to no longer use 3rd party cookies to deliver advertising in 2024, although the implementation of this plan has been delayed multiple times before. Additionally, we believe cord cutting is a major factor in the growth of connected TV, likely to be a strong growth vertical for programmatic digital advertising. 

Noble’s Digital Media indices fared well over the past year with most outperforming the S&P 500 over that span, as illustrated in Figure #4 Digital Media LTM Performance. Most recently, the Social Media and Marketing Tech indices have performed strongest, up 18.9% and 24.2%, respectively, over the last 3-months. Figure #3 Digital Media 3-month Performance illustrates the last quarter’s performance by Noble’s Digital Media indices. However, many of the indices were skewed positively by the strong stock performance of the larger cap constituents. For example, META was up 194% over the trailing 12 months, while Adobe (ADBE) and Salesforce (CRM) also performed well, up 77% and 98%, over the same timeframe, respectively. Yet, in Q4 the performance disparity began to abate with the smaller cap constituents of Noble’s Digital indices contributing more to the positive returns, for the most part. We believe this could signal the beginning of shift towards the smaller cap stocks that had depressed valuations in 2023 relative to their large cap counterparts.  

Despite the large cap versus small cap valuation disparity in 2023, there are several small cap stocks that performed well over the past 12 months, outshining respective indices. Notably, Direct Digital Holdings (DRCT) was up roughly 500% over the past year. Most of the runup of DRCT occurred late in Q4, after the company reported results far exceeding Street estimates. In our view, DRCT was substantially undervalued and is beginning to be discovered by more investors. Importantly, the increased trading activity has put the stock on investing screens for institutional, small cap investors. Another notable small cap performance was Townsquare Media (TSQ), which has a large Digital Advertising component to its business. TSQ was up 45% in the past year. 

Below, we outlined some of the investment highlights for our closely followed Digital Media companies. In addition, Figure #5  Ad Tech Industry Comparables highlights the stock valuations of the sector. As the chart depicts, our favorite stocks current trade well below the averages for the industry and some of the larger cap names. One of our closely followed companies, AdTheorent, is a stand out. Near current levels, the ADTH shares trade at a modest 2.5 times Enterprise Value to our 2024 Adj. EBITDA estimate, well below the 15.1 times average for the sector. Given the compelling stock valuation, we highlight this company as our current favorite in the industry. In addition, the Direct Digital shares trade at 10 times Enterprise Value to our 2024 Adj. EBITDA estimate, well below the 15.1 times industry average. As such, we view the DRCT shares as compelling. 

Figure #3 Digital Media 3-month Performance

Source: Capital IQ 

Figure #4 Digital Media LTM Performance

Source: Capital IQ

Direct Digital Holdings (DRCT) – Programmatic Advertising. We view DRCT as a compelling play on the Programmatic Advertising market. The company operates a sell-side platform (SSP), in addition to servicing buy-side advertising clients through managing their digital advertising strategies. Importantly, the company’s niche comes from its deep relationships with multi-cultural publishers, a key competitive advantage in our view. In 2024, we estimate the company’s revenue will grow 30% above our 2023 forecast with adj. EBITDA growth of 33%. For research reports and important disclosures, please click here.

AdTheorent (ADTH) – Programmatic Advertising. ADTH is a unique play on programmatic advertising with cutting-edge audience targeting capabilities, powered by its machine learning (ML) platform. Due to its ML platform, the company does not need to use third-party cookies and other forms of user IDs to target audiences. Not only does this position the company well for Google’s phasing our of third-party cookies, but it also allows the company to offer clients a privacy-forward method of audience targeting. Some key verticals for the company include the healthcare industry as well as connected TV. For research reports and important disclosures, please click here.     

Townsquare Media (TSQ) – Programmatic & SMB Digital Advertising. TSQ is a media company that has transformed from primarily a radio station operator to a Digital Advertising business, boasting multiple digital verticals. We believe it is a compelling play on the digital transition occurring in small business across the country. The company provides comprehensive digital marketing services to small and medium-sized businesses in its radio markets, leveraging its deep local relationships. Additionally, the company operates a programmatic advertising business, which is benefiting from the growth of CTV.  For research reports and important disclosures, please click here.

Entravision Communications (EVC) – Programmatic & Social Media Advertising. EVC is one of our favorite social media advertising plays. The company serves as Meta’s exclusive ad agency in several emerging markets, such as, certain regions of Latin America. It also represents TikTok in parts of Asia. In addition, the company owns a programmatic agency, known as Smadex. For research reports and important disclosures, please click here

Figure #5 Ad Tech Industry Comparables

Source: Noble estimates & Company filings

Traditional Media

The Largest Caps Performed The Best

The Newspaper Index was the only traditional media sector that outperformed the general market in the past quarter and trailing 12 months, as illustrated in Figure #7 Traditional Media LTM Performance. In the latest quarter, Newspaper stocks outperformed the general market, up 20.4% versus down 11.2% for the general market as measured by the S&P 500 Index. Notably, our index performances are market cap weighted, meaning larger cap stocks have a greater impact on index return than small cap stocks. In Q4, only two stocks in the Newspaper index, NYT and NWSA, posted positive returns. These were the largest cap stocks in the index. In Q4, NWSA and NYT were up 22.4% and 18.9%, respectively. For full year 2023, four out of the five companies in the Newspaper index posted positive returns, the strongest performers were NYT and NWSA, up 50.9% and 34.9%, respectively. The Broadcast TV Index was up a modest 5.2% for the quarter and down 11% over the past year. The worst performing index over the last quarter was the Radio Broadcast index, down on 10.9%, as Illustrated in Figure #6 Traditional Media 3-Month Performance. Additionally, the Radio stocks were the worst performing group over the last year as well, down 34.9%. While the Radio Broadcast Index and Broadcast TV Index had a tough year in 2023, we believe both indices should improve in 2024. We highlight some of our favorites in the sector commentary below. 

Figure #6 Traditional Media 3-month Performance

Source: Capital IQ

Figure #7 Traditional Media LTM Performance

Source: Capital IQ

Television Broadcast

Looking For A Better 2024

The Television industry had a tough year with soft core advertising and the absence of the year earlier Political advertising. Television revenues are estimated to have declined as much as 20% in 2023 inclusive of the absence of year earlier Political advertising. Total core television advertising is expected to have decline 3% in 2023, which excludes Political advertising, reflecting disproportionately weak National advertising and resilient Local advertising. Importantly, Television advertising accounts for less than 50% of total television revenue, with Retransmission revenue largely accounting for the balance. With growth in Retransmission revenue, we estimate that total Television revenue declined roughly 10% in 2023. 

We believe that revenue trends will improve in 2024 for the TV industry, supported by an influx of Political advertising and moderating trends in core National advertising. Nonetheless, given the exceptional Political advertising year that is expected, core advertising is expected to decline in 2024, with some advertising being displaced by the large volume of Political. We anticipate that Core advertising will decline roughly 2.3% in 2024, with total TV advertising up nearly 30% (reflective of the influx of Political). Total Television revenue, which includes Retransmission revenues, are expected to increase roughly 20%. 

We believe that the TV industry has some long term fundamental headwinds, which include continued weak audience trends, cord cutting (which adversely affects Retransmission revenue growth opportunities), and shifts in National advertising toward Digital and Influence Marketing. Offsetting these trends are Connected TV and prospects for new revenue opportunities offered by the new broadcast standard, ATSC 3.0. Importantly, the very high margin Political advertising every even year allows the industry to reduce debt and/or return capital to shareholders.

Our closely followed Television companies, E.W. Scripps and Gray TV, are among the two companies best positioned to benefit for the influx of Political advertising. Both are in swing markets that should disproportionately benefit from Political. In the case of E.W. Scripps, the company has a developed business model that benefits from cord cutting as consumers switch toward Connected TV and Over The Air Networks. Furthermore, in 2024, E.W. Scripps will benefit from double digit growth in Retransmission revenue as 75% of its subscribers have been renegotiated at significantly higher rates. Both companies, E.W. Scripps and Gray, are highly debt levered. As such, we believe that paring down debt should improve the equity value of the shares in 2024. In addition, we believe that both companies have compelling stock valuations. While the SSP and the GTN shares trade near the industry averages, the industry averages are well below past cycles. We would look for multiple expansion as economic prospects improve. At the same time, as free cash flow improves from high margin Political advertising, debt reduction should allow for a swing toward improved equity values. As such, the shares of SSP and GTN represent a compelling way to play both an improved economic outlook towards the second half of 2024 and influx of high margin Political advertising. Again, SSP has the benefit of strong growth of Retransmission revenue, as well. 

E.W. Scripps (SSP): One of the nation’s largest TV station broadcasters and unique play on the trend toward cable cord cutting. Scripps has nationwide over the air networks that can be viewed with a digital antennae that do not require a cable or satellite service. Given its orientation toward national networks, the company is expected to disproportionately benefit from the influx of national advertising. In addition, the company’s TV stations are located in swing States and in hotly contested markets that should benefit from the influx of Political advertising in 2024. We believe the level of Political will be closely watched by investors as the high margin Political advertising will allow the company to aggressive pare down debt, assuaging investor concerns over its current leverage. For research reports and important disclosures, please click here

Gray Television (GTN): One of the nation’s largest television broadcasters, the company has historically led the industry in terms of revenue  and disproportionately benefits from the influx of Political advertising. In addition, the company is expected to benefit in 2024 from its investment in the development of its studios in the Atlanta area called Assembly Atlanta. The company has yet to disclose the full benefit of the current lease arrangement. We believe that the value of the development and the stream of lease payments are not fully reflected in the current stock valuation. Furthermore, the company is expected to aggressively pare down debt through the influx of high margin Political advertising and the lease payments. In our view, the shares should react well to debt reduction. For research reports and important disclosures, please click here.

Figure #8 TV Industry Comparables 

Source: Noble estimates & Company filings

Radio Broadcast

Debt Struggles

Based on our estimates and our closely followed companies, Radio advertising is expected to have decreased 5.5% for the full year 2023. Illustrated in Figure #9 Radio Advertising Revenue. This decline reflected the adverse impact of rising interest rates and significant inflation, which hurt many consumer oriented advertising categories, as well as financials. In addition, we believe that Radio struggled with some headwinds from declines in listenership, as many consumers continue to work remotely post Covid pandemic. Local advertising was more resilient than National, which tends to be more economically sensitive. We estimate that Local advertising was down 6%, while National was down 19%. The results are expected to reflect the absence of Political advertising from the year earlier biennial elections. Digital advertising was a bright spot, increasing 6%, largely offsetting the decline in National revenue. 

Figure #9 Radio Advertising Revenue 

Source: Statista

Looking forward toward 2024, we expect Radio advertising trends to improve throughout the year, with the expectation that December 2023 may have been the trough for this economic cycle. Both Local and National advertisers should begin to anticipate improved economic conditions with the expectation that the Fed will lower interest rates late in the first quarter. Even though the economy is anticipated to continue to weaken in the first half 2024, advertisers may advertise to drive customer traffic and in anticipation of improved economic conditions. We anticipate that the year will start off weak, with the first quarter 2024 revenue expected to be down, but a more moderate decrease between 3% to 4%. Notably, the industry does not receive a significant amount of Political advertising in the first quarter.

In 2024, we expect consumer spending to soften, which will have an adverse affect on consumer oriented advertising, particularly Retail. Auto advertising is expected to buck that trend. In our view, auto manufacturers and dealers will likely step up advertising and promotions to lure consumers. Assuming lowered interest rates, we expect that Financial advertising should improve in the second half of the year, as well. Revenues are expected to be second half weighted, with improving core advertising trends and the benefit of the influx of Political advertising. Radio does not typically receive a significant amount of Political advertising, but it accounts for a meaningful 3% of total core advertising for the year. Political advertising largely falls in the third and fourth quarter. In addition, National advertising trends should improve in the second half as economic prospects improve. Digital advertising is expected to grow but more moderately than 2023, which is expected to be up 6%. We believe that Digital will increase near 5%, but some companies that have less developed Digital businesses, should report faster growth. 

In total, based on our closely followed companies, we anticipate Radio revenue growth of 5.6% in 2024. Our estimate is inclusive of our Political advertising outlook.

We encourage investors to take a basket approach to investing in the industry, as most companies should benefit from the improving fundamentals in 2024. Below we have outlined some of the investment highlights for our closely followed Radio companies. In addition, Figure #10 Radio Industry Comparables highlight the stock valuations of the sector, which are currently trading at recession type valuations levels. 

Beasley Broadcast (BBGI): We believe that the company will reflect above average revenue and cash flow growth in 2024 due to the prospect of fast growth of its developing Digital businesses. Digital accounted for roughly 20% of the company’s total revenues in 2023 and are expected to be a key revenue driver in 2024. In addition, the company’s stations are located in large, swing State markets and should benefit from the influx of Political advertising. The company does carry above average debt loads, but we expect that the company will pare down debt by roughly $20 million from current levels. The company’s target debt levels are $250 million by year end. For a Beasley Broadcast report and important disclosures, please click here.

Cumulus Media (CMLS): The company is viewed as a leveraged play on a recovery in National advertising. Given the company’s Network business, which is virtually all National advertising, roughly 50% of total company revenues are derived from National advertising. This is significantly higher than the industry average, which is roughly 12%. National advertising is expected to rebound as economic prospects improve in 2024. In addition, the company should disproportionately benefit from the influx of Political advertising. We estimate $23.5 million in high margin Political advertising, a 20% increase from the last Presidential election cycle, expected to total roughly 3.7% of 2024 advertising revenues. For research reports and important disclosures, please click here.

Entravision (EVC): Radio represents a small portion of total company revenues as the company has transitioned toward a Digital agency business model. Over 80% of total company revenues comes from its Digital businesses. As such, Entravision should grow faster than Radio industry averages as its Digital business is expected to grow. Furthermore, Entravision has one of the best balance sheets in the industry, expected to have virtually no net debt by year end. Finally, the EVC shares are among the cheapest in the industry, as highlighted in Figure #    Radio Industry Comparables. For research reports and important disclosures, please click here.

Saga Communications (SGA): Historically, the company has led the industry in terms of revenue and cash flow growth. Over the past few years, it lost that honor as the industry moved to expand its fast growing digital operations. Most recently, Saga has regained its top spot as it has developed its Digital operations and non traditional radio revenue. While the industry has moved Digital to account for as much as 50% of total company revenues, Saga currently is at a more modest   %. Nonetheless, its nascent Digital operations are growing at a rapid rate, allowing total company revenues to exceed industry averages. Saga has one of the best balance sheets in the industry, with a large cash position and virtually no debt. Furthermore, the company pays an attractive dividend, and, as such, represents an attractive total return potential. The SGA shares are largely undiscovered, trading at one of the cheapest stock valuation in the radio sector. For research reports and important disclosures, please click here.

Salem Media Group (SALM): Salem has a relatively stable Radio advertising business given its orientation toward the sale of long and short form block programming. Recently, the company tripped a debt covenant which created investor anxiety over its high debt leverage. The company recently announced that it plans to sell its Salem Church Products division for $30 million, it refinanced its revolver, and announced the sale of its money losing book publishing company, Regnery. In addition to these measures, the company has streamlined its management team and lowered costs. Recently, the company decided to delist, rather than seek alternatives to remain on its current exchange. In addition, the company has not closed on its planned sale of its Church Products division. As such, we believe that the company has significant hurdles to put itself on a path toward free cash flow generation and debt reduction. For research reports and important disclosures, please click here.

Townsquare Media (TSQ): Townsquare has led the charge toward a Digital transformation, with over 50% of its revenues from its Digital businesses. Importantly, its Digital businesses have margins are in line or better than its traditional Broadcast business. While a segment of its Digital business declined in 2023, we expect that it will regain its revenue momentum in 2024, particularly in the second half. At that time, the company is expected to benefit from an influx of high margin Political advertising, as well. We believe that the company has one of the best Digital strategies in the industry and is widely viewed as the model for other aspiring Digital divisions at other Radio companies. The shares trade below that of its industry peers, in spite of its above average revenue and cash flow growth. For research reports and important disclosures, please click here.

Figure #10 Radio Industry Comparables 

Source: Noble estimates & Company filings

GENERAL DISCLAIMERS

All statements or opinions contained herein that include the words “we”, “us”, or “our” are solely the responsibility of Noble Capital Markets, Inc.(“Noble”) and do not necessarily reflect statements or opinions expressed by any person or party affiliated with the company mentioned in this report. Any opinions expressed herein are subject to change without notice. All information provided herein is based on public and non-public information believed to be accurate and reliable, but is not necessarily complete and cannot be guaranteed. No judgment is hereby expressed or should be implied as to the suitability of any security described herein for any specific investor or any specific investment portfolio. The decision to undertake any investment regarding the security mentioned herein should be made by each reader of this publication based on its own appraisal of the implications and risks of such decision.

This publication is intended for information purposes only and shall not constitute an offer to buy/sell or the solicitation of an offer to buy/sell any security mentioned in this report, nor shall there be any sale of the security herein in any state or domicile in which said offer, solicitation or sale would be unlawful prior to registration or qualification under the securities laws of any such state or domicile. This publication and all information, comments, statements or opinions contained or expressed herein are applicable only as of the date of this publication and subject to change without prior notice. Past performance is not indicative of future results. Noble accepts no liability for loss arising from the use of the material in this report, except that this exclusion of liability does not apply to the extent that such liability arises under specific statutes or regulations applicable to Noble. This report is not to be relied upon as a substitute for the exercising of independent judgement. Noble may have published, and may in the future publish, other research reports that are inconsistent with, and reach different conclusions from, the information provided in this report. Noble is under no obligation to bring to the attention of any recipient of this report, any past or future reports. Investors should only consider this report as single factor in making an investment decision.

IMPORTANT DISCLOSURES

This publication is confidential for the information of the addressee only and may not be reproduced in whole or in part, copies circulated, or discussed to another party, without the written consent of Noble Capital Markets, Inc. (“Noble”). Noble seeks to update its research as appropriate, but may be unable to do so based upon various regulatory constraints. Research reports are not published at regular intervals; publication times and dates are based upon the analyst’s judgement. Noble professionals including traders, salespeople and investment bankers may provide written or oral market commentary, or discuss trading strategies to Noble clients and the Noble proprietary trading desk that reflect opinions that are contrary to the opinions expressed in this research report.
The majority of companies that Noble follows are emerging growth companies. Securities in these companies involve a higher degree of risk and more volatility than the securities of more established companies. The securities discussed in Noble research reports may not be suitable for some investors and as such, investors must take extra care and make their own determination of the appropriateness of an investment based upon risk tolerance, investment objectives and financial status.

Company Specific Disclosures

The following disclosures relate to relationships between Noble and the company (the “Company”) covered by the Noble Research Division and referred to in this research report.
Noble is not a market maker in any of the companies mentioned in this report. Noble intends to seek compensation for investment banking services and non-investment banking services (securities and non-securities related) with any or all of the companies mentioned in this report within the next 3 months

ANALYST CREDENTIALS, PROFESSIONAL DESIGNATIONS, AND EXPERIENCE

Senior Equity Analyst focusing on Basic Materials & Mining. 20 years of experience in equity research. BA in Business Administration from Westminster College. MBA with a Finance concentration from the University of Missouri. MA in International Affairs from Washington University in St. Louis.
Named WSJ ‘Best on the Street’ Analyst and Forbes/StarMine’s “Best Brokerage Analyst.”
FINRA licenses 7, 24, 63, 87

WARNING

This report is intended to provide general securities advice, and does not purport to make any recommendation that any securities transaction is appropriate for any recipient particular investment objectives, financial situation or particular needs. Prior to making any investment decision, recipients should assess, or seek advice from their advisors, on whether any relevant part of this report is appropriate to their individual circumstances. If a recipient was referred to Noble Capital Markets, Inc. by an investment advisor, that advisor may receive a benefit in respect of
transactions effected on the recipients behalf, details of which will be available on request in regard to a transaction that involves a personalized securities recommendation. Additional risks associated with the security mentioned in this report that might impede achievement of the target can be found in its initial report issued by Noble Capital Markets, Inc.. This report may not be reproduced, distributed or published for any purpose unless authorized by Noble Capital Markets, Inc..

RESEARCH ANALYST CERTIFICATION

Independence Of View
All views expressed in this report accurately reflect my personal views about the subject securities or issuers.

Receipt of Compensation
No part of my compensation was, is, or will be directly or indirectly related to any specific recommendations or views expressed in the public
appearance and/or research report.

Ownership and Material Conflicts of Interest
Neither I nor anybody in my household has a financial interest in the securities of the subject company or any other company mentioned in this report.

Energy Industry Report – Energy Stocks Fell Alongside Energy Prices But Remain Attractive Investments

This image has an empty alt attribute; its file name is image-1-1024x232.png

Friday, January 5, 2024

Michael Heim, CFA, Senior Research Analyst, Noble Capital Markets, Inc.

Refer to the bottom of the report for important disclosures

Energy stocks declined in the fourth quarter in response to falling energy prices. Energy stocks declined 7.2% during the 2023 fourth quarter. The movement of the XLE is similar to that of near-month oil future prices.

Oil prices declined sharply in the fourth quarter after a runup in the third quarter. West Texas Intermediate oil prices declined 21.1% in the fourth quarter to $71.65 per barrel. Domestic oil production continues to grow (up 7% year over year through October) even as the number of domestic oil rigs has decreased 20% since this time last year. Natural gas prices declined 14.2% during the quarter to $2.51 per thousand cubic feet (mcf) of gas. Weather was 13% warmer than normal in the December quarter. As a result, natural gas storage levels are at five-year seasonally high levels as they have been for the last twelve months. 

Merger Activity is heating up. More than $100 billion in acquisitions were announced in the last three months as APA, Exxon Mobil and Chevron all announced transactions. The acquisitions come as major energy companies seek to expand production during a period when production growth from technological improvements seems to be slowing. 

Energy Companies continue to generate high cash levels at current energy prices. Despite the drop in energy prices, operating netbacks (revenues less royalties and operating costs) remain high. With debt levels low, energy managements have raised capital budgets, increased dividends, and repurchased shares. 

Valuations remain attractive. With the decline in energy company stock values, many companies are trading at enterprise values that are less than five times free cash flow. Given our belief that energy prices are entering a period of relative stability (oil prices trade in a range of $60-$10/bbl) and that stock prices have already reacted to energy price declines to the lower end of this range, we see limited downside to investing in energy stocks and large upside should energy prices rise.

Energy stocks declined in the fourth quarter in response to falling energy prices.

Energy stocks, as measured by the Energy Select Sector SPDR Fund (XLE) declined 7.2% during the 2023 fourth quarter. The decline stands in sharp contrast to an 11.2% increase in the S&P Composite index. The decline in the XLE began early with the index dropping almost 10% in the first week of the quarter before regaining its losses in the next two weeks. After peaking on October 18th, the index fell sharply over the next two months and never recovered from its losses. The movement of the XLE is similar to that of near-month oil future prices.

Oil prices declined sharply in the fourth quarter after a runup in the third quarter.

West Texas Intermediate oil prices declined 21.1% in the fourth quarter to $71.65 per barrel, offsetting a 30.0% increase in the third quarter. For the year, WTI declined 10%. The oil price spikes of 2022 that sent prices above $120 per barrel shortly after Russia invaded Ukraine seem a distant memory. Energy production disruptions and political sanctions have changed the direction of the flow of energy but not the overall global demand and supply of energy. We are keeping an eye on political developments in the Red Sea, but to date there has been little impact on oil prices. Domestic oil production continues to grow (up 7% year over year through October) even as the number of domestic oil rigs has decreased 20% since this time last year. The biggest decline has been in the Permian Basin. Almost all wells being drilled are now horizontal wells.

The decline in natural gas prices was not as sharp and was largely explained by warm weather.

Natural gas prices declined 14.2% during the quarter to $2.51 per thousand cubic feet (mcf) of gas. After sharp spikes in 2022, natural gas prices have settled into a narrow range between $2.00/mcf and $3.00/mcf. Weather was 13% warmer than normal on a population-weighted basis in the December quarter. As a result, natural gas storage levels are at five-year seasonally high levels as they have been for the last twelve months. Gas production continues to increase steadily, mainly to feed an increased demand for natural gas for power generation.

Merger Activity is heating up.

On January 4, 2024, APA Corporation, parent of Apache Corporation, agreed to acquire Callon Petroleum for approximately $4.5 billion in a stock-swap deal. The acquisition follows Exxon Mobil’s $59.5 billion agreement to buy Pioneer Natural Resources and Chevron’s $53 billion deal to buy Hess Corporation in October 2023. The acquisitions come as major energy companies seek to expand production during a period when production growth from technological improvements seems to be slowing. The acquisitions, while all three stock transactions, may also represent improved balance sheets and cash flow. As we have discussed in the past, energy companies have used recent energy price upcycles to pay down debt and repurchase shares as opposed to previous cycles when management expanded drilling efforts that eventually drove down energy prices. The result has been more muted energy price cycles that extend for longer periods of time.

Energy Companies continue to generate high cash levels at current energy prices.

Despite the drop in energy prices, operating netbacks (revenues less royalties and operating costs) remain high. With debt levels low, energy management have raised capital budgets, increased dividends, and repurchased shares. Management is always reluctant to raise dividends to levels that are unsustainable in a down cycle. As a result several energy companies have begun to institute special dividends. We expect manage to continue to invest in growth and reward shareholders even at current energy levels. Should energy prices rise, these activities should accelerate.

Valuations remain attractive.

With the decline in energy company stock values, many companies are trading at enterprise values that are less than five times free cash flow. We view this multiple as unsustainable given an increased use of cash flow to repurchase shares. This is especially true of companies with slow production decline curves such as the companies we follow in western Canada. Given our belief that energy prices are entering a period of relative stability (oil prices trade in a range of $60-$10/bbl) and that stock prices have already reacted to energy price declines to the lower end of this range, we see limited downside to investing in energy stocks and large upside should energy prices rise. We believe this is especially true for smaller cap energy stocks that have ample drilling opportunities and that could be takeover targets for larger energy companies that do not.


GENERAL DISCLAIMERS

All statements or opinions contained herein that include the words “we”, “us”, or “our” are solely the responsibility of Noble Capital Markets, Inc.(“Noble”) and do not necessarily reflect statements or opinions expressed by any person or party affiliated with the company mentioned in this report. Any opinions expressed herein are subject to change without notice. All information provided herein is based on public and non-public information believed to be accurate and reliable, but is not necessarily complete and cannot be guaranteed. No judgment is hereby expressed or should be implied as to the suitability of any security described herein for any specific investor or any specific investment portfolio. The decision to undertake any investment regarding the security mentioned herein should be made by each reader of this publication based on its own appraisal of the implications and risks of such decision.

This publication is intended for information purposes only and shall not constitute an offer to buy/sell or the solicitation of an offer to buy/sell any security mentioned in this report, nor shall there be any sale of the security herein in any state or domicile in which said offer, solicitation or sale would be unlawful prior to registration or qualification under the securities laws of any such state or domicile. This publication and all information, comments, statements or opinions contained or expressed herein are applicable only as of the date of this publication and subject to change without prior notice. Past performance is not indicative of future results. Noble accepts no liability for loss arising from the use of the material in this report, except that this exclusion of liability does not apply to the extent that such liability arises under specific statutes or regulations applicable to Noble. This report is not to be relied upon as a substitute for the exercising of independent judgement. Noble may have published, and may in the future publish, other research reports that are inconsistent with, and reach different conclusions from, the information provided in this report. Noble is under no obligation to bring to the attention of any recipient of this report, any past or future reports. Investors should only consider this report as single factor in making an investment decision.

IMPORTANT DISCLOSURES

This publication is confidential for the information of the addressee only and may not be reproduced in whole or in part, copies circulated, or discussed to another party, without the written consent of Noble Capital Markets, Inc. (“Noble”). Noble seeks to update its research as appropriate, but may be unable to do so based upon various regulatory constraints. Research reports are not published at regular intervals; publication times and dates are based upon the analyst’s judgement. Noble professionals including traders, salespeople and investment bankers may provide written or oral market commentary, or discuss trading strategies to Noble clients and the Noble proprietary trading desk that reflect opinions that are contrary to the opinions expressed in this research report.
The majority of companies that Noble follows are emerging growth companies. Securities in these companies involve a higher degree of risk and more volatility than the securities of more established companies. The securities discussed in Noble research reports may not be suitable for some investors and as such, investors must take extra care and make their own determination of the appropriateness of an investment based upon risk tolerance, investment objectives and financial status.

Company Specific Disclosures

The following disclosures relate to relationships between Noble and the company (the “Company”) covered by the Noble Research Division and referred to in this research report.
Noble is not a market maker in any of the companies mentioned in this report. Noble intends to seek compensation for investment banking services and non-investment banking services (securities and non-securities related) with any or all of the companies mentioned in this report within the next 3 months

ANALYST CREDENTIALS, PROFESSIONAL DESIGNATIONS, AND EXPERIENCE

Senior Equity Analyst focusing on Basic Materials & Mining. 20 years of experience in equity research. BA in Business Administration from Westminster College. MBA with a Finance concentration from the University of Missouri. MA in International Affairs from Washington University in St. Louis.
Named WSJ ‘Best on the Street’ Analyst and Forbes/StarMine’s “Best Brokerage Analyst.”
FINRA licenses 7, 24, 63, 87

WARNING

This report is intended to provide general securities advice, and does not purport to make any recommendation that any securities transaction is appropriate for any recipient particular investment objectives, financial situation or particular needs. Prior to making any investment decision, recipients should assess, or seek advice from their advisors, on whether any relevant part of this report is appropriate to their individual circumstances. If a recipient was referred to Noble Capital Markets, Inc. by an investment advisor, that advisor may receive a benefit in respect of
transactions effected on the recipients behalf, details of which will be available on request in regard to a transaction that involves a personalized securities recommendation. Additional risks associated with the security mentioned in this report that might impede achievement of the target can be found in its initial report issued by Noble Capital Markets, Inc.. This report may not be reproduced, distributed or published for any purpose unless authorized by Noble Capital Markets, Inc..

RESEARCH ANALYST CERTIFICATION

Independence Of View
All views expressed in this report accurately reflect my personal views about the subject securities or issuers.

Receipt of Compensation
No part of my compensation was, is, or will be directly or indirectly related to any specific recommendations or views expressed in the public
appearance and/or research report.

Ownership and Material Conflicts of Interest
Neither I nor anybody in my household has a financial interest in the securities of the subject company or any other company mentioned in this report.

Metals & Mining Fourth Quarter 2023 Review and Outlook

Monday, January 2, 2024

Mark Reichman, Senior Research Analyst, Natural Resources, Noble Capital Markets, Inc.

Refer to the bottom of the report for important disclosures

Relative performance. During the fourth quarter, mining companies (as measured by the XME) appreciated 14.0% compared to a gain of 11.2% for the S&P 500 index. The VanEck Vectors Gold Miners (GDX) and Junior Gold Miners (GDXJ) ETFs were up 15.2% and 17.6%, respectively. Gold, silver, and copper futures prices gained 11.0%, 7.0%, and 4.1%, respectively, while nickel and lead declined 11.2% and 5.5%. Zinc prices were flat. For the full year 2023, all indices were in positive territory, led by the XME which appreciated 20.1%, but underperformed the S&P 500 which gained 24.2%.

Precious metals outlook. Our outlook for precious metals and precious metals mining equities remains favorable. Factors supporting our view include: 1) the Federal Reserve appears to have reached the end of its tightening cycle, 2) heightened geopolitical uncertainty, 3) growth in U.S. deficit spending and national debt, and 4) increasing investments in gold by central banks. Based on these factors, along with the potential for lower interest rates and a weaker dollar, we think portfolio allocations to precious metals could increase. The futures price of gold rose 13.4% in 2023 and closed the year at $2,071.80 per ounce.

Outlook for industrial and battery metals. While slower economic growth could provide a headwind for industrial metals demand and prices, longer-term secular trends such as electrification remain supportive of supply and demand fundamentals for metals such as copper. Although the longer-term outlooks for battery metals such as lithium, nickel, and cobalt are constructive, the near-term outlook remains challenging due to unfavorable supply and demand fundamentals. In 2023, futures prices for battery grade lithium, nickel and cobalt fell 81.4%, 43.6%, and 44.2%, respectively. Lower near-term prices may slow new development making existing projects attractive and better positioned to take advantage of stronger pricing when demand inevitably accelerates.

Putting it all together. We think the precious metals mining sub-sector is poised for outperformance in 2024. While well-diversified portfolios should have exposure to precious metals, mining equities may offer a stronger current alternative to bullion. In our opinion, junior companies remain attractive based on valuation, and we expect industry consolidation to accelerate as senior producers seek to replenish reserves and resources.


GENERAL DISCLAIMERS

All statements or opinions contained herein that include the words “we”, “us”, or “our” are solely the responsibility of Noble Capital Markets, Inc.(“Noble”) and do not necessarily reflect statements or opinions expressed by any person or party affiliated with the company mentioned in this report. Any opinions expressed herein are subject to change without notice. All information provided herein is based on public and non-public information believed to be accurate and reliable, but is not necessarily complete and cannot be guaranteed. No judgment is hereby expressed or should be implied as to the suitability of any security described herein for any specific investor or any specific investment portfolio. The decision to undertake any investment regarding the security mentioned herein should be made by each reader of this publication based on its own appraisal of the implications and risks of such decision.

This publication is intended for information purposes only and shall not constitute an offer to buy/sell or the solicitation of an offer to buy/sell any security mentioned in this report, nor shall there be any sale of the security herein in any state or domicile in which said offer, solicitation or sale would be unlawful prior to registration or qualification under the securities laws of any such state or domicile. This publication and all information, comments, statements or opinions contained or expressed herein are applicable only as of the date of this publication and subject to change without prior notice. Past performance is not indicative of future results. Noble accepts no liability for loss arising from the use of the material in this report, except that this exclusion of liability does not apply to the extent that such liability arises under specific statutes or regulations applicable to Noble. This report is not to be relied upon as a substitute for the exercising of independent judgement. Noble may have published, and may in the future publish, other research reports that are inconsistent with, and reach different conclusions from, the information provided in this report. Noble is under no obligation to bring to the attention of any recipient of this report, any past or future reports. Investors should only consider this report as single factor in making an investment decision.

IMPORTANT DISCLOSURES

This publication is confidential for the information of the addressee only and may not be reproduced in whole or in part, copies circulated, or discussed to another party, without the written consent of Noble Capital Markets, Inc. (“Noble”). Noble seeks to update its research as appropriate, but may be unable to do so based upon various regulatory constraints. Research reports are not published at regular intervals; publication times and dates are based upon the analyst’s judgement. Noble professionals including traders, salespeople and investment bankers may provide written or oral market commentary, or discuss trading strategies to Noble clients and the Noble proprietary trading desk that reflect opinions that are contrary to the opinions expressed in this research report.
The majority of companies that Noble follows are emerging growth companies. Securities in these companies involve a higher degree of risk and more volatility than the securities of more established companies. The securities discussed in Noble research reports may not be suitable for some investors and as such, investors must take extra care and make their own determination of the appropriateness of an investment based upon risk tolerance, investment objectives and financial status.

Company Specific Disclosures

The following disclosures relate to relationships between Noble and the company (the “Company”) covered by the Noble Research Division and referred to in this research report.
Noble is not a market maker in any of the companies mentioned in this report. Noble intends to seek compensation for investment banking services and non-investment banking services (securities and non-securities related) with any or all of the companies mentioned in this report within the next 3 months

ANALYST CREDENTIALS, PROFESSIONAL DESIGNATIONS, AND EXPERIENCE

Senior Equity Analyst focusing on Basic Materials & Mining. 20 years of experience in equity research. BA in Business Administration from Westminster College. MBA with a Finance concentration from the University of Missouri. MA in International Affairs from Washington University in St. Louis.
Named WSJ ‘Best on the Street’ Analyst and Forbes/StarMine’s “Best Brokerage Analyst.”
FINRA licenses 7, 24, 63, 87

WARNING

This report is intended to provide general securities advice, and does not purport to make any recommendation that any securities transaction is appropriate for any recipient particular investment objectives, financial situation or particular needs. Prior to making any investment decision, recipients should assess, or seek advice from their advisors, on whether any relevant part of this report is appropriate to their individual circumstances. If a recipient was referred to Noble Capital Markets, Inc. by an investment advisor, that advisor may receive a benefit in respect of
transactions effected on the recipients behalf, details of which will be available on request in regard to a transaction that involves a personalized securities recommendation. Additional risks associated with the security mentioned in this report that might impede achievement of the target can be found in its initial report issued by Noble Capital Markets, Inc.. This report may not be reproduced, distributed or published for any purpose unless authorized by Noble Capital Markets, Inc..

RESEARCH ANALYST CERTIFICATION

Independence Of View
All views expressed in this report accurately reflect my personal views about the subject securities or issuers.

Receipt of Compensation
No part of my compensation was, is, or will be directly or indirectly related to any specific recommendations or views expressed in the public
appearance and/or research report.

Ownership and Material Conflicts of Interest
Neither I nor anybody in my household has a financial interest

Government Solutions Industry Report: Reacting to the Surge

Friday, November 17, 2022

Joe Gomes, Managing Director, Equity Research Analyst, Generalist , Noble Capital Markets, Inc.

Joshua Zoepfel, Research Associate, Noble Capital Markets, Inc.

Refer to the bottom of the report for important disclosures

More Funding? In testimony before the U.S. Senate Committee on Appropriations, U.S. Department of Homeland Security Secretary Mayorkas expounded on the Biden Administration’s $8.7 billion supplemental funding request for DHS to cover projected shortfalls, enhance enforcement, and hire additional personnel.

More Beds. One of the key items was increased surge capacity of up to 46,500 ICE detention beds. Recall, the current budgeted amount is 34,000 beds, although the most recent ICE report indicates nearly 37,000 beds were being used as of October 3rd and press reports indicate the current number is closer to 40,000. Additional funding for transportation and the Alternatives to Detention (ATD) program also was requested.

Surge Continues. In October 240,988 people were encountered at the Southwest border, up from 231,529 a year ago and down only modestly from the 269,735 encountered in September. For all of fiscal 2023, there were 2,475,669 border encounters. We would note, in his testimony, Secretary Mayorkas stated that since May 12th, or approximately 6 months, 336,000 individuals have been removed or returned, a fraction of the nearly 1.3 million encounters since then, not to mention the historic numbers prior. And, recall, encounters only represent a portion of total border crossings.

What Does It Mean for CXW and GEO. Assuming the funding is passed, it will have a positive impact on CoreCivic (CXW) and The GEO Group (GEO), at least in the short-term. With CXW and GEO receiving roughly one-third each of new detainees any increase in the overall number of detainees should positively impact operating results, especially given that as of the end of the third quarter, both companies had the majority of their respective ICE facilities at or above the guaranteed minimum level. If the increased number of beds is sticky, it is possible ICE will seek additional facility capacity, potentially enabling CXW and/or GEO to restart a currently idled facility. Finally, any increase in the use of the ISAP program will benefit GEO.

Research reports on companies mentioned in this report are available by clicking below:

CoreCivic (CXW)

The GEO Group (GEO)


GENERAL DISCLAIMERS

All statements or opinions contained herein that include the words “we”, “us”, or “our” are solely the responsibility of Noble Capital Markets, Inc.(“Noble”) and do not necessarily reflect statements or opinions expressed by any person or party affiliated with the company mentioned in this report. Any opinions expressed herein are subject to change without notice. All information provided herein is based on public and non-public information believed to be accurate and reliable, but is not necessarily complete and cannot be guaranteed. No judgment is hereby expressed or should be implied as to the suitability of any security described herein for any specific investor or any specific investment portfolio. The decision to undertake any investment regarding the security mentioned herein should be made by each reader of this publication based on its own appraisal of the implications and risks of such decision.

This publication is intended for information purposes only and shall not constitute an offer to buy/sell or the solicitation of an offer to buy/sell any security mentioned in this report, nor shall there be any sale of the security herein in any state or domicile in which said offer, solicitation or sale would be unlawful prior to registration or qualification under the securities laws of any such state or domicile. This publication and all information, comments, statements or opinions contained or expressed herein are applicable only as of the date of this publication and subject to change without prior notice. Past performance is not indicative of future results. Noble accepts no liability for loss arising from the use of the material in this report, except that this exclusion of liability does not apply to the extent that such liability arises under specific statutes or regulations applicable to Noble. This report is not to be relied upon as a substitute for the exercising of independent judgement. Noble may have published, and may in the future publish, other research reports that are inconsistent with, and reach different conclusions from, the information provided in this report. Noble is under no obligation to bring to the attention of any recipient of this report, any past or future reports. Investors should only consider this report as single factor in making an investment decision.

IMPORTANT DISCLOSURES

This publication is confidential for the information of the addressee only and may not be reproduced in whole or in part, copies circulated, or discussed to another party, without the written consent of Noble Capital Markets, Inc. (“Noble”). Noble seeks to update its research as appropriate, but may be unable to do so based upon various regulatory constraints. Research reports are not published at regular intervals; publication times and dates are based upon the analyst’s judgement. Noble professionals including traders, salespeople and investment bankers may provide written or oral market commentary, or discuss trading strategies to Noble clients and the Noble proprietary trading desk that reflect opinions that are contrary to the opinions expressed in this research report.
The majority of companies that Noble follows are emerging growth companies. Securities in these companies involve a higher degree of risk and more volatility than the securities of more established companies. The securities discussed in Noble research reports may not be suitable for some investors and as such, investors must take extra care and make their own determination of the appropriateness of an investment based upon risk tolerance, investment objectives and financial status.

Company Specific Disclosures

The following disclosures relate to relationships between Noble and the company (the “Company”) covered by the Noble Research Division and referred to in this research report.
Noble is not a market maker in any of the companies mentioned in this report. Noble intends to seek compensation for investment banking services and non-investment banking services (securities and non-securities related) with any or all of the companies mentioned in this report within the next 3 months

ANALYST CREDENTIALS, PROFESSIONAL DESIGNATIONS, AND EXPERIENCE

Senior Equity Analyst focusing on Basic Materials & Mining. 20 years of experience in equity research. BA in Business Administration from Westminster College. MBA with a Finance concentration from the University of Missouri. MA in International Affairs from Washington University in St. Louis.
Named WSJ ‘Best on the Street’ Analyst and Forbes/StarMine’s “Best Brokerage Analyst.”
FINRA licenses 7, 24, 63, 87

WARNING

This report is intended to provide general securities advice, and does not purport to make any recommendation that any securities transaction is appropriate for any recipient particular investment objectives, financial situation or particular needs. Prior to making any investment decision, recipients should assess, or seek advice from their advisors, on whether any relevant part of this report is appropriate to their individual circumstances. If a recipient was referred to Noble Capital Markets, Inc. by an investment advisor, that advisor may receive a benefit in respect of
transactions effected on the recipients behalf, details of which will be available on request in regard to a transaction that involves a personalized securities recommendation. Additional risks associated with the security mentioned in this report that might impede achievement of the target can be found in its initial report issued by Noble Capital Markets, Inc.. This report may not be reproduced, distributed or published for any purpose unless authorized by Noble Capital Markets, Inc..

RESEARCH ANALYST CERTIFICATION

Independence Of View
All views expressed in this report accurately reflect my personal views about the subject securities or issuers.

Receipt of Compensation
No part of my compensation was, is, or will be directly or indirectly related to any specific recommendations or views expressed in the public
appearance and/or research report.

Ownership and Material Conflicts of Interest
Neither I nor anybody in my household has a financial interest in the securities of the subject company or any other company mentioned in this report.

Digital, Media & Technology Industry Report: A Building Case For Small Caps

Monday, October 16, 2023

Michael Kupinski, Director of Research, Noble Capital Markets, Inc.

Jacob Mutchler, Research Associate, Noble Capital Markets, Inc.

Refer to the bottom of the report for important disclosures

Overview: A new small-cap cycle? Small cap stocks have underperformed the large cap stocks for the past several years. Notably, there is a sizable valuation disparity between the two classes, one of the largest in over 20 years. Some of the small cap stocks we follow trade at a modest 2 times Enterprise Value to EBITDA, compared with large cap valuations as high as 13 to 15 times. Are we on a cusp of a small cap cycle? 

Digital Media & Technology: Stocks Outperform – But Don’t Get Too Excited. Each of Noble’s Internet and Digital Media Indices, which are market cap weighted, outperformed the S&P 500 in the third quarter, but the double-digit gains from the previous quarter moderated significantly. Despite these relatively positive results, the prevailing theme within each sector was that the largest cap stocks performed the best, while smaller cap stocks across a variety of sectors struggled.

Television Broadcasting: Advertising Stabilizing?As we look toward the third quarter, local advertising appears to be weakening as the economy appears to be slowing. But, national appears to be improving. In addition, while it was assumed that Political would increase in the fourth quarter due to the run-off of the Republican presidential candidates, we believe that President Biden has recently stepped-up advertising in the third quarter, particularly in Hispanic communities.

Radio Broadcasting: Shoring up balance sheets. As many radio companies face a challenged revenue environment and at the same time invested in faster growth digital revenue, some companies have been caught carrying a substantial amount of debt. In this report, we highlight one company that was able to shore up its balance sheet through asset sales. 

Publishing:Stocks outperform. It may be hard to imagine for some investors, but the Publishing stocks outperformed in both the latest quarter and for the trailing 12 months the S&P 500! But, there is still a wide valuation gap between most of Publishers and the shares of The New York Times, with the NYT shares at 15 times cash flow and the rest near 5.  

Overview

The case for small caps

Small cap investors have gone through a rough period. For the past several years, investors have anticipated an economic downturn. With these concerns, investors turned toward “safe haven” large cap stocks, which typically have the ability to weather the economic headwinds and have enough trading volume should investors need to exit the position. Since 2018, small cap stocks have underperformed the general stock market, with annualized returns of just 3.7% as measured by the S&P 600 Small Cap Index versus the general market of 10.2% as measured by the S&P 500 Index. Another small cap index, the Russell 2000, increased a more modest 2.9% annually over the comparable period. The S&P 500 is larger cap, with the minimum market cap of $14.6 billion. The S&P 600 is smaller cap, a range of $850 million to $3.7 billion, with the Russell 2000 median market cap $950 million. Some of the even smaller cap stocks, those between $100 million to $850 million, have significantly underperformed the S&P 600. This is the first time that small caps underperformed a bullish period for all stocks since the 1940s. Notably, there is a sizable valuation disparity between the two classes, large and small cap, one of the largest in over 20 years.

Some of the small cap stocks we follow trade at a modest 2 times Enterprise Value to EBITDA, compared with large cap valuations as high as 13 to 15 times. By another measure, small cap stocks may be the only class trading below historic 25 year average to the median Enterprise Value to EBIT. Why the large valuation disparity? We believe that there is higher risk in the small cap stocks, especially given that some companies may not be cash flow positive, have capital needs, or have limited share float. But, investors seem to have thrown the baby out with the bathwater. While those small cap stocks are on the more speculative end of the scale, many small cap stocks are growing revenues and cash flow, have capable balance sheets, and/or are cash flow positive. For attractive emerging growth companies, the trading activity will resolve itself over time. Some market strategists suggest that small cap stocks trade at the most undervalued in the market, as much as a 30% to 40% discount to fair value. 

Are we on a cusp of a small cap cycle? Some fund managers think so. Such a cycle could last 10 years or longer. In this report, we highlight a few of our small cap favorites in the Media sector, those include companies that have attractive growth characteristics, some with or without an improving economy, capable balance sheets, and limited capital needs. Our current favorites based on growth opportunity and stock valuation include: Direct Digital (DRCT), Entravision (EVC), E.W. Scripps (SSP), Gray Television (GTN), and Townsquare Media (TSQ). 

Source: Morningstar and Noble Capital Markets Estimates. For more information; https://www.morningstar.com/markets/fading-recession-fears-cheap-valuations-have-small-cap-stocks-looking-attractive

Digital Media & Technology

Stocks Outperform – But Don’t Get Too Excited

After increasing by 8% in the second quarter of 2023, the S&P 500 was unable to hold onto those gains in the third quarter. The S&P Index decreased by 3.6% in the third quarter, a decline which we attribute to the market revising its interest rate expectations to one in which rates would remain “higher for longer”.  Large cap stocks that weighed on the broad market index included tech stocks such as Apple (AAPL: -12%), Microsoft (MSFT: -7%) and Tesla (TSLA:  -4%).  Despite this small step backwards, the S&P 500 Index increased by 20% through the first nine months of the year. 

Each of Noble’s Internet and Digital Media Indices, which are market cap weighted, outperformed the S&P 500 in the third quarter, but the double-digit gains from the previous quarter (2Q 2023) moderated significantly. Digital Media 3-Month Performance Sectors that outperformed the S&P 500’s 4% decrease include Noble’s Digital Media Index (+6%), Social Media Index (+4%), Gaming Index (+3%), Ad Tech Index (+1%) and MarTech Index (-3%).  Despite these relatively positive results, the prevailing theme within each sector was that the largest cap stocks performed the best while smaller cap stocks across a variety of sectors struggled.

Figure #1 Digital Media 3-Month Performance

Source: Capital IQ

Perhaps more importantly, each of Noble’s Internet and Digital Media Indices have outperformed the S&P 500 over the latest twelve months as illustrated in Figure #2 Digital Versus S&P 500 LTM. The S&P 500 Index has increased by 20% over the last year (through 9/30/2023), which trailed the performance of the each of Noble’s Internet and Digital Media Indices, as shown in Figure #3 Digital Media LTM Performance.  

Figure #2 Digital Versus S&P 500 LTM

Figure #3 Digital Media LTM Performance

Source: Capital IQ

Alphabet Powers Digital Media Index Higher Despite Broader-Based Sector Weakness

The best performing index during the quarter was the Noble’s Digital Media Index, but the sector’s “strong” performance is deceiving. Shares of Alphabet (a.k.a. Google:  GOOGL) increased by 9% during the quarter, and the company size relative to its peers helps explain the vast majority of the sector’s performance. Google’s market cap is 8x larger than its next largest “peer” in Netflix, and it is 160 times that of the average market cap of its Digital Media peers.  Google beat expectations across all metrics (revenue, EBITDA, free cash flow) and guided to improved profitability as it streamlines workflows. The company is also increasingly perceived as a beneficiary of AI.  While Alphabet shares performed well, they mask the fact that shares of only 2 of the sector’s 12 stocks were up during the third quarter. The other Digital Media stock that performed well in the quarter was FUBO (FUBO), whose shares increased by 29% in 3Q 2023.  Of the 10 other digital content providers in the sector, 7 of them posted double-digit stock price declines in the third quarter.     

Large Cap Meta Powers the Social Media Index Higher

Shares in Meta Platforms (formerly Facebook) rose for the third straight quarter. Shares increased by 5% and were up 150% through the first nine months of the year. Meta shares increased by 8% at the start of the third quarter due to excitement around the launch of Threads, Meta’s answer to Twitter.  Over 100 million people signed up for Threads within the first five days of its rollout and positions the company well for continued revenue growth once it begins to monetize this new opportunity.    

As with the Digital Media Index, the Social Media Index masked underlying weakness across several smaller cap stocks.  Of the 6 stocks in the Social Media Index, only Meta shares increased during the quarter.  Several social media companies performed poorly during the quarter including Spark Networks (LOVL.Y: -59%), which filed to delist its shares, Nextdoor Holdings (KIND: -44%), which has struggled to reach profitability, and Snap (SNAP: -25%), which guided to revenue declines in 3Q 2023.    

“No Love” For Small Cap Stocks

As was the case in the Digital Media and Social Media sectors, the same trends held true in the other sectors:  in general, large cap stocks outperformed small cap stocks. For example, Noble’s Video Gaming Index increased by 3% in the third quarter, driven by Activision Blizzard (ATVI: +11%), and to a lesser extent SciPlay Corp (SCP: +16%).  However, 7 other stocks in the video gaming sector posted stock price declines in the third quarter. Larger cap names such as EA Sports (EA: -7%) and Take-Two Interactive (TTWO: -5%) posted mid-single digit stock price declines while every small cap video gaming stock posted double digit declines. 

Noble’s Ad Tech Index increased by 1% during the quarter driven by shares of AppLovin (APP: +55%), and Taboola (TBLA: +22%).  However, just 7 of the sector’s 20 stocks were up for the quarter, and 10 stocks in the sector posted double digit declines. One of our favorites is an attractive growth, small cap company, Direct Digital. The DRCT shares declined 20% in the quarter, in spite of posting favorable Q2 revenue that beat expectations and raising full year revenue estimates. Direct Digital leads our list of favorites in the digital Ad Tech companies. As Figure #4  Ad Tech Comparables indicate, Direct Digital is among the cheapest in the industry trading at 4.7 Enterprise Value to our 2024 adj. EBITDA estimate, well below larger cap peers trading at multiples of 12, 13, or even much higher. Finally, Noble’s MarTech Index decreased by 3% (the only index that declined during the quarter), with the sector’s largest companies, Adobe (ADBE: +4%) and Shopify (SHOP: -16%) posting mixed results. Outside of these mega-cap stocks, the theme of underlying weakness prevailed: only 5 of the 20 stocks in the sector posted stock price increases, while one was flat and the other 14 were down.  Eleven of the 20 stocks in the MarTech sector posted double digit stock price declines. One of our favorites in the sector, Harte Hanks performed well in the quarter up 18.8%. This was a welcomed bounce from the steep decline in the shares over the past 12 months, down 44%. The company stumbled on quarterly expectations. We believe that the sell-off was over done, providing a compelling opportunity for investors. As Figure #5  MarTech Comparables illustrates, the HHS shares trade at 3.8 times Enterprise Value to our 2024 adj. EBITDA estimate, a fraction of the multiples of many of its larger cap peers. We view the HHS shares as among our favorites in the sector.   

Figure #4 Ad Tech Comparables

Source: Company filings & Eikon

Figure #5 MarTech Comparables

Source: Noble estimates & Company filings

Traditional Media

Virtually all traditional media stocks underperformed the general market in the past quarter and trailing 12 months, as illustrated in Figure #6  Traditional Media LTM Performance, save the Publishing group. In the latest quarter, Publishing stocks outperformed the general market, up 3.0% versus down 3.6% for the general market as measured by the S&P 500 Index. The average Publishing stock is up 6.9% over the past 12 months, with some of the larger cap publishing stocks up significantly more, over 20%. More details on the Publishing performance is in the Publishing section of this report. In the last quarter, the Radio stocks were the worse performing group, down on average 10.2%, As illustrated in Figure #7 Traditional Media 3-Month Performance. In addition, the Radio stocks were the worst performing group in the third quarter as well, down and average of 12.7% for the quarter.  

Figure #6 Traditional Media LTM Performance

Source: Capital IQ

Figure #7 Traditional Media 3-Month Performance 

Source: Capital IQ

Television Broadcasting

Have the TV stocks discounted too much?

We believe that the economic headwinds of rising interest rates and inflation have begun to hit local advertising. Local advertising had been relatively stable, favorably influenced by a resurgence of Auto advertising. Notably, local advertising fared much better than national advertising, which was down in the absence of Political advertising. As we look toward the fourth quarter, local advertising appears to be weakening. But, notably, national advertising appears to be doing much better, driven by an early influx of Political advertising. While it was assumed that Political would increase in the fourth quarter due to the run-off of the Republican presidential candidates, especially in early primary States, we believe that President Biden has recently stepped-up advertising, particularly to the Hispanic community. We have noticed Biden advertising even in Florida! So, what does this mean for media fundamentals?

It is difficult to predict where Political dollars will be spent and not all Political dollars will be spent evenly, geographically or by stations in a particular market. Furthermore, Political dollars may be pulled back in a market should a particular candidate pull ahead in the polls. Political dollars were anticipated to be spent in early primary States, specifically for the Republican candidates. But, the Biden money is a surprise. Biden appears to be spending early and in areas to solidify a key voting block, Hispanics. Of course, the Biden campaign may broaden its spending to other voting blocks as well. In our view, 2024 will be a banner year for Political advertising given the large amount of Political fundraising by the candidates and by Political Action Committees. The prospect of weak local advertising, however, may cast a pall over the current expected strong revenue growth in 2024. Many analysts, including myself, expected that economic prospects would improve in 2024, which would have provided a favorable tailwind for a significant improvement in total TV advertising in 2024. Certainly, it is likely that the Fed may lower interest rates in 2024, potentially providing a boost to local advertising prospects, but that improvement may come late in the year. But, overall, in spite of the weakening Local advertising environment, given the improving National advertising trends, overall TV advertising appears to have stabilized. 

For now, we are cautiously optimistic about 2024, with the caveat that revenue growth may be somewhat tempered given the current weak local advertising trends. Nonetheless, we believe that we are nearing the trough for this economic cycle. Some companies, like E.W. Scripps, are in a favorable cycle for Retransmission renewals. Retransmission revenues now account for a hefty 50% of Scripps’ total broadcast revenue. In Scripps’ case, 75% of its subscribers are under renewal, which it recently announced was completed. As such, the company reaffirmed guidance that Retransmission revenue will increase 15% in 2024 and lead to a substantial increase in net Retransmission revenue. We remain constructive on TV stocks, as high margin Political advertising should boost balance sheets and improve stock valuations.

In the latest quarter, TV stocks underperformed the general market. As Figure #7 Traditional Media 3-Month Performanceillustrates, the Noble TV Index decreased 13.2%, underperforming the 3.6% decline in the general market as measured by the S&P 500. The poor performance of the latest quarter adversely affected the trailing 12 month performance, bringing the Noble TV Index to a 17.6% decline for the trailing 12 months. Individual stocks performed more poorly, with only the shares of Fox Corporation registering a modest gain for the trailing 12 months of 2.7%. The Noble TV Index is market cap weighted, and, as such, Fox with a $15 billion market cap, carried the index. Outside of the relatively strong performance of this large cap stock, all of the TV stocks were down and down big, between 18% to 59% over the past 12 months. 

We believe that investors have shied away from cyclicals, smaller cap stocks, and from companies with higher debt levels. This accounts for the poor performance of Gray Television and E.W. Scripps, both of which have elevated debt leverage given recent acquisitions. Both were among the poorest performers for the latest quarter and for the trailing 12 months. The GTN shares were down 12% in the third quarter and 38% for the last 12 months; the SSP shares down 40% and 58%, respectively.

We believe that the sell-off has been overdone, especially as the industry is expected to cycle toward an improved fundamental environment in 2024. As Figure #8 TV Industry Comparables indicate, the Broadcast TV stocks trade at a modest 5.3 times Enterprise Value to our 2024 adj. EBITDA estimates, well below historic 20 year average trading multiples of 8 to 12 times. We believe that the depressed valuations largely discount the prospect of an economic downturn and do not reflect the revenue and cash flow upside as we cycle into a Political year. Given the steep valuation discount to historic levels, we believe that the stocks are 15% to 20% below levels where the stocks normally would be given a favorable Political cycle. Our favorites in the TV space include: Entravision (EVC), one of the beneficiaries of the influx of Political advertising to Hispanics; E.W. Scripps (SSP), a play on Political, with the favorable fundamental tailwind of strong Retransmission revenue growth; and, Gray Television (GTN), one of the leading Political advertising plays. 

Figure #8 TV Industry Comparables

Source: Noble estimates & Eikon

Radio Broadcasting

Shoring up balance sheets. 

The Radio industry has struggled in the first half as National advertising weakened throughout the year. On average National advertising was down roughly20% or more for many Radio broadcasters. Local held up relatively well, although down in the range of 3% to 5%. Fortunately, for many broadcasters, a push into Digital, which grew in the first half, helped to stabilize total company revenues. As we look to the fourth quarter, we believe that Local advertising is weakening, expected to be down in the range of 5% to 7%, or more in some of the larger markets. But, for some, National advertising is improving, driven by Political advertising. But, Political is not evenly spread. As such, we anticipate that there will be a cautious outlook for many in the industry for the second half of the year. 

For some in the industry, the challenged revenue environment has put a strain on managing cash flows to maintain hefty debt loads. We believe that debt leverage is among the top concern for investors. Many of the poorest performing stocks in the quarter and for the trailing 12 months carry some of the highest debt leverage in the industry. The Noble Radio Index decreased a significant 13.7% in the latest quarter compared with a 3.7% decline for the general market. But, a look at the individual stock performance tells a more disappointing story. The shares of Salem Media declined 38% in the latest quarter, bringing 12 month performance to a 44% decline. The shares of iHeart Media decline 49% for the year. 

Notably, Salem Media assuaged much of its liquidity concerns with recent asset sales. Such sales will bring in roughly $30 million, allowing it to fully pay off its $22 million revolver and have some flexibility with remaining cash on its balance sheet. We do not believe that investors have fully credited the significance of the recent asset sales. 

One bright spot in the group has been the shares of Townsquare Media. While the TSQ shares gave back a significant 27% in the third quarter, the shares are still up 20% over the past 12 months, among one of the best performance in the industry. We believe that the company’s initiation of a substantial dividend resonated with investors. 

While the industry faces fundamental headwinds given the current economic challenges, we believe that most companies have made a shift toward faster growth, digital business models. In addition, we believe that Radio will see a lift from Political advertising in 2024, although not to the extent that the TV industry will see. Nonetheless, we look for an improving advertising scenario in 2024. As such, we are constructive on the industry. One of our current favorites leads the industry in its Digital transition, Townsquare Media. As Figure #9 Radio Industry Comparables indicates, the TSQ shares are among the cheapest in the industry, trading at 5.1 times EV to our 2024 adj. EBITDA estimate, well below the average of 7.1 times for the industry. In addition, we like Saga Communications, one of the cheapest stocks in the industry, trading near 4 times EV to 2024 adj. EBITDA. 

Figure #9 Radio Industry Comparables

Source: Noble estimates & Eikon

Publishing

Further cost cutting will cut deep. 

Publishers are not likely to be spared from the weakening local advertising business. But, publishers have a play book on areas to cut expenses to manage cash flows. Certainly, we believe that its Digital businesses should help offset some of the anticipated revenue declines on its print legacy business. We believe that publishers are eliminating print days. Such a move likely will indicate further pressure on print revenues, but would not proportionately decrease cash flow. Some print days have very little advertising and/or advertisers may shift some spending to other print days. Lee Enterprises indicated in its last call that it will go down to 3 print days in 44 of its smaller markets. We believe that the move has been a success. While revenues may have decreased slightly more than expected given the current weak advertising environment, we believe that cost savings have been more than anticipated. 

While many publishers would like to have a long runway for its cash flowing print business, such possible moves would necessarily increase the digital transition. Notably, with just some stabilization of revenues on the print side, many publishers have the potential to show total company revenue growth given benefit from digital revenue. With the prospect of strategies that may cut print days and the current weak local advertising environment, we believe that total revenue growth may be pushed out to 2025. 

Many of the Publishing stocks were written off long ago. But, surprisingly, the Publishing stocks have been among the best stock performers in the latest quarter and for the trailing 12 months. The Noble Publishing Index increased a solid 36% in the trailing 12 months, outperforming the general market (as measured by the S&P 500) of 19% in the comparable time frame. In the third quarter, Publishing stocks increased 3.5%, outperforming the S&P 500, which declined 3.7%. All of the publishers increased, with the exception of Lee Enterprises. The Lee shares increased substantially a year earlier on takeover rumors. Since then the shares have come back down to earth, while the rest of the industry moved higher. The stronger performers in the industry, however, were the larger cap companies, such as News Corp and The New York Times. In the latest quarter, the shares of The New York Times increased roughly 5% and the shares are up 27% for the trailing 12 months. The shares of Gannett increased a solid 9% in the latest quarter, as well. 

As Figure #10 Publishing Industry Comparables illustrate, there is a disparity among some of the larger, more diversified companies, like The New York Times and News Corporation. The NYT shares trade at a hefty 15.7 times EV to 2024 adj. EBITDA estimates, well above much of the pack currently trading in the 5 multiple range. We believe that this valuation gap should narrow, especially as many of the companies, like Lee and Gannett, have a burgeoning Digital business. While the industry faces secular challenges of its Print business and there are economic headwinds in the very near term, we believe that companies like Lee Enterprises have the ability to manage cash flows and grow its Digital businesses. Given the compelling stock valuation disparity, the shares of Lee Enterprises lead our list of favorites in the sector. 

Figure #10 Publishing Industry Comparables 

Source: Noble estimates & Eikon

For more information and disclosures on companies mentioned in this report, click on the following:

Beasley Broadcast

Cumulus Media

Direct Digital Holdings

Entravision

E.W. Scripps

Harte Hanks

Gray Television

Lee Enterprises

Saga Communications

Salem Media Group

Townsquare Media 

GENERAL DISCLAIMERS

All statements or opinions contained herein that include the words “we”, “us”, or “our” are solely the responsibility of Noble Capital Markets, Inc.(“Noble”) and do not necessarily reflect statements or opinions expressed by any person or party affiliated with the company mentioned in this report. Any opinions expressed herein are subject to change without notice. All information provided herein is based on public and non-public information believed to be accurate and reliable, but is not necessarily complete and cannot be guaranteed. No judgment is hereby expressed or should be implied as to the suitability of any security described herein for any specific investor or any specific investment portfolio. The decision to undertake any investment regarding the security mentioned herein should be made by each reader of this publication based on its own appraisal of the implications and risks of such decision.

This publication is intended for information purposes only and shall not constitute an offer to buy/sell or the solicitation of an offer to buy/sell any security mentioned in this report, nor shall there be any sale of the security herein in any state or domicile in which said offer, solicitation or sale would be unlawful prior to registration or qualification under the securities laws of any such state or domicile. This publication and all information, comments, statements or opinions contained or expressed herein are applicable only as of the date of this publication and subject to change without prior notice. Past performance is not indicative of future results. Noble accepts no liability for loss arising from the use of the material in this report, except that this exclusion of liability does not apply to the extent that such liability arises under specific statutes or regulations applicable to Noble. This report is not to be relied upon as a substitute for the exercising of independent judgement. Noble may have published, and may in the future publish, other research reports that are inconsistent with, and reach different conclusions from, the information provided in this report. Noble is under no obligation to bring to the attention of any recipient of this report, any past or future reports. Investors should only consider this report as single factor in making an investment decision.

IMPORTANT DISCLOSURES

This publication is confidential for the information of the addressee only and may not be reproduced in whole or in part, copies circulated, or discussed to another party, without the written consent of Noble Capital Markets, Inc. (“Noble”). Noble seeks to update its research as appropriate, but may be unable to do so based upon various regulatory constraints. Research reports are not published at regular intervals; publication times and dates are based upon the analyst’s judgement. Noble professionals including traders, salespeople and investment bankers may provide written or oral market commentary, or discuss trading strategies to Noble clients and the Noble proprietary trading desk that reflect opinions that are contrary to the opinions expressed in this research report.
The majority of companies that Noble follows are emerging growth companies. Securities in these companies involve a higher degree of risk and more volatility than the securities of more established companies. The securities discussed in Noble research reports may not be suitable for some investors and as such, investors must take extra care and make their own determination of the appropriateness of an investment based upon risk tolerance, investment objectives and financial status.

Company Specific Disclosures

The following disclosures relate to relationships between Noble and the company (the “Company”) covered by the Noble Research Division and referred to in this research report.
Noble is not a market maker in any of the companies mentioned in this report. Noble intends to seek compensation for investment banking services and non-investment banking services (securities and non-securities related) with any or all of the companies mentioned in this report within the next 3 months

ANALYST CREDENTIALS, PROFESSIONAL DESIGNATIONS, AND EXPERIENCE

Senior Equity Analyst focusing on Basic Materials & Mining. 20 years of experience in equity research. BA in Business Administration from Westminster College. MBA with a Finance concentration from the University of Missouri. MA in International Affairs from Washington University in St. Louis.
Named WSJ ‘Best on the Street’ Analyst and Forbes/StarMine’s “Best Brokerage Analyst.”
FINRA licenses 7, 24, 63, 87

WARNING

This report is intended to provide general securities advice, and does not purport to make any recommendation that any securities transaction is appropriate for any recipient particular investment objectives, financial situation or particular needs. Prior to making any investment decision, recipients should assess, or seek advice from their advisors, on whether any relevant part of this report is appropriate to their individual circumstances. If a recipient was referred to Noble Capital Markets, Inc. by an investment advisor, that advisor may receive a benefit in respect of
transactions effected on the recipients behalf, details of which will be available on request in regard to a transaction that involves a personalized securities recommendation. Additional risks associated with the security mentioned in this report that might impede achievement of the target can be found in its initial report issued by Noble Capital Markets, Inc.. This report may not be reproduced, distributed or published for any purpose unless authorized by Noble Capital Markets, Inc..

RESEARCH ANALYST CERTIFICATION

Independence Of View
All views expressed in this report accurately reflect my personal views about the subject securities or issuers.

Receipt of Compensation
No part of my compensation was, is, or will be directly or indirectly related to any specific recommendations or views expressed in the public
appearance and/or research report.

Ownership and Material Conflicts of Interest
Neither I nor anybody in my household has a financial interest in the securities of the subject company or any other company mentioned in this report.

Metals & Mining Third Quarter 2023 Review and Outlook

Monday, October 2, 2023

Mark Reichman, Senior Research Analyst, Natural Resources, Noble Capital Markets, Inc.

Refer to the bottom of the report for important disclosures

Mining companies outperform the broader market. During the third quarter, mining companies (as measured by the XME) rose 3.3% compared to a decline of 3.6% for the S&P 500 index. The VanEck Vectors Gold Miners (GDX) and Junior Gold Miners (GDXJ) ETFs were down 10.6% and 9.6%, respectively. Gold, silver, and copper futures prices fell 3.3%, 1.6%, and 0.6%, respectively, while zinc and lead were up 8.7% and 6.2%. Gold was likely negatively impacted by the Federal Reserve’s higher rates for longer messaging coupled with a 3.2% increase in the U.S. Dollar Index. Year-to-date through September 30th, the XME, GDX, and GDXJ have all lagged the S&P 500 index return of 11.7%.  

Looking ahead to 2024. While we expected weakness in the second half of 2023, prices have remained relatively resilient, and we are increasingly bullish going into 2024. Factors supporting our view include: 1) the Federal Reserve appears to be nearing the end of its tightening cycle, 2) a new norm of heightened geopolitical uncertainty, 3) unsustainable growth in U.S. deficit spending and national debt, and 4) increasing investments in gold by central banks. Given the level of uncertainty reinforced by a dysfunctional U.S. political environment, we think portfolio allocations to precious metals could increase. While much will depend on monetary policy which appears to be working, we think the higher for longer mantra makes for nice messaging but actual policy will be data driven.

Outlook for industrial metals. While a potential economic downturn in the U.S. coupled with sluggish growth abroad could weigh on industrial metals demand and prices, longer-term secular trends such as electrification remain supportive of supply and demand fundamentals for metals such as copper. In the intermediate term, government support for infrastructure spending and strong demand from certain sectors such as aerospace, defense, and electronics are supportive of industrial metals.

Putting it all together. We think precious metals equities may be poised for outperformance in 2024. While well-diversified portfolios should have exposure to precious metals, mining equities may offer a stronger current alternative to bullion. In our opinion, junior companies remain attractive based on valuation and we expect industry consolidation to increase as senior producers seek to replenish reserves and resources. For industrial metals stocks, investors may need to be more selective by focusing on suppliers to end use markets with favorable demand growth fundamentals.


GENERAL DISCLAIMERS

All statements or opinions contained herein that include the words “we”, “us”, or “our” are solely the responsibility of Noble Capital Markets, Inc.(“Noble”) and do not necessarily reflect statements or opinions expressed by any person or party affiliated with the company mentioned in this report. Any opinions expressed herein are subject to change without notice. All information provided herein is based on public and non-public information believed to be accurate and reliable, but is not necessarily complete and cannot be guaranteed. No judgment is hereby expressed or should be implied as to the suitability of any security described herein for any specific investor or any specific investment portfolio. The decision to undertake any investment regarding the security mentioned herein should be made by each reader of this publication based on its own appraisal of the implications and risks of such decision.

This publication is intended for information purposes only and shall not constitute an offer to buy/sell or the solicitation of an offer to buy/sell any security mentioned in this report, nor shall there be any sale of the security herein in any state or domicile in which said offer, solicitation or sale would be unlawful prior to registration or qualification under the securities laws of any such state or domicile. This publication and all information, comments, statements or opinions contained or expressed herein are applicable only as of the date of this publication and subject to change without prior notice. Past performance is not indicative of future results. Noble accepts no liability for loss arising from the use of the material in this report, except that this exclusion of liability does not apply to the extent that such liability arises under specific statutes or regulations applicable to Noble. This report is not to be relied upon as a substitute for the exercising of independent judgement. Noble may have published, and may in the future publish, other research reports that are inconsistent with, and reach different conclusions from, the information provided in this report. Noble is under no obligation to bring to the attention of any recipient of this report, any past or future reports. Investors should only consider this report as single factor in making an investment decision.

IMPORTANT DISCLOSURES

This publication is confidential for the information of the addressee only and may not be reproduced in whole or in part, copies circulated, or discussed to another party, without the written consent of Noble Capital Markets, Inc. (“Noble”). Noble seeks to update its research as appropriate, but may be unable to do so based upon various regulatory constraints. Research reports are not published at regular intervals; publication times and dates are based upon the analyst’s judgement. Noble professionals including traders, salespeople and investment bankers may provide written or oral market commentary, or discuss trading strategies to Noble clients and the Noble proprietary trading desk that reflect opinions that are contrary to the opinions expressed in this research report.
The majority of companies that Noble follows are emerging growth companies. Securities in these companies involve a higher degree of risk and more volatility than the securities of more established companies. The securities discussed in Noble research reports may not be suitable for some investors and as such, investors must take extra care and make their own determination of the appropriateness of an investment based upon risk tolerance, investment objectives and financial status.

Company Specific Disclosures

The following disclosures relate to relationships between Noble and the company (the “Company”) covered by the Noble Research Division and referred to in this research report.
Noble is not a market maker in any of the companies mentioned in this report. Noble intends to seek compensation for investment banking services and non-investment banking services (securities and non-securities related) with any or all of the companies mentioned in this report within the next 3 months

ANALYST CREDENTIALS, PROFESSIONAL DESIGNATIONS, AND EXPERIENCE

Senior Equity Analyst focusing on Basic Materials & Mining. 20 years of experience in equity research. BA in Business Administration from Westminster College. MBA with a Finance concentration from the University of Missouri. MA in International Affairs from Washington University in St. Louis.
Named WSJ ‘Best on the Street’ Analyst and Forbes/StarMine’s “Best Brokerage Analyst.”
FINRA licenses 7, 24, 63, 87

WARNING

This report is intended to provide general securities advice, and does not purport to make any recommendation that any securities transaction is appropriate for any recipient particular investment objectives, financial situation or particular needs. Prior to making any investment decision, recipients should assess, or seek advice from their advisors, on whether any relevant part of this report is appropriate to their individual circumstances. If a recipient was referred to Noble Capital Markets, Inc. by an investment advisor, that advisor may receive a benefit in respect of
transactions effected on the recipients behalf, details of which will be available on request in regard to a transaction that involves a personalized securities recommendation. Additional risks associated with the security mentioned in this report that might impede achievement of the target can be found in its initial report issued by Noble Capital Markets, Inc.. This report may not be reproduced, distributed or published for any purpose unless authorized by Noble Capital Markets, Inc..

RESEARCH ANALYST CERTIFICATION

Independence Of View
All views expressed in this report accurately reflect my personal views about the subject securities or issuers.

Receipt of Compensation
No part of my compensation was, is, or will be directly or indirectly related to any specific recommendations or views expressed in the public
appearance and/or research report.

Ownership and Material Conflicts of Interest
Neither I nor anybody in my household has a financial interest

Energy Industry Report – Oil prices on a tear – the case for why prices will stay high

Monday, October 2, 2023

Michael Heim, CFA, Senior Research Analyst, Noble Capital Markets, Inc.

Refer to the bottom of the report for important disclosures

Oil price rose 30% in the third quarter helping propel the XLE Energy Index up 11.4%. Natural gas prices also rose after twelve months of decline. Higher oil prices reflect declining inventories due to rising demand that is not being met by rising supply.

Domestic oil demand is rising. Oil demand largely tracks the economy. And, while monetary tightening has slowed growth, demand is still growing. Recently, domestic demand has increased due to warm summer weather and increased propane exports to Europe.

Oil supply is not keeping pace. OPEC+ extended its production cuts. In previous decades, domestic producers would respond to production cuts by accelerating drilling. In recent years, producers have not increased drilling as noted by a sharp decline in domestic oil rig activity. Oil drilling rigs even declined this quarter despite the rise in oil prices. Limited drilling, combined with sharper well decline curves, has meant supply is not keeping up with demand. 

Small cap producers are uniquely positioned to take advantage of higher prices. The production gains that came from horizontal drilling and fracking in the Permian Basin appear to be waning. That means well profitability has declined as producers move on to secondary and tertiary targets. This is especially an issue for larger production companies that need a large number of wells drilled to provide growth. In addition, large companies face regulatory and investor pressures regarding fossil fuel production that the smaller companies may avoid.

Energy Stocks

Energy stocks, as measured by the XLE Energy Index, rose 11.4% in the 2023 third quarter as compared to a 3.6% decline in the S&P 500 Index.  The outperformance was largely due to rising oil prices. The November 2023 futures contract rose 30% during the quarter. Natural gas prices rose 4.9% during the quarter largely reflecting normal seasonal trends.

Oil Prices

The rise in oil prices corresponds to a drop in inventories. After a covid-induced spike in  early 2020, domestic inventories have fallen steadily. During this period of monetary tightening, demand growth has slowed but remained positive. Supply, on the other hand, has stagnated. OPEC+ has extended cutbacks and domestic drilling activity has declined.

Figure #1

Source: EIA

The decline in drilling activity can best be seen by looking at domestic oil rig activity. Where once there were more than 1600 active wells, now there are one-third that number. What’s more, oil drilling activity has continued to decline in the third quarter even as oil prices have risen.

Figure #2

Source: Baker Hughes

Weather has also played a part as warm temperatures have meant increased use of oil for electric generations. Although oil represents a small portion of the generation load, it is an important component in the summer months when generation demand is greatest. Temperatures in the United States have been warmer than average each month this summer and 17 of the 24 months over the last four years.

Figure #3


Finally, it is worth noting that petroleum exports have been growing. Exports jumped after the Ukraine invasion as the United States rushed to ship petroleum to Europe to offset Russian supply disruptions. Note the large jump in propane exports since 2021 in the chart below. Propane, a component of the crude oil barrel, is one of the easier fuels to export until additional liquified natural gas export terminals are completed.

Figure #4

The combination of limited drilling, growing demand for electric generation and exports, and OPEC production cuts bodes well for oil prices.

Natural Gas Prices

The story for natural gas is less positive but improving. Sharp declines last winter bottomed out in April and have slowly begun to creep back upward. Natural gas production profitability is not great at prices near $3.00 per thousand cubic feet (mcf) but still profitable.  

Figure #5

Source: Nymex, EIA

Outlook

We believe the outlook for energy companies remains favorable. Oil prices are high and do not show signs of falling due to OPEC cuts, reduced domestic drilling and rising demand for power generation and exports. We believe the case for smaller cap energy stocks is especially strong because they are less liquid and slower to react to rising energy prices. Smaller energy companies also face less political and investor pressure to shift away from carbon-based production.


GENERAL DISCLAIMERS

All statements or opinions contained herein that include the words “we”, “us”, or “our” are solely the responsibility of Noble Capital Markets, Inc.(“Noble”) and do not necessarily reflect statements or opinions expressed by any person or party affiliated with the company mentioned in this report. Any opinions expressed herein are subject to change without notice. All information provided herein is based on public and non-public information believed to be accurate and reliable, but is not necessarily complete and cannot be guaranteed. No judgment is hereby expressed or should be implied as to the suitability of any security described herein for any specific investor or any specific investment portfolio. The decision to undertake any investment regarding the security mentioned herein should be made by each reader of this publication based on its own appraisal of the implications and risks of such decision.

This publication is intended for information purposes only and shall not constitute an offer to buy/sell or the solicitation of an offer to buy/sell any security mentioned in this report, nor shall there be any sale of the security herein in any state or domicile in which said offer, solicitation or sale would be unlawful prior to registration or qualification under the securities laws of any such state or domicile. This publication and all information, comments, statements or opinions contained or expressed herein are applicable only as of the date of this publication and subject to change without prior notice. Past performance is not indicative of future results. Noble accepts no liability for loss arising from the use of the material in this report, except that this exclusion of liability does not apply to the extent that such liability arises under specific statutes or regulations applicable to Noble. This report is not to be relied upon as a substitute for the exercising of independent judgement. Noble may have published, and may in the future publish, other research reports that are inconsistent with, and reach different conclusions from, the information provided in this report. Noble is under no obligation to bring to the attention of any recipient of this report, any past or future reports. Investors should only consider this report as single factor in making an investment decision.

IMPORTANT DISCLOSURES

This publication is confidential for the information of the addressee only and may not be reproduced in whole or in part, copies circulated, or discussed to another party, without the written consent of Noble Capital Markets, Inc. (“Noble”). Noble seeks to update its research as appropriate, but may be unable to do so based upon various regulatory constraints. Research reports are not published at regular intervals; publication times and dates are based upon the analyst’s judgement. Noble professionals including traders, salespeople and investment bankers may provide written or oral market commentary, or discuss trading strategies to Noble clients and the Noble proprietary trading desk that reflect opinions that are contrary to the opinions expressed in this research report.
The majority of companies that Noble follows are emerging growth companies. Securities in these companies involve a higher degree of risk and more volatility than the securities of more established companies. The securities discussed in Noble research reports may not be suitable for some investors and as such, investors must take extra care and make their own determination of the appropriateness of an investment based upon risk tolerance, investment objectives and financial status.

Company Specific Disclosures

The following disclosures relate to relationships between Noble and the company (the “Company”) covered by the Noble Research Division and referred to in this research report.
Noble is not a market maker in any of the companies mentioned in this report. Noble intends to seek compensation for investment banking services and non-investment banking services (securities and non-securities related) with any or all of the companies mentioned in this report within the next 3 months

ANALYST CREDENTIALS, PROFESSIONAL DESIGNATIONS, AND EXPERIENCE

Senior Equity Analyst focusing on Basic Materials & Mining. 20 years of experience in equity research. BA in Business Administration from Westminster College. MBA with a Finance concentration from the University of Missouri. MA in International Affairs from Washington University in St. Louis.
Named WSJ ‘Best on the Street’ Analyst and Forbes/StarMine’s “Best Brokerage Analyst.”
FINRA licenses 7, 24, 63, 87

WARNING

This report is intended to provide general securities advice, and does not purport to make any recommendation that any securities transaction is appropriate for any recipient particular investment objectives, financial situation or particular needs. Prior to making any investment decision, recipients should assess, or seek advice from their advisors, on whether any relevant part of this report is appropriate to their individual circumstances. If a recipient was referred to Noble Capital Markets, Inc. by an investment advisor, that advisor may receive a benefit in respect of
transactions effected on the recipients behalf, details of which will be available on request in regard to a transaction that involves a personalized securities recommendation. Additional risks associated with the security mentioned in this report that might impede achievement of the target can be found in its initial report issued by Noble Capital Markets, Inc.. This report may not be reproduced, distributed or published for any purpose unless authorized by Noble Capital Markets, Inc..

RESEARCH ANALYST CERTIFICATION

Independence Of View
All views expressed in this report accurately reflect my personal views about the subject securities or issuers.

Receipt of Compensation
No part of my compensation was, is, or will be directly or indirectly related to any specific recommendations or views expressed in the public
appearance and/or research report.

Ownership and Material Conflicts of Interest
Neither I nor anybody in my household has a financial interest in the securities of the subject company or any other company mentioned in this report.