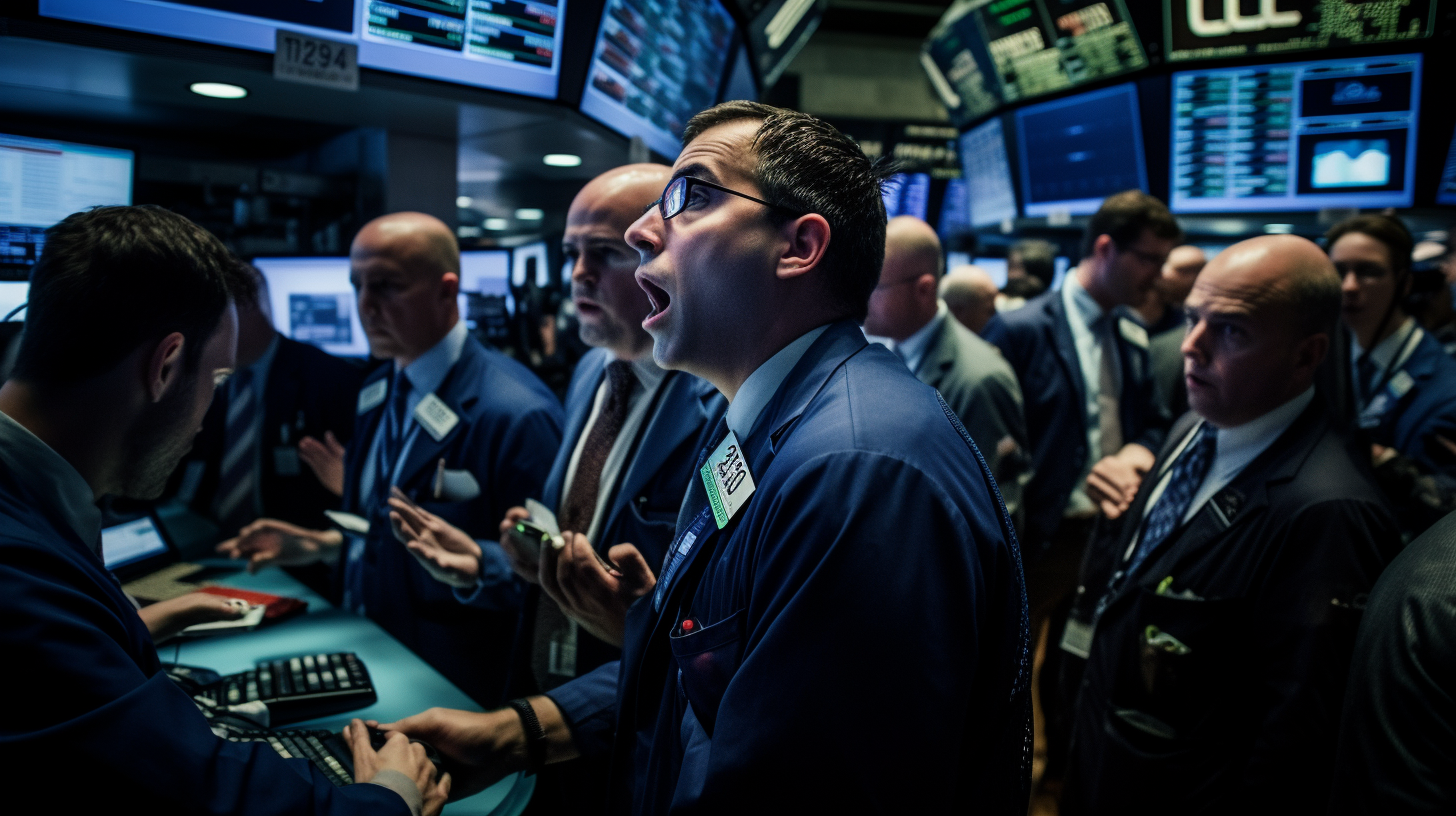
Trump Victory Sparks Surge in U.S. Stock Market

Key Points:
– Dow Jones, S&P 500, and Nasdaq post significant gains following Trump’s presidential win.
– S&P Regional Banking ETF jumps over 10%, fueled by expectations of favorable financial policies.
– Tesla shares climb over 10% in response to anticipated business-friendly conditions.

U.S. stocks soared on Wednesday as investors reacted to Donald Trump’s election victory over Kamala Harris, marking his return to the White House. A pivotal call in Wisconsin by the Associated Press early that morning secured Trump the necessary electoral votes, generating a major market response across sectors. With Trump set to be the 47th president, major indices surged. The Dow Jones Industrial Average spiked more than 1,100 points, or 2.7%, leading the rally. Following closely, the S&P 500 gained about 1.5%, while the tech-centric Nasdaq Composite rose approximately 2%.

The small-cap Russell 2000 posted particularly strong gains, jumping over 4.2% at the open, spurred by a surge in regional banks and financials. Many investors interpret Trump’s return as a sign of pro-business policies that could favor financial and industrial sectors, given his history of lower tax policies and financial deregulation during his previous term. The S&P Regional Banking ETF (KRE) rose more than 10% early Wednesday, underscoring this trend. Analysts believe that smaller regional banks are set to benefit from a more relaxed regulatory environment, making financials one of the day’s top-performing sectors.

Beyond financial stocks, the 10-year Treasury yield climbed to 4.46%, reflecting higher confidence in economic growth under the incoming administration. Rising yields often signal investor optimism, though they also reflect anticipated inflation. The dollar also strengthened against major global currencies, and Bitcoin surged to an all-time high, with investors anticipating a favorable climate for cryptocurrency investments. The gains in both the dollar and Bitcoin underscore how investors are re-evaluating asset allocation based on the potential for significant economic and regulatory shifts in the U.S.

Technology stocks, and particularly Tesla, were other standout winners. Tesla’s stock shot up by more than 10%, propelled by CEO Elon Musk’s open support of Trump and the potential for business-friendly policies. Musk has previously praised Trump’s tax and regulatory agenda, and with renewed market optimism, analysts expect Tesla and other growth-driven tech companies to benefit from potentially eased restrictions. The strong performance across tech stocks highlights broader investor enthusiasm for sectors with substantial growth potential under Trump’s policies.

Meanwhile, uncertainty around Congress control remains, as Republicans have flipped the Senate, while the House remains too close to call. Control of both chambers could substantially influence the type and extent of economic policies Trump can implement. As of now, investors are weighing scenarios around tax reform, stimulus packages, and regulatory adjustments that could impact sectors like energy, infrastructure, and finance.

The presidential election outcome is expected to drive market momentum in the near term, particularly in areas like financial services, infrastructure, and industrials. The anticipated mix of fiscal stimulus, tax policy changes, and deregulation, while not fully certain, reflects investor sentiment in favor of economic expansion under Trump’s leadership. How the markets react in the longer term will depend on the clarity of legislative actions and potential shifts in U.S. trade policy.

U.S. Indexes Fall as Iran Fires Missiles at Israel; Defense Stocks Surge

Key Points:
– U.S. stock indexes drop, with Nasdaq down over 1% after Iran’s missile attack on Israel.
– Defense stocks rise as oil prices surge amid geopolitical tensions.
– Investors grow cautious, monitoring U.S. job data and port strikes.

U.S. stock markets took a sharp turn downward on Tuesday as news broke of Iran launching a barrage of ballistic missiles at Israel, heightening tensions in the Middle East. The Nasdaq Composite led the decline, falling by over 1%, while the broader market also saw losses, reflecting growing investor caution in the face of geopolitical instability. The Dow Jones Industrial Average fell by 0.2%, and the S&P 500 dropped 0.75%.

The attack by Iran is seen as retaliation for Israel’s ongoing military campaign against Hezbollah, Iran’s ally in the region. In response to the missile strikes, President Joe Biden directed the U.S. military to support Israel’s defense and to shoot down any missiles aimed at the country, as confirmed by the White House National Security Council.

While the broader market felt the impact of the escalating conflict, shares in the defense sector surged. Companies like Northrop Grumman and Lockheed Martin saw their stock prices rise, as investors shifted focus to the increased demand for defense and military technology in light of the conflict. The S&P 500 Aerospace and Defense Index rose by more than 1%, hitting a new record high.

Energy companies also benefitted from the geopolitical unrest, with oil prices rising alongside the tensions. Exxon Mobil gained 2.2% as West Texas Intermediate crude oil climbed over 4%. The possibility of further supply disruptions in the Middle East, which produces a significant portion of the world’s oil, pushed investors into energy stocks, which historically serve as a hedge during times of geopolitical uncertainty.

On the other hand, airline stocks like Delta Air Lines experienced losses, reflecting concerns over potential disruptions in travel and higher fuel costs. Delta’s shares dropped by 1%, as investors anticipated a tightening of air travel conditions due to escalating tensions in the region.

“This situation highlights the variety of risks the market is currently facing, from slowing employment to geopolitical tensions,” noted Walter Todd, Chief Investment Officer at Greenwood Capital. “The market is vulnerable to shocks like this, and it’s reacting accordingly.”

The heightened geopolitical risk comes at a time when U.S. markets were already grappling with several economic uncertainties. On Monday, the three major indexes had posted strong gains for September and for the third quarter, but Tuesday’s developments prompted a reversal of that trend. In addition to the conflict in the Middle East, investors are also closely watching economic data related to U.S. job openings and manufacturing activity, which rebounded in August but still signaled broader concerns about the health of the economy.

Increased market volatility followed the news, with the CBOE Volatility Index, also known as the VIX or “fear gauge,” jumping by two points to 18.74. Earlier in the session, the index had reached a three-week high of 20.73, indicating a growing sense of uncertainty among investors.

Meanwhile, the looming East Coast and Gulf Coast port strikes, which began Tuesday, added another layer of complexity to the market’s reaction. The strike has halted approximately half of the nation’s ocean shipping, potentially exacerbating economic disruptions and creating further uncertainty for policymakers at the Federal Reserve as they assess the state of the economy.

Investors will be watching closely as more economic data is released later in the week, particularly the U.S. jobless claims report on Thursday and the monthly payrolls data on Friday. With market sentiment already rattled by geopolitical events, these figures could further influence the outlook for future Federal Reserve interest rate cuts.

S&P 500 Slides 1%, Capping Worst Week in a Year Amid Tech Selloff and Weak Jobs Report

Key Points:
– The S&P 500 falls 1%, heading for its worst weekly performance since March 2023.
– Weaker-than-expected August jobs report sparks concerns about the U.S. economy.
– Tech giants like Amazon and Alphabet lead the market decline, with the Nasdaq shedding 2.5%.

Friday saw the S&P 500 take a sharp 1% drop, closing out its worst week since March 2023. The selloff came in response to a weak August jobs report and a broader selloff in technology stocks, as investors grew increasingly concerned about the state of the U.S. economy.

The broad-market S&P 500 index dropped 1.7% for the day, while the tech-heavy Nasdaq Composite sank by 2.5%. The Dow Jones Industrial Average also fell, losing 410 points, or about 1%.

According to Emily Roland, co-chief investment strategist at John Hancock Investment Management, the market’s recent volatility has been largely sentiment-driven. Investors are torn between fears of economic slowdown and hopes that weaker economic data may force the Federal Reserve to step in with more aggressive rate cuts.

“The market’s oscillating between this idea of is bad news bad news, or is bad news good news,” Roland said. Investors are grappling with the possibility that soft labor market data might push the Fed to cut interest rates more sharply than initially anticipated.

The technology sector bore the brunt of the selloff on Friday. Megacap tech stocks, including Amazon and Alphabet, were hit hard, both losing over 3%. Microsoft and Meta Platforms also saw losses exceeding 1%. Meanwhile, chip stocks faced a particularly tough day, with Broadcom plummeting 9% after issuing weak guidance for the current quarter. This dragged down other semiconductor players like Nvidia, Advanced Micro Devices (AMD), and Marvell Technology, each falling over 4%.

The VanEck Semiconductor ETF, which tracks the performance of major semiconductor companies, dropped 4%, making this its worst week since March 2020. Investors appeared to be fleeing high-growth, high-risk sectors like tech as concerns about the broader economic slowdown took center stage.

Adding to the uncertainty was the August nonfarm payrolls report, which showed the U.S. economy added just 142,000 jobs last month, falling short of the 161,000 that economists had anticipated. While the unemployment rate dipped slightly to 4.2%, in line with expectations, the soft job creation numbers are fueling fears of a weakening labor market.

The weaker jobs data has heightened worries about the U.S. economy’s trajectory, further spooking already jittery markets. Charles Ashley, a portfolio manager at Catalyst Capital Advisors, noted that the market is currently in a state of flux, with investors looking to the Federal Reserve for clearer direction.

Market expectations have shifted sharply in response to the data. Investors now widely expect the Fed to cut rates by at least a quarter of a percentage point at its September policy meeting. However, the deteriorating labor market has raised speculation that the Fed may opt for a larger, 50 basis point rate cut instead.

According to the CME Group’s FedWatch tool, nearly half of traders are pricing in the likelihood of a 50 basis point rate reduction in light of the softening economic conditions.

Friday’s jobs report capped a turbulent week for equities, with the S&P 500 and Nasdaq both posting their worst weekly performances in months. The S&P 500 is down about 4% for the week, while the Nasdaq shed 5.6%. The Dow didn’t fare much better, dropping 2.8%.

As investors brace for the Federal Reserve’s next move, volatility in the market seems likely to persist, especially as concerns about the health of the U.S. economy continue to mount.

Stocks See Upbeat End to Tumultuous 2023 as Investors Look to New Year

Major U.S. stock indexes edged higher at the open on Thursday, putting the S&P 500 on the verge of notching its longest weekly winning streak since 2004 and cementing an overall standout year for equities.

The S&P 500 rose 0.2% to kick off the final trading session of the week, hovering near its all-time closing high of 4,796.56. The benchmark index is up over 19% year-to-date and on pace to close out its ninth consecutive week of gains. The last time the S&P 500 posted such an extended weekly rally was back in November 2004.

Powering the upbeat performance is the technology-focused Nasdaq Composite, which has skyrocketed more than 44% in 2023 – its biggest annual gain since 2003. Tech stocks have proven remarkably resilient despite rising interest rates, which tend to especially pressure growth names. On Thursday, the Nasdaq edged up 0.3% to add to its banner year.

The Dow Jones Industrial Average also joined in on the gains, rising 0.2% in early trading thanks to lifts from constituent stocks like Nike and Boeing. The 30-stock index remains on track to gain nearly 7% in 2023, making it one of the rare years in the past decade that the Dow has lagged the broader S&P 500.

While stocks are closing 2023 on an undeniably high note, the road to this point has been bumpy. The first half of the year was dominated by fears of surging inflation and the Federal Reserve’s aggressive policy response. The Fed’s supersized rate hikes aimed at cooling price growth fueled worries that they would ultimately tip the economy into a recession.

The second half brought some relief on inflation and allowed the Fed to moderate its tightening campaign. But economic uncertainties still abound, especially as consumer spending shows signs of weakening and the housing market continues to slide.

That backdrop makes this year-end rally all the more remarkable. It suggests investors are looking past immediate headwinds and betting on the economy’s resilience over the long-term.

The still-strong jobs market is a major pillar supporting optimism. The latest weekly unemployment claims data edged slightly higher but remain near historically low levels. That implies employers are hanging onto workers despite growing recession concerns.

However, other corners of the economy are flashing warnings signs. Pending home sales were unchanged in November and languish around their lowest levels since 2001. Mortgage rates above 7% continue to sideline prospective buyers, pointing to sustained housing market weakness into 2024.

While pockets of weakness exist, the overall economic data suggests a soft landing remains possible, though far from guaranteed. The Fed’s efforts to cool demand without crushing it could pay off, setting the stage for a rebound later next year.

That’s the outcome equity investors seem to be betting on during this year-end rally. Risk appetite remains healthy despite the rocky macro backdrop. And with interest rates climbing and bond yields rising, stocks look relatively more attractive, providing support to multiples.

Of course, the flipside is also possible if inflation proves stubborn and forces more aggressive Fed action. Navigating recession risks make for tricky times ahead.

But for now, Wall Street is focused on capping off 2023 with a flourish. The Nasdaq leading the way signals belief in tech and growth stocks’ durability even if rates keep climbing. And sustained equity inflows suggest cash on the sidelines is being put to work.

As long as the economic data doesn’t deteriorate sharply and corporate profits remain resilient, this stock rally could keep running into 2024. But selectivity will be key, with investors wise to favor quality names with healthy balance sheets in case challenging times emerge.

Choppy Waters: S&P 500 Faces Longest Slump Since the 2020 Crash

The S&P 500 is staring down a dubious milestone – its first 3-month losing streak since the COVID-19 pandemic upended markets back in early 2020.

Barring a dramatic turnaround this week, the index will log declines in August, September and October. That hasn’t happened since a brutal 5-month free fall ended in March 2020.

The benchmark index has sunk over 10% from peaks hit in late July. After four straight down weeks, the S&P 500 dipped into correction territory last Friday.

That marks a ten percent drop from all-time highs reached just three months ago in July. However, the index remains up around 8% year-to-date.

The S&P 500, and What It Represents

For context, the S&P 500 represents the broader U.S. stock market across major sectors of the economy. It tracks the stocks of 500 large American companies selected by a committee at S&P Dow Jones Indices.

The index covers around 80% of available market capitalization. Exposure spans mega-cap technology leaders like Apple, Microsoft and Amazon to energy giants like Exxon and Chevron.

The S&P 500 functions as a barometer for the country’s economic health. The performance and reactions within the index drive news cycles and often dictate investor sentiment.

Trillions in assets are benchmarked to the S&P 500. That includes huge passive funds like those offered by Vanguard and BlackRock’s iShares. The index is also a favorite benchmark for active managers trying to beat the market.

Given its stature and ubiquity, sustained declines in the S&P 500 raise investor fears and make headlines. Its ongoing slide has been driven largely by surging inflation, rising interest rates, and recession worries.

History of Late-Year Rebounds

While unpleasant, the S&P 500’s current slump isn’t out of the ordinary from a historical perspective. The index has averaged a 14% peak-to-trough decline in intra-year pullbacks since 1950 according to data from Carson Group’s Ryan Detrick.

And when the index falters during the late summer and early fall months, strong year-end rebounds have usually followed.

In the 5 prior years where August, September and October saw declines, the S&P 500 rose 4.5% on average over November and December. The lone exception was 1957 when it managed a slight loss.

So despite growing skittishness on Wall Street, historical trends bode decently for markets to close 2023 on a high note.

Drivers of the Current Decline

Like most substantial sell-offs, fears of slowing economic growth and a hawkish Federal Reserve have driven the current slide.

Surging inflation led the Fed to rapidly raise interest rates in order to cool down demand. Higher rates pressure different areas of the market like long-duration tech stocks.

Meanwhile, recession odds have climbed as housing and manufacturing data weakened. The strong U.S. dollar has also impacted multinational corporate earnings.

Geopolitical turmoil surrounding Russia’s war in Ukraine coupled with US-China tensions exacerbated volatility. It amounted to a deteriorating backdrop that sent the S&P 500 downhill fast.

Now with consumer prices potentially peaking, Fed rate hikes slowing, and earnings holding up, optimism is regrowing. Valuations also look more attractive after the steep pullback.

Many strategists see the negativity as overdone and expect a rally into year-end. However, tests likely remain until concrete evidence of an inflation or economic slowdown emerge.

S&P 500 Outlook and Implications

While disconcerting on the surface, the S&P 500’s bout of weakness isn’t unprecedented. The question is whether it represents a normal correction or the start of a bear market.

Broadly, analysts think major indices will close out 2023 with mid-single digit gains. But forecasts vary widely from low single digits to returns over 10% above current levels.

If historic trends repeat, odds favor a recovery once the calendar flips to November. Although with midterm elections ahead, politics could play an outsized role in market swings.

Regardless, the S&P 500 ending its 3-month rut would be welcomed by investors. Sustained declines often signal greater worries about the economy and corporate profits.

Given the importance of consumer and business confidence, ending 2023 on an upswing would bode well for preventing a deeper downturn. But the Fed’s moves to squash inflation will remain an overhang into 2024.

What Happens to Your Stock Holding When it is Added to a Major Index?

Index Inclusion or Deletion Can Send Shockwaves Through Stocks

With the massive amount of assets in mutual funds and exchange-traded funds (ETFs) that are geared to return the same performance as a major index, there’s been a lot of investor focus on the addition and subtraction of stocks from indexes, especially the widely followed, S&P 500, Nasdaq, Russell, and Dow Industrials. This is because many institutional investors attempt to mirror the performance of these indexes by buying the same stocks. Some funds are even required by their charter or offering prospectus to hold the same stocks. This produces “unnatural” price movements in companies as they are moved in or out of an index. Self-directed investors, not beholden to a set of investing rules, may find opportunities by recognizing, then positioning themselves before institutions are required to buy or sell a company name.

Rebalancing of the most followed indices is a reality for individual investors, so it’s good to understand the timing and dynamics, and valuing a stock based on what stock index it may be in.

Dynamics

When a stock is added to a broad index, millions or billions of investment dollars flow into that stock, typically driving its price higher. And the reverse is also true; when a stock is removed from an index, it’s often sold by fund managers, which decreases demand and causes its price to weaken. There are conflicting studies that in some cases, indicate the added strength by inclusion is short-lived, and others that indicate that the stock begins to trade with an emphasis on whether or not money is flowing into the index it is included in, or out. All studies agree that there is typically an initial change in the stock’s valuation.    


Timing

When a stock is added to a major index, as will happen with the Russell 3000, Russell 2000, and Russell 1000 on June 27,  it has historically had positive effects on its trading demand, this has impacted its price. As the Russell will reshuffle, or in their jargon “reconstitute” its indexes this month (June) let’s use the Russell 2000, which captures the performance of approximately 2,000 small-cap stocks in the United States. Here are the potential impacts of a stock being added to the index:

Price impact is what concerns investors most. The announcement of a stocks addition to an index can lead to a price impact. This is because investors who track the index may need to purchase the stock to align their portfolios with the index composition. The increased demand can push the stock’s price higher.

It could also lead to investor recognition or Increased Visibility. Inclusion in a major index can come with increased visibility and recognition for a company. This can attract the attention of investors, including index funds, mutual funds, and other institutional investors who track or invest in the index. As a result, the stock may experience increased trading volume and better liquidity.

Institutional buying may increase. Index funds and other institutional investors that track the Russell 2000 (or other indices) may need to purchase the stock to replicate the index’s performance. This can lead to increased buying pressure from these large investors, potentially driving the stock’s price higher.

A nod by an index can bring overall positive sentiment. Being added to a major index can create a positive sentiment around a stock, signaling that the company is growing and gaining prominence. This positive sentiment may attract additional investors who believe the stock’s inclusion in the index validates its prospects, potentially leading to further price appreciation.

Trading Activity usually escalates with inclusion. Inclusion in the Russell 2000 can result in increased trading activity as the stock becomes part of a widely tracked benchmark. More market participants are likely to trade the stock, increasing its overall trading volume.

When Are the Other (Non-Russell) Indexes Rebalanced?

While the FTSE Russell has a strict and easily understood set of rules and guidelines that make it easy to understand, the S&P, Dow, and Nasdaq also rebalance under their own timeline.

The S&P 500 is reviewed and rebalanced on a quarterly basis. During these reviews, S&P Dow Jones Indices assess the constituents of the index and consider changes based on the selection criteria and market developments. They don’t follow hard and strict rules.

The Nasdaq 100 is a market-capitalization-weighted index that includes 100 of the largest non-financial companies listed on the Nasdaq stock market. The index is maintained by Nasdaq, and its rebalancing process involves an annual evaluation to determne eligibility, and potential rebalancing.

The annual evaluation involves Nasdaq reviewing the composition of the Nasdaq 100, this typically occurs in December. During this evaluation, companies are assessed based on their market capitalization, liquidity, and other factors. The top 100 eligible companies by market capitalization become or remain constituents of the index. They must be traded n the Nasdaq exchange.

Eligibility for companies is determined by their meeting certain criteria to allow inclusion in the Nasdaq 100. These include being listed on the Nasdaq Global Select Market, having a minimum average daily trading volume, and meeting liquidity requirements.

If rebalancing is necessary, Nasdaq conducts this during an annual rebalancing in December. Companies that no longer meet the eligibility criteria may be removed, and new companies that meet the criteria may be added. The weightings of the index constituents may also be adjusted based on their market caps.

The Dow 30, also known as the Dow Jones Industrial Average (DJIA), is a price-weighted index that represents the performance of 30 large, publicly traded companies in the United States. The index is maintained by S&P Dow Jones Indices, and its rebalancing process is different from market-capitalization-weighted indices like the S&P 500 or Nasdaq 100. It includes price weighting and selective changes.

Price-weighted for the Dow 30 index is based on the stock prices of its constituents rather than their market capitalizations. The impact investors should be aware of is that higher-priced stocks have a larger impact on the index’s movements.

Selective changes is best defined knowing the Dow 30 does not undergo regular rebalancing like other indices. Instead, changes in the index composition are infrequent and typically occur when a constituent company experiences a significant corporate action, such as a merger, acquisition, or bankruptcy. When such changes occur, the index committee at S&P Dow Jones Indices makes a decision to replace the affected company with another suitable candidate.

It’s important to note that the impact of being added to an index can vary depending on factors such as the stock’s size, liquidity, and investor sentiment. Additionally, market conditions and investor behavior can influence the stock’s performance. Therefore, while inclusion in a major index can have positive effects, it doesn’t guarantee a specific outcome for the stock’s price. And being removed from an index may only create potential.

Take Away

There is activity surrounding stocks as they are added or deleted from a major market index. Investors should be aware of when the index is being reconstituted or altered, so they may either benefit, stand clear, or be sure that they are not in harms way. The Russell indexes will be reconstituted at the close of the last Friday of this month (June).

Paul Hoffman

Managing Editor, Channelchek

https://www.ftserussell.com/