A fresh reading on inflation in July has left the Federal Reserve facing a difficult policy choice: act quickly to support a cooling labor market or hold steady to ensure inflation returns to target. Core Consumer Price Index (CPI), which strips out food and energy, rose 3.1% year over year in July — above economists’ 3.0% forecast and up from 2.9% in June. On a monthly basis, core CPI increased 0.3%, matching expectations. Headline CPI rose 2.7% year over year, a touch below the 2.8% consensus.
The mixed picture — a slightly softer headline print but hotter core inflation — complicates the Fed’s September decision. Markets, however, have already swung toward loosening: futures traders are pricing in roughly a 92% chance of a 25-basis-point cut in September. That reflects growing concern about recent labor-market weakness and the potential political impetus for easing.
Employment data released earlier this month deepened that concern. The U.S. added only 73,000 jobs in July, the unemployment rate edged up to 4.2%, and May and June payrolls were revised sharply lower by a combined 258,000. The three-month average for job growth is now about 35,000 — a pace many economists view as consistent with a significant cooling in hiring. Those revisions have amplified calls from some quarters of the Fed to move sooner on rate cuts to cushion the labor market.
At the same time, services inflation, the historically stickier component of the CPI, moved higher in July after moderating earlier in the year. Certain goods categories such as furniture and footwear also showed renewed upward pressure. Because core CPI and core PCE (the Fed’s preferred gauge) tend to move together, the stronger core CPI reading raises the risk that core PCE will also show another above-target reading in coming reports, analysts say.
Policy makers at the Fed remain divided. Several regional presidents and officials have emphasized caution, arguing that elevated inflation — still more than a full percentage point above the Fed’s 2% goal on a core basis — counsels patience. Others have pointed to the softening employment trend as a compelling reason to begin easing policy soon. That split was evident in recent public remarks from Fed officials, who ranged from urging a patient approach to signaling readiness to cut if labor-market deterioration continues.
The White House has also weighed in, increasing political pressure on the Fed to move. That intervention adds another dimension to an already fraught decision, though policymakers stress their commitment to independence and data-driven decisions.
Looking ahead, the Fed will watch August inflation components closely along with incoming employment and consumer spending data. If services inflation continues to run hot, the case for holding rates rises; if job growth further weakens and labor-market indicators soften, arguments for a September cut will strengthen.
For now, the July CPI leaves the Fed between two difficult paths: risk undermining the inflation fight by cutting too soon, or risk further labor-market deterioration by waiting. The choice in September will hinge on the next tranche of inflation and jobs data — and on how policymakers weigh those competing risks.
The housing and stock markets received a welcome boost this week as Federal Reserve Chair Jerome Powell reinforced expectations for interest rate cuts later this year. In his semi-annual monetary policy testimony to Congress, Powell acknowledged that recent data shows inflation is moderating, paving the way for potential rate reductions in 2024.
For homebuyers and prospective sellers who have grappled with soaring mortgage rates over the past year, Powell’s remarks offer a glimmer of hope. Mortgage rates, which are closely tied to the Fed’s benchmark rate, have retreated from their recent highs, dipping below 7% for the first time since mid-February.
According to Mortgage News Daily, the average rate for a 30-year fixed-rate mortgage settled at 6.92% on Thursday, while Freddie Mac reported a weekly average of 6.88% for the same loan term. This marks the first contraction in over a month and a significant improvement from the peak of around 7.3% reached in late 2023.
The moderation in mortgage rates has already begun to revive homebuyer demand, as evidenced by a nearly 10% week-over-week increase in mortgage applications. The Mortgage Bankers Association (MBA) noted that the indicator measuring home purchase applications rose 11%, underscoring the sensitivity of first-time and entry-level homebuyers to even modest rate changes.
“Mortgage applications were up considerably relative to the prior week, which included the President’s Day holiday. Of note, purchase volume — particularly for FHA loans — was up strongly, again showing how sensitive the first-time homebuyer segment is to relatively small changes in the direction of rates,” said Mike Fratantoni, MBA’s chief economist.
This renewed interest from buyers coincides with a much-needed increase in housing inventory. According to Realtor.com, active home listings grew 14.8% year-over-year in February, the fourth consecutive month of annual gains. Crucially, the share of affordable homes priced between $200,000 and $350,000 increased by nearly 21% compared to last year, potentially opening doors for many previously priced-out buyers.
The stock market has also responded positively to Powell’s testimony, interpreting his comments as a reassurance that the central bank remains committed to taming inflation without derailing the economy. Despite a hotter-than-expected inflation report in January, Powell reiterated that rate cuts are likely at some point in 2024, provided that price pressures continue to subside.
Investors cheered this stance, propelling the S&P 500 to new record highs on Thursday. The benchmark index gained nearly 1%, while the tech-heavy Nasdaq Composite surged 1.4%, underscoring the market’s preference for a more dovish monetary policy stance.
However, Powell cautioned that the timing and magnitude of rate cuts remain uncertain, as the Fed seeks to strike a delicate balance between containing inflation and supporting economic growth. “Pinpointing the optimal timing for such a shift has been a challenge,” said Jiayi Xu, Realtor.com’s economist. “Specifically, the risk of a dangerous inflation rebound is looming if rate cuts are made ‘too soon or too much.'”
This ambiguity has contributed to ongoing volatility in both the housing and stock markets, as market participants attempt to gauge the Fed’s next moves. While the prospect of rate cuts has provided relief, concerns remain that the central bank may need to maintain a more hawkish stance if inflationary pressures prove more stubborn than anticipated.
Nevertheless, Powell’s remarks have injected a sense of optimism into the markets, at least temporarily. For homebuyers, the potential for lower mortgage rates could translate to increased affordability and a more favorable environment for purchasing a home. Meanwhile, investors have embraced the possibility of a less aggressive monetary policy stance, driving stocks higher in anticipation of a potential economic soft landing.
As the data continues to unfold, both the housing and stock markets will closely monitor the Fed’s actions and rhetoric. While challenges persist, Powell’s testimony has offered a glimpse of light at the end of the tunnel, reigniting hopes for a more balanced and sustainable economic landscape in the months ahead.
The latest inflation data released Tuesday shows consumer prices rose more than expected in January, defying forecasts for a faster slowdown. The Consumer Price Index (CPI) increased 0.3% over December and rose 3.1% over the last year, down slightly from December’s 3.4% pace but above economist predictions.
Core inflation, which excludes volatile food and energy costs, also came in hotter than anticipated at 0.4% month-over-month and 3.9% annually. Shelter prices were a major contributor, with the shelter index climbing 0.6% in January, accounting for over two-thirds of the overall monthly increase. On an annual basis, shelter costs rose 6%.
While used car and energy prices fell, persistent strength in housing and services indicates inflation remains entrenched in the economy. This could complicate the Federal Reserve’s plans to pivot to rate cuts this year after aggressively raising interest rates in 2023 to combat inflation.
Markets are currently pricing in potential Fed rate cuts beginning as early as May, with around five quarter-point decreases projected through end of 2024. However, Tuesday’s inflation data casts doubt on an imminent policy shift. Many Fed officials have signaled a more gradual approach, with only two or three cuts likely this year.
The hotter CPI print pushed stocks sharply lower in early trading, with the Dow Jones Industrial Average falling over 250 points. Meanwhile, Treasury yields surged higher on expectations for sustained Fed tightening.
Inflation-adjusted wages also fell 0.3% month-over-month when factoring in a decline in average workweek hours. While inflation may be peaking, price increases continue to erode household purchasing power.
Shelter costs present a tricky situation for policymakers. Rental and housing inflation tend to lag other price moves, meaning further gains are likely even if overall inflation slows. And shelter carries significant weighting in the Fed’s preferred core PCE index.
While annual PCE inflation has fallen below 4%, the six-month annualized rate remains near the Fed’s 2% target. Tuesday’s data provides a reality check that the battle against inflation is not yet won.
To tame housing inflation, the Fed may have to accept some economic pain in the form of job losses and supply chain stress. So far, the resilience of the labor market and strong consumer demand has kept the economy humming along.
But the cumulative impact of 2023’s aggressive tightening is still working its way through the economy. Eventually, restrictive policy normally triggers a recession as demand falls and unemployment rises.
The Fed is walking a tightrope, trying to curb price increases without severely damaging growth. But persistent inflationary pressures leave little room for a swift policy reversal.
Rate cuts later this year are still possible, but will depend on compelling evidence that core inflation is on a sustainable downward path toward the Fed’s 2% goal. Until shelter and services costs normalize, additional rate hikes can’t be ruled out.
Markets cling to hopes that falling goods prices and easing supply chain strains will open the door for Fed easing. But policymakers remain laser-focused on services inflation, particularly in housing.
Overall, the January inflation data signals the Fed’s inflation fight is far from over. While markets may yearn for rate cuts, persistent price pressures suggest a longer road ahead before policy can substantively turn dovish.
The Labor Department’s December jobs report reveals continued strength in the U.S. economy that defies expectations of an imminent slowdown. Employers added 216,000 jobs last month, handily beating estimates of 170,000. The unemployment rate remained low at 3.7%, contrary to projections of a slight uptick.
This hiring surge indicates the labor market remains remarkably resilient, even as the Federal Reserve wages an aggressive battle against inflation through substantial interest rate hikes. While many anticipated slowing job growth at this stage of the economic cycle, employers continue adding workers at a solid clip.
Several sectors powered December’s payroll gains. Government employment rose by 52,000, likely reflecting hiring for the 2024 Census. Healthcare added 38,000 jobs across ambulatory care services and hospitals, showing ongoing demand for medical services. Leisure and hospitality contributed 40,000 roles, buoyed by Americans’ continued willingness to dine out and travel.
Notable gains also emerged in social assistance (+21,000), construction (+17,000), and retail (+17,000), demonstrating broad-based labor market vitality. Transportation and warehousing shed 23,000 jobs, a rare weak spot amid widespread hiring.
Just as importantly, wage growth remains elevated, with average hourly earnings rising 0.4% over November and 4.1% year-over-year. This exceeds projections, signaling ongoing inflationary pressures in the job market as employers compete for talent. It also challenges hopes that wage growth would start moderating.
Financial markets reacted negatively to the jobs data, with stock index futures declining sharply and Treasury yields spiking. The strong hiring and wage numbers dampen expectations for the Fed to begin cutting interest rates in the first half of 2023. Traders now see reduced odds of a rate cut at the March policy meeting.
This report paints a picture of an economy that is far from running out of steam. Despite the steepest interest rate hikes since the early 1980s, businesses continue adding jobs at a healthy pace. Consumers keep spending as well, with holiday retail sales estimated to have hit record highs.
Meanwhile, GDP growth looks solid, inflation has clearly peaked, and the long-feared recession has yet to materialize. Yet the Fed’s priority is returning inflation to its 2% target. With the job market still hot, the path to lower rates now appears more arduous than markets anticipated.
The data supports the notion that additional rate hikes may be necessary to cool economic activity and tame inflation. However, the Fed also wants to avoid triggering a recession through overtightening, making its policy stance a delicate balancing act.
For most of 2023, the central bank enacted a series of unusually large 0.75 percentage point rate increases. But it downshifted to a 0.5 point hike in December, and markets once priced in rate cuts starting as early as March 2024. This jobs report challenges that relatively dovish stance.
While inflation is clearly off its summertime highs, it remains well above the Fed’s comfort zone. Particularly concerning is the continued strong wage growth, which could fuel further inflation. Businesses will likely need to pull back on hiring before the wage picture shifts significantly.
Despite market hopes for imminent rate cuts, the Fed has consistently stressed the need to keep rates elevated for some time to ensure inflation is well and truly tamed. This data backs up the central bank’s more hawkish messaging in recent weeks.
The strong December jobs numbers reinforce the idea that the economy enters 2024 on solid ground, though facing uncertainties and challenges on the path ahead. With inflation still lingering and the full impacts of rising interest rates yet to be felt, the road back to normalcy remains long.
For policymakers, the report highlights the delicate balancing act between containing prices and maintaining growth. Cooling the still-hot labor market without triggering a downturn will require skillful and strategic policy adjustments informed by data like this jobs report.
While markets may hope for a swift policy pivot, the Fed is likely to stay the course until inflation undeniably approaches its 2% goal on a sustained basis. That day appears further off after this robust jobs data, meaning businesses and consumers should prepare for more rate hikes ahead.
After two years of aggressive rate hikes to combat inflation, the Federal Reserve is on the cusp of a significant policy shift. This Wednesday’s meeting marks a turning point, with a pause on rate increases and a focus on what lies ahead. While the immediate decision is anticipated, the subtle nuances of the Fed’s statement, economic projections, and Chair Powell’s press conference hold the key to understanding the future trajectory of monetary policy.
A Pause in the Rate Hike Cycle:
The Federal Open Market Committee (FOMC) is virtually certain to hold the benchmark overnight borrowing rate steady at a range of 5.25% to 5.5%. This decision reflects the Fed’s recognition of the recent slowdown in inflation, as evidenced by Tuesday’s Consumer Price Index report showing core inflation at a 4% annual rate. The aggressive rate hikes have had their intended effect, and the Fed is now in a position to assess the impact and determine the next course of action.
Shifting Narrative: From Hiking to Cutting?
While the pause is a significant development, the Fed’s communication will provide further insights into their future plans. Economists anticipate subtle changes in the post-meeting statement, such as dropping the reference to “additional policy firming” and focusing on achieving the 2% inflation target. These changes would signal a shift in the narrative from focusing on rate hikes to considering potential cuts in the future.
The closely watched dot plot, which reflects individual members’ expectations for future interest rates, will also be scrutinized. The removal of the previously indicated rate increase for this year is expected, but the market’s anticipation of rate cuts starting in May 2024 might be perceived as overly aggressive. Most economists believe the Fed will take a more cautious approach, with cuts likely to materialize in the second half of 2024 or later.
Economic Outlook and the Real Rate:
Alongside the policy decision, the Fed will update its projections for economic growth, inflation, and unemployment. While significant changes are not anticipated, these projections will provide valuable information about the current state of the economy and the Fed’s expectations for the future.
The real rate, or the difference between the fed funds rate and inflation, is also a key factor in the Fed’s deliberations. Currently, the real rate stands at 1.8%, significantly above the neutral rate of 0.5%. This high real rate is considered restrictive, meaning it is slowing down economic activity. Chair Powell’s comments will be closely watched for any hints about how the Fed might balance the need to control inflation with the potential for slowing economic growth.
Powell’s Press Conference: Clues for the Future:
The press conference following the meeting will be the most anticipated event of the week. Chair Powell’s remarks will be analyzed for any clues about the Fed’s future plans. While Powell is likely to remain cautious, his comments could provide valuable insights into the Fed’s thinking and their views on the economic outlook.
Markets are eagerly anticipating any indication of a dovish pivot, which could lead to a further surge in equity prices. However, Powell may also address concerns about the recent loosening of financial conditions, emphasizing the Fed’s commitment to achieving their inflation target. Striking a balance between these competing concerns will be a major challenge for Powell and the FOMC.
Looking Ahead: A Cautious Path Forward
The Federal Reserve’s Wednesday meeting marks a significant turning point in their fight against inflation. While the immediate pause in rate hikes is expected, the future trajectory of monetary policy remains uncertain. The Fed will closely monitor the economic data and adjust their policy as needed. The coming months are likely to be characterized by careful consideration and cautious action as the Fed navigates the complex task of balancing inflation control with economic growth.
This article has highlighted the key details of the upcoming Fed meeting and its potential impact on the economy and financial markets. By understanding the nuances of the Fed’s communication and the challenges they face, we can gain a deeper understanding of the future of monetary policy and its implications for businesses, consumers, and investors alike.
Major stock indexes posted modest gains Friday, but new data reflects growing unease among consumers about the state of the U.S. economy.
The University of Michigan’s preliminary November reading on consumer sentiment fell to 60.4, below economist expectations and the lowest level since May. This marked the fourth straight monthly decline for the index, highlighting continued erosion in economic optimism.
“Consumers cited high interest rates and ongoing wars in Gaza and Ukraine as factors weighing on the economic outlook,” said Joanne Hsu, director of Surveys of Consumers.
Inflation expectations also edged up to 3.2% over the next five years, levels not seen since 2011. This suggests the Federal Reserve still has work to do in getting inflation under control after aggressive interest rate hikes this year.
Earlier this week, Fed Chair Jerome Powell reiterated that further rate increases may be necessary to keep inflation on a sustainable downward trajectory. Other Fed officials echoed Powell’s sentiments that policy may need to become even more restrictive to tame inflationary pressures.
For investors, the deteriorating consumer outlook and stubborn inflation signal more churn ahead for markets after October’s volatile swings. While stocks have rebounded from last month’s lows, lingering economic concerns could spur renewed volatility ahead.
This uncertain environment calls for careful navigation by investors. Maintaining discipline and focusing on quality will be key to weathering potential market swings.
With slower growth on the horizon, investors should emphasize companies with strong fundamentals, steady earnings and lower debt levels. Searching for value opportunities and dividend payers can also pay off as markets turn choppy.
Diversification remains critical to mitigate risk. Ensuring portfolios are balanced across asset classes, market caps, sectors and geographies can smooth out volatility when conditions invariably shift. Regular rebalancing to bring allocations back in line with targets is prudent as well.
Staying invested for the long haul is important too. Bailing out of the market can backfire if it recovers and gains are missed. A buy-and-hold approach with a multi-year time horizon allows compounding to work its magic.
Of course, maintaining some dry powder in cash provides flexibility to scoop up bargains if stocks retreat again. Dollar-cost averaging into new positions can limit downside risk.
Above all, patience and discipline will serve investors well in navigating uncertainty. Sticking to a plan and avoiding emotional reactions to market swings can help anchor portfolios for the long run.
While the path ahead may be bumpy, historic market performance shows long-term returns can overcome short-term volatility. Bear markets eventually give way to new bulls. Maintaining perspective and focusing on the horizon can guide investors through uncertain times.
Of course, there are no guarantees in investing. Stocks could see more declines before recovery takes hold. But diversification, quality tilt and balanced allocations can help smooth out the ride.
And investors with long time horizons can actually take advantage of market dips. Regular investing through 401(k)s means buying more shares when prices are depressed, which will pay off handsomely when markets rebound.
The key is tuning out the noise and sticking to smart principles: diversify, rebalance, emphasize quality, maintain perspective and stay the course. This disciplined approach can serve investors well in volatile times.
Though the path forward may remain bumpy, patient investors focused on the long view stand to be rewarded in time.
Federal Reserve Chair Jerome Powell doused investor hopes of a near-term pause in interest rate hikes, stating “we are not confident that we have achieved such a stance” that would allow inflation to drift down towards the Fed’s 2% target.
In remarks at an International Monetary Fund event, Powell said bringing inflation sustainably down to 2% still has “a long way to go”. His tone cast serious doubt on market expectations that the Fed is almost done raising rates in this cycle.
Traders have priced in a greater than 90% chance of just a 25 basis point December hike, followed by rate cuts commencing in mid-2023. But Powell stressed the Fed stands ready to tighten policy further if economic conditions warrant.
Powell acknowledged recent positive developments, including moderating inflation readings, strong GDP growth, and improvements in supply chains. However, he noted it is unclear how much more progress supply-side factors can drive.
That puts the onus on the Fed to ensure slowing demand prevents inflation from reaccelerating. Powell made clear the Fed will stay the course, even if that means defying market hopes for a dovish pivot.
How High Could Rates Go?
Markets are currently priced for Fed Funds to peak under 5% after a quarter point December increase. But Powell’s insistence on not letting up prematurely raises the specter of a higher terminal rate.
Powell was adamant the Fed cannot be swayed by a few months of data, given the fickle nature of inflation. Premature rate cuts could allow inflation to become re-entrenched, requiring even more aggressive hikes down the road.
With Powell determined to avoid that scenario, investors may need to brace for interest rates cresting above current expectations before the Fed finally stops tightening.
Growth and Jobs Still Too Hot?
Behind Powell’s hawkish messaging is a still-hot economy that could be fueling inflation pressures beneath the surface. The U.S. unemployment rate remains near 50-year lows at 3.7%, with job openings still far exceeding available workers.
Meanwhile, GDP growth rebounded to a strong 2.6% rate in the third quarter, defying recession predictions. Consumer spending has remained remarkably resilient as well.
Powell recognizes the Fed may need to cool economic activity more meaningfully to align demand with constrained supply. That explains his lack of confidence on inflation without further rate increases.
Powell succeeded in resetting market assumptions, making clear the Fed has no intentions of reversing course anytime soon just because inflation has shown initial signs of improvement.
Until policymakers have high confidence lasting 2% inflation is in sight, Powell indicated the Fed’s tightening campaign will continue. That may disappoint stock and bond investors banking on rate cuts next year, but fighting inflation remains Powell’s top priority.
With the Fed Chair throwing cold water on pivot hopes, markets will likely undergo a reassessment of just how high the Fed may yet raise rates. Powell’s tone hints investors should brace for more tightening ahead, even if that delays the desired easing cycle.
Is the Federal Reserve’s monetary policy losing out to inflationary pressures? While supply chain costs have long been taken out of the inflation forecast, demand pressures have been stronger than hoped for by the Fed. One area of demand is the labor markets. While the Federal Reserve has a dual mandate to keep prices stable and maximize employment, the shortage of workers is adding to demand-pull inflation as wages are a large input cost in a service economy. As employment remains strong, they have room to raise rates, but if strong employment is a significant cause of price pressures, they may decide to keep the increases coming.
Background
The number of new jobs unfilled increased last month as US job openings rose unexpectedly in April. The total job openings stood at 10.1 million. Make no mistake, the members of the Fed trying to steer this huge economic ship would like to see everyone working. However, with the Bureau of Labor Statistics (BLS) reporting “unemployed persons” at 5.7 million in April as compared to 10.1 million job openings, creates far more demand than there are people to fill the positions. Those with the right skills will find their worth has climbed as they get bid up by employers that are still financially better off hiring more expensive talent rather than doing without.
This causes wage inflation as these increased business costs work their way down into the final cost of goods and services we consume, as inflation.
Where We’re At
The 10.1 million job openings employers posted is an increase from the 9.7 million in the prior month. It is also the most since January 2023. In contrast, economists had expected vacancies to slip below 9.5 million. The increase and big miss by economists’ forecasting increases in job opportunities is a clear sign of strength in the nation’s labor market. This complicates Chair Jerome Powell’s position, along with other Fed members.
It isn’t popular to try to crush demand for new employees, but rising consumer costs at more than twice the Fed’s target will be viewed as too much.
The Fed says that it is data driven, this data is unsettling for those hoping for a pause or pivot.
The Investment Climate
These numbers and other strong economic numbers that were reported in April, create some uncertainty for investors as most would prefer to see the Fed stimulating rather than tightening conditions.
But the market has been resilient, despite the Feds’ resolve. The Fed has raised its benchmark interest rate ten times in the last 14 months. Yet jobs remain unfilled, and the stock market has gained quite a bit of ground in 2023. The concern has been that the Fed may overdo it and cause a recession. While even the Fed Chair admitted this is a risk he is willing to take, he also added that it is easier to start a stalled economy than it is to reel one in and the inflation that goes along with expansion.
So the strong labor market (along with other recent data releases) provides room for the Fed to tighten as there are still nearly two jobs for every job seeker. Additional tightening will eventually have the effect of simmering inflation to a more tolerable temperature. If the Fed overdoes it on the brake pedal, according to Powell, he knows where the gas pedal is.
Washington DC Law Firm that Won Operation Choke Hold Suit, Gives Congress Advice
Are private digital assets, under unlawful attack by regulators? Sounds conspiratorial, but a D.C. law firm that successfully sued the FDIC, Federal Reserve, and Office of the Controller of the Currency (OCC), says they are doing just that. The firm Cooper & Kirk, won a large lawsuit dubbed against the agencies for their part in, “Operation Choke Point.” That was a decade ago, the law firm now claims they have uncovered a coordinated campaign by bank regulators to drive crypto out of the U.S. financial system.
The new “Operation Choke Point 2.0,” according to the firms website, “have published informal guidance documents that single out cryptocurrency and cryptocurrency customers as a risk to the banking system.” According to an informational paper published by the D.C. firm, “businesses in the cryptocurrency marketplace are losing their bank accounts, or their access to the ACH network, suddenly, and with no explanation from their bankers, the paper continued, “the owners and employees of cryptocurrency firms are even having their personal accounts closed without explanation.”
As an example of could be viewed as overstepping their charters, the firm pointed out that, “over the past two weeks, federal regulators have shut down a solvent bank that was known to be serving the crypto industry and, although it is required to resolve banks through the “least cost resolution” to the Deposit Insurance Fund, the FDIC chose to shutter rather than sell the part of the bank that serves digital asset customers, costing the Fund billions of dollars.” The overall theme of the 37 page paper is that the targeting of certain businesses is going on to force them out of existence.
Depriving businesses of their constitutional right to due process. This is a fifth amendment right that says that an entity tagging another with a derogatory label that causes injury (like lose bank accounts) The firm accuses that this is what the regulators have done by “labeling crypto a threat to the financial system.”
Violating both the non-delegation and anticommandeering doctrine by, “depriving Americans of Key Structural constitutional protections against the arbitrary exercise of government power.”
Refusing to perform their non-discretionary duties “when doing so will benefit the cryptocurrency industry.”
Evading rules that require periods of notice and comment of the rulemaking requirements of the administrative procedure act. It claims circumventing this is, “undemocratic.”
Acting in an arbitrary and capricious fashion by avoiding explaining underlying rules for their decisions. “It is difficult to imagine a more arbitrary and capricious agency action that simultaneously placing a solvent bank into receivership solely because it provided financial services to the cypto industry, while permitting insolvent institutions not tied to the crypto industry to continue operations.”
What is the Law Firms Stated Intent
Cooper and Kirk urge the U.S. Congress to perform its role and hold the agencies accountable. The firm urges the Congress to ask for all communications records related to these matters from the regulators.
The firm also would like for them to explain the basis for their conclusion that safety and soundness of the banking system requires the banking system be insulated from crypto. They would also like for it to be made clear to the agencies that the comment period of the Administrative procedure act is mandatory. It wanst an investigation into why Signature Bank was closed.
The last stated hope is fro Congress to investigate whether bank regulators are working to squelch innovation from the private sector in order to clear out competition for the benefit of existing regulated banks and a new federal crypto asset.
Take Away
Just like the first Operation Choke Point was targeting specific players, the new version does the same. The law firms stops short of any threats in their open paper, but it makes clear that the firm has solid experience achieving compliance if these maters.
Investors Receiving a 5% Yield are Losing to Inflation
The CPI inflation report and the Fed’s relentless increases in Fed funds levels have pushed the six-month US Treasury Bill (T-Bill) above 5%. This is the first time since 2007 that this low-risk investment has topped 5%. Last year on this date, the six-month T-Bill was 0.76%. While the stock market is concerned that higher borrowing costs will have the Fed’s intended effect of slowing demand, rates are reaching a point where another concern creeps in. The concern is will traditional stock investors lay back and be satisfied getting paid interest.
More likely, the high cash position represents “dry powder” waiting for an opportunity.
Short Term Rates
Money Market fund assets were $4.81 trillion for the week ended Wednesday, February 8, according to the Investment Company Institute. Just shy of the record MF balances reported in January. Higher than average cash levels have often been thought of as a bullish sign as it represents potential to drive stock prices up when flows toward equities increase.
This may be part of the situation as we come off a dismal 2022 for equities, but there is likely something else incentivizing the retreat to safety. The higher interest rates are in the short end of the curve, investors are getting paid to retreat. High-yielding cash equivalents with six-month T-Bills now at 5% (10-year Treasuries are only 3.75%) may be more than a parking place. It may represent an alternative investment with a much more assured return.
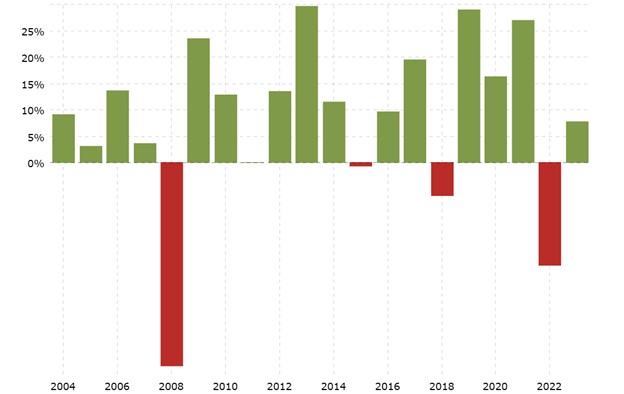
With inflation at 6.4%, the answer is no. But it is definitely preferable to seven of the periods on the 10-year chart above. And with January’s consumer price index (CPI) report revealing signs of sticky to reaccelerating inflation, the Federal Reserve is more likely to be hiking rates for longer than expected.
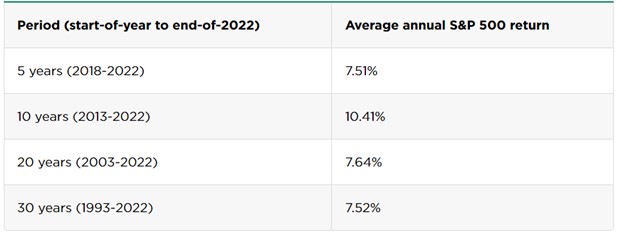
For investors looking to invest for longer periods, the stock market handily beats inflation. In other words, for the various time frames below, S&P 500 investors did not see their assets erode due to inflation.
Beating inflation is foundational to investing. Far exceeding it is the goal of many. Investors are not doing this choosing cash, in fact they are choosing to lose buying power rather than risk that the market doesn’t perform as it has historically.
Data released on Tuesday February 14 showed the inflation rate (CPI) slowed to 6.4% in January. The cost of goods and services rose 0.5% during the month. The half percentage is the largest one month erosion of purchasing power in three months.
Investors content with 4%-5% returns should consider that they are losing ground to persistent inflation.
Investors with a five-year time horizon or longer should weigh the risks of earning yields below the inflation rate to the ups and downs of stocks. In fact, as more do, the 4-5 trillion in cash can make or quite a bull market.
The health of the US Treasury market impacts almost all other markets. This is because the “risk-free” market (US Treasuries) and its relationship to the US dollar is the foundation from which other markets stand. If it is in trouble, all markets suffer. The “health” measure most associated with securities like treasuries is liquidity or whether money can be raised when needed. Other measures include market spread between the bid and the ask, trading activity levels, and price impact or how a large transaction impacts the price.
A just released report by New York Fed economists Michael Fleming and Claire Nelson discuss the current state of the U.S. Treasury markets from the unique point of view and access to information of the New York Fed.
The report follows:
How Liquid Has the Treasury Market Been in 2022?
Policymakers and market participants are closely watching liquidity conditions in the U.S. Treasury securities market. Such conditions matter because liquidity is crucial to the many important uses of Treasury securities in financial markets. But just how liquid has the market been and how unusual is the liquidity given the higher-than-usual volatility? In this post, we assess the recent evolution of Treasury market liquidity and its relationship with price volatility and find that while the market has been less liquid in 2022, it has not been unusually illiquid after accounting for the high level of volatility.
Why Liquidity Matters
The U.S. Treasury securities market is the largest and most liquid government securities market in the world. Treasury securities are used to finance the U.S. government, to manage interest rate risk, as a risk-free benchmark for pricing other financial instruments, and by the Federal Reserve in implementing monetary policy. Having a liquid market is important for all these purposes and thus of great interest to market participants and policymakers alike.
Measuring Liquidity
Liquidity typically refers to the cost of quickly converting an asset into cash (or vice versa) and is measured in a variety of ways. We consider three commonly used measures, calculated using high-frequency data from the interdealer market: bid-ask spreads, order book depth, and price impact. The measures are for the most recently auctioned
(on-the-run) two-, five-, and ten-year notes (the three most actively traded Treasury securities, as shown in this post) and are calculated for New York trading hours (defined as 7 a.m. to 5 p.m.). Our data source is BrokerTec, which is estimated to account for 80 percent of trading in the electronic interdealer broker market.
The Market Has Been Relatively Illiquid in 2022
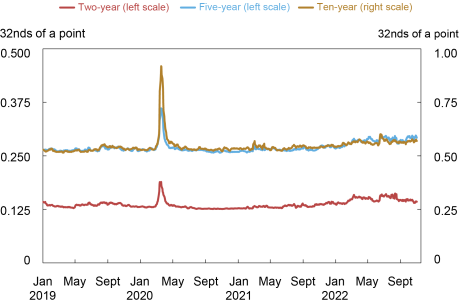
The bid-ask spread—the difference between the lowest ask price and the highest bid price for a security—is one of the most popular liquidity measures. As shown in the chart below, bid-ask spreads have widened out in 2022, but have remained well below the levels observed during the COVID-related disruptions of March 2020 (examined in this post). The widening has been somewhat greater for the two-year note relative to its average and relative to its level in March 2020.
Bid-Ask Spreads Have Widened Modestly
Liberty Street Economics chart plots the five-day moving averages of average daily bid-ask spreads for the two-, five-, and ten-year notes in the interdealer market from January 2, 2019, to October 31, 2022.
Source: Authors’ calculations, based on data from BrokerTec.
Notes: The chart plots five-day moving averages of average daily bid-ask spreads for the on-the-run two-, five-, and ten-year notes in the interdealer market from January 2, 2019, to October 31, 2022. Spreads are measured in 32nds of a point, where a point equals one percent of par.
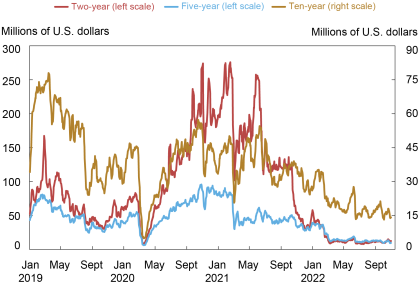
The next chart plots order book depth, measured as the average quantity of securities available for sale or purchase at the best bid and offer prices. Depth levels again point to relatively poor liquidity in 2022, but with the differences across securities more striking. Depth in the two-year note has been at levels commensurate with those of March 2020, whereas depth in the five-year note has remained somewhat higher—and depth in the ten-year note appreciably higher—than the levels of March 2020.
Order Book Depth Lowest since March 2020
Liberty Street Economics chart plots five-day moving averages of average daily depth for the two-, five-, and ten-year notes in the interdealer market from January 2, 2019, to October 31, 2022.
Source: Authors’ calculations, based on data from BrokerTec.
Notes: The chart plots five-day moving averages of average daily depth for the on-the-run two-, five-, and ten-year notes in the interdealer market from January 2, 2019, to October 31, 2022. Data are for order book depth at the inside tier, averaged across the bid and offer sides. Depth is measured in millions of U.S. dollars par.
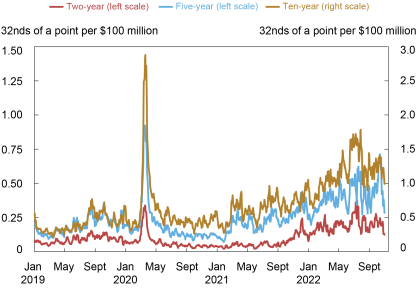
Measures of the price impact of trades also suggest a notable deterioration of liquidity. The next chart plots the estimated price impact per $100 million in net order flow (that is, buyer-initiated trading volume less seller-initiated trading volume). A higher price impact suggests reduced liquidity. Price impact has been high this year, and again more notably so for the two-year note relative to the March 2020 episode. That said, price impact looks to have peaked in late June and July, and to have declined most recently (in October).
Price Impact Highest since March 2020
Liberty Street Economics chart plots the estimated price impact per $100 million in net order flow for the two-, five-, and ten-year notes in the interdealer market from January 2, 2019, to October 31, 2022.Source: Authors’ calculations, based on data from BrokerTec.
Notes: The chart plots five-day moving averages of slope coefficients from daily regressions of one-minute price changes on one-minute net order flow (buyer-initiated trading volume less seller-initiated trading volume) for the on-the-run two-, five-, and ten-year notes in the interdealer market from January 2, 2019, to October 31, 2022. Price impact is measured in 32nds of a point per $100 million, where a point equals one percent of par.
Note that we start our analysis of liquidity in this post in 2019 and not earlier. One reason is to highlight the developments in 2022. Another reason is that the minimum price increment for the two-year note was halved in late 2018, creating a break in the note’s bid-ask spread and depth series. Longer time series of bid-ask spreads, order book depth, and price impact are plotted in this post and this paper. The longer history indicates that the price impact in the two-year note is currently at levels comparable to those seen during the 2007-09 global financial crisis, as well as in March 2020.
Volatility Has Also Been High
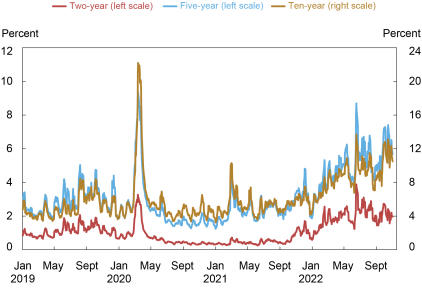
Pandemic-induced supply disruptions, high inflation, policy uncertainty, and geopolitical conflict have led to a sizable increase in uncertainty about the expected path of interest rates, resulting in high price volatility in 2022, as shown in the next chart. As with liquidity, volatility has been especially high lately for the two-year note relative to its history, likely reflecting the importance of near-term monetary policy uncertainty in explaining the current episode. Volatility has caused market makers to widen their bid-ask spreads and post less depth at any given price (to manage the increased risk of taking on positions), and for the price impact of trades to increase, illustrating the well-known negative relationship between volatility and liquidity.
Price Volatility Highest Since March 2020
Liberty Street Economics chart plots five-day moving averages of price volatility for the two-, five-, and ten-year notes in the interdealer market from January 2, 2019, to October 31, 2022.
Source: Authors’ calculations, based on data from BrokerTec.
Notes: The chart plots five-day moving averages of price volatility for the on-the-run two-, five-, and ten-year notes in the interdealer market from January 2, 2019, to October 31, 2022. Price volatility is calculated for each day by summing squared one-minute returns (log changes in midpoint prices) from 7 a.m. to 5 p.m., annualizing by multiplying by 252, and then taking the square root. It is reported in percent.
Liquidity Has Tracked Volatility
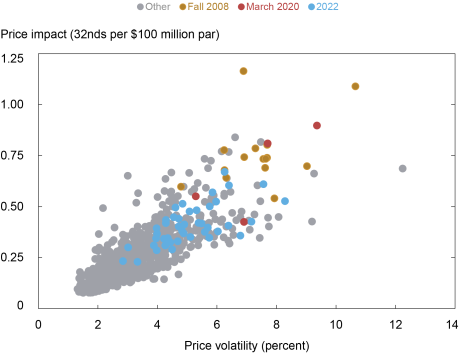
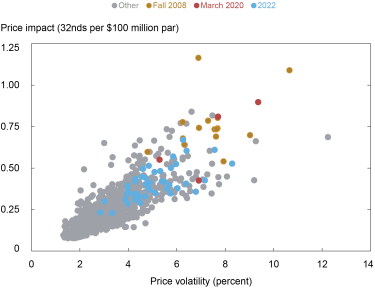
To assess whether liquidity has been unusual given the level of volatility, we provide a scatter plot of price impact against volatility for the five-year note in the chart below. The chart shows that the 2022 observations (in blue) fall in line with the historical relationship. That is, the current level of liquidity is consistent with the current level of volatility, as implied by the historical relationship between these two variables. This is true for the ten-year note as well, whereas for the two-year note the evidence points to somewhat higher-than-expected price impact given the volatility in 2022 (as also occurred in fall 2008 and March 2020).
Liquidity and Volatility in Line with Historical Relationship
Liberty Street Economics chart plots price impact against price volatility by week for the five-year note from January 2, 2005, to October 28, 2022.
Source: Authors’ calculations, based on data from BrokerTec.
Notes: The chart plots price impact against price volatility by week for the on-the-run five-year note from January 2, 2005, to October 28, 2022. The weekly measures for both series are averages of the daily measures plotted in the preceding two charts. Fall 2008 points are for September 21, 2008 – January 3, 2009, March 2020 points are for March 1, 2020 – March 28, 2020, and 2022 points are for January 2, 2022 – October 29, 2022.
The preceding analysis is based on realized price volatility—that is, on how much prices are actually changing. We repeated the analysis with implied (or expected) price volatility, as measured by the ICE BofAML MOVE Index, and found similar results for 2022. That is, liquidity for the five- and ten-year notes is in line with the historical relationship between liquidity and expected volatility, whereas liquidity is somewhat worse for the two-year note.
Note also that while liquidity may not be especially high relative to volatility, one might then ask whether volatility itself is unusually high. Answering this question is beyond our scope here, although we will note that there are good reasons for volatility to be high, as discussed above.
Trading Volume Has Been High
Despite the high volatility and illiquidity, trading volume has held up this year. High trading volume amid high illiquidity is common in the Treasury market, and was also observed during the market disruptions around the near-failure of Long-Term Capital Management (see this paper), during the 2007-09 financial crisis (see this paper), during the October 15, 2014, flash rally (see this post), and during the COVID-19-related disruptions of March 2020 (see this post). Periods of high uncertainty are associated with high volatility and illiquidity but also high trading demand.
Nothing to Be Concerned About?
Not exactly. While Treasury market liquidity has been in line with volatility, there are still reasons to be cautious. The market’s capacity to smoothly handle large flows has been of ongoing concern since March 2020, as discussed in this paper, as Treasury debt outstanding continues to grow. Moreover, lower-than-usual liquidity implies that a liquidity shock will have larger-than-usual effects on prices and perhaps be more likely to precipitate a negative feedback loop between security sales, volatility, and illiquidity. Close monitoring of Treasury market liquidity—and continued efforts to improve the market’s resilience—remain important.
Can We Wave Goodbye to Recession Talk Now that Q3 GDP is Positive?
Gross Domestic Product (GDP), the “advance estimate,” has shown we were not in a recession during the third quarter; instead, the economy expanded. This is a dramatic turn-around from the final data for the previous first two quarters of 2022, which show the U.S. economy contracted during each. Since the Spring, in the stock market, bad economic news has been met with buying, and good news has been met with selling. This GDP report has the power to change that back to more normal investor behavior.
The third quarter production report shows the economy expanded at an annual rate of 2.6% despite nearly 325 basis points of Fed tightening from a base close to zero earlier this year. This report should be great news for the stock market as it shows that a large part of the economy is growing even while stimulus and easy money is being removed. In addition to the headline news related to overnight bank lending rates, each Thursday after the market closes, the Fed releases information on how large its balance sheet is. This balance sheet holdings report can be viewed as how much money they have at work in the system, effectively acting as stimulus. They have been pulling money out at a pace that many expected would also doom growth. It has not, this too should be taken as a positive sign for stock market investors.
This positive GDP report also helps veterans of the market that did not like playing word games by referring to two-quarters of economic recession (lower case “r”) as something other than a Recession (upper case “R”). This definition had in the past always been automatic, without needing the National Bureau of Economic Research (NBER) to decide when to put a light-shaded bar on our economic timeline charts. We expected that they had the same definition.
In 2022 market watchers were all expected to say, “I don’t know what a recession is, I’m not an NBER economist.” This is because, for some reason,, the National Bureau of Economic Research decided not to use the standard metric and definition, it decided instead to be less scientific. The bureau, for the first time declared there is “no fixed rule about what measures contribute information to the process or how they are weighted in our decisions.” In other words, every set of economic conditions is different, and there is no specific threshold that must be met before a recession is declared. We no longer have to even talk about a recession until maybe next year.
Will they declare this quarter an Expansion (upper case “E”)? We’ll see.
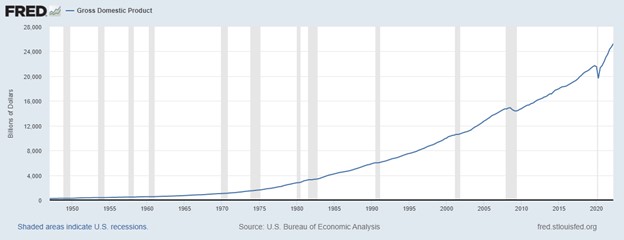
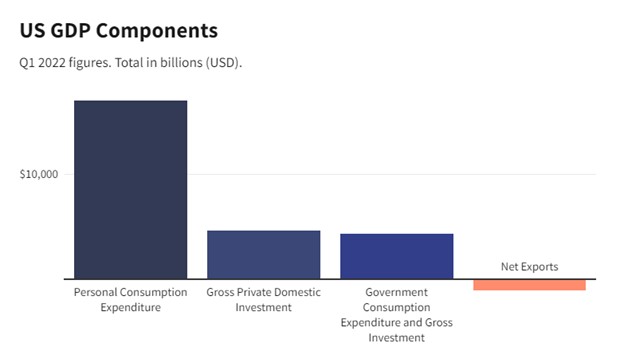
Why this GDP Report is Important
Economic growth of nations is measured as the cost of all goods and services sold and provided from domestic-based resources. After all, wealth comes from output, not increases in currency in circulation. GDP measures this output. As you might imagine, an entire economy’s worth of output is a lot of number crunching by the Bureau of Economic Analysis (BEA). So they do two preliminary numbers before the final. This allows them a couple of months to harvest all the needed data. The final GDP report for this quarter is unlikely to show 2.6% growth as it will have been revised twice, but it is likely to approximate this first look.
Source: Investopedia
Take Away
Good news (economic strength) has been viewed harshly by the market this year as it has been looked at with an eye toward the Fed needing to be more aggressive. Bad news has been embraced and actually caused market rallies.
The most recent GDP report has the power to change this. Despite the historically aggressive Federal Reserve tightening, the economy has grown. Perhaps fears of a deeper recession will pass, and stocks will regain their historic trend of always reaching new highs.
A Lack of Fed Pivot Doesn’t Have to Equate to Lower Stock Prices
The Fed is not likely to have suddenly indicated a pivot.
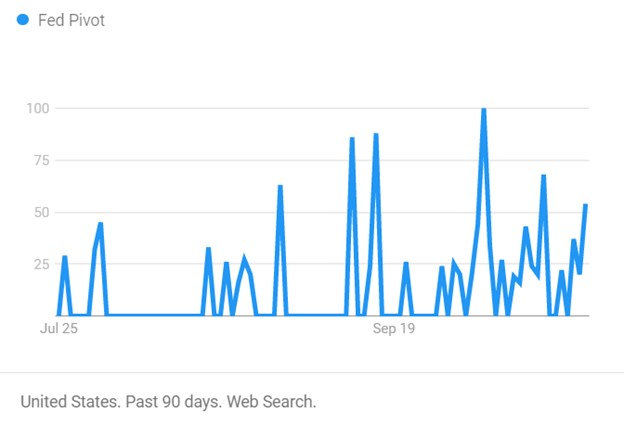
Despite the stock market rally and fresh news stories suggesting the Fed is indicating a more dovish stance, the notion has one problem. There are limits placed on Federal Open Market Committee (FOMC) participants and whether they can grant interviews or give speeches before policy-setting meetings. They can not interact on the subject of policy. The current blackout period began October 22nd and will carry through the November 2nd final meeting day. So, investors may wish to consider other reasons if the stock market is rallying. Earnings, oversold conditions, year-end rally, perhaps news stories created by bloggers or journalists that don’t possess experience or understanding.
Image: Number of times “Fed Pivot” was searched using Google
Current State of Tightening
This year the Fed has been tightening aggressively after having brought interest rates down aggressively a couple of years back. For many investors, a tightening cycle, ending with interest rates a safe margin above the inflation rate, is not something they can recall. This is because the Fed has been stabilizing employment during tricky times in a way that has lifted the markets out of whatever trouble there may have been. Rates have been well below the average 6% to 8% range. This has been going on since at least 2008 – by some measures, way before.
There have been five times since late Spring that investors and TV’s talking heads were convinced the Fed has gone too far and will now begin bringing rates back. So far, all the hoping has done nothing to help; the track record stands at zero for five. While it remains to be seen and heard what to expect from monetary policy starting mid-next week, the current inflation rate and words that the Fed board members have said indicate another 75 bp hike in funds.
Looking Forward
Can this change? We get a look at third-quarter GDP on Thursday. This measures U.S. domestic production. A bad number could cause the Fed to rethink aggressive tightening. However, the expectations are that it will be higher than it has been all year (2.3% growth rate) which gives the Fed even greater ability to hit the brakes. Also, the PCE Price Index, viewed as the Fed’s preferred inflation indicator, is released Friday (6.3% YoY expected).
The Federal Reserve’s, monetary policy does not cater to the stock market. It does consider it because, of the wealth effect. The wealth effect is where consumers feel poorer because of declines in asset values, and while their disposable income may not have changed, they hunker down and spend less. This secondary impact to spending is the only attention the Fed officially pays to stocks.
Interest Rates
Real interest rates are still negative. Imagine buying a bond knowing that despite being exposed to maturity and credit risk, while tying up money, your spending power will almost certainly be less when it matures. This isn’t why people invest; in fact, if that scenario remains and inflation persists, the best use of savings may be to consider any large purchases you think you may incur in the coming few years and make them now. At the moment, inflation hasn’t shown signs of abating, something has to give; bond investors are going to require higher yields, Japan has already experienced a bond-buyer “strike.”
Where Do We Go from Here
For now, the consensus view is that inflation should drift back down to 3% or even lower by 2025. If energy continues to decline, supply-chain issues are resolved, and a strong U.S. dollar persists, the consensus may be correct. But one should be aware there are very bright economists that deviate from the consensus by plus or minus 300 bp or more.
The markets may have already priced in bad news; rates heading back to normalcy (upward) doesn’t immediately mean a bad stock market. We can easily rally through the end of the year and still experience a sixth time the Fed has refrained from pivoting but instead has made sure its words were cleansed of anything that can be construed as reversing course.