Release – ACCO Brands Reports Second Quarter 2023 Results; Maintains Full Year Adjusted EPS and Raises Free Cash Flow Guidance

Research News and Market Data on ACCO

  • Reported net sales of $494 million, with gross margin expanding 450 basis points
  • Operating income of $55 million, flat to prior year; adjusted operating income of $66 million grew 14% year over year
  • EPS of $0.27; adjusted EPS of $0.38, above Company’s outlook
  • Net operating cash outflow improved $59 million year to date driven by improved working capital management
  • Maintains full year 2023 adjusted EPS outlook of $1.08 to $1.12
  • Raises full year 2023 free cash flow outlook to at least $110 million
  • Lowered end of year consolidated leverage ratio outlook

August 08, 2023 04:00 PM Eastern Daylight Time

LAKE ZURICH, Ill.–(BUSINESS WIRE)–ACCO Brands Corporation (NYSE: ACCO) today announced its second quarter and first six-month results for the period ended June 30, 2023.

“Our top priority entering 2023 was to restore our margin profile, and I’m pleased to report that we have made great progress on that front in the first half. Second quarter and year-to-date gross margin expanded 450 and 360 basis points, respectively, due to greater traction from our pricing, productivity and restructuring initiatives. This has yielded much better than expected adjusted EPS. The higher operating profits experienced through the first six months give us confidence in our full year 2023 outlook for adjusted EPS and free cash flow. While we are pleased with the strong start of the year, we are more cautious on the second half demand environment. With improved working capital management, we are well positioned to end the year with a lower leverage ratio than previously expected. We remain committed to supporting our quarterly dividend and reducing debt with our strong cash flow” said Boris Elisman, Chairman and Chief Executive Officer of ACCO Brands.

“Our results reflect the resilience of our brands and the transformative actions undertaken to expand our product categories, broaden our geographic reach, bring innovative new consumer-centric products to market and streamline our cost structure. We remain confident that our strategy has us positioned to deliver sustainable organic growth as global economies improve,” concluded Mr. Elisman.

Second Quarter Results

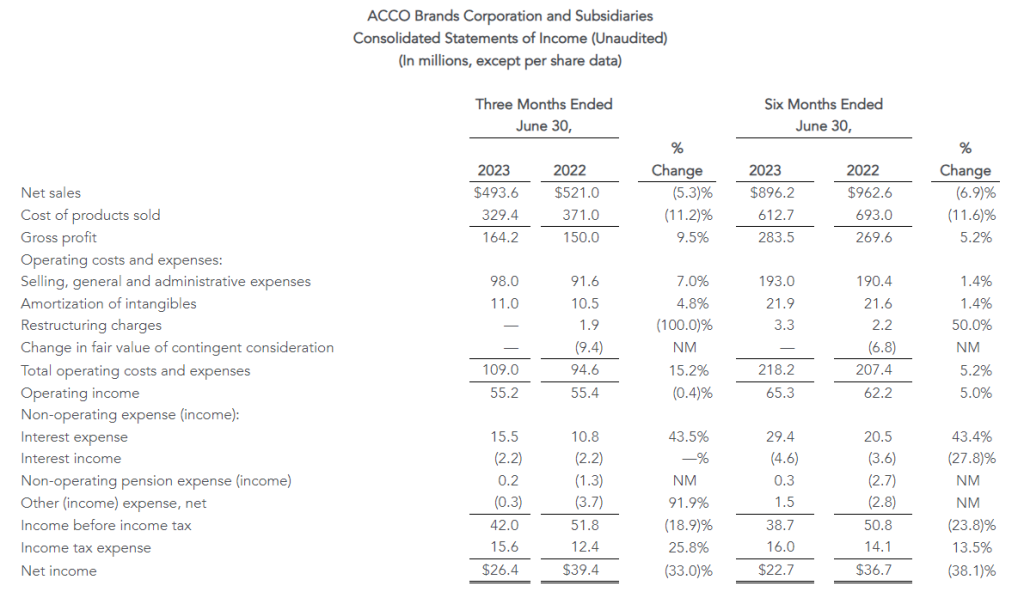
Net sales declined 5.3 percent to $493.6 million from $521.0 million in 2022. Adverse foreign exchange reduced sales by $0.8 million, or 0.2 percent. Comparable sales fell 5.1 percent. Both reported and comparable sales declines were due to reduced volume, reflecting a more challenging macroeconomic environment, especially in our EMEA segment, and weaker global sales of computer accessories.

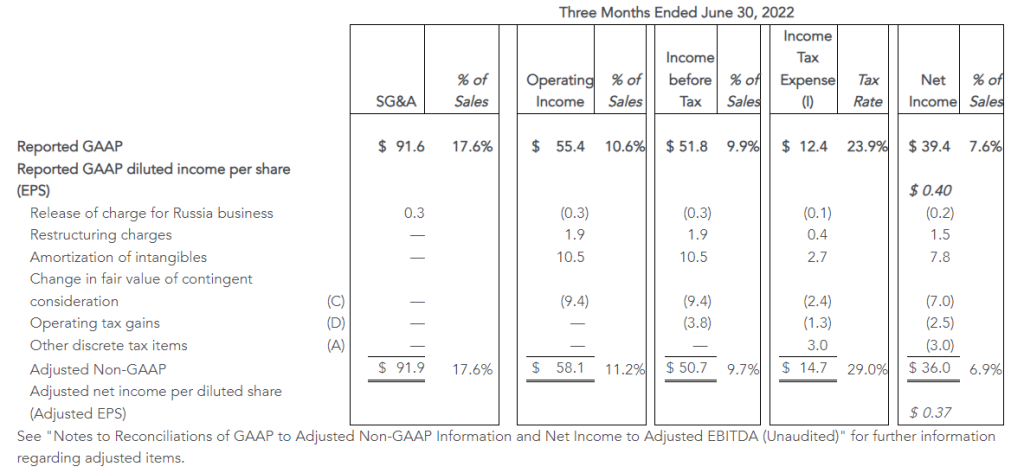
Operating income was $55.2 million versus $55.4 million in 2022. In 2022, operating income benefitted from income related to a change in the value of the PowerA contingent earnout of $9.4 million, partially offset by $1.9 million in restructuring charges. Adjusted operating income increased 14 percent to $66.2 million from $58.1 million in the prior year. This increase reflects improved gross margin from the effect of cumulative global pricing and cost reduction actions, partially offset by negative fixed cost leverage and higher SG&A expense primarily due to an increase in incentive compensation.

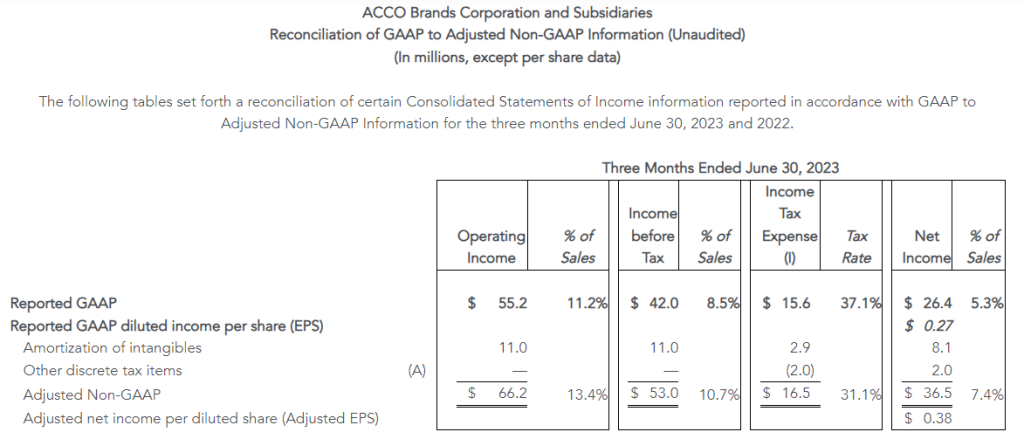
The Company reported net income of $26.4 million, or $0.27 per share, compared with prior year net income of $39.4 million, or $0.40 per share. Reported net income in 2023 reflects higher interest, tax and non-operating pension expenses. Reported net income in 2022 benefited from the items noted above in operating income. Adjusted net income was $36.5 million, or $0.38 per share, compared with $36.0 million, or $0.37 per share in 2022. Adjusted net income reflects the increase in adjusted operating income, partially offset by higher interest and non-operating pension expenses.

Business Segment Results

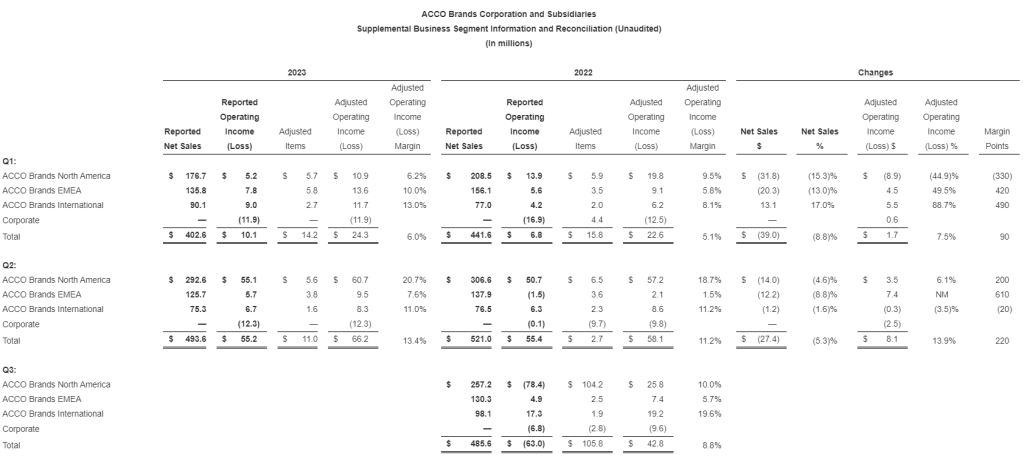
ACCO Brands North America – Secondquarter segment net sales of $292.6 million decreased 4.6 percent versus the prior year. Adverse foreign exchange reduced sales by 0.5 percent. Comparable sales of $294.2 million were down 4.1 percent. Both decreases reflect softer demand from business and retail customers due to a weaker macroeconomic environment and lower volumes for computer accessories. These factors more than offset stronger pricing, and volume growth in gaming accessories. Timing for some back-to-school sales was earlier than anticipated.

Second quarter operating income in North America was $55.1 million versus $50.7 million a year earlier, and adjusted operating income was $60.7 million compared to $57.2 million a year ago. Both increases reflect the benefit of pricing and cost actions and favorable mix, which more than offset the impact of lower sales and negative fixed cost leverage.

ACCO Brands EMEA – Secondquarter segment net sales of $125.7 million decreased 8.8 percent versus the prior year. Favorable foreign exchange increased sales by 0.3 percent. Comparable sales of $125.3 million decreased 9.1 percent versus the prior-year period. Both reported and comparable sales declines reflect reduced demand due to a weaker environment in the region and lower volumes for technology accessories. This more than offset the effect of cumulative pricing actions.

Second quarter operating income in EMEA was $5.7 million versus a loss of $1.5 million a year earlier, and adjusted operating income was $9.5 million compared to $2.1 million a year ago. The increases in both reported operating income and adjusted operating income reflect improved gross margins from the cumulative effect of price increases and cost savings actions more than offsetting negative fixed cost leverage.

ACCO Brands International – Secondquarter segment sales of $75.3 million decreased 1.6 percent versus the prior year. Favorable foreign exchange increased sales by 0.7 percent. Comparable sales of $74.8 million decreased 2.3 percent versus the year-ago period. Both sales decreases reflect lower volumes due to weaker economies in Asia and Australia, mostly offset by growth in Latin America.

Second quarter operating income in the International segment was $6.7 million versus $6.3 million a year earlier, with the increase due to lower restructuring expense. Adjusted operating income was $8.3 million compared to $8.6 million a year ago.

Six Month Results

Net sales decreased 6.9 percent to $896.2 million from $962.6 million in 2022. Adverse foreign exchange reduced sales by $11.4 million, or 1.2 percent. Comparable sales decreased 5.7 percent. Both reported and comparable sales declines reflect lower volume, especially in EMEA and North America due to the challenging macroeconomic environment, lower sales of technology accessories, and the timing of back-to-school shipments and lower channel inventory compared to a year ago. These more than offset the benefit of price increases across all segments, and volume growth in Latin America.

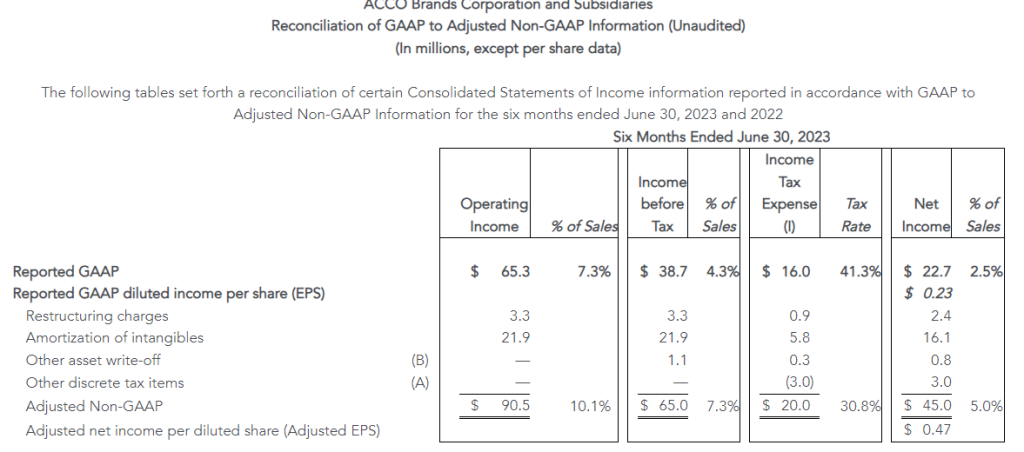
Operating income of $65.3 million compares to operating income of $62.2 million in 2022, which included a benefit of $6.8 million related to a change in the value of the PowerA contingent earnout. Adjusted operating income of $90.5 million increased from $80.7 million last year. Both reported and adjusted operating income increases reflect the benefit of global price increases and cost reduction initiatives, partially offset by higher SG&A expense primarily due to increased incentive compensation.

Net income was $22.7 million, or $0.23 per share, compared with net income of $36.7 million, or $0.37 per share, in 2022. Reported net income in 2023 reflects higher interest, tax and non-operating pension expenses. Reported net income in 2022 benefitted from the items noted above in operating income. Adjusted net income was $45.0 million, compared with $46.4 million in 2022, and adjusted earnings per share were $0.47 for both year periods. Adjusted net income reflects the increase in adjusted operating income offset by higher interest and non-operating pension expenses.

Capital Allocation and Dividend

Year to date, the Company improved its operating cash outflow by $58.6 million to $39.3 million versus $97.9 million in the prior year, driven primarily by improved working capital management. Adjusted free cash flow improved by $50.1 million and was an outflow of $45.4 million versus an outflow of $95.5 million a year earlier. Adjusted free cash flow in 2022 excludes the contingent earnout payment.

On August 1, 2023, ACCO Brands announced that its board of directors declared a regular quarterly cash dividend of $0.075 per share. The dividend will be paid on September 12, 2023, to stockholders of record at the close of business on August 22, 2023.

Full Year 2023 and Third Quarter Outlook

The Company is updating its full year 2023 outlook and providing a 3Q outlook. For the full year, reported sales are expected to be down 1 percent to 3 percent, including a 1.5 percent positive impact from foreign exchange. The Company is also maintaining its full year adjusted EPS outlook to be in the range of $1.08 to $1.12. Mid-teen growth in adjusted operating income is expected to be partially offset by higher interest and non-cash non-operating pension expenses. The Company is raising its 2023 free cash flow outlook to at least $110 million and expects to end the year with a consolidated leverage ratio of 3.3x to 3.5x, lower than previously expected.

In the third quarter, reported sales are expected to be flat to down 3 percent, which includes approximately a 4 percent positive impact from foreign exchange. Adjusted EPS is expected to be in the range of $0.21 to $0.24, which compares to $0.25 of adjusted EPS in the prior-year third quarter.

Webcast

At 8:30 a.m. ET on August 9, 2023, ACCO Brands Corporation will host a conference call to discuss the Company’s second quarter 2023 results. The call will be broadcast live via webcast. The webcast can be accessed through the Investor Relations section of www.accobrands.com. The webcast will be in listen-only mode and will be available for replay following the event.

About ACCO Brands Corporation

ACCO Brands, the Home of Great Brands Built by Great People, designs, manufactures and markets consumer and end-user products that help people work, learn, play and thrive. Our widely recognized brands include AT-A-GLANCE®, Five Star®, Kensington®, Leitz®, Mead®, PowerA®, Swingline®, Tilibra® and many others. More information about ACCO Brands Corporation (NYSE: ACCO) can be found at www.accobrands.com.

Non-GAAP Financial Measures

In addition to financial results reported in accordance with generally accepted accounting principles (GAAP), we have provided certain non-GAAP financial information in this earnings release to aid investors in understanding the Company’s performance. Each non-GAAP financial measure is defined and reconciled to its most directly comparable GAAP financial measure in the “About Non-GAAP Financial Measures” section of this earnings release.

Forward-Looking Statements

Statements contained herein, other than statements of historical fact, particularly those anticipating future financial performance, business prospects, growth, strategies, business operations and similar matters, results of operations, liquidity and financial condition, are “forward-looking statements” within the meaning of the Private Securities Litigation Reform Act of 1995. These statements are based on the beliefs and assumptions of management based on information available to us at the time such statements are made. These statements, which are generally identifiable by the use of the words “will,” “believe,” “expect,” “intend,” “anticipate,” “estimate,” “forecast,” “project,” “plan,” and similar expressions, are subject to certain risks and uncertainties, are made as of the date hereof, and we undertake no duty or obligation to update them. Because actual results may differ materially from those suggested or implied by such forward-looking statements, you should not place undue reliance on them when deciding whether to buy, sell or hold the Company’s securities.

Our outlook is based on certain assumptions, which we believe to be reasonable under the circumstances. These include, without limitation, assumptions regarding the impact of the war in Ukraine; the impact of inflation and global economic uncertainties, fluctuations in foreign currency exchange rates and acquisitions; and the other factors described below.

Among the factors that could cause our actual results to differ materially from our forward-looking statements are: our ability to successfully execute our restructuring plans and realize the benefits of our productivity initiatives; our ability to obtain additional price increases and realize longer-term cost reductions; the ongoing impact of the COVID-19 pandemic; a relatively limited number of large customers account for a significant percentage of our sales; issues that influence customer and consumer discretionary spending during periods of economic uncertainty or weakness; risks associated with foreign currency exchange rate fluctuations; challenges related to the highly competitive business environment in which we operate; our ability to develop and market innovative products that meet consumer demands and to expand into new and adjacent product categories that are experiencing higher growth rates; our ability to successfully expand our business in emerging markets and the exposure to greater financial, operational, regulatory, compliance and other risks in such markets; the continued decline in the use of certain of our products; risks associated with seasonality; the sufficiency of investment returns on pension assets, risks related to actuarial assumptions, changes in government regulations and changes in the unfunded liabilities of a multi-employer pension plan; any impairment of our intangible assets; our ability to secure, protect and maintain our intellectual property rights, and our ability to license rights from major gaming console makers and video game publishers to support our gaming accessories business; continued disruptions in the global supply chain; risks associated with inflation and other changes in the cost or availability of raw materials, transportation, labor, and other necessary supplies and services and the cost of finished goods; risks associated with outsourcing production of certain of our products, information technology systems and other administrative functions; the failure, inadequacy or interruption of our information technology systems or its supporting infrastructure; risks associated with a cybersecurity incident or information security breach, including that related to a disclosure of personally identifiable information; our ability to grow profitably through acquisitions; our ability to successfully integrate acquisitions and achieve the financial and other results anticipated at the time of acquisition, including planned synergies; risks associated with our indebtedness, including limitations imposed by restrictive covenants, our debt service obligations, and our ability to comply with financial ratios and tests; a change in or discontinuance of our stock repurchase program or the payment of dividends; product liability claims, recalls or regulatory actions; the impact of litigation or other legal proceedings; our failure to comply with applicable laws, rules and regulations and self-regulatory requirements, the costs of compliance and the impact of changes in such laws; our ability to attract and retain qualified personnel; the volatility of our stock price; risks associated with circumstances outside our control, including those caused by public health crises, such as the occurrence of contagious diseases, severe weather events, war, terrorism and other geopolitical incidents; and other risks and uncertainties described in “Part I, Item 1A. Risk Factors” in our Annual Report on Form 10-K for the year ended December 31, 2022, and in other reports we file with the Securities and Exchange Commission.
About Non-GAAP Financial Measures

We explain below how we calculate each of our non-GAAP financial measures and a reconciliation of our current period and historical non-GAAP financial measures to the most directly comparable GAAP financial measures follows.

We use our non-GAAP financial measures both to explain our results to stockholders and the investment community and in the internal evaluation and management of our business. We believe our non-GAAP financial measures provide management and investors with a more complete understanding of our underlying operational results and trends, facilitate meaningful period-to-period comparisons and enhance an overall understanding of our past and future financial performance.

Our non-GAAP financial measures exclude certain items that may have a material impact upon our reported financial results such as restructuring charges, transaction and integration expenses associated with material acquisitions, the impact of foreign currency exchange rate fluctuations and acquisitions, unusual tax items, goodwill impairment charges, and other non-recurring items that we consider to be outside of our core operations. These measures should not be considered in isolation or as a substitute for, or superior to, the directly comparable GAAP financial measures and should be read in connection with the Company’s financial statements presented in accordance with GAAP.

Our non-GAAP financial measures include the following:

Comparable Sales : Represents net sales excluding the impact of material acquisitions, if any, with current-period foreign operation sales translated at prior-year currency rates. We believe comparable sales are useful to investors and management because they reflect underlying sales and sales trends without the effect of material acquisitions and fluctuations in foreign exchange rates and facilitate meaningful period-to-period comparisons. We sometimes refer to comparable sales as comparable net sales.

Adjusted Selling, General and Administrative (SG&A) Expenses : Represents selling, general and administrative expenses excluding transaction and integration expenses related to material acquisitions. We believe adjusted SG&A expenses are useful to investors and management because they reflect underlying SG&A expenses without the effect of expenses related to acquiring and integrating acquisitions that we consider to be outside our core operations and facilitate meaningful period-to-period comparisons.

Adjusted Operating Income/Adjusted Income Before Taxes/Adjusted Net Income/Adjusted Net Income Per Diluted Share: Represents operating income, income before taxes, net income, and net income per diluted share excluding restructuring and goodwill impairment charges, the amortization of intangibles, the amortization of the step-up in value of inventory, the change in fair value of contingent consideration, transaction and integration expenses associated with material acquisitions, non-recurring items in interest expense or other income/expense such as expenses associated with debt refinancing, a bond redemption, or a pension curtailment, and other non-recurring items as well as all unusual and discrete income tax adjustments, including income tax related to the foregoing. We believe these adjusted non-GAAP financial measures are useful to investors and management because they reflect our underlying operating performance before items that we consider to be outside our core operations and facilitate meaningful period-to-period comparisons. Senior management’s incentive compensation is derived, in part, using adjusted operating income and adjusted net income per diluted share, which is derived from adjusted net income. We sometimes refer to adjusted net income per diluted share as adjusted earnings per share or adjusted EPS.

Adjusted Income Tax Expense/Rate: Represents income tax expense/rate excluding the tax effect of the items that have been excluded from adjusted income before taxes, unusual income tax items such as the impact of tax audits and changes in laws, significant reserves for cash repatriation, excess tax benefits/losses, and other discrete tax items. We believe our adjusted income tax expense/rate is useful to investors because it reflects our baseline income tax expense/rate before benefits/losses and other discrete items that we consider to be outside our core operations and facilitates meaningful period-to-period comparisons.

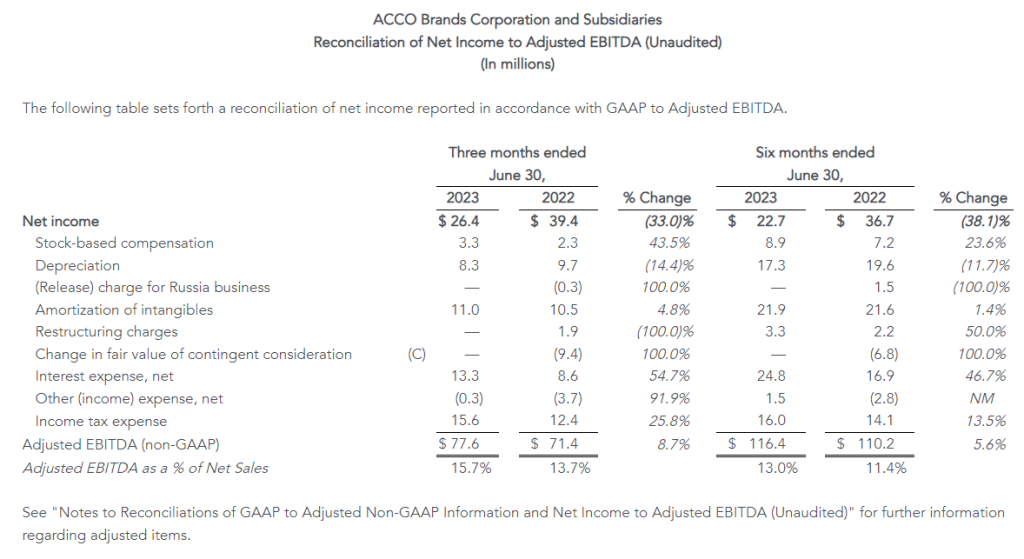
Adjusted EBITDA: Represents net income excluding the effects of depreciation, stock-based compensation expense, amortization of intangibles, the change in fair value of contingent consideration, interest expense, net, other (income) expense, net, and income tax expense, the amortization of the step-up in value of inventory, transaction and integration expenses associated with material acquisitions, restructuring and goodwill impairment charges, non-recurring items in interest expense or other income/expense such as expenses associated with debt refinancing, a bond redemption, or a pension curtailment and other non-recurring items. We believe adjusted EBITDA is useful to investors because it reflects our underlying cash profitability and adjusts for certain non-cash charges, and items that we consider to be outside our core operations and facilitates meaningful period-to-period comparisons.

Free Cash Flow/Adjusted Free Cash Flow: Free cash flow represents cash flow from operating activities less cash used for additions to property, plant and equipment. Adjusted free cash flow represents free cash flow, less cash payments made for contingent earnouts, plus cash proceeds from the disposition of assets. We believe free cash flow and adjusted free cash flow are useful to investors because they measure our available cash flow for paying dividends, funding strategic material acquisitions, reducing debt, and repurchasing shares.

Consolidated Leverage Ratio: Represents balance sheet debt, plus debt origination costs and less any cash and cash equivalents divided by adjusted EBITDA. We believe that consolidated leverage ratio is useful to investors since the company has the ability to, and may decide to use, a portion of its cash and cash equivalents to retire debt.

We also provide forward-looking non-GAAP comparable sales, adjusted earnings per share, free cash flow, adjusted free cash flow, adjusted EBITDA, and adjusted tax rate, and historical and forward-looking consolidated leverage ratio. We do not provide a reconciliation of these forward-looking and historical non-GAAP measures to GAAP because the GAAP financial measure is not currently available and management cannot reliably predict all the necessary components of such non-GAAP measures without unreasonable effort or expense due to the inherent difficulty of forecasting and quantifying certain amounts that are necessary for such a reconciliation, including adjustments that could be made for restructuring, integration and acquisition-related expenses, the variability of our tax rate and the impact of foreign currency fluctuation and material acquisitions, and other charges reflected in our historical results. The probable significance of each of these items is high and, based on historical experience, could be material.
Christopher McGinnis
Investor Relations
(847) 796-4320

Lori Conley
Media Relations
(937) 495-4949

Source: ACCO Brands Corporation
FAT Brands Inc. (FAT) – Upping Factory Utilization and Other Business Notes


Wednesday, August 09, 2023

FAT Brands (NASDAQ: FAT) is a leading global franchising company that strategically acquires, markets, and develops fast casual, quick-service, casual dining, and polished casual dining concepts around the world. The Company currently owns 17 restaurant brands: Round Table Pizza, Fatburger, Marble Slab Creamery, Johnny Rockets, Fazoli’s, Twin Peaks, Great American Cookies, Hot Dog on a Stick, Buffalo’s Cafe & Express, Hurricane Grill & Wings, Pretzelmaker, Elevation Burger, Native Grill & Wings, Yalla Mediterranean and Ponderosa and Bonanza Steakhouses, and franchises and owns over 2,300 units worldwide. For more information on FAT Brands, please visit www.fatbrands.com.

Joe Gomes, Managing Director, Equity Research Analyst, Generalist , Noble Capital Markets, Inc.

Joshua Zoepfel, Research Associate, Noble Capital Markets, Inc.

Refer to the full report for the price target, fundamental analysis, and rating.

Factory Utilization. FAT Brands has completed the rollout of cookie offerings at burger portfolio restaurants nationwide, including Fatburger, Johnny Rockets, and Elevation Burger. While consumers will benefit from additional menu choices, the real key is the potential for increased utilization of the manufacturing facility. Recall, this is an asset management will look to monetize and higher utilization will result in increased value for the asset.

Great American Cookie. The cookie concept has opened its 400th location, and operates in 31 states and five countries around the world. In the last two years, the brand has experienced accelerated growth, opening 73 new locations and entering new states such as Alaska, Arizona, Illinois and New Mexico. Just like the cookie roll out to the burger concepts, each additional Great American Cookie location adds to factory utilization.


Get the Full Report

Equity Research is available at no cost to Registered users of Channelchek. Not a Member? Click ‘Join’ to join the Channelchek Community. There is no cost to register, and we never collect credit card information.

This Company Sponsored Research is provided by Noble Capital Markets, Inc., a FINRA and S.E.C. registered broker-dealer (B/D).

*Analyst certification and important disclosures included in the full report. NOTE: investment decisions should not be based upon the content of this research summary. Proper due diligence is required before making any investment decision. 

ACCO Brands (ACCO) – Second Quarter First Look and Management Transition


Wednesday, August 09, 2023

ACCO Brands Corporation is one of the world’s largest designers, marketers and manufacturers of branded academic, consumer and business products. Our widely recognized brands include AT-A-GLANCE®, Esselte®, Five Star®, GBC®, Kensington®, Leitz®, Mead®, PowerA®, Quartet®, Rapid®, Rexel®, Swingline®, Tilibra®, and many others. Our products are sold in more than 100 countries around the world. More information about ACCO Brands, the Home of Great Brands Built by Great People, can be found at www.accobrands.com.

Joe Gomes, Managing Director, Equity Research Analyst, Generalist , Noble Capital Markets, Inc.

Joshua Zoepfel, Research Associate, Noble Capital Markets, Inc.

Refer to the full report for the price target, fundamental analysis, and rating.

Second Quarter Results. ACCO reported net sales of $493.6 million compared to $521.0 million last year. We projected revenue of $490 million. Adverse foreign exchange reduced sales by $0.8 million, or less than 1%. Comparable sales fell 5.1%. ACCO had net income of $26.4 million, or $0.27 per diluted, compared to $39.4 million, or $0.40, last year. Adjusted EPS was $0.38, above the Company’s outlook. We estimated net income of $20 million or diluted EPS of $0.21.

Change in Guidance. ACCO is changing their outlook for the full year 2023, as sales are expected to be down 1-3% from the previous 4-7%, including a 1.5% positive impact from foreign exchange. The Company is maintaining its adjusted EPS outlook ($1.08-$1.12 range), is raising its free cash flow outlook to at least $110 million from a prior $100 million, and is lowering its expected consolidated leverage ratio of 3.3x to 3.5x from 3.5x to 3.7x. All of these are positive developments that stem from the Company’s restructuring process announced earlier this year, in our view.


Get the Full Report

Equity Research is available at no cost to Registered users of Channelchek. Not a Member? Click ‘Join’ to join the Channelchek Community. There is no cost to register, and we never collect credit card information.

This Company Sponsored Research is provided by Noble Capital Markets, Inc., a FINRA and S.E.C. registered broker-dealer (B/D).

*Analyst certification and important disclosures included in the full report. NOTE: investment decisions should not be based upon the content of this research summary. Proper due diligence is required before making any investment decision. 

Release – FAT Brands Completes Cookie Rollout Initiative Across Burger Concepts

Research News and Market Data on FAT

AUGUST 08, 2023

Company-Owned Cookie Dough Facility Now Serving Fatburger and Johnny Rockets

LOS ANGELES, Aug. 08, 2023 (GLOBE NEWSWIRE) — FAT (Fresh. Authentic. Tasty.) Brands Inc., parent company of Fatburger, Johnny Rockets and 15 other restaurant concepts, today announces the rollout of cookie offerings at burger portfolio restaurants nationwide – Fatburger, Johnny Rockets and Elevation Burger.

The sweet menu rollout is a strategic optimization that leverages FAT Brands’ company-owned manufacturing facility, which produces cookie dough and pretzel mix for sister portfolio brands Great American Cookies and Pretzelmaker. Elevation Burger completed its cookie roll-out earlier in April of this year.

“For both Fatburger and Johnny Rockets, we see these additions as a way to further build and enhance our dessert programs,” said Taylor Fischer, Vice President of Marketing of FAT Brands’ Fast Casual Division. “Playing into synergies is at the core of FAT Brands’ DNA. We are thrilled to be able to tap into our cookie dough facility to provide more delicious offerings for our fans.”

For more information or to find a Fatburger near you, please visit www.Fatburger.com. For more information or to find a Johnny Rockets near you, please visit www.JohnnyRockets.com.

About FAT (Fresh. Authentic. Tasty.) Brands

FAT Brands (NASDAQ: FAT) is a leading global franchising company that strategically acquires, markets, and develops fast-casual, quick-service, casual dining, and polished casual dining concepts around the world. The Company currently owns 17 restaurant brands: Round Table Pizza, Fatburger, Marble Slab Creamery, Johnny Rockets, Fazoli’s, Twin Peaks, Great American Cookies, Hot Dog on a Stick, Buffalo’s Cafe & Express, Hurricane Grill & Wings, Pretzelmaker, Elevation Burger, Native Grill & Wings, Yalla Mediterranean and Ponderosa and Bonanza Steakhouses, and franchises and owns over 2,300 units worldwide. For more information on FAT Brands, please visit www.fatbrands.com.

About Fatburger

An all-American, Hollywood favorite, Fatburger is a fast-casual restaurant serving big, juicy, tasty burgers, crafted specifically to each customer’s liking. With a legacy spanning 70 years, Fatburger’s extraordinary quality and taste inspire fierce loyalty amongst its fan base, which includes a number of A-list celebrities and athletes. Featuring a contemporary design and ambience, Fatburger offers an unparalleled dining experience, demonstrating the same dedication to serving gourmet, homemade, custom-built burgers as it has since 1952 – The Last Great Hamburger Stand.

About Johnny Rockets

Founded in 1986 on iconic Melrose Avenue in Los Angeles, Johnny Rockets is a world-renowned, international restaurant franchise that offers high quality, innovative menu items including Certified Angus Beef® cooked-to-order hamburgers, veggie burgers, chicken sandwiches, crispy fries and rich, delicious hand-spun shakes and malts. With over 325 locations in over 25 countries around the globe, this dynamic lifestyle brand offers friendly service and upbeat music contributing to the chain’s signature atmosphere of relaxed, casual fun. For more information, visit www.johnnyrockets.com.

MEDIA CONTACT:
Erin Mandzik, FAT Brands
[email protected]
860-212-6509

Release – Johnny Rockets Announces Twenty New Texas Locations

Research News and Market Data on FAT

AUGUST 07, 2023

 DOWNLOAD PDFPDF FORMAT (OPENS IN NEW WINDOW)

Iconic Burger Chain to Triple State’s Footprint By 2033

LOS ANGELES, Aug. 07, 2023 (GLOBE NEWSWIRE) — FAT (Fresh. Authentic. Tasty.) Brands Inc., parent company of Johnny Rockets and 16 other restaurant concepts, announces a new development deal set to bring 20 new franchised Johnny Rockets locations to Texas in the next 10 years with the first unit set to open in 2024.

The brand currently operates a number of restaurants in the Lone Star State. The new locations will open in partnership with Brame Holdings LLC, featuring the classic fare that put the brand on the map over 35 years ago, including juicy, made-to-order burgers and hand-spun shakes.

“Brame Holdings LLC continues to be a great growth partner in Texas across the FAT Brands portfolio,” said Taylor Wiederhorn, Chief Development Officer of FAT Brands. “They are quickly developing many Fatburger and Buffalo’s Express locations in addition to Round Table Pizza locations which is part of an 80-store development deal for the state, the first of these stores are set to open soon in San Antonio. We are thrilled to extend our relationship with an experienced operator like Brame Holdings LLC, driving further domestic growth in Texas for another beloved, iconic brand of ours, Johnny Rockets.”

The first Johnny Rockets restaurant opened June 6, 1986 on Melrose Avenue in Los Angeles. Since that time, the chain’s timeless all-American brand has connected with customers across the U.S. and in 25 other countries around the globe.

For more information on Johnny Rockets, visit www.johnnyrockets.com.

###

About FAT (Fresh. Authentic. Tasty.) Brands

FAT Brands (NASDAQ: FAT) is a leading global franchising company that strategically acquires, markets and develops fast casual, quick-service, casual and polished casual dining restaurant concepts around the world. The Company currently owns 17 restaurant brands: Round Table Pizza, Fatburger, Marble Slab Creamery, Johnny Rockets, Fazoli’s, Twin Peaks, Great American Cookies, Hot Dog on a Stick, Buffalo’s Cafe & Express, Hurricane Grill & Wings, Pretzelmaker, Elevation Burger, Native Grill & Wings, Yalla Mediterranean and Ponderosa and Bonanza Steakhouses, and franchises and owns over 2,300 units worldwide. For more information on FAT Brands, please visit www.fatbrands.com.

About Johnny Rockets
Founded in 1986 on Melrose Avenue in Los Angeles, Johnny Rockets is a world-renowned international franchise that offers high-quality, innovative menu items including Certified Angus Beef® cooked-to-order hamburgers, veggie burgers, chicken sandwiches, crispy fries, and rich, delicious hand-spun shakes and malts. With over 325 locations in over 25 countries around the globe, this dynamic lifestyle brand offers friendly service and upbeat music contributing to the chain’s signature atmosphere of relaxed, casual fun.
For more information, visit www.johnnyrockets.com

Forward Looking Statements
This press release contains forward-looking statements within the meaning of the Private Securities Litigation Reform Act of 1995, including statements relating to the timing and performance of new store openings. Forward-looking statements reflect expectations of FAT Brands Inc. (“we”, “our” or the “Company”) concerning the future and are subject to significant business, economic and competitive risks, uncertainties and contingencies. These factors are difficult to predict and beyond our control, and could cause our actual results to differ materially from those expressed or implied in such forward-looking statements. We refer you to the documents that we file from time to time with the Securities and Exchange Commission, such as our reports on Form 10-K, Form 10-Q and Form 8-K, for a discussion of these and other factors. We undertake no obligation to update any forward-looking statement to reflect events or circumstances occurring after the date of this press release.

MEDIA C ONTACT :
Erin Mandzik, FAT Brands
[email protected]
860-212-6509

Source: FAT Brands Inc.

FAT Brands Inc. (FAT) – Second Quarter Post Call Commentary


Friday, August 04, 2023

FAT Brands (NASDAQ: FAT) is a leading global franchising company that strategically acquires, markets, and develops fast casual, quick-service, casual dining, and polished casual dining concepts around the world. The Company currently owns 17 restaurant brands: Round Table Pizza, Fatburger, Marble Slab Creamery, Johnny Rockets, Fazoli’s, Twin Peaks, Great American Cookies, Hot Dog on a Stick, Buffalo’s Cafe & Express, Hurricane Grill & Wings, Pretzelmaker, Elevation Burger, Native Grill & Wings, Yalla Mediterranean and Ponderosa and Bonanza Steakhouses, and franchises and owns over 2,300 units worldwide. For more information on FAT Brands, please visit www.fatbrands.com.

Joe Gomes, Managing Director, Equity Research Analyst, Generalist , Noble Capital Markets, Inc.

Joshua Zoepfel, Research Associate, Noble Capital Markets, Inc.

Refer to the full report for the price target, fundamental analysis, and rating.

2Q23 Results. FAT Brands reported 2Q23 revenue of $106.8 million, up 3.9% y-o-y from $102.8 million in the year ago quarter. System-wide sales growth was 1.7%. Same Store Sales were up 1.9%. FAT reported adjusted EBITDA of $23.1 million in the quarter, compared to $29.5 million in 2Q22. Net loss for the quarter was $7.1 million, or $0.53/sh, compared to a net loss of $9.8 million, or $0.60/sh last year. Adjusted net income for the quarter was $3.0 million, or EPS of $0.08/sh, compared to a net loss of $3.1 million, or a loss of $0.29/sh, last year. We had projected revenue of $106.8 million and a net loss of $26 million, or a loss of $1.57/sh.

Development Continues. YTD, FAT has opened 66 restaurants, including 25 in 2Q and the Company remains on track to open 175 locations in 2023. YTD, over 150 new franchise agreements have been signed, bringing the total pipeline to over 1,100 signed agreements.


Get the Full Report

Equity Research is available at no cost to Registered users of Channelchek. Not a Member? Click ‘Join’ to join the Channelchek Community. There is no cost to register, and we never collect credit card information.

This Company Sponsored Research is provided by Noble Capital Markets, Inc., a FINRA and S.E.C. registered broker-dealer (B/D).

*Analyst certification and important disclosures included in the full report. NOTE: investment decisions should not be based upon the content of this research summary. Proper due diligence is required before making any investment decision. 

Commercial Vehicle Group, Inc. (CVGI) – Post Call Commentary – Continuing to Implement the Strategy


Thursday, August 03, 2023

Joe Gomes, Managing Director, Equity Research Analyst, Generalist , Noble Capital Markets, Inc.

Joshua Zoepfel, Research Associate, Noble Capital Markets, Inc.

Refer to the full report for the price target, fundamental analysis, and rating.

The Strategy is Working. We would reiterate what we have previously noted: the strategy is working. Once again, CVG posted record quarterly revenue and improved margins for the quarter. We believe CVG is at an inflection point for improved growth and margins. The Company is well on its way to achieving its 2027 goal of $1.5 billion in revenue and 9% adjusted EBITDA margin, in our view.

Continue to Add New Business. CVG recorded approximately $40 million of new business wins in the quarter, increasing the YTD number to $125 million, rapidly approaching the already upward revised 2023 goal of $150 million of new business wins. The majority of new business wins continue to be within the Electrical Systems segment.


Get the Full Report

Equity Research is available at no cost to Registered users of Channelchek. Not a Member? Click ‘Join’ to join the Channelchek Community. There is no cost to register, and we never collect credit card information.

This Company Sponsored Research is provided by Noble Capital Markets, Inc., a FINRA and S.E.C. registered broker-dealer (B/D).

*Analyst certification and important disclosures included in the full report. NOTE: investment decisions should not be based upon the content of this research summary. Proper due diligence is required before making any investment decision. 

Commercial Vehicle Group, Inc. (CVGI) – A First Look at 2Q23 Results


Wednesday, August 02, 2023

Joe Gomes, Managing Director, Equity Research Analyst, Generalist , Noble Capital Markets, Inc.

Joshua Zoepfel, Research Associate, Noble Capital Markets, Inc.

Refer to the full report for the price target, fundamental analysis, and rating.

Solid Top Line Results. CVGI had a solid quarter with revenues of $262.2 million, up 4.5% from the $250.8 million the prior year. We had revenue at $265 million. The higher revenue was driven by strong price realization, which drove revenue across three segments, partially offset by sales volume decreases in the Industrial Automation segment. Foreign currency translation favorably impacted second quarter 2023 revenues by $0.7 million, or 0.3%.

Even Better Bottom Line. Net income for the quarter was $10.1 million, or EPS of $0.30 per share. Adjusted EPS was $0.32. We had forecast net income of $8.7 million, or EPS of $0.26. New business, price realization, and cost reduction efforts all positively impacted the bottom line. Adjusted EBITDA came in at $20.8 million, or a 7.9% margin, up from $12.4 million and 4.9%.


Get the Full Report

Equity Research is available at no cost to Registered users of Channelchek. Not a Member? Click ‘Join’ to join the Channelchek Community. There is no cost to register, and we never collect credit card information.

This Company Sponsored Research is provided by Noble Capital Markets, Inc., a FINRA and S.E.C. registered broker-dealer (B/D).

*Analyst certification and important disclosures included in the full report. NOTE: investment decisions should not be based upon the content of this research summary. Proper due diligence is required before making any investment decision. 

Release – ACCO Brands Corporation Declares Quarterly Dividend

Research News and Market Data on ACCO

08/01/2023

LAKE ZURICH, Ill.–(BUSINESS WIRE)– ACCO Brands Corporation (NYSE: ACCO) today announced that its board of directors has declared a quarterly cash dividend of $0.075 per share. The dividend will be paid on September 12, 2023, to stockholders of record as of the close of business on August 22, 2023.

“This is the Company’s 23rd quarterly cash dividend since it began paying dividends in 2018. The Company’s dividend has become an important part of our capital allocation strategy and we remain committed to supporting our quarterly dividend with our robust free cash flow. At the current stock price, on an annualized basis, our shareholders are receiving an almost 5% yield on their investment,” said Boris Elisman, Chairman and Chief Executive Officer of ACCO Brands.

About ACCO Brands Corporation

ACCO Brands, the Home of Great Brands Built by Great People, designs, manufactures and markets consumer and end-user products that help people work, learn, play and thrive. Our widely recognized brands include AT-A-GLANCE®, Five Star®, Kensington®, Leitz®, Mead®, PowerA®, Swingline®, Tilibra® and many others. More information about ACCO Brands Corporation (NYSE: ACCO) can be found at www.accobrands.com.

Chris McGinnis
Investor Relations
(847) 796-4320

Lori Conley
Media Relations
(937) 495-4949

Source: ACCO Brands Corporation

Release – The ODP Corporation to Announce Second Quarter 2023 Results Wednesday, August 9, 2023

Research News and Market Data on ODP

BOCA RATON, Fla.–(BUSINESS WIRE)–Jul. 26, 2023– The ODP Corporation (“ODP,” or the “Company”) (NASDAQ:ODP), a leading provider of business services, products and digital workplace technology solutions to businesses and consumers will announce second quarter 2023 financial results before the market open on Wednesday, August 9th, 2023. The ODP Corporation will webcast a call with financial analysts and investors that day at 9:00 am Eastern Time which will be accessible to the media and the general public.

To listen to the conference call via webcast, please visit The ODP Corporation’s Investor relations website at investor.theodpcorp.com. A replay of the webcast will be available approximately two hours following the event. A copy of the earnings press release, supplemental financial disclosures and presentation will also be available on the website.

About The ODP Corporation

The ODP Corporation (NASDAQ:ODP) is a leading provider of products and services through an integrated business-to-business (B2B) distribution platform and omnichannel presence, which includes world-class supply chain and distribution operations, dedicated sales professionals, a B2B digital procurement solution, online presence and a network of Office Depot and OfficeMax retail stores. Through its operating companies Office Depot, LLC; ODP Business Solutions, LLC; Veyer, LLC; and Varis, Inc., The ODP Corporation empowers every business, professional, and consumer to achieve more every day. For more information, visit theodpcorp.com.

ODP and ODP Business Solutions are trademarks of ODP Business Solutions, LLC. Office Depot is a trademark of The Office Club, LLC. OfficeMax is a trademark of OMX, Inc. Veyer is a trademark of Veyer, LLC. Varis is a trademark of Varis Inc. Grand&Toy is a trademark of Grand & Toy, LLC in Canada. Any other product or company names mentioned herein are the trademarks of their respective owners.

Tim Perrott
Investor Relations
561-438-4629
[email protected]

Source: The ODP Corporation

Release – ACCO Brands Corporation Announces Second Quarter 2023 Earnings Webcast

Research News and Market Data on ACCO

07/25/2023

LAKE ZURICH, Ill.–(BUSINESS WIRE)– ACCO Brands Corporation (NYSE: ACCO) today announced that it will release its second quarter 2023 earnings after the market close on August 8, 2023. The Company will host a conference call and webcast to discuss the results on August 9 at 8:30 a.m. EST. The webcast can be accessed through the Investor Relations section of www.accobrands.com and will be available for replay.

About ACCO Brands Corporation

ACCO Brands, the Home of Great Brands Built by Great People, designs, manufactures and markets consumer and end-user products that help people work, learn, play and thrive. Our widely recognized brands include AT-A-GLANCE®, Five Star®, Kensington®, Leitz®, Mead®, PowerA®, Swingline®, Tilibra® and many others. More information about ACCO Brands Corporation (NYSE: ACCO) can be found at www.accobrands.com.

Christopher McGinnis
Investor Relations
(847) 796-4320

Lori Conley
Media Relations
(937) 495-4949

Source: ACCO Brands Corporation
Release – The ODP Corporation Celebrates Sixth Year of its Start Proud! Program, Donates $2.5 Million in Back-to-School Essentials for Title I Schools Nationwide

Research News and Market Data on ODP

The Company’s Start Proud!® Community Investment Program Empowers Students and Teachers to Start the New School Year Feeling Confident, Prepared and Proud

BOCA RATON, Fla.–(BUSINESS WIRE)–Jul. 24, 2023– The ODP Corporation (NASDAQ:ODP), a leading provider of products and services through an integrated business-to-business (B2B) distribution platform and omnichannel presence, today announced that over $2.5 million worth of educational supplies and equipment will be provided to students and teachers of Title I elementary schools across the country as a result of The ODP Corporation’s philanthropic program Start Proud!® and the generosity of our many vendor partners, including Boise Paper, Domtar and Crayola®.

Celebrating the sixth anniversary of the program, associate volunteers from The ODP Corporation—including Office Depot, ODP Business Solutions and VEYER—assembled 18,000 premium backpacks filled with over $2 million worth of school supplies—like notebooks, composition books, pencils, highlighters and more—to provide to students at nearly 30 Title I schools nationwide. Each backpack includes a box of Crayola® crayons as part of a donation valued at $50,000 from Crayola® to the Start Proud!® program.

The second portion of Start Proud!® kicks off in late September through October with a series of Title I teacher shopping sprees. With support from Domtar and Boise Paper, each school will also receive $20,000 in-store credit at Office Depot OfficeMax to benefit teachers by helping them with critical classroom essentials. This benefit helps alleviate the out-of-pocket purchases made by teachers, averaging $750–$1,000 each school year.1,2

“Caring for the communities in which we live and work is a huge component of our culture, which we’re demonstrating by supporting students, families and teachers each year,” said Gerry Smith, chief executive officer for The ODP Corporation. “As high inflation continues to impact families and teachers across the nation, our steadfast commitment to Start Proud!® enables students to start this school year confident, prepared and proud.”

The backpacks will be distributed at Start Proud!® signature on-campus school pep rallies throughout August and September, where school administrators, teachers and The ODP Corporation associates are teaming up to host the celebratory events, unveil the donations and welcome students back to school during their first week. Eighteen exemplary teachers will also be selected by their principals and surprised with an All-Star Teacher award in recognition of their dedication to education and extraordinary contributions to the students beyond the classroom. Each All-Star Teacher will be surprised with products including new technology, furniture and teaching supplies valued at over $2,000.

The continued commitment to leading philanthropic initiatives like Start Proud!® demonstrates The ODP Corporation’s dedication to supporting families and teachers nationwide.

Source: AdoptAClassroom.org, Teachers Spend $745 a Year on Supplies: The Cost of Distance Learning, June 15, 2020.
2 Source: NewsDirect, Teachers Spending More Out of Pocket on School Supplies Than Ever Before, August 18, 2021.

About The ODP Corporation
The ODP Corporation (NASDAQ:ODP) is a leading provider of products and services through an integrated business-to-business (B2B) distribution platform and omnichannel presence, which includes world-class supply chain and distribution operations, dedicated sales professionals, a B2B digital procurement solution, online presence and a network of Office Depot and OfficeMax retail stores. Through its operating companies Office Depot, LLC; ODP Business Solutions, LLC; Veyer, LLC; and Varis, Inc., The ODP Corporation empowers every business, professional, and consumer to achieve more every day. For more information, visit theodpcorp.com.

ODP and ODP Business Solutions are trademarks of ODP Business Solutions, LLC. Office Depot is a trademark of The Office Club, LLC. OfficeMax is a trademark of OMX, Inc. Veyer is a trademark of Veyer, LLC. Varis is a trademark of Varis, Inc. Any other product or company names mentioned herein are the trademarks of their respective owners.

Jennifer Robins
Media Relations
[email protected]

Swati Joshi
Media Relations
[email protected]

Source: The ODP Corporation

Release – Fatburger Rides into Six Flags Fiesta Texas

Research News and Market Data on FAT

JULY 24, 2023

All-American Burger Chain Continues Amusement Park Growth with New San Antonio Location

LOS ANGELES, July 24, 2023 (GLOBE NEWSWIRE) — FAT (Fresh. Authentic. Tasty.) Brands Inc., parent company of Fatburger and 16 other restaurant concepts, announces the opening of Fatburger in San Antonio at Six Flags Fiesta Texas. This marks the sixth Fatburger in Texas to date with an additional 40-plus locations set to open in the state over the next 10 years.

“Last year, Fatburger opened its first Six Flags location at Six Flags Great Adventure in New Jersey,” said Jake Berchtold, COO of FAT Brands’ Fast Casual Division. “Since opening, the location has exceeded expectations, so we are thrilled to now be able to expand this partnership with a new restaurant at Six Flags Fiesta Texas. Parkgoers, locals and tourists alike, can now get a taste of Fatburger’s delicious, custom-built burgers in San Antonio!”

Ever since the first Fatburger opened in Los Angeles 70 years ago, the chain has been known for its delicious, grilled-to-perfection and cooked to order burgers. Founder Lovie Yancey believed that a big burger with everything on it is a meal in itself; at Fatburger “everything” is not just the usual roster of toppings. Burgers can be customized with everything from bacon and eggs to chili and onion rings. In addition to its famous burgers, the Fatburger menu also includes Fat and Skinny Fries, sweet potato fries, scratch-made onion rings, Impossible Burgers, turkeyburgers, hand-breaded crispy chicken sandwiches, and hand-scooped milkshakes made from 100% real ice cream.

The new Fatburger Six Flags Fiesta Texas restaurant is located at 17000 West Interstate 10, San Antonio, TX 78257.

For more information or to find a Fatburger near you, please visit www.fatburger.com.

About FAT (Fresh. Authentic. Tasty.) Brands
FAT Brands (NASDAQ: FAT) is a leading global franchising company that strategically acquires, markets, and develops fast casual, quick-service, casual dining, and polished casual dining concepts around the world. The Company currently owns 17 restaurant brands: Round Table Pizza, Fatburger, Marble Slab Creamery, Johnny Rockets, Fazoli’s, Twin Peaks, Great American Cookies, Hot Dog on a Stick, Buffalo’s Cafe & Express, Hurricane Grill & Wings, Pretzelmaker, Elevation Burger, Native Grill & Wings, Yalla Mediterranean and Ponderosa and Bonanza Steakhouses, and franchises and owns over 2,300 units worldwide. For more information on FAT Brands, please visit www.fatbrands.com.

About Fatburger
An all-American, Hollywood favorite, Fatburger is a fast-casual restaurant serving big, juicy, tasty burgers, crafted specifically to each customer’s liking. With a legacy spanning 70 years, Fatburger’s extraordinary quality and taste inspire fierce loyalty amongst its fan base, which includes a number of A-list celebrities and athletes. Featuring a contemporary design and ambiance, Fatburger offers an unparalleled dining experience, demonstrating the same dedication to serving gourmet, homemade, custom-built burgers as it has since 1952 – The Last Great Hamburger Stand. For more information, visit www.fatburger.com.

About Six Flags Entertainment Corporation
Six Flags Entertainment Corporation is the world’s largest regional theme park company with 27 parks across the United States, Mexico and Canada. For nearly 62 years, Six Flags has entertained hundreds of millions of guests with world-class coasters, themed rides, thrilling water parks and unique attractions. Six Flags is committed to creating an inclusive environment that fully embraces the diversity of our team members and guests. For more information, visit www.sixflags.com.

Forward Looking Statements

This press release contains forward-looking statements within the meaning of the Private Securities Litigation Reform Act of 1995, including statements relating to the timing and performance of new store openings. Forward-looking statements reflect expectations of FAT Brands Inc. (“we”, “our” or the “Company”) concerning the future and are subject to significant business, economic and competitive risks, uncertainties and contingencies, including but not limited to uncertainties surrounding the severity, duration and effects of the COVID-19 pandemic. These factors are difficult to predict and beyond our control, and could cause our actual results to differ materially from those expressed or implied in such forward-looking statements. We refer you to the documents that we file from time to time with the Securities and Exchange Commission, such as our reports on Form 10-K, Form 10-Q and Form 8-K, for a discussion of these and other factors. We undertake no obligation to update any forward-looking statement to reflect events or circumstances occurring after the date of this press release.

MEDIA C ONTACT :
Erin Mandzik, FAT Brands
[email protected]
860-212-6509