FTX, What Happened and Should Non-Crypto Investors Care

Image Credit: Phillip Pessar (Flickr)

Dramatic Collapse of the Cryptocurrency Exchange FTX Contains Lessons for Investors but Won’t Affect Most People

In the fast-paced world of cryptocurrency, vast sums of money can be made or lost in the blink of an eye. In early November 2022, the second-largest cryptocurrency exchange, FTX, was valued at more than US$30 billion. By Nov. 14, FTX was in bankruptcy proceedings along with more than 100 companies connected to it. D. Brian Blank and Brandy Hadley are professors who study finance, investing and fintech. They explain how and why this incredible collapse happened, what effect it might have on the traditional financial sector and whether you need to care if you don’t own any cryptocurrency.

What Happened?

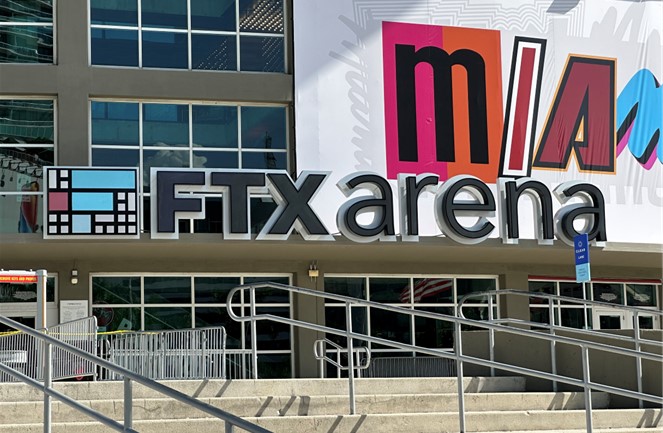
In 2019, Sam Bankman-Fried founded FTX, a company that ran one of the largest cryptocurrency exchanges.

FTX is where many crypto investors trade and hold their cryptocurrency, similar to the New York Stock Exchange for stocks. Bankman-Fried is also the founder of Alameda Research, a hedge fund that trades and invests in cryptocurrencies and crypto companies.

Sam Bankman-Fried founded both FTX and the investment firm Alameda Research. News sources have reported some less-than-responsible financial dealings between the two companies. Image via The Conversation.

Within the traditional financial sector, these two companies would be separate firms entirely or at least have divisions and firewalls in place between them. But in early November 2022, news outlets reported that a significant proportion of Alameda’s assets were a type of cryptocurrency released by FTX itself.

A few days later, news broke that FTX had allegedly been loaning customer assets to Alameda for risky trades without the consent of the customers and also issuing its own FTX cryptocurrency for Alameda to use as collateral. As a result, criminal and regulatory investigators began scrutinizing FTX for potentially violating securities law.

These two pieces of news basically led to a bank run on FTX.

Large crypto investors, like FTX’s competitor Binance, as well as individuals, began to sell off cryptocurrency held on FTX’s exchange. FTX quickly lost its ability to meet customer withdrawals and halted trading. On Nov. 14, FTX was also hit by an apparent insider hack and lost $600 million worth of cryptocurrency.

That same day, FTX, Alameda Research and 130 other affiliated companies founded by Bankman-Fried filed for bankruptcy. This action may leave more than a million suppliers, employees and investors who bought cryptocurrencies through the exchange or invested in these companies with no way to get their money back.

Among the groups and individuals who held currency on the FTX platform were many of the normal players in the crypto world, but a number of more traditional investment firms also held assets within FTX. Sequoia Capital, a venture capital firm, as well as the Ontario Teacher’s Pension, are estimated to have held millions of dollars of their investment portfolios in ownership stake of FTX. They have both already written off these investments with FTX as lost.

Image: OTPP

Did a Lack of Oversight Play a Role?

In traditional markets, corporations generally limit the risk they expose themselves to by maintaining liquidity and solvency. Liquidity is the ability of a firm to sell assets quickly without those assets losing much value. Solvency is the idea that a company’s assets are worth more than what that company owes to debtors and customers.

But the crypto world has generally operated with much less caution than the traditional financial sector, and FTX is no exception. About two-thirds of the money that FTX owed to the people who held cryptocurrency on its exchange – roughly $11.3 billion of $16 billion owed – was backed by illiquid coins created by FTX. FTX was taking its customers’ money, giving it to Alameda to make risky investments and then creating its own currency, known as FTT, as a replacement – cryptocurrency that it was unable to sell at a high enough price when it needed to.

In addition, nearly 40% of Alameda’s assets were in FTX’s own cryptocurrency – and remember, both companies were founded by the same person.

This all came to a head when investors decided to sell their coins on the exchange. FTX did not have enough liquid assets to meet those demands. This, in turn, drove the value of FTT from over $26 a coin at the beginning of November to under $2 by Nov. 13. By this point, FTX owed more money to its customers than it was worth.

In regulated exchanges, investing with customer funds is illegal. Additionally, auditors validate financial statements, and firms must publish the amount of money they hold in reserve that is available to fund customer withdrawals. And even if things go wrong, the Securities Investor Protection Corporation – or SIPC – protects depositors against the loss of investments from an exchange failure or financially troubled brokerage firm. None of these guardrails are in place within the crypto world.

Why is this a Big Deal in Crypto?

As a result of this meltdown, the company Binance is now considering creating an industry recovery fund – akin to a private version of SIPC insurance – to avoid future failures of crypto exchanges.

But while the collapse of FTX and Alameda – valued at more than $30 billion and now essentially worth nothing – is dramatic, the bigger implication is simply the potential lost trust in crypto. Bank runs are rare in traditional financial institutions, but they are increasingly common in the crypto space. Given that Bankman-Fried and FTX were seen as some of the biggest, most trusted figures in crypto, these events may lead more investors to think twice about putting money in crypto.

If I Don’t Own Crypto, Should I Care?

Though investment in cryptocurrencies has grown rapidly, the entire crypto market – valued at over $3 trillion at its peak – is much smaller than the $120 trillion traditional stock market.

While investors and regulators are still evaluating the consequences of this fall, the impact on any person who doesn’t personally own crypto will be minuscule. It is true that many larger investment funds, like BlackRock and the Ontario Teachers Pension, held investments in FTX, but the estimated $95 million the Ontario Teachers Pension lost through the collapse of FTX is just 0.05% of the entire fund’s investments.

The takeaway for most individuals is not to invest in unregulated markets without understanding the risks. In high-risk environments like crypto, it’s possible to lose everything – a lesson investors in FTX are learning the hard way.

This article was republished with permission from The Conversation, a news site dedicated to sharing ideas from academic experts. It represents the research-based findings and thoughts of D. Brian Blank, Assistant Professor of Finance, Mississippi State University and Brandy Hadley, Associate Professor of Finance and the David A. Thompson Professor in Applied Investments, Appalachian State University

Blackboxstocks (BLBX) – Gearing Up for Next Year, Lowering Price Target


Wednesday, November 16, 2022

Blackboxstocks, Inc. is a financial technology and social media hybrid platform offering real-time proprietary analytics and news for stock and options traders of all levels. Our web-based software employs “predictive technology” enhanced by artificial intelligence to find volatility and unusual market activity that may result in the rapid change in the price of a stock or option. Blackbox continuously scans the NASDAQ, New York Stock Exchange, CBOE, and all other options markets, analyzing over 10,000 stocks and up to 1,500,000 options contracts multiple times per second. We provide our users with a fully interactive social media platform that is integrated into our dashboard, enabling our users to exchange information and ideas quickly and efficiently through a common network. We recently introduced a live audio/video feature that allows our members to broadcast on their own channels to share trade strategies and market insight within the Blackbox community. Blackbox is a SaaS company with a growing base of users that spans 42 countries; current subscription fees are $99.97 per month or $959.00 annually. For more information, go to: www.blackboxstocks.com .

Joe Gomes, Senior Research Analyst, Noble Capital Markets, Inc.

Joshua Zoepfel, Research Associate, Noble Capital Markets, Inc.

Refer to the full report for the price target, fundamental analysis, and rating.

3Q Results. Revenue for the quarter was $1.22 million, a decrease from last year’s $1.47 million and in-line with our estimate of $1.21 million. The average users were down as well in the quarter, 5,197 compared to 5,535 a year ago and 6,181 in the second quarter. The Company reported a net loss of $1.31 million, or ($0.10) per share, versus a net loss of $505,976 or ($0.05) last year. We estimated a net loss of $1.29 million or ($0.10).

Tough Environment, but a Silver Lining. Continued poor performance in the stock market, along with high inflation and sluggish GDP, has caused the Company to see decreases in overall performance year-over-year. However, the Company will have a Black Friday/Cyber Monday promotion that we believe will attract new users and bring back past users.


Get the Full Report

This Company Sponsored Research is provided by Noble Capital Markets, Inc., a FINRA and S.E.C. registered broker-dealer (B/D).

*Analyst certification and important disclosures included in the full report. NOTE: investment decisions should not be based upon the content of this research summary. Proper due diligence is required before making any investment decision. 

Artemis Program to Benefit Many Companies

Image Courtesy of Aerojet Rocketdyne

Billions in Artemis Program Budget Could Cause these Companies to Rocket

What companies could gain from the Artemis missions to the moon?

The multibillion-dollar Artemis program has been unfolding over the past several years. The most recent success is the 322-foot-tall Space Launch System (SLS), the most powerful rocket NASA has developed, and the Orion spacecraft. This is all designed to, in time, safely carry astronauts to the moon’s orbit and provide a platform for the U.S. to return to the moon’s surface for the first time since 1972.

The mission of Artemis One is to test a powerful NASA rocket called the Space Launch System, as well as the Orion spacecraft that the rocket will ferry into orbit. After the Florida launch, NASA plans to use the SLS rocket to direct Orion on a route around the moon, after which the vehicle’s crewless capsule will return to Earth and parachute into the Pacific Ocean. Those steps represent another trial geared toward ensuring the Orion crew module can safely bring astronauts back from orbit.

The initial mission will help set the stage for a crewed mission to the moon that NASA hopes to conduct as early as 2025. These efforts will entail higher technology and special equipment designed especially for a unique purpose. With billions being spent, investors may ask what companies may benefit. Obviously, the major contractors, then subcontractors and material suppliers.

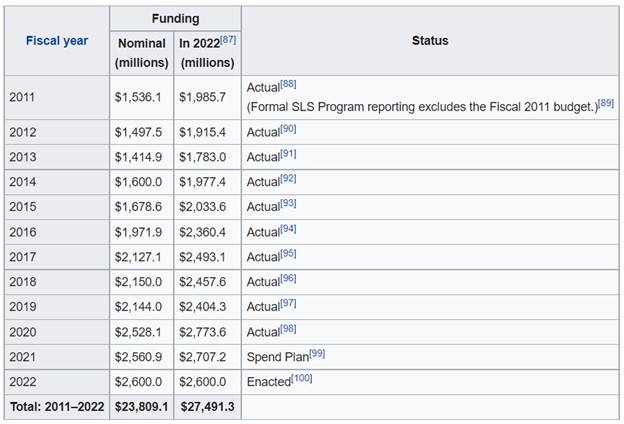
The cost of SLS is shown above. Additionally, the cost to assemble, integrate, prepare and launch the SLS and its payloads are funded separately under Exploration Ground Systems, currently at about $600 million per year. (Source:Wikipedia)

Major Contractors

Keeping in mind that an unsuccessful launch could weigh on these companies, as much as they may be propelled by continued success, these are prime contractors. NASA’s prime contractors for the rock launch system is Aerojet Rocketdyne (AJRD), Boeing (NYSE: BA), and Northrop Grumman (NOC). As a note, AJRD showed up as one of 5 portfolio holdings of hedge fund manager Michael Burry.

Lockheed Martin (LMT) is the prime contractor on the Orion spacecraft, while NASA’s prime contractors for the rocket launch system include Redwire’s (RDW) critical sun sensor components and advanced optical imaging technologies, they will be launching on NASA’s Orion spacecraft as a part of the space agency’s Artemis One mission. Aeva Technologies (AEVA) is also involved with a LiDAR-based mobile terrain-mapping and navigation system for lunar and other planet exploration, while KULR Technology Group (KULR) has a battery safety contract with NASA to test its lithium-ion cells going into battery packs designed for the Artemis Program.

Raytheon Technologies'(RTX) was selected to advance spacewalking capabilities in low-Earth orbit and on the Moon. Goodyear Tire & Rubber (GT) has been contracted to develop tires to perform on the lunar surface.

Rocket Lab (RKLB) has been called upon to test new orbits around the moon. For communications, Lockheed Martin (LMT), Amazon (AMZN), and Cisco (CSCO) are working in conjunction to develop a new voice, AI, and tablet-based video technologies for use around the moon.

The companies being called upon is expected to grow rapidly after scientific experiments begin on the moon’s surface.

Paul Hoffman

Managing Editor, Channelchek

Sources

https://en.wikipedia.org/wiki/Space_Launch_System#:~:text=The%20Space%20Launch%20System%20(abbreviated,2022%20from%20Kennedy%20Space%20Center.

https://www.wsj.com/articles/artemis-i-launch-moon-mission-nasa-11668529576?mod=Searchresults_pos1&page=1

https://seekingalpha.com/news/3877127-nasa-is-going-to-the-moon-will-these-stocks-benefit

Voyager Digital (VYGVQ) – FTX’s Fall Impacts Voyager


Monday, November 14, 2022

Voyager Digital Ltd.’s (TSX: VOYG) (OTCQX: VYGVF) (FRA: UCD2) US subsidiary, Voyager Digital, LLC, is a fast-growing cryptocurrency platform in the United States founded in 2018 to bring choice, transparency, and cost-efficiency to the marketplace. Voyager offers a secure way to trade over 100 different crypto assets using its easy-to-use mobile application. Through its subsidiary Coinify ApS, Voyager provides crypto payment solutions for both consumers and merchants around the globe. To learn more about the company, please visit https://www.investvoyager.com.

Joe Gomes, Senior Research Analyst, Noble Capital Markets, Inc.

Joshua Zoepfel, Research Associate, Noble Capital Markets, Inc.

Refer to the full report for the price target, fundamental analysis, and rating.

The Collapse of FTX.  As widely reported, on Friday cryptocurrency exchange FTX filed for Chapter 11 bankruptcy protection in the U.S. Included in the filing is subsidiary FTX US, the entity that had won the auction process for Voyager.

The Old Deal. Recall, back in October, the Bankruptcy Court approved Voyager’s entry into an asset purchase agreement between FTX US and Voyager. FTX US’s bid was valued at approximately $1.422 billion. Voyager’s claims against Three Arrows Capital would have remained with the bankruptcy estate and any recovery on account of the 3AC claims would have been available for additional distribution to Voyager creditors.


Get the Full Report

This Company Sponsored Research is provided by Noble Capital Markets, Inc., a FINRA and S.E.C. registered broker-dealer (B/D).

*Analyst certification and important disclosures included in the full report. NOTE: investment decisions should not be based upon the content of this research summary. Proper due diligence is required before making any investment decision. 

TAAL Distributed Information Technologies (TAALF) – Reports Third Quarter Results


Monday, November 14, 2022

TAAL Distributed Information Technologies Inc. delivers value-added blockchain services, providing professional-grade, highly scalable blockchain infrastructure and transactional platforms to support businesses building solutions and applications upon the BitcoinSV platform, and developing, operating, and managing distributed computing systems for enterprise users.

Joe Gomes, Senior Research Analyst, Noble Capital Markets, Inc.

Joshua Zoepfel, Research Associate, Noble Capital Markets, Inc.

Refer to the full report for the price target, fundamental analysis, and rating.

3Q 2022 Results. Revenue totaled CAD$4.4 million for the quarter (all figures in CAD), or a decrease from the prior year’s $12.3 million, and is down sequentially from $7.3 million the previous quarter. The decrease from the prior year and quarter is due to the continuation of the macro trend in cryptocurrency with decreasing prices. Net loss for TAAL was $4.9 million, or diluted EPS of ($0.14), compared to net income of $2.1 million last year, or $0.05. We would note TAAL still does not have an auditor so all statements were prepared solely by management.

Continued Challenging Environment. The Company noted the continued volatility of the cryptocurrency prices, including the Company’s main coins, Bitcoin Core (“BTC”), BitcoinSV (“BSV”) and Bitcoin Cash (“BCH”). For BSV, the price of the coin was approximately $67 on September 30, 2022, and is now $52 as of November 10, 2022. 


Get the Full Report

This Company Sponsored Research is provided by Noble Capital Markets, Inc., a FINRA and S.E.C. registered broker-dealer (B/D).

*Analyst certification and important disclosures included in the full report. NOTE: investment decisions should not be based upon the content of this research summary. Proper due diligence is required before making any investment decision. 

One Stop Systems (OSS) – A Record Revenue Quarter


Friday, November 11, 2022

One Stop Systems, Inc. (OSS) designs and manufactures innovative AI Transportable edge computing modules and systems, including ruggedized servers, compute accelerators, expansion systems, flash storage arrays, and Ion Accelerator™ SAN, NAS, and data recording software for AI workflows. These products are used for AI data set capture, training, and large-scale inference in the defense, oil and gas, mining, autonomous vehicles, and rugged entertainment applications. OSS utilizes the power of PCI Express, the latest GPU accelerators and NVMe storage to build award-winning systems, including many industry firsts, for industrial OEMs and government customers. The company enables AI on the Fly® by bringing AI datacenter performance to ‘the edge,’ especially on mobile platforms, and by addressing the entire AI workflow, from high-speed data acquisition to deep learning, training, and inference. OSS products are available directly or through global distributors. For more information, go to www.onestopsystems.com.

Joe Gomes, Senior Research Analyst, Noble Capital Markets, Inc.

Joshua Zoepfel, Research Associate, Noble Capital Markets, Inc.

Refer to the full report for the price target, fundamental analysis, and rating.

3Q22 Results. Record quarterly revenue of $18.8 million, up 17.7% y-o-y. Consensus was $18.5 million and we also had forecast $18.5 million. OSS reported GAAP net income of $132,533, or $0.01 per share, compared to $980,696, or $0.05 per share last year. Adjusted EPS was $0.03 in 3Q22, compared to $0.08 per share in 3Q21. We were at $0.02 and $0.04, respectively. Consensus was at $0.04 per share.

AI Transportable Business a Contributor. The AI Transportable business posted solid growth in the quarter, with two AI Transportable clients now in the top 10 of OSS’s clients. The Company won six major programs during the quarter, five of which are in the AI Transportables space. At quarter’s end, OSS had 30 pending awards, 18 of which are in the AI Transportables space.


Get the Full Report

This Company Sponsored Research is provided by Noble Capital Markets, Inc., a FINRA and S.E.C. registered broker-dealer (B/D).

*Analyst certification and important disclosures included in the full report. NOTE: investment decisions should not be based upon the content of this research summary. Proper due diligence is required before making any investment decision. 

Big Techs Changing Fortunes, Will they Turn Around?

Image Credit: Tracy LeBlanc (Pexels)

Why Meta’s Share Price Collapse is Good News for the Future of Social Media

Facebook may not be the original social media platform, but it has stood the test of time – until recently. Meta, the company that owns Facebook, Instagram, and WhatsApp, saw its value plummet by around $80 billion (£69 billion) in just one day at the end of October after its third-quarter profits halved amid the global slowdown. Meta is now valued at around $270 billion compared with more than $1 trillion last year.

Several issues have caused investors to turn away from the social media giant, including falling advertising revenue, a conflict with Apple over its app store charging policy, and competition for younger audiences from newer platforms such as TikTok.

Meta’s chief executive Mark Zuckerberg has also used his majority control to double down on his ambitions for the “metaverse”, a virtual reality project on which he has already spent more than $100 billion – with questionable results, according to the initial investor and media reaction. Zuckerberg has promised even more investment in the metaverse next year.

It’s tempting to describe this spending spree as a billionaire’s “insane fantasy”, but there is a simpler explanation. As dominant platforms compete for a limited amount of advertising revenue, regulation – particularly when it differs between countries or regions – has created space for more competitors. This is good news for new social media companies, but it also means that the only way Meta is likely to be able to keep its dominant position is by placing a massive bet on the technology of the future. Zuckerberg believes that means the metaverse, but this remains to be seen.

Tech’s Changing Fortunes

Even with its recent troubles, Meta owns the largest social network in the world. Those recent results that caused investors to flee in their droves still showed total revenues of $27 billion and profits of $4.4 billion.

To maintain its position as the market leader in the past, Meta has typically bought its most promising competitors as early as possible. Integrating these newly acquired startups into the company’s ecosystem helped to maximize advertising revenue and preclude competition.

Research shows that digital markets are typically dominated by a single firm, but also that these firms tend to be much more specialized than the major companies of the past. Meta is only active in social media and makes money almost exclusively by selling advertising.

Attempts by such firms to expand into other areas typically fail – know anyone with a Facebook phone? And while you may not remember Google’s attempt at social media, iPhone users are probably at least aware of Apple’s maps app.

So Facebook relies on consumers using devices produced by other tech companies to make money. But as global social media advertising revenue slows down, this is becoming more difficult. Apple has begun charging Meta for the revenue it makes from iPhone users, for example. And research shows that, when two companies compete to make money from the same captive source, their successive markups not only push prices higher for consumers but also keep profits lower for both firms.

Global Domination Fail

Meta’s strategy has, until recently, allowed it to rule social media in western markets – but not in China, a country of more than 300 million social media users. Since 2009, Facebook has been blocked by the country’s “great firewall”, the largest and most sophisticated system of censorship in the world.

Reported attempts to adapt Facebook to suit Chinese government media control have never been successful. And so, Chinese company ByteDance was able to launch a news platform called Toutiao in 2012 without having to compete with a dominant social network. In 2016, ByteDance launched Douyin, a social media platform for publishing short videos, which was subsequently released to the rest of the world in 2018 as TikTok.

Despite not being profitable, ByteDance’s market capitalization is now estimated at around $300 billion – versus Meta’s current £270 billion valuation. It is also popular among younger users, that tend to be much more avid social media users.

Meta cannot simply buy TikTok: it is too big, not publicly traded and under tight control by the Chinese government. Zuckerberg’s firm has instead tried to compete by launching similar features on Instagram. Ironically, the only large market where this strategy is really working is India, a country that banned TikTok in 2021 due to a military conflict with China.

Fair Competition

At the same time that TikTok has been expanding beyond Meta’s reach, western regulators have also started to examine the impact of the lack of competition in digital markets on innovation. While research shows that the winner-take-all nature of highly innovative markets is typically good for consumers, this is only true when all companies get a fair chance to become dominant.

In addition to recent rulings against tech company dominance by its highest court, the European Union also recently introduced the Digital Markets Act. This outlaws many practices used by dominant firms to preserve their status in a market.

This article was republished with permission from The Conversation, a news site dedicated to sharing ideas from academic experts. It represents the research-based findings and thoughts of Renaud Foucart, Senior Lecturer in Economics, Lancaster University Management School, Lancaster University.

Information Services Group (III) – Post Call Commentary and Updated Models


Monday, November 07, 2022

ISG (Information Services Group) (Nasdaq: III) is a leading global technology research and advisory firm. A trusted business partner to more than 700 clients, including more than 75 of the world’s top 100 enterprises, ISG is committed to helping corporations, public sector organizations, and service and technology providers achieve operational excellence and faster growth. The firm specializes in digital transformation services, including automation, cloud and data analytics; sourcing advisory; managed governance and risk services; network carrier services; strategy and operations design; change management; market intelligence and technology research and analysis. Founded in 2006, and based in Stamford, Conn., ISG employs more than 1,300 digital-ready professionals operating in more than 20 countries—a global team known for its innovative thinking, market influence, deep industry and technology expertise, and world-class research and analytical capabilities based on the industry’s most comprehensive marketplace data. For additional information, visit www.ISG-One.com

Joe Gomes, Senior Research Analyst, Noble Capital Markets, Inc.

Joshua Zoepfel, Research Associate, Noble Capital Markets, Inc.

Refer to the full report for the price target, fundamental analysis, and rating.

Business Remains on Track. Information Services Group remains on track to post record revenue and adjusted EBITDA. According to management, demand remains strong for digital services, driving a strong profitable mix of products and services, while ISG continues to see an uptick in demand for its cost takeout services given the uncertain economic environment.

Priming the Pump for Additional Growth. ISG added 56 professionals during the quarter, an increase of 3.8%. The new hires are expected to focus on the higher growth digital and recurring revenue opportunities. During the quarter, ISG serviced 625 clients, including 65 new to ISG, both up from the prior year and quarter-over-quarter.


Get the Full Report

This Company Sponsored Research is provided by Noble Capital Markets, Inc., a FINRA and S.E.C. registered broker-dealer (B/D).

*Analyst certification and important disclosures included in the full report. NOTE: investment decisions should not be based upon the content of this research summary. Proper due diligence is required before making any investment decision. 

Release – ISG Acquires Change 4 GrowthRelease

Research, News, and Market Data on III

11/3/2022

Acquisition creates a global powerhouse in change management

STAMFORD, Conn., November 3, 2022 ― Information Services Group (ISG) (Nasdaq: III), a leading global technology research and advisory firm, today announced it has acquired Change 4 Growth, an award-winning company specializing in transformational change for enterprises.

Founded in 2017, Change 4 Growth offers market-leading change solutions and expertise to support large-scale business transformations involving people, process and technology. Last year it was named a top 10 change management company in the U.S. by Manage HR magazine.

“The combination of Change 4 Growth and our existing ISG Enterprise Change business creates a global powerhouse in change management at a time when demand for such services is expected to grow significantly,” said Michael P. Connors, chairman and CEO of ISG. “Enterprises are in a state of continuous transformation, as they adjust to new technologies, new competitors, and ever-changing market forces. To be successful, they need a highly adaptable, change-ready workforce.”

The combined business will go to market as ISG Enterprise Change with capabilities in organizational change management (OCM), communications, training development and delivery, leadership development, mentoring, Diversity, Equity and Inclusion (DEI) programs, executive coaching and culture change.

“Transformational change is a complex journey best undertaken with a strong and knowledgeable partner,” said Beth Thomas, CEO and founder of Change 4 Growth, who has been named partner and co-leader of ISG Enterprise Change. “Together, we will offer unrivalled expertise, methodologies and tools to help our clients build and sustain change-capable organizations. We could not be more excited to be joining ISG and expanding the reach of both firms’ industry-leading solutions.”

Among those solutions is ATLAS™, a transformational change platform developed by Change 4 Growth that provides access to OCM templates and tools for greater efficiency and gives clients real-time visibility via dashboards into the progress and health of their business transformations. ISG Enterprise Change intends to offer this new solution to its clients immediately.

Change 4 Growth and ISG Enterprise Change together have successfully conducted more than 1,000 change management engagements involving more than 5 million employees. The two businesses have served more than 300 clients in industries including retail, automotive, manufacturing, banking and financial services, insurance, utilities and healthcare.

For more information about ISG’s OCM services, visit the ISG website.

About ISG

ISG (Information Services Group) (Nasdaq: III) is a leading global technology research and advisory firm. A trusted business partner to more than 800 clients, including more than 75 of the world’s top 100 enterprises, ISG is committed to helping corporations, public sector organizations, and service and technology providers achieve operational excellence and faster growth. The firm specializes in digital transformation services, including automation, cloud and data analytics; sourcing advisory; managed governance and risk services; network carrier services; strategy and operations design; change management; market intelligence and technology research and analysis. Founded in 2006, and based in Stamford, Conn., ISG employs more than 1,300 digital-ready professionals operating in more than 20 countries—a global team known for its innovative thinking, market influence, deep industry and technology expertise, and world-class research and analytical capabilities based on the industry’s most comprehensive marketplace data. For more information, visit www.isg-one.com.

Release – Information Services Group Announces Third-Quarter 2022 Results and Acquisition of Change 4 GrowthRelease

Research, News, and Market Data on III

11/3/2022

  • Reports third-quarter GAAP revenues of $69 million, reflecting negative FX impact of $4 million
  • Reports net income of $6 million, GAAP EPS of $0.11 and adjusted EPS of $0.14
  • Reports adjusted EBITDA of $11 million
  • Achieves record year-to-date results: GAAP revenues of $212 million, up 6% in constant currency; net income of $15 million, up 29%; adjusted EBITDA of $32 million, up 12%; GAAP EPS of $0.30, up 30%; adjusted EPS of $0.40, up 18%
  • Returns $7 million to shareholders in the form of share repurchases and dividends in Q3
  • Declares fourth-quarter dividend of $0.04 per share, payable December 19 to record holders as of December 5
  • Acquires Change 4 Growth; bolt-on strengthens enterprise change capabilities
  • Sets fourth-quarter guidance for achieving record full-year revenue and EBITDA performance: revenues between $70 million and $72 million and adjusted EBITDA between $10 million and $11 million

STAMFORD, Conn.–(BUSINESS WIRE)– Information Services Group (ISG) (Nasdaq: III), a leading global technology research and advisory firm, today announced financial results for the third quarter ended September 30, 2022.

“ISG remains on track to deliver record full-year revenue and profitability after another solid operating performance in Q3,” said Michael P. Connors, chairman and CEO. “Despite macroeconomic headwinds, in the third quarter we delivered double-digit growth in recurring revenues, as well as in Europe, on an operating basis. Our product mix of higher-margin digital advisory, research and platform services drove the expansion of our adjusted EBITDA margin to 16 percent, our highest-ever quarterly margin.”

Change 4 Growth Acquisition

ISG said today it has acquired Change 4 Growth, a business specializing in transformational change for enterprises. Founded in 2017, Change 4 Growth offers market-leading change solutions and expertise to support large-scale business transformations involving people, process and technology.

“The combination of Change 4 Growth and our existing ISG Enterprise Change business creates a global powerhouse in change management at a time when demand for such services is expected to grow significantly,” said Connors.

ISG estimates demand for organizational change management (OCM) services will grow at a compound annual rate of more than 15 percent over the next five years, as companies continuously adjust to new technologies, new competitors, and ever-changing market forces.

With the acquisition, Connors noted that ISG adds a new platform solution, ATLAS™, that provides access to OCM templates and tools for greater engagement efficiency and gives clients real-time visibility via dashboards into the progress and health of their business transformations.

Third-Quarter 2022 Results

Reported revenues for the third quarter were $68.8 million, down 3 percent from $71.1 million in the prior year, and up 2 percent in constant currency. Currency translation negatively impacted reported revenues by $4.0 million versus the prior year. Reported revenues were $42.2 million in the Americas, down 2 percent versus the prior year, impacted by the completion of a large Automation engagement; $19.3 million in Europe, down 4 percent versus the prior year on a reported basis and up 13 percent in constant currency, and $7.3 million in Asia Pacific, down 10 percent versus the prior year on a reported basis and down 3 percent in constant currency.

ISG reported third-quarter operating income of $7.4 million, up 2 percent from $7.3 million in the third quarter of 2021. Reported third-quarter net income was $5.6 million, up 26 percent, compared with net income of $4.4 million in the prior year. Fully diluted earnings per share was $0.11, compared with $0.09 per fully diluted share in the prior year. Net income margin (calculated by dividing net income by reported revenues) increased to 8.1 percent, from 6.2 percent in the third quarter of 2021.

Adjusted net income (a non-GAAP measure defined below under “Non-GAAP Financial Measures”) for the third quarter was $7.2 million, or $0.14 per share on a fully diluted basis, compared with adjusted net income of $5.9 million, or $0.12 per share on a fully diluted basis, in the prior year’s third quarter.

Third-quarter adjusted EBITDA (a non-GAAP measure defined below under “Non-GAAP Financial Measures”) was $10.7 million, up 5 percent from the third quarter last year. Adjusted EBITDA margin (a non-GAAP measure calculated by dividing adjusted EBITDA by reported revenues) was 16 percent, up 120 basis points from the prior year.

Nine-Month Year-to-Date Results

Reported revenues for the first nine months were a record $212.1 million, up 2 percent versus the prior-year period, and up 6 percent in constant currency. Currency translation negatively impacted reported revenues for the nine-month period by $9.5 million versus the prior year. Reported revenues were $123.1 million in the Americas, up 1 percent versus the prior year; $66.0 million in Europe, down 1 percent versus the prior year on a reported basis and up 11 percent in constant currency, and $23.0 million in Asia Pacific, up 13 percent versus the prior year on a reported basis and up 20 percent in constant currency.

ISG reported year-to-date operating income of $22.3 million, up 23 percent from $18.1 million in the first nine months of 2021. The firm also reported record year-to-date net income and fully diluted earnings per share of $15.4 million and $0.30, respectively, versus net income of $12.0 million and earnings per share of $0.23 in the prior year. Net income margin (calculated by dividing net income by reported revenues) increased to 7.3 percent, from 5.7 percent in the same period last year.

Adjusted net income (a non-GAAP measure defined below under “Non-GAAP Financial Measures”) for the first nine months was $20.4 million, or $0.40 per share on a fully diluted basis, compared with adjusted net income of $17.7 million, or $0.34 per share on a fully diluted basis, in the prior-year period.

Year-to-date adjusted EBITDA (a non-GAAP measure defined below under “Non-GAAP Financial Measures”) reached a record $32.1 million, up 12 percent from same period last year. Adjusted EBITDA margin (a non-GAAP measure calculated by dividing adjusted EBITDA by reported revenues) was 15 percent, up more than 140 basis points from the prior year.

Other Financial and Operating Highlights

The firm’s cash balance totaled $19.7 million at September 30, 2022, down from $31.5 million at June 30, 2022. During the third quarter, ISG repurchased $4.8 million of shares, paid dividends of $2.0 million, paid $1.0 million in a final earnout associated with the 2020 Neuralify acquisition, and paid down $1.1 million of debt. As of September 30, 2022, ISG had $71.3 million in debt outstanding, compared with $75.6 million at the end of the third quarter last year. At 1.7 times, the firm’s gross-debt-to-adjusted-EBITDA ratio (a non-GAAP measure calculated by dividing outstanding debt by adjusted EBITDA) was at a record low as of September 30, 2022.

2022 Fourth-Quarter Revenue and Adjusted EBITDA Guidance

“Based on achieving our fourth-quarter guidance, ISG will deliver record revenues and profitability for the full year,” said Connors. “For the fourth quarter, ISG is targeting revenues of between $70 million and $72 million and adjusted EBITDA of between $10 million and $11 million. We will continue to monitor the macroeconomic environment, including the impact of FX, inflation and other factors, and adjust our business plans accordingly.”

Quarterly Dividend

The ISG Board of Directors declared a fourth-quarter dividend of $0.04 per share, payable on December 19, 2022, to shareholders of record on December 5, 2022.

Conference Call

ISG has scheduled a call for 9 a.m., U.S. Eastern Time, Friday, November 4, 2022, to discuss the company’s third-quarter results. The call can be accessed by dialing 1-833-927-1758; or, for international callers, by dialing +1 929-526-1599. The access code is 121223. A recording of the conference call will be accessible on ISG’s website (www.isg-one.com) for approximately four weeks following the call.

Forward-Looking Statements

This communication contains “forward-looking statements” which represent the current expectations and beliefs of management of ISG concerning future events and their potential effects. Statements contained herein including words such as “anticipate,” “believe,” “contemplate,” “plan,” “estimate,” “target,” “expect,” “intend,” “will,” “continue,” “should,” “may,” and other similar expressions, are “forward-looking statements” under the Private Securities Litigation Reform Act of 1995. These forward-looking statements are not guarantees of future results and are subject to certain risks and uncertainties that could cause actual results to differ materially from those anticipated. Those risks relate to inherent business, economic and competitive uncertainties and contingencies relating to the businesses of ISG and its subsidiaries including without limitation: (1) failure to secure new engagements or loss of important clients; (2) ability to hire and retain enough qualified employees to support operations; (3) ability to maintain or increase billing and utilization rates; (4) management of growth; (5) success of expansion internationally; (6) competition; (7) ability to move the product mix into higher margin businesses; (8) general political and social conditions such as war, political unrest and terrorism; (9) healthcare and benefit cost management; (10) ability to protect ISG and its subsidiaries’ intellectual property or data and the intellectual property or data of others; (11) currency fluctuations and exchange rate adjustments; (12) ability to successfully consummate or integrate strategic acquisitions; (13) outbreaks of diseases, including coronavirus, or similar public health threats or fear of such an event; and (14) engagements may be terminated, delayed or reduced in scope by clients. Certain of these and other applicable risks, cautionary statements and factors that could cause actual results to differ from ISG’s forward-looking statements are included in ISG’s filings with the U.S. Securities and Exchange Commission. ISG undertakes no obligation to update or revise any forward-looking statements to reflect subsequent events or circumstances.

Non-GAAP Financial Measures

ISG reports all financial information required in accordance with U.S. generally accepted accounting principles (GAAP). In this release, ISG has presented both GAAP financial results as well as non-GAAP information for the three and nine months ended September 30, 2022, and September 30, 2021. ISG believes that evaluating its ongoing operating results will be enhanced if it discloses certain non-GAAP information. These non-GAAP financial measures exclude non-cash and certain other special charges that many investors believe may obscure the user’s overall understanding of ISG’s current financial performance and the Company’s prospects for the future. ISG believes that these non-GAAP measures provide useful information to investors because they improve the comparability of the financial results between periods and provide for greater transparency of key measures used to evaluate the Company’s performance.

ISG provides adjusted EBITDA (defined as net income plus interest, taxes, depreciation and amortization, foreign currency transaction gains/losses, non-cash stock compensation, interest accretion associated with contingent consideration, acquisition-related costs, and severance, integration and other expense), adjusted net income (defined as net income plus amortization of intangible assets, non-cash stock compensation, foreign currency transaction gains/losses, interest accretion associated with contingent consideration, acquisition-related costs, and severance, integration and other expense, on a tax-adjusted basis), adjusted net income per diluted share, adjusted EBITDA margin, gross-debt-to-adjusted-EBITDA ratio and selected financial data on a constant currency basis which are non-GAAP measures that the Company believes provide useful information to both management and investors by excluding certain expenses and financial implications of foreign currency translations, which management believes are not indicative of ISG’s core operations. These non-GAAP measures are used by ISG to evaluate the Company’s business strategies and management’s performance.

We evaluate our results of operations on both an as reported and a constant currency basis. The constant currency presentation, which is a non-GAAP financial measure, excludes the impact of year-over-year fluctuations in foreign currency exchange rates. We believe providing constant currency information provides valuable supplemental information regarding our results of operations, thereby facilitating period-to-period comparisons of our business performance and is consistent with how management evaluates the Company’s performance. We calculate constant currency percentages by converting our current and prior-periods local currency financial results using the same point in time exchange rates and then compare the adjusted current and prior period results. This calculation may differ from similarly titled measures used by others and, accordingly, the constant currency presentation is not meant to be a substitution for recorded amounts presented in conformity with GAAP, nor should such amounts be considered in isolation.

Management believes this information facilitates comparison of underlying results over time. Non-GAAP financial measures, when presented, are reconciled to the most closely applicable GAAP measure. Non-GAAP measures are provided as additional information and should not be considered in isolation or as a substitute for results prepared in accordance with GAAP. A reconciliation of the forward-looking non-GAAP estimates contained herein to the corresponding GAAP measures is not being provided, due to the unreasonable efforts required to prepare it.

About ISG

ISG (Information Services Group) (Nasdaq: III) is a leading global technology research and advisory firm. A trusted business partner to more than 800 clients, including 75 of the world’s top 100 enterprises, ISG is committed to helping corporations, public sector organizations, and service and technology providers achieve operational excellence and faster growth. The firm specializes in digital transformation services, including automation, cloud and data analytics; sourcing advisory; managed governance and risk services; network carrier services; strategy and operations design; change management; market intelligence and technology research and analysis. Founded in 2006, and based in Stamford, Conn., ISG employs more than 1,300 digital-ready professionals operating in more than 20 countries—a global team known for its innovative thinking, market influence, deep industry and technology expertise, and world-class research and analytical capabilities based on the industry’s most comprehensive marketplace data. For more information, visit www.isg-one.com.

 
Information Services Group, Inc.
Condensed Consolidated Statement of Income and Comprehensive Income
(unaudited)
(in thousands, except per share amounts)
 
 
Three Months Ended September 30,Nine Months Ended September 30,
 2022   2021   2022   2021 
 
Revenues$68,836 $71,095 $212,100 $208,263 
Operating expenses
Direct costs and expenses for advisors 39,786  43,249  125,111  127,412 
Selling, general and administrative 20,334  19,236  60,806  58,768 
Depreciation and amortization 1,286  1,347  3,872  3,962 
Operating income 7,430  7,263  22,311  18,121 
Interest income 37  65  126  196 
Interest expense (824) (538) (1,997) (1,794)
Foreign currency transaction gain (loss) 131  1  248  (2)
 
Income before taxes 6,774  6,791  20,688  16,521 
Income tax provision 1,218  2,370  5,245  4,570 
Net income$5,556 $4,421 $15,443 $11,951 
 
Weighted average shares outstanding:
Basic 47,888  48,751  48,191  48,521 
Diluted 49,844  51,510  50,637  51,713 
 
Earnings per share:
Basic$0.12 $0.09 $0.32 $0.25 
Diluted$0.11 $0.09 $0.30 $0.23 
 
Information Services Group, Inc.
Reconciliation from GAAP to Non-GAAP
(unaudited)
(in thousands, except per share amounts)


Three Months Ended September 30,Nine Months Ended September 30,
 2022  2021  2022  2021 
 
Net income$5,556 $4,421 $15,443 $11,951 
Plus:
Interest expense (net of interest income) 787  473  1,871  1,598 
Income taxes 1,218  2,370  5,245  4,570 
Depreciation and amortization 1,286  1,347  3,872  3,962 
Interest accretion associated with contingent consideration   47  8  113 
Acquisition-related costs (1) 25  18  41  (14)
Severance, integration and other expense 8  41  458  1,341 
Foreign currency transaction (gain) loss (131) (1) (248) 2 
Non-cash stock compensation 1,987  1,499  5,432  5,075 
Adjusted EBITDA$10,736 $10,215 $32,122 $28,598 
 
Net income$5,556 $4,421 $15,443 $11,951 
Plus:
Non-cash stock compensation 1,987  1,499  5,432  5,075 
Intangible amortization 525  643  1,580  2,001 
Interest accretion associated with contingent consideration   47  8  113 
Acquisition-related costs (1) 25  18  41  (14)
Severance, integration and other expense 8  41  458  1,341 
Foreign currency transaction (gain) loss (131) (1) (248) 2 
Tax effect (2) (772) (719) (2,327) (2,726)
Adjusted net income$7,198 $5,949 $20,387 $17,743 
 
Weighted average shares outstanding:
Basic 47,888  48,751  48,191  48,521 
Diluted 49,844  51,510  50,637  51,713 
 
Adjusted earnings per share:
Basic$0.15 $0.12 $0.42 $0.37 
Diluted$0.14 $0.12 $0.40 $0.34 
 
(1)Consists of expenses from acquisition-related costs and non-cash fair value adjustments on pre-acquisition contract liabilities.
(2)Marginal tax rate of 32%, reflecting U.S. federal income tax rate of 21% plus 11% attributable to U.S. states and foreign jurisdictions.
 
Information Services Group, Inc.
Selected Financial Data
Constant Currency Comparison
 
Three MonthsThree Months
Three MonthsConstantEndedThree MonthsConstantEnded
EndedcurrencySeptember 30, 2022EndedcurrencySeptember 30, 2021
September 30, 2022impactAdjustedSeptember 30, 2021impactAdjusted
Revenue$68,836$3,843$72,679$71,095$(165)$70,930
Operating income$7,430$353$7,783$7,263$(36)$7,227
Adjusted EBITDA$10,736$399$11,135$10,215$(44)$10,171
 
Nine MonthsNine Months
Nine MonthsConstantEndedNine MonthsConstantEnded
EndedcurrencySeptember 30, 2022EndedcurrencySeptember 30, 2021
September 30, 2022impactAdjustedSeptember 30, 2021impactAdjusted
Revenue$212,100$7,745$219,845$208,263$(1,714)$206,549
Operating income$22,311$973$23,284$18,121$(701)$17,420
Adjusted EBITDA$32,122$1,080$33,202$28,598$(724)$27,874

Source: Information Services Group, Inc.

Information Services Group (III) – 3Q22 First Look and an Acquisition

Friday, November 04, 2022

ISG (Information Services Group) (Nasdaq: III) is a leading global technology research and advisory firm. A trusted business partner to more than 700 clients, including more than 75 of the world’s top 100 enterprises, ISG is committed to helping corporations, public sector organizations, and service and technology providers achieve operational excellence and faster growth. The firm specializes in digital transformation services, including automation, cloud and data analytics; sourcing advisory; managed governance and risk services; network carrier services; strategy and operations design; change management; market intelligence and technology research and analysis. Founded in 2006, and based in Stamford, Conn., ISG employs more than 1,300 digital-ready professionals operating in more than 20 countries—a global team known for its innovative thinking, market influence, deep industry and technology expertise, and world-class research and analytical capabilities based on the industry’s most comprehensive marketplace data. For additional information, visit www.ISG-One.com

Joe Gomes, Senior Research Analyst, Noble Capital Markets, Inc.

Joshua Zoepfel, Research Associate, Noble Capital Markets, Inc.

Refer to the full report for the price target, fundamental analysis, and rating.

3Q22 Results. ISG announced revenue of $68.8 million, down from $71.1 million in the year ago period, management’s $71-$73 million guide, and our $72 million estimate. The key culprit was a $4 million negative FX impact. Third quarter net income was $5.6 million, GAAP EPS was $0.11, and adjusted EPS was $0.14. Adjusted EBITDA was $10.7 million, a 5.1% increase year-over-year. We forecasted net income of $4.17 million, $0.11 fully diluted EPS, and adjusted EBITDA of $10.4 million.

Cap Structure and Returning Capital. Cash balance totaled $19.7 million at September 30, 2022, down from $31.5 million at June 30, 2022, while outstanding debt was $71.3 million at the end of the third quarter. During the third quarter, ISG repurchased $4.8 million of shares, paid dividends of $2.0 million, paid $1.0 million in a final earnout associated with the 2020 Neuralify acquisition, and paid down $1.1 million of debt.


Get the Full Report

This Company Sponsored Research is provided by Noble Capital Markets, Inc., a FINRA and S.E.C. registered broker-dealer (B/D).

*Analyst certification and important disclosures included in the full report. NOTE: investment decisions should not be based upon the content of this research summary. Proper due diligence is required before making any investment decision. 

TAAL Distributed Information Technologies (TAALF) – A Take Private Proposal


Thursday, November 03, 2022

TAAL Distributed Information Technologies Inc. delivers value-added blockchain services, providing professional-grade, highly scalable blockchain infrastructure and transactional platforms to support businesses building solutions and applications upon the BitcoinSV platform, and developing, operating, and managing distributed computing systems for enterprise users.

Joe Gomes, Senior Research Analyst, Noble Capital Markets, Inc.

Joshua Zoepfel, Research Associate, Noble Capital Markets, Inc.

Refer to the full report for the price target, fundamental analysis, and rating.

Going Private. Yesterday, TAAL announced it had entered into an agreement with its largest shareholder, Calvin Ayre, for Mr. Ayre to take the Company private at a price of CAD$1.07/sh (about US$0.78/sh at the current exchange rate). The price represents about a 39.9% premium to the 10-day volume weighted average price. At first glance, the proposed price appears to be slightly below the average EV/S multiple of the crypto mining peer group, using our financial model, which has not been updated to include 3Q22 results as they have yet to be released.

Details. The transaction has unanimous approval by a Special Committee of independent directors and the full Board. A special shareholders meeting is scheduled for late December 2022. The transaction requires approval by two thirds of the votes cast by shareholders, excluding Mr. Ayre. Closing is expected shortly following the Special Meeting.


Get the Full Report

This Company Sponsored Research is provided by Noble Capital Markets, Inc., a FINRA and S.E.C. registered broker-dealer (B/D).

*Analyst certification and important disclosures included in the full report. NOTE: investment decisions should not be based upon the content of this research summary. Proper due diligence is required before making any investment decision. 

Will Equity Investors Return Back to the Future?

Image: Statue of Liberty Torch, Circa 1882 – Ron Cogswell (Flickr)

Current Technology May Be Leading the Next Shift in Stock Market Investing

Investor exposure to the stock market has grown and evolved through different iterations over the years. There is no reason to believe that it isn’t evolving still. The main drivers of change have been the cost of ownership, technology, and convenience, which are related to the other two drivers. There seems to be a new transformation that has been happening over the past few years. And with each change, there will be those that benefit and those that fall short. So it’s important for an investor to be aware of changes that may be taking place around them.

Recent History

Your grandfather probably didn’t own stocks. If he did, he bought shares in companies his broker researched, and he then speculated they would out-earn alternative uses of his capital – this was expensive. Mutual funds later grew in popularity as computer power expanded, and an increased number of investors flocked to these managed funds – the price of entry was less than buying individual stocks. Charles Schwab and other discount brokers sprang up – they offered lower commissions than traditional brokers. Mutual funds were able to further reduce fees charged by offering easier to manage indexed funds or funds linked to a market index like the Dow 30 or S&P 500. Indexed exchange-traded funds (ETF) took the indexed fund idea one step further – they have a much lower cost of entry than either mutual funds or even discount brokerage accounts. An added benefit to indexed ETFs is they can be traded at intraday prices and provide tax benefits.

Just as Schwab ushered in an era of low-commission trades, Robinhood busted the doors open to no-commission trades, and most large online brokers followed. This change allows for almost imperceptible costs in most stock market transactions. It also changed the concept of a round-lot, or transacting in increments of 100 shares. In fact, the most popular brokers all offer fractional share ownership now.

Are Index ETFs Becoming Dinosaurs?

Funds made sense for those seeking diversification of holdings, it used to take a large sum of money to do that; investors with a $10,000 account or more can easily achieve acceptable diversification with odd-lots and fractional shares ability.

Today investors can create their own index-like “fund,” or as they called it in your grandparent’s day, “portfolio management.”

One big advantage to creating your own portfolio, even if you rely heavily on stocks from a specific index to choose from, is that you can adapt it more toward your sector or company expectations. Indexed funds are stuck with their index holdings, they have no ability to change. One may increase or decrease risk by leaving out stocks or even whole industry groups. Also, it can be managed with greater tax efficiency than an index fund tailored to your situation.

There is also the DIY thrill that one gets from creating anything themselves rather than to just buying one off the shelf. There have been a number of renowned investors like Peter Lynch and Michael Burry warning that indexed funds no longer provide expected diversification and that many of the stocks are valued higher because so many dollars are on “auto-invest” into indexes that the bad has been pushed up with the good.  

An example of what added demand does to the valuation of a company when being added to an index can be seen over the last month when it became clear that Twitter would be leaving an empty slot that would be filled by Arch Capital (ACGL). The added demand for ACGL pushed up the value by an estimated 25%. Was it undervalued before (when stand-alone), or is it over-valued now? Some stocks that are getting more attention because they are in an index could, as Michael Burry warned, be in bubble territory.

Source: Koyfin

Setting Up a Portfolio

The more you do to ensure your portfolio weightings mimic an index, the closer your performance is likely to be to that index. You may want to limit your holdings to names that are actually in the index and shift the weightings for return enhancement. Another concern often cited with indexes is the way that they weight holdings; you may choose to weight your portfolio using the market capitalization of each company to own the same percentage of the company’s value or use another method like pure cost measures or cost per P/E.

Picking Stocks

While studies suggest that market diversification can be achieved by owning as few as five stocks and doesn’t improve much after 30 holdings, the more you own, providing they aren’t overweighted in a sector, it stands to reason the more diversification protection you can achieve.

As a DIY, self-directed investor, it makes sense not to chase after whatever YouTube influencer, loud-mouthed-TV analyst, or Stocktwit tells you. This is your baby, and the results, good or bad, are yours. Do what you can to make informed decisions, even if some turn out unexpected. The benefit of this is you can lean away from stocks that are still in indexes that don’t have good future prospects and lean into more companies that do.

I’m hearing from more of my self-directed investor friends and investment advisors that more people are looking to own companies that have non-financial objectives they, as an investor, support. And for some of them, there is no standard ESG framework that they support. They have decided, because they do care, to do more portfolio management with individual stocks than before. This is so they can individually look under the hood at employee policies, or environmental stature, etc. While ESG funds exist, the investor or client of the investment advisor would prefer not to own anything they oppose if they can avoid it. What better way than being able to say no to $XYZ company because they do this, this, and this that is against my own fabric?

Channelchek is a great resource for any percentage of your personally managed fund that includes stocks in the small-cap or microcap categories. These stocks could add a bit more potential for return but could also change your risk characteristics. Sign-up to get research from FINRA-licensed analysts.

Take Away

Stock investing has evolved and become more inclusive. But the future may be more like the past, with individuals creating portfolios of stocks for themselves. You don’t have to be rich anymore to buy stocks, and you don’t have to own a fund to get affordable diversification on nearly any size account. There’s a trend toward building one’s own personalized, diversified, low-transaction portfolio. Channelchek is helping investors find possible fits with its free research platform.

Paul Hoffman

Managing Editor, Channelchek