|
|
|
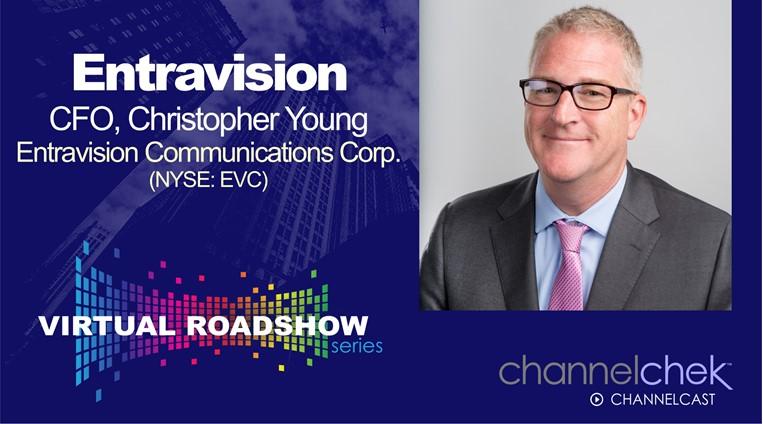
Noble Capital Markets Director of Research Michael Kupinski hosts this exclusive fireside chat with Entravision Communications CFO Chris Young. The discussion features questions asked by the live audience throughout the event. Research, News, and Advanced Market Data on EVCInformation on upcoming live virtual roadshows
About Entravision Communications Corporation Entravision is a diversified global media, marketing and technology company serving clients throughout the United States and in 32 countries across Latin America, Europe, and Asia. Entravision has 54 television stations and is the largest affiliate group of the Univision and UniMás television networks, and 47 Spanish-language radio stations that feature nationally recognized, award-winning talent. Our dynamic digital portfolio includes Entravision Digital, which serves SMBs in high-density U.S. Latino markets and provides cutting-edge mobile programmatic solutions and demand-side platforms that allow advertisers to execute performance campaigns using machine-learned bidding algorithms, along with Cisneros Interactive, a leader in digital advertising solutions in the Latin American and U.S. Hispanic markets representing major technology platforms, and MediaDonuts, a leader in programmatic digital solutions in Southeast Asia. Shares of Entravision Class A Common Stock trade on The New York Stock Exchange under the ticker symbol: EVC. Learn more about all of our marketing, media, and technology offerings at entravision.com or connect with us on LinkedIn and Facebook |
Category: Media and Marketing
Release – Harte Hanks to Uplist to the Nasdaq Global Market
Harte Hanks to Uplist to the Nasdaq Global Market
AUSTIN, Texas, Nov. 30, 2021 /PRNewswire/ — Harte Hanks, Inc. (OTCQX: HRTH) (the “Company”), a leading global customer experience company, today announced that the Company has met the stringent financial, liquidity and corporate governance listing requirements of the Nasdaq Global Market® (“Nasdaq”), and the Company has been approved for listing on the Nasdaq.
Trading on Nasdaq is expected to commence at the market open on December 1, 2021, and the shares will trade under the ticker symbol “HHS”. The Company’s shares will continue to trade on the OTCQX under the symbol “HRTH” until trading on the Nasdaq commences. Shareholders are not required to take any action as a result of the uplisting and symbol change.
“Uplisting to the Nasdaq marks another major milestone for Harte Hanks,” said Harte Hanks’ Chairman of the Board of Directors Jack Griffin. “With the expanded audience of investors, increased access to liquidity, and the significant improvement in our financial performance, we are well positioned for future profitable growth. Harte Hanks traded under the ticker ‘HHS’ for nearly 50 years, from its IPO in 1972 through 2020, and returning to a national exchange and this longstanding ticker symbol is an important indication of the progress we have made.”
Chief Executive Officer Brian Linscott added, “Uplisting to the Nasdaq reflects the considerable progress that Harte Hanks has made and will serve as a great opportunity to expand the Company’s institutional shareholder base and to enhance the Company’s efforts to create long-term shareholder value.”
About Harte Hanks
Harte Hanks (OTCMKTS: HRTH) is a leading global customer experience company whose mission is to partner with clients to provide them with CX strategy, data-driven analytics and actionable insights combined with seamless program execution to better understand, attract, and engage their customers.
Using its unparalleled resources and award-winning talent in the areas of Customer Care, Fulfillment and Logistics, and Marketing Services, Harte Hanks has a proven track record of driving results for some of the world’s premier brands including Bank of America, GlaxoSmithKline, Unilever, Pfizer, HBOMax, Volvo, Ford, FedEx, Midea, Sony and IBM among others. Headquartered in Austin, Texas, Harte Hanks has over 2,500 employees in offices across the Americas, Europe, and Asia Pacific.
For more information, visit hartehanks.com.
As used herein, “Harte Hanks” or “the Company” refers to Harte Hanks, Inc. and/or its applicable operating subsidiaries, as the context may require. Harte Hanks’ logo and name are trademarks of Harte Hanks.
Cautionary Note Regarding
Forward-Looking Statements
Our press release contains “forward-looking statements” within the meaning of U.S. federal securities laws. All such statements are qualified by this cautionary note, provided pursuant to the safe harbor provisions of Section 27A of the Securities Act of 1933 and Section 21E of the Securities Exchange Act of 1934. Statements other than historical facts are forward-looking and may be identified by words such as “may,” “will,” “expects,” “believes,” “anticipates,” “plans,” “estimates,” “seeks,” “could,” “intends,” or words of similar meaning. These forward-looking statements are based on current information, expectations and estimates and involve risks, uncertainties, assumptions, and other factors that are difficult to predict and that could cause actual results to vary materially from what is expressed in or indicated by the forward-looking statements. In that event, our business, financial condition, results of operations or liquidity could be materially adversely affected and investors in our securities could lose part or all their investments. These risks, uncertainties, assumptions and other factors include: (a) local, national and international economic and business conditions, including (i) the outbreak of diseases, such as the COVID-19 coronavirus and new variants thereof, which has curtailed travel to and from certain countries and geographic regions, created supply chain disruption and shortages, disrupted business operations and reduced consumer spending, (ii) market conditions that may adversely impact marketing expenditures and (iii) the impact of economic environments and competitive pressures on the financial condition, marketing expenditures and activities of our clients and prospects; (b) the demand for our products and services by clients and prospective clients, including (i) the willingness of existing clients to maintain or increase their spending on products and services that are or remain profitable for us, and (ii) our ability to predict changes in client needs and preferences; (c) economic and other business factors that impact the industry verticals we serve, including competition and consolidation of current and prospective clients, vendors and partners in these verticals; (d) our ability to manage and timely adjust our facilities, capacity, workforce and cost structure to effectively serve our clients; (e) our ability to improve our processes and to provide new products and services in a timely and cost-effective manner though development, license, partnership or acquisition; (f) our ability to protect our facilities against security breaches and other interruptions and to protect sensitive personal information of our clients and their customers; (g) our ability to respond to increasing concern, regulation and legal action over consumer privacy issues, including changing requirements for collection, processing and use of information; (h) the impact of privacy and other regulations, including restrictions on unsolicited marketing communications and other consumer protection laws; (i) fluctuations in fuel prices, paper prices, postal rates and postal delivery schedules; (j) the number of shares, if any, that we may repurchase in connection with our repurchase program; (k) unanticipated developments regarding litigation or other contingent liabilities; (l) our ability to complete anticipated divestitures and reorganizations, including cost-saving initiatives; (m) our ability to realize the expected tax refunds; (n) the realization of any benefits that may be derived from listing the Company’s common stock on Nasdaq and (o) other factors discussed from time to time in our filings with the Securities and Exchange Commission, including under “Item 1A. Risk Factors” in our Annual Report on Form 10-K for the year ended December 31, 2020 which was filed on March 24, 2021. The forward-looking statements in this press release are made only as of the date hereof, and we undertake no obligation to update publicly any forward-looking statement, even if new information becomes available or other events occur in the future.
Investor Relations Contact:
Rob Fink
FNK IR
[email protected]
646-809-4048
SOURCE Harte Hanks, Inc.
Release – Entravision Announces Participation in the Bank of America 2021 Leveraged Finance Conference
Entravision Announces Participation in the Bank of America 2021 Leveraged Finance Conference
SANTA MONICA, Calif.–(BUSINESS WIRE)– Entravision Communications Corporation (NYSE: EVC), a leading global media and marketing technology company, today announced its participation in the Bank of America 2021 Leveraged Finance Conference to be held virtually November 30 – December 2, 2021. Chris Young, Chief Financial Officer, is scheduled to present at 11:15 a.m. ET on Thursday, December 2, 2021 and will participate in meetings with investors throughout the day.
The presentation will be webcast live over the Internet, and links to the live webcast and replay will be available on Entravision’s Investor Relations website at investor.entravision.com.
About Entravision Communications Corporation
Entravision is a diversified global media, marketing and technology company serving clients throughout the United States and in fast growing population centers in more than 30 countries across Latin America, Europe, Asia and Africa. Our dynamic portfolio of services includes digital, television and radio offerings. Digital, our largest revenue segment, is comprised of five core businesses: Entravision Digital, Smadex, Cisneros Interactive, MediaDonuts, and 365 Digital. Entravision Digital provides branding and performance digital solutions to clients and small- and mid-size businesses throughout the world, including the U.S., Latin America and Europe. Smadex provides cutting-edge mobile programmatic solutions and demand-side platforms which enable advertisers to effectively execute performance campaigns using machine-learned bidding algorithms. Cisneros Interactive provides unique digital marketing solutions representing major global publishers and ad-tech platforms in Latin America, while also managing the leading digital audio network and solutions player Audio.Ad. MediaDonuts provides digital marketing performance and branding services in the Southeast Asia region and maintains unique commercial partnerships with some of the world’s leading digital publishers and social media platforms. 365 Digital is a digital advertising solutions provider that offers exclusive sales representations with major global platforms in South Africa. Beyond digital, Entravision has 53 television stations and is the largest affiliate group of the Univision and UniMás television networks. Entravision also manages 46 primarily Spanish-language radio stations that feature nationally recognized, Emmy award-winning talent. Shares of Entravision Class A Common Stock trade on the NYSE under ticker: EVC. Learn more about all of our marketing, media, and technology offerings at entravision.com or connect with us on LinkedIn and Facebook.
Christopher T. Young
Chief Financial Officer
Entravision Communications Corporation
310-447-3870
Kimberly Esterkin
ADDO Investor Relations
310-829-5400
[email protected]
Source: Entravision Communications Corporation
Entravision Announces Participation in the Bank of America 2021 Leveraged Finance Conference
SANTA MONICA, Calif.–(BUSINESS WIRE)– Entravision Communications Corporation (NYSE: EVC), a leading global media and marketing technology company, today announced its participation in the Bank of America 2021 Leveraged Finance Conference to be held virtually November 30 – December 2, 2021. Chris Young, Chief Financial Officer, is scheduled to present at 11:15 a.m. ET on Thursday, December 2, 2021 and will participate in meetings with investors throughout the day.
The presentation will be webcast live over the Internet, and links to the live webcast and replay will be available on Entravision’s Investor Relations website at investor.entravision.com.
About Entravision Communications Corporation
Entravision is a diversified global media, marketing and technology company serving clients throughout the United States and in fast growing population centers in more than 30 countries across Latin America, Europe, Asia and Africa. Our dynamic portfolio of services includes digital, television and radio offerings. Digital, our largest revenue segment, is comprised of five core businesses: Entravision Digital, Smadex, Cisneros Interactive, MediaDonuts, and 365 Digital. Entravision Digital provides branding and performance digital solutions to clients and small- and mid-size businesses throughout the world, including the U.S., Latin America and Europe. Smadex provides cutting-edge mobile programmatic solutions and demand-side platforms which enable advertisers to effectively execute performance campaigns using machine-learned bidding algorithms. Cisneros Interactive provides unique digital marketing solutions representing major global publishers and ad-tech platforms in Latin America, while also managing the leading digital audio network and solutions player Audio.Ad. MediaDonuts provides digital marketing performance and branding services in the Southeast Asia region and maintains unique commercial partnerships with some of the world’s leading digital publishers and social media platforms. 365 Digital is a digital advertising solutions provider that offers exclusive sales representations with major global platforms in South Africa. Beyond digital, Entravision has 53 television stations and is the largest affiliate group of the Univision and UniMás television networks. Entravision also manages 46 primarily Spanish-language radio stations that feature nationally recognized, Emmy award-winning talent. Shares of Entravision Class A Common Stock trade on the NYSE under ticker: EVC. Learn more about all of our marketing, media, and technology offerings at entravision.com or connect with us on LinkedIn and Facebook.
Christopher T. Young
Chief Financial Officer
Entravision Communications Corporation
310-447-3870
Kimberly Esterkin
ADDO Investor Relations
310-829-5400
[email protected]
Source: Entravision Communications Corporation
Release – Salem Media Group Announces the Extension of Jennifer Horns Agreement with the Morning Answer Show
Salem Media Group Announces the Extension of Jennifer Horn’s Agreement with the ‘Morning Answer Show’
KRLA/KTIE Director of Programming, Chuck Tyler commented, “Jen and Grant have instant chemistry. They are the most talented team I have ever had the privilege of working with. They have the rare ability to cover and comment on serious issues, while having some fun at the same time.”
According to Salem Vice President of Spoken Word Phil Boyce, “Waking up Los Angeles is one of the most important jobs in radio, and Jen and Grant have figured out the formula. They always have a smile, but can deliver the day’s top news with a dose of reality. Salem is very proud to showcase these hosts.”
Jennifer Horn is excited for the commitment from KRLA/KTIE, “Once in a career you get a golden opportunity and this is it! It has been the ultimate honor working with Salem and our local team to develop a morning show that is making incredible strides in the LA market. Grant Stinchfield is the ultimate professional. He brings a background in journalism, a unique perspective and sense of humor, it’s been so much fun to partner and build chemistry with him. The sky is the limit with the Morning Answer!”
Grant Stinchfield commented, “I could not be more thrilled to work for Salem Media, a company that doesn’t just respect free speech but cherishes it. Jennifer Horn is an amazing talent. Through her passion, humor and welcoming nature, she has created a true morning family that I am so grateful to be a part of.”
ABOUT SALEM MEDIA GROUP:
Salem Media Group is America’s leading multimedia company specializing in Christian and conservative content, with media properties comprising radio, digital media and book and newsletter publishing. Each day Salem serves a loyal and dedicated audience of listeners and readers numbering in the millions nationally. With its unique programming focus, Salem provides compelling content, fresh commentary and relevant information from some of the most respected figures across the Christian and conservative media landscape. Learn more about Salem Media Group, Inc. at www.salemmedia.com, Facebook and Twitter.
Evan D. Masyr
Executive Vice President and Chief
Financial Officer
(805) 384-4512
[email protected]
Source: Salem Media Group, Inc.
Salem Media Group Announces the Extension of Jennifer Horn’s Agreement with the ‘Morning Answer Show’
KRLA/KTIE Director of Programming, Chuck Tyler commented, “Jen and Grant have instant chemistry. They are the most talented team I have ever had the privilege of working with. They have the rare ability to cover and comment on serious issues, while having some fun at the same time.”
According to Salem Vice President of Spoken Word Phil Boyce, “Waking up Los Angeles is one of the most important jobs in radio, and Jen and Grant have figured out the formula. They always have a smile, but can deliver the day’s top news with a dose of reality. Salem is very proud to showcase these hosts.”
Jennifer Horn is excited for the commitment from KRLA/KTIE, “Once in a career you get a golden opportunity and this is it! It has been the ultimate honor working with Salem and our local team to develop a morning show that is making incredible strides in the LA market. Grant Stinchfield is the ultimate professional. He brings a background in journalism, a unique perspective and sense of humor, it’s been so much fun to partner and build chemistry with him. The sky is the limit with the Morning Answer!”
Grant Stinchfield commented, “I could not be more thrilled to work for Salem Media, a company that doesn’t just respect free speech but cherishes it. Jennifer Horn is an amazing talent. Through her passion, humor and welcoming nature, she has created a true morning family that I am so grateful to be a part of.”
ABOUT SALEM MEDIA GROUP:
Salem Media Group is America’s leading multimedia company specializing in Christian and conservative content, with media properties comprising radio, digital media and book and newsletter publishing. Each day Salem serves a loyal and dedicated audience of listeners and readers numbering in the millions nationally. With its unique programming focus, Salem provides compelling content, fresh commentary and relevant information from some of the most respected figures across the Christian and conservative media landscape. Learn more about Salem Media Group, Inc. at www.salemmedia.com, Facebook and Twitter.
Evan D. Masyr
Executive Vice President and Chief
Financial Officer
(805) 384-4512
[email protected]
Source: Salem Media Group, Inc.
Harte Hanks (HRTH) – A Well-Oiled More Efficient Cash Flow Machine

Friday, November 12, 2021
Harte Hanks (HRTH)
A Well-Oiled, More Efficient, Cash Flow Machine
Harte-Hanks is a marketing services company that provides multichannel marketing solutions as well as consulting, data analytics, and strategic assessment. The company’s offerings focus on business-to-business, retail, finance, and automotive segments through digital, social, mobile, and print media offerings. Harte-Hanks strives to develop better customer relationships through its marketing and analytical services for clients. The majority of its revenue is derived from its marketing services in the retail, technology, and consumer brand segments.
Michael Kupinski, Director of Research, Noble Capital Markets, Inc.
Refer to the full report for the price target, fundamental analysis, and rating.
A surprisingly strong Q3. Total company revenue increased a surprising 4.0% to $49.6 million, well above our $45.3 million estimate, fueled by a 10.2% increase in its Customer Care segment revenues. Customer Care revenues beat our estimate by a whopping 29.2%, as the Covid related customer did not go away as anticipate and the company gained additional clients. The company reported its 6th consecutive quarter of positive EBITDA, with adj. EBITDA beating expectations, $6.1 million versus our $3.3 million estimate.
Favorable momentum. Customer Care is expected to be stronger than originally expected as the Covid related business is not expected to fall off until next year. As a result, we are raising our Q4 total company revenue expectation from $42.5 million to $48.7 million. We are raising our Q4 adj. EBITDA estimate from $3.1 million to $4.4 million, bringing our full year 2021 adj. EBITDA estimate to …
This Company Sponsored Research is provided by Noble Capital Markets, Inc., a FINRA and S.E.C. registered broker-dealer (B/D).
*Analyst certification and important disclosures included in the full report. NOTE: investment decisions should not be based upon the content of this research summary. Proper due diligence is required before making any investment decision.
Release – Harte Hanks Generates $0.52 in EPS for Third Quarter of 2021
Harte Hanks Generates $0.52 in EPS for Third Quarter of 2021
Third Quarter Operational and Financial Highlights
- Revenues improved by 4% to
$49.6 million , compared to
$47.7 million in the same period last year. -
$0.52 diluted EPS for Third Quarter of 2021 vs. (
$0.27 ) for Third Quarter of 2020. - Operating income of
$4.2 million , compared to operating income of
$0.8 million in the same period last year. - Net income of
$4.4 million , compared to net loss of
($1.6) million in the same period last year. - EBITDA improved to
$4.8 million compared to
$1.5 million in the same period last year.1
The third quarter results by segment were as follows:
1) Customer Care,
2) Fulfillment & Logistics,
3) Marketing Services,
Third Quarter 2021 Results
Third quarter revenues were $49.6 million, up from
Third quarter operating income was
Third quarter Adjusted Operating Income2 was
Conference Call Information
The Company will host a conference call and live webcast to discuss these results today at 4:30 p.m. EST. To access the live call, please dial (888) 506-0059 (toll free) or (973) 528-0048 and, if requested, reference conference ID 663451. The conference call will also be webcast live in the Investors Events section of the
Following the conclusion of the live call, a telephonic replay will be available for 72 hours by dialing (877) 481-4010 or (919) 882-2331 and using the replay passcode 43515. The replay will also be available for at least 90 days in the Investors Events section of the
About Harte Hanks:
(OTCMKTS: HRTH) is a leading global customer experience company whose mission is to partner with clients to provide them with CX strategy, data-driven analytics and actionable insights combined with seamless program execution to better understand, attract, and engage their customers.
Using its unparalleled resources and award-winning talent in the areas of Customer Care, Fulfillment and Logistics, and Marketing Services,
For more information visit hartehanks.com
Cautionary Note Regarding Forward-Looking Statements:
Our press release and related earnings conference call contain “forward-looking statements” within the meaning of U.S. federal securities laws. All such statements are qualified by this cautionary note, provided pursuant to the safe harbor provisions of Section 27A of the Securities Act of 1933 and Section 21E of the Securities Exchange Act of 1934. Statements other than historical facts are forward-looking and may be identified by words such as “may,” “will,” “expects,” “believes,” “anticipates,” “plans,” “estimates,” “seeks,” “could,” “intends,” or words of similar meaning. These forward-looking statements are based on current information, expectations and estimates and involve risks, uncertainties, assumptions and other factors that are difficult to predict and that could cause actual results to vary materially from what is expressed in or indicated by the forward-looking statements. In that event, our business, financial condition, results of operations or liquidity could be materially adversely affected and investors in our securities could lose part or all of their investments. These risks, uncertainties, assumptions and other factors include: (a) local, national and international economic and business conditions, including (i) the outbreak of diseases, such as the COVID-19 coronavirus and new variants thereof, which has curtailed travel to and from certain countries and geographic regions, created supply chain disruption and shortages, disrupted business operations and reduced consumer spending, (ii) market conditions that may adversely impact marketing expenditures and (iii) the impact of economic environments and competitive pressures on the financial condition, marketing expenditures and activities of our clients and prospects; (b) the demand for our products and services by clients and prospective clients, including (i) the willingness of existing clients to maintain or increase their spending on products and services that are or remain profitable for us, and (ii) our ability to predict changes in client needs and preferences; (c) economic and other business factors that impact the industry verticals we serve, including competition and consolidation of current and prospective clients, vendors and partners in these verticals; (d) our ability to manage and timely adjust our facilities, capacity, workforce and cost structure to effectively serve our clients; (e) our ability to improve our processes and to provide new products and services in a timely and cost-effective manner though development, license, partnership or acquisition; (f) our ability to protect our facilities against security breaches and other interruptions and to protect sensitive personal information of our clients and their customers; (g) our ability to respond to increasing concern, regulation and legal action over consumer privacy issues, including changing requirements for collection, processing and use of information; (h) the impact of privacy and other regulations, including restrictions on unsolicited marketing communications and other consumer protection laws; (i) fluctuations in fuel prices, paper prices, postal rates and postal delivery schedules; (j) the number of shares, if any, that we may repurchase in connection with our repurchase program; (k) unanticipated developments regarding litigation or other contingent liabilities; (l) our ability to complete anticipated divestitures and reorganizations, including cost-saving initiatives; (m) our ability to realize the expected tax refunds; and (n) other factors discussed from time to time in our filings with the Securities and Exchange Commission, including under “Item 1A. Risk Factors” in our Annual Report on Form 10-K for the year ended December 31, 2020 which was filed on March 24, 2021. The forward-looking statements in this press release and our related earnings conference call are made only as of the date hereof, and we undertake no obligation to update publicly any forward-looking statement, even if new information becomes available or other events occur in the future.
Supplemental Non-GAAP Financial Measures:
The Company reports its financial results in accordance with generally accepted accounting principles (“GAAP”). In this press release and our related earnings conference call, however, the Company may use certain non-GAAP measures of financial performance in order to provide investors with a better understanding of operating results and underlying trends to assess the Company’s performance and liquidity. We have presented herein a reconciliation of these measures to the most directly comparable GAAP financial measure.
The Company presents the non-GAAP financial measure “Adjusted Operating Income (Loss)” as a measure useful to both management and investors in their analysis of the Company’s financial results because it facilitates a period-to-period comparison of Operating Revenue and Operating Income (Loss) by excluding restructuring expense, impairment expense and stock-based compensation. The most directly comparable measure for this non-GAAP financial measure is Operating Income (Loss).
The Company also presents the non-GAAP financial measure “Adjusted EBITDA” as a supplemental measure of operating performance in order to provide an improved understanding of underlying performance trends. The Company defines “Adjusted EBITDA” as earnings before interest expense net, income tax expense (benefit), depreciation expense, restructuring expense, impairment expense, stock-based compensation expense, and other non-cash expenses. The most directly comparable measure for Adjusted EBITDA is Net Income (Loss). We believe Adjusted EBITDA is an important performance metric because it facilitates the analysis of our results, exclusive of certain non-cash items, including items which do not directly correlate to our business operations; however, we urge investors to review the reconciliation of non-GAAP Adjusted EBITDA to the comparable GAAP Net Income (Loss), which is included in this press release, and not to rely on any single financial measure to evaluate the Company’s financial performance.
The foregoing measures do not serve as a substitute and should not be construed as a substitute for GAAP performance, but provide supplemental information concerning our performance that our investors and we find useful. The Company evaluates its operating performance based on several measures, including these non-GAAP financial measures. The Company believes that the presentation of these non-GAAP financial measures in this press release and earnings conference call presentations are useful supplemental financial measures of operating performance for investors because they facilitate investors’ ability to evaluate the operational strength of the Company’s business. However, there are limitations to the use of these non-GAAP measures, including that they may not be calculated the same by other companies in our industry limiting their use as a tool to compare results. Any supplemental non-GAAP financial measures referred to herein are not calculated in accordance with GAAP and they should not be considered in isolation or as substitutes for the most comparable GAAP financial measures.
EBITDA is the Company’s measure of segment profitability. For additional information please see the Company’s Quarterly Report on Form 10-Q for the quarter ended
As used herein, ”
Investor Relations Contact:
FNK IR
[email protected]
646-809-4048
|
_______________________________ |
|
1 EBITDA is non-GAAP financial measures. See “Supplemental Non-GAAP Financial Measures” below. EBITDA is also the Company’s measure of segment profitability. For additional information please see the Company’s Quarterly Report on Form 10-Q for the quarter ended |
|
2 Adjusted Operating Income is a non-GAAP financial measure. See “Supplemental Non-GAAP Financial Measures” below. |
|
|
||||||||
|
Condensed Consolidated Statements of Operations (Unaudited) |
||||||||
|
Three Months Ended |
Nine Months Ended |
|||||||
|
In thousands, except per share data |
2021 |
2020 |
2021 |
2020 |
||||
|
Revenues |
$ 49,597 |
$ 47,702 |
$ 142,610 |
$ 129,825 |
||||
|
Operating expenses |
||||||||
|
Labor |
27,165 |
27,041 |
81,883 |
76,601 |
||||
|
Production and distribution |
12,146 |
13,176 |
35,875 |
36,940 |
||||
|
Advertising, selling, general and administrative |
4,516 |
4,540 |
13,228 |
15,582 |
||||
|
Restructuring expense |
937 |
1,419 |
4,880 |
8,005 |
||||
|
Depreciation expense |
607 |
741 |
1,968 |
2,905 |
||||
|
Total operating expenses |
45,371 |
46,917 |
137,834 |
140,033 |
||||
|
Operating Income (loss) |
4,226 |
785 |
4,776 |
(10,208) |
||||
|
Other (income) expenses |
||||||||
|
Interest expense, net |
222 |
274 |
645 |
882 |
||||
|
Gain on extinguishment of debt (Paycheck Protection Program Term Note) |
– |
– |
(10,000) |
– |
||||
|
Other, net |
(572) |
2,185 |
(102) |
4,511 |
||||
|
Total other (income) expenses |
(350) |
2,459 |
(9,457) |
5,393 |
||||
|
Income (loss) before income taxes |
4,576 |
(1,674) |
14,233 |
(15,601) |
||||
|
Income tax expense (benefit) |
172 |
(53) |
1,018 |
(12,863) |
||||
|
Net income (loss) |
4,404 |
(1,621) |
13,215 |
(2,738) |
||||
|
Less Preferred Stock dividends |
125 |
125 |
372 |
372 |
||||
|
Less: Earnings attributable to participating securities |
543 |
– |
1,661 |
– |
||||
|
Income (loss) attributable to common stockholders |
$ 3,736 |
$ (1,746) |
$ 11,182 |
$ (3,110) |
||||
|
Income (loss) per common share |
||||||||
|
Basic |
$ 0.54 |
$ (0.27) |
$ 1.66 |
$ (0.48) |
||||
|
Diluted |
$ 0.52 |
$ (0.27) |
$ 1.57 |
$ (0.48) |
||||
|
Weighted-average common shares outstanding |
||||||||
|
Basic |
6,889 |
6,523 |
6,743 |
6,432 |
||||
|
Diluted |
7,162 |
6,523 |
7,153 |
6,432 |
||||
|
|
||||
|
Condensed Consolidated Balance Sheets (Unaudited) |
||||
|
In thousands, except per share data |
|
|
||
|
ASSETS |
||||
|
Current Assets |
||||
|
Cash and cash equivalents |
$ 16,044 |
$ 29,408 |
||
|
Restricted cash |
2,645 |
4,154 |
||
|
Accounts receivable (less allowance for doubtful accounts of |
52,574 |
41,533 |
||
|
Contract assets |
333 |
613 |
||
|
Prepaid expenses |
2,436 |
2,256 |
||
|
Prepaid income tax and income tax receivable |
7,492 |
7,388 |
||
|
Other current assets |
954 |
886 |
||
|
Total current assets |
82,478 |
86,238 |
||
|
Net property, plant and equipment |
7,140 |
5,878 |
||
|
Right-of-use assets |
20,379 |
24,750 |
||
|
Other assets |
2,467 |
2,632 |
||
|
Total assets |
$ 112,464 |
$ 119,498 |
||
|
LIABILITIES AND STOCKHOLDERS’ DEFICIT |
||||
|
Current liabilities |
||||
|
Accounts payable and accrued expenses |
$ 16,550 |
$ 16,294 |
||
|
Accrued payroll and related expenses |
6,256 |
5,248 |
||
|
Short-term debt |
— |
4,926 |
||
|
Deferred revenue and customer advances |
4,977 |
4,661 |
||
|
Customer postage and program deposits |
5,453 |
6,497 |
||
|
Other current liabilities |
2,535 |
2,903 |
||
|
Short-term lease liabilities |
6,615 |
6,663 |
||
|
Total current liabilities |
42,386 |
47,192 |
||
|
Long-term debt |
13,100 |
22,174 |
||
|
Pensions |
64,341 |
67,490 |
||
|
Long-term lease liabilities |
17,546 |
21,295 |
||
|
Other long-term liabilities |
3,755 |
4,747 |
||
|
Total liabilities |
141,128 |
162,898 |
||
|
Preferred Stock |
9,723 |
9,723 |
||
|
Stockholders’ deficit |
||||
|
Common stock |
12,121 |
12,121 |
||
|
Additional paid-in capital |
290,333 |
383,043 |
||
|
Retained earnings |
809,338 |
796,123 |
||
|
Less treasury stock |
(1,085,312) |
(1,178,799) |
||
|
Accumulated other comprehensive loss |
(64,867) |
(65,611) |
||
|
Total stockholders’ deficit |
(38,387) |
(53,123) |
||
|
Total liabilities, Preferred Stock and stockholders’ deficit |
$ 112,464 |
$ 119,498 |
||
|
|
||||||||
|
Reconciliations of Non-GAAP Financial Measures (Unaudited) |
||||||||
|
Three Months Ended |
Nine Months Ended |
|||||||
|
In thousands, except per share data |
2021 |
2020 |
2021 |
2020 |
||||
|
Net Income (loss) |
$ 4,404 |
$ (1,621) |
|
$ (2,738) |
||||
|
Gain on extinguishment of debt |
– |
– |
(10,000) |
– |
||||
|
Income tax expense (benefit) |
172 |
(53) |
1,018 |
(12,863) |
||||
|
Interest expense, net |
222 |
274 |
645 |
882 |
||||
|
Other, net |
(572) |
2,185 |
(102) |
4,511 |
||||
|
Depreciation expense |
607 |
741 |
1,968 |
2,905 |
||||
|
EBITDA |
$ 4,833 |
$ 1,526 |
$ 6,744 |
$ (7,303) |
||||
|
Restructuring expense |
937 |
1,419 |
4,880 |
8,005 |
||||
|
Stock-based compensation |
329 |
271 |
1,092 |
590 |
||||
|
Adjusted EBITDA |
$ 6,099 |
$ 3,216 |
|
$ 1,292 |
||||
|
Operating income (loss) |
$ 4,226 |
$ 785 |
$ 4,776 |
$ (10,208) |
||||
|
Restructuring expense |
937 |
1,419 |
4,880 |
8,005 |
||||
|
Stock-based compensation |
329 |
271 |
1,092 |
590 |
||||
|
Adjusted operating income (loss) |
$ 5,492 |
$ 2,475 |
|
$ (1,613) |
||||
|
Adjusted operating margin (a) |
11.1% |
5.2% |
7.5% |
(1.2)% |
||||
|
(a) Adjusted Operating Margin equals Adjusted Operating Income (loss) divided by Revenues |
|
|
||||||||||||
|
Statement of Operations by Segments (Unaudited) |
||||||||||||
|
Quarter ended |
Marketing |
Customer |
Fulfillment & |
Restructuring |
Unallocated |
Total |
||||||
|
(In thousands) |
||||||||||||
|
2021 |
||||||||||||
|
Revenues |
$ 14,729 |
$ 19,768 |
$ 15,100 |
$ — |
$ — |
$ 49,597 |
||||||
|
Segment Operating Expense |
$ 10,937 |
$ 15,087 |
$ 12,695 |
$ — |
$ 5,108 |
$ 43,827 |
||||||
|
Restructuring |
$ — |
$ — |
$ — |
$ 937 |
$ — |
$ 937 |
||||||
|
Contribution margin |
$ 3,792 |
$ 4,681 |
$ 2,405 |
$ (937) |
$ (5,108) |
$ 4,833 |
||||||
|
Overhead Allocation |
$ 1,020 |
$ 667 |
$ 712 |
$ — |
$ (2,399) |
$ — |
||||||
|
EBITDA |
$ 2,772 |
$ 4,014 |
$ 1,693 |
$ (937) |
$ (2,709) |
$ 4,833 |
||||||
|
Depreciation |
$ 117 |
$ 195 |
$ 182 |
$ — |
$ 113 |
$ 607 |
||||||
|
Operating income (loss) |
$ 2,655 |
$ 3,819 |
$ 1,511 |
$ (937) |
$ (2,822) |
$ 4,226 |
||||||
|
2020 |
||||||||||||
|
Revenues |
$ 15,217 |
$ 17,933 |
$ 14,552 |
$ — |
$ — |
$ 47,702 |
||||||
|
Segment Operating Expense |
$ 12,835 |
$ 14,097 |
$ 13,392 |
$ — |
$ 4,433 |
$ 44,757 |
||||||
|
Restructuring |
$ — |
$ — |
$ — |
$ 1,419 |
$ — |
$ 1,419 |
||||||
|
Contribution margin |
$ 2,382 |
$ 3,836 |
$ 1,160 |
$ (1,419) |
$ (4,433) |
$ 1,526 |
||||||
|
Overhead Allocation |
$ 1,173 |
$ 827 |
$ 886 |
$ — |
$ (2,886) |
$ — |
||||||
|
EBITDA |
$ 1,209 |
$ 3,009 |
$ 274 |
$ (1,419) |
$ (1,547) |
$ 1,526 |
||||||
|
Depreciation |
$ 141 |
$ 323 |
$ 138 |
$ — |
$ 139 |
$ 741 |
||||||
|
Operating income (loss) |
$ 1,068 |
$ 2,686 |
$ 136 |
$ (1,419) |
$ (1,686) |
$ 785 |
||||||
SOURCE
Harte Hanks Generates $0.52 in EPS for Third Quarter of 2021
Third Quarter Operational and Financial Highlights
- Revenues improved by 4% to
$49.6 million , compared to
$47.7 million in the same period last year. -
$0.52 diluted EPS for Third Quarter of 2021 vs. (
$0.27 ) for Third Quarter of 2020. - Operating income of
$4.2 million , compared to operating income of
$0.8 million in the same period last year. - Net income of
$4.4 million , compared to net loss of
($1.6) million in the same period last year. - EBITDA improved to
$4.8 million compared to
$1.5 million in the same period last year.1
The third quarter results by segment were as follows:
1) Customer Care,
2) Fulfillment & Logistics,
3) Marketing Services,
Third Quarter 2021 Results
Third quarter revenues were $49.6 million, up from
Third quarter operating income was
Third quarter Adjusted Operating Income2 was
Conference Call Information
The Company will host a conference call and live webcast to discuss these results today at 4:30 p.m. EST. To access the live call, please dial (888) 506-0059 (toll free) or (973) 528-0048 and, if requested, reference conference ID 663451. The conference call will also be webcast live in the Investors Events section of the
Following the conclusion of the live call, a telephonic replay will be available for 72 hours by dialing (877) 481-4010 or (919) 882-2331 and using the replay passcode 43515. The replay will also be available for at least 90 days in the Investors Events section of the
About Harte Hanks:
(OTCMKTS: HRTH) is a leading global customer experience company whose mission is to partner with clients to provide them with CX strategy, data-driven analytics and actionable insights combined with seamless program execution to better understand, attract, and engage their customers.
Using its unparalleled resources and award-winning talent in the areas of Customer Care, Fulfillment and Logistics, and Marketing Services,
For more information visit hartehanks.com
Cautionary Note Regarding Forward-Looking Statements:
Our press release and related earnings conference call contain “forward-looking statements” within the meaning of U.S. federal securities laws. All such statements are qualified by this cautionary note, provided pursuant to the safe harbor provisions of Section 27A of the Securities Act of 1933 and Section 21E of the Securities Exchange Act of 1934. Statements other than historical facts are forward-looking and may be identified by words such as “may,” “will,” “expects,” “believes,” “anticipates,” “plans,” “estimates,” “seeks,” “could,” “intends,” or words of similar meaning. These forward-looking statements are based on current information, expectations and estimates and involve risks, uncertainties, assumptions and other factors that are difficult to predict and that could cause actual results to vary materially from what is expressed in or indicated by the forward-looking statements. In that event, our business, financial condition, results of operations or liquidity could be materially adversely affected and investors in our securities could lose part or all of their investments. These risks, uncertainties, assumptions and other factors include: (a) local, national and international economic and business conditions, including (i) the outbreak of diseases, such as the COVID-19 coronavirus and new variants thereof, which has curtailed travel to and from certain countries and geographic regions, created supply chain disruption and shortages, disrupted business operations and reduced consumer spending, (ii) market conditions that may adversely impact marketing expenditures and (iii) the impact of economic environments and competitive pressures on the financial condition, marketing expenditures and activities of our clients and prospects; (b) the demand for our products and services by clients and prospective clients, including (i) the willingness of existing clients to maintain or increase their spending on products and services that are or remain profitable for us, and (ii) our ability to predict changes in client needs and preferences; (c) economic and other business factors that impact the industry verticals we serve, including competition and consolidation of current and prospective clients, vendors and partners in these verticals; (d) our ability to manage and timely adjust our facilities, capacity, workforce and cost structure to effectively serve our clients; (e) our ability to improve our processes and to provide new products and services in a timely and cost-effective manner though development, license, partnership or acquisition; (f) our ability to protect our facilities against security breaches and other interruptions and to protect sensitive personal information of our clients and their customers; (g) our ability to respond to increasing concern, regulation and legal action over consumer privacy issues, including changing requirements for collection, processing and use of information; (h) the impact of privacy and other regulations, including restrictions on unsolicited marketing communications and other consumer protection laws; (i) fluctuations in fuel prices, paper prices, postal rates and postal delivery schedules; (j) the number of shares, if any, that we may repurchase in connection with our repurchase program; (k) unanticipated developments regarding litigation or other contingent liabilities; (l) our ability to complete anticipated divestitures and reorganizations, including cost-saving initiatives; (m) our ability to realize the expected tax refunds; and (n) other factors discussed from time to time in our filings with the Securities and Exchange Commission, including under “Item 1A. Risk Factors” in our Annual Report on Form 10-K for the year ended December 31, 2020 which was filed on March 24, 2021. The forward-looking statements in this press release and our related earnings conference call are made only as of the date hereof, and we undertake no obligation to update publicly any forward-looking statement, even if new information becomes available or other events occur in the future.
Supplemental Non-GAAP Financial Measures:
The Company reports its financial results in accordance with generally accepted accounting principles (“GAAP”). In this press release and our related earnings conference call, however, the Company may use certain non-GAAP measures of financial performance in order to provide investors with a better understanding of operating results and underlying trends to assess the Company’s performance and liquidity. We have presented herein a reconciliation of these measures to the most directly comparable GAAP financial measure.
The Company presents the non-GAAP financial measure “Adjusted Operating Income (Loss)” as a measure useful to both management and investors in their analysis of the Company’s financial results because it facilitates a period-to-period comparison of Operating Revenue and Operating Income (Loss) by excluding restructuring expense, impairment expense and stock-based compensation. The most directly comparable measure for this non-GAAP financial measure is Operating Income (Loss).
The Company also presents the non-GAAP financial measure “Adjusted EBITDA” as a supplemental measure of operating performance in order to provide an improved understanding of underlying performance trends. The Company defines “Adjusted EBITDA” as earnings before interest expense net, income tax expense (benefit), depreciation expense, restructuring expense, impairment expense, stock-based compensation expense, and other non-cash expenses. The most directly comparable measure for Adjusted EBITDA is Net Income (Loss). We believe Adjusted EBITDA is an important performance metric because it facilitates the analysis of our results, exclusive of certain non-cash items, including items which do not directly correlate to our business operations; however, we urge investors to review the reconciliation of non-GAAP Adjusted EBITDA to the comparable GAAP Net Income (Loss), which is included in this press release, and not to rely on any single financial measure to evaluate the Company’s financial performance.
The foregoing measures do not serve as a substitute and should not be construed as a substitute for GAAP performance, but provide supplemental information concerning our performance that our investors and we find useful. The Company evaluates its operating performance based on several measures, including these non-GAAP financial measures. The Company believes that the presentation of these non-GAAP financial measures in this press release and earnings conference call presentations are useful supplemental financial measures of operating performance for investors because they facilitate investors’ ability to evaluate the operational strength of the Company’s business. However, there are limitations to the use of these non-GAAP measures, including that they may not be calculated the same by other companies in our industry limiting their use as a tool to compare results. Any supplemental non-GAAP financial measures referred to herein are not calculated in accordance with GAAP and they should not be considered in isolation or as substitutes for the most comparable GAAP financial measures.
EBITDA is the Company’s measure of segment profitability. For additional information please see the Company’s Quarterly Report on Form 10-Q for the quarter ended
As used herein, ”
Investor Relations Contact:
FNK IR
[email protected]
646-809-4048
|
_______________________________ |
|
1 EBITDA is non-GAAP financial measures. See “Supplemental Non-GAAP Financial Measures” below. EBITDA is also the Company’s measure of segment profitability. For additional information please see the Company’s Quarterly Report on Form 10-Q for the quarter ended |
|
2 Adjusted Operating Income is a non-GAAP financial measure. See “Supplemental Non-GAAP Financial Measures” below. |
|
|
||||||||
|
Condensed Consolidated Statements of Operations (Unaudited) |
||||||||
|
Three Months Ended |
Nine Months Ended |
|||||||
|
In thousands, except per share data |
2021 |
2020 |
2021 |
2020 |
||||
|
Revenues |
$ 49,597 |
$ 47,702 |
$ 142,610 |
$ 129,825 |
||||
|
Operating expenses |
||||||||
|
Labor |
27,165 |
27,041 |
81,883 |
76,601 |
||||
|
Production and distribution |
12,146 |
13,176 |
35,875 |
36,940 |
||||
|
Advertising, selling, general and administrative |
4,516 |
4,540 |
13,228 |
15,582 |
||||
|
Restructuring expense |
937 |
1,419 |
4,880 |
8,005 |
||||
|
Depreciation expense |
607 |
741 |
1,968 |
2,905 |
||||
|
Total operating expenses |
45,371 |
46,917 |
137,834 |
140,033 |
||||
|
Operating Income (loss) |
4,226 |
785 |
4,776 |
(10,208) |
||||
|
Other (income) expenses |
||||||||
|
Interest expense, net |
222 |
274 |
645 |
882 |
||||
|
Gain on extinguishment of debt (Paycheck Protection Program Term Note) |
– |
– |
(10,000) |
– |
||||
|
Other, net |
(572) |
2,185 |
(102) |
4,511 |
||||
|
Total other (income) expenses |
(350) |
2,459 |
(9,457) |
5,393 |
||||
|
Income (loss) before income taxes |
4,576 |
(1,674) |
14,233 |
(15,601) |
||||
|
Income tax expense (benefit) |
172 |
(53) |
1,018 |
(12,863) |
||||
|
Net income (loss) |
4,404 |
(1,621) |
13,215 |
(2,738) |
||||
|
Less Preferred Stock dividends |
125 |
125 |
372 |
372 |
||||
|
Less: Earnings attributable to participating securities |
543 |
– |
1,661 |
– |
||||
|
Income (loss) attributable to common stockholders |
$ 3,736 |
$ (1,746) |
$ 11,182 |
$ (3,110) |
||||
|
Income (loss) per common share |
||||||||
|
Basic |
$ 0.54 |
$ (0.27) |
$ 1.66 |
$ (0.48) |
||||
|
Diluted |
$ 0.52 |
$ (0.27) |
$ 1.57 |
$ (0.48) |
||||
|
Weighted-average common shares outstanding |
||||||||
|
Basic |
6,889 |
6,523 |
6,743 |
6,432 |
||||
|
Diluted |
7,162 |
6,523 |
7,153 |
6,432 |
||||
|
|
||||
|
Condensed Consolidated Balance Sheets (Unaudited) |
||||
|
In thousands, except per share data |
|
|
||
|
ASSETS |
||||
|
Current Assets |
||||
|
Cash and cash equivalents |
$ 16,044 |
$ 29,408 |
||
|
Restricted cash |
2,645 |
4,154 |
||
|
Accounts receivable (less allowance for doubtful accounts of |
52,574 |
41,533 |
||
|
Contract assets |
333 |
613 |
||
|
Prepaid expenses |
2,436 |
2,256 |
||
|
Prepaid income tax and income tax receivable |
7,492 |
7,388 |
||
|
Other current assets |
954 |
886 |
||
|
Total current assets |
82,478 |
86,238 |
||
|
Net property, plant and equipment |
7,140 |
5,878 |
||
|
Right-of-use assets |
20,379 |
24,750 |
||
|
Other assets |
2,467 |
2,632 |
||
|
Total assets |
$ 112,464 |
$ 119,498 |
||
|
LIABILITIES AND STOCKHOLDERS’ DEFICIT |
||||
|
Current liabilities |
||||
|
Accounts payable and accrued expenses |
$ 16,550 |
$ 16,294 |
||
|
Accrued payroll and related expenses |
6,256 |
5,248 |
||
|
Short-term debt |
— |
4,926 |
||
|
Deferred revenue and customer advances |
4,977 |
4,661 |
||
|
Customer postage and program deposits |
5,453 |
6,497 |
||
|
Other current liabilities |
2,535 |
2,903 |
||
|
Short-term lease liabilities |
6,615 |
6,663 |
||
|
Total current liabilities |
42,386 |
47,192 |
||
|
Long-term debt |
13,100 |
22,174 |
||
|
Pensions |
64,341 |
67,490 |
||
|
Long-term lease liabilities |
17,546 |
21,295 |
||
|
Other long-term liabilities |
3,755 |
4,747 |
||
|
Total liabilities |
141,128 |
162,898 |
||
|
Preferred Stock |
9,723 |
9,723 |
||
|
Stockholders’ deficit |
||||
|
Common stock |
12,121 |
12,121 |
||
|
Additional paid-in capital |
290,333 |
383,043 |
||
|
Retained earnings |
809,338 |
796,123 |
||
|
Less treasury stock |
(1,085,312) |
(1,178,799) |
||
|
Accumulated other comprehensive loss |
(64,867) |
(65,611) |
||
|
Total stockholders’ deficit |
(38,387) |
(53,123) |
||
|
Total liabilities, Preferred Stock and stockholders’ deficit |
$ 112,464 |
$ 119,498 |
||
|
|
||||||||
|
Reconciliations of Non-GAAP Financial Measures (Unaudited) |
||||||||
|
Three Months Ended |
Nine Months Ended |
|||||||
|
In thousands, except per share data |
2021 |
2020 |
2021 |
2020 |
||||
|
Net Income (loss) |
$ 4,404 |
$ (1,621) |
|
$ (2,738) |
||||
|
Gain on extinguishment of debt |
– |
– |
(10,000) |
– |
||||
|
Income tax expense (benefit) |
172 |
(53) |
1,018 |
(12,863) |
||||
|
Interest expense, net |
222 |
274 |
645 |
882 |
||||
|
Other, net |
(572) |
2,185 |
(102) |
4,511 |
||||
|
Depreciation expense |
607 |
741 |
1,968 |
2,905 |
||||
|
EBITDA |
$ 4,833 |
$ 1,526 |
$ 6,744 |
$ (7,303) |
||||
|
Restructuring expense |
937 |
1,419 |
4,880 |
8,005 |
||||
|
Stock-based compensation |
329 |
271 |
1,092 |
590 |
||||
|
Adjusted EBITDA |
$ 6,099 |
$ 3,216 |
|
$ 1,292 |
||||
|
Operating income (loss) |
$ 4,226 |
$ 785 |
$ 4,776 |
$ (10,208) |
||||
|
Restructuring expense |
937 |
1,419 |
4,880 |
8,005 |
||||
|
Stock-based compensation |
329 |
271 |
1,092 |
590 |
||||
|
Adjusted operating income (loss) |
$ 5,492 |
$ 2,475 |
|
$ (1,613) |
||||
|
Adjusted operating margin (a) |
11.1% |
5.2% |
7.5% |
(1.2)% |
||||
|
(a) Adjusted Operating Margin equals Adjusted Operating Income (loss) divided by Revenues |
|
|
||||||||||||
|
Statement of Operations by Segments (Unaudited) |
||||||||||||
|
Quarter ended |
Marketing |
Customer |
Fulfillment & |
Restructuring |
Unallocated |
Total |
||||||
|
(In thousands) |
||||||||||||
|
2021 |
||||||||||||
|
Revenues |
$ 14,729 |
$ 19,768 |
$ 15,100 |
$ — |
$ — |
$ 49,597 |
||||||
|
Segment Operating Expense |
$ 10,937 |
$ 15,087 |
$ 12,695 |
$ — |
$ 5,108 |
$ 43,827 |
||||||
|
Restructuring |
$ — |
$ — |
$ — |
$ 937 |
$ — |
$ 937 |
||||||
|
Contribution margin |
$ 3,792 |
$ 4,681 |
$ 2,405 |
$ (937) |
$ (5,108) |
$ 4,833 |
||||||
|
Overhead Allocation |
$ 1,020 |
$ 667 |
$ 712 |
$ — |
$ (2,399) |
$ — |
||||||
|
EBITDA |
$ 2,772 |
$ 4,014 |
$ 1,693 |
$ (937) |
$ (2,709) |
$ 4,833 |
||||||
|
Depreciation |
$ 117 |
$ 195 |
$ 182 |
$ — |
$ 113 |
$ 607 |
||||||
|
Operating income (loss) |
$ 2,655 |
$ 3,819 |
$ 1,511 |
$ (937) |
$ (2,822) |
$ 4,226 |
||||||
|
2020 |
||||||||||||
|
Revenues |
$ 15,217 |
$ 17,933 |
$ 14,552 |
$ — |
$ — |
$ 47,702 |
||||||
|
Segment Operating Expense |
$ 12,835 |
$ 14,097 |
$ 13,392 |
$ — |
$ 4,433 |
$ 44,757 |
||||||
|
Restructuring |
$ — |
$ — |
$ — |
$ 1,419 |
$ — |
$ 1,419 |
||||||
|
Contribution margin |
$ 2,382 |
$ 3,836 |
$ 1,160 |
$ (1,419) |
$ (4,433) |
$ 1,526 |
||||||
|
Overhead Allocation |
$ 1,173 |
$ 827 |
$ 886 |
$ — |
$ (2,886) |
$ — |
||||||
|
EBITDA |
$ 1,209 |
$ 3,009 |
$ 274 |
$ (1,419) |
$ (1,547) |
$ 1,526 |
||||||
|
Depreciation |
$ 141 |
$ 323 |
$ 138 |
$ — |
$ 139 |
$ 741 |
||||||
|
Operating income (loss) |
$ 1,068 |
$ 2,686 |
$ 136 |
$ (1,419) |
$ (1,686) |
$ 785 |
||||||
SOURCE
Harte Hanks (HRTH) – A Well-Oiled, More Efficient, Cash Flow Machine

Friday, November 12, 2021
Harte Hanks (HRTH)
A Well-Oiled, More Efficient, Cash Flow Machine
Harte-Hanks is a marketing services company that provides multichannel marketing solutions as well as consulting, data analytics, and strategic assessment. The company’s offerings focus on business-to-business, retail, finance, and automotive segments through digital, social, mobile, and print media offerings. Harte-Hanks strives to develop better customer relationships through its marketing and analytical services for clients. The majority of its revenue is derived from its marketing services in the retail, technology, and consumer brand segments.
Michael Kupinski, Director of Research, Noble Capital Markets, Inc.
Refer to the full report for the price target, fundamental analysis, and rating.
A surprisingly strong Q3. Total company revenue increased a surprising 4.0% to $49.6 million, well above our $45.3 million estimate, fueled by a 10.2% increase in its Customer Care segment revenues. Customer Care revenues beat our estimate by a whopping 29.2%, as the Covid related customer did not go away as anticipate and the company gained additional clients. The company reported its 6th consecutive quarter of positive EBITDA, with adj. EBITDA beating expectations, $6.1 million versus our $3.3 million estimate.
Favorable momentum. Customer Care is expected to be stronger than originally expected as the Covid related business is not expected to fall off until next year. As a result, we are raising our Q4 total company revenue expectation from $42.5 million to $48.7 million. We are raising our Q4 adj. EBITDA estimate from $3.1 million to $4.4 million, bringing our full year 2021 adj. EBITDA estimate to …
This Company Sponsored Research is provided by Noble Capital Markets, Inc., a FINRA and S.E.C. registered broker-dealer (B/D).
*Analyst certification and important disclosures included in the full report. NOTE: investment decisions should not be based upon the content of this research summary. Proper due diligence is required before making any investment decision.
Release – Gray Announces Closing Of Offering Of $1300.0 Million Of 5.375 Senior Notes Due 2031
Gray Announces Closing Of Offering Of $1,300.0 Million Of 5.375% Senior Notes Due 2031
ATLANTA, Nov. 09, 2021 (GLOBE NEWSWIRE) — Gray Television, Inc. (“Gray”) (NYSE: GTN) announced today that it has completed its previously announced offering of $1,300.0 million in aggregate principal amount of 5.375% senior notes due 2031 (the “Notes”) by Gray Escrow II, Inc., a special purpose wholly owned subsidiary of Gray (the “Escrow Issuer”). The Notes were issued at 100.000% of par.
At closing, the proceeds of the Notes were funded into an escrow account. The Notes were sold to finance, together with cash on hand and anticipated borrowings under Gray’s senior credit facility, Gray’s pending merger with Meredith Corporation (“Meredith”), pursuant to which Gray will acquire Meredith’s local media group, immediately after and subject to Meredith’s spin-off of its national media group to the Meredith shareholders (the “Meredith Acquisition”), which is expected to close prior to Gray’s 2021 fiscal year end. If the Meredith Acquisition is consummated and certain other conditions are satisfied, the net proceeds from the offering will be released from the escrow account to fund the Meredith Acquisition, the Escrow Issuer will merge with and into Gray, and Gray will become the primary obligor under the Notes (the “Assumption”).
Following the Assumption, the Notes will be guaranteed, jointly and severally, by each existing and future restricted subsidiary of Gray that guarantees Gray’s existing senior credit facility.
Interest on the Notes accrues from November 9, 2021 and is payable semiannually, on May 15 and November 15 of each year, commencing May 15, 2022. The Notes mature on November 15, 2031.
The Notes and the related guarantees have not been, and will not be, registered under the Securities Act of 1933 or the securities laws of any other jurisdiction and may not be offered or sold in the United States absent registration or an applicable exemption therefrom. The Notes were offered only to qualified institutional buyers under Rule 144A and to persons outside the United States under Regulation S.
Cautionary Statements for Purposes of the “Safe Harbor” Provisions of the Private Securities Litigation Reform Act
This press release contains certain forward-looking statements that are based largely on Gray’s current expectations and reflect various estimates and assumptions by Gray. These statements are statements other than those of historical fact, and may be identified by words such as “estimates,” “expect,” “anticipate,” “will,” “implied,” “assume” and similar expressions. Forward-looking statements are subject to certain risks, trends and uncertainties that could cause actual results and achievements to differ materially from those expressed in such forward-looking statements. Such risks, trends and uncertainties, which in some instances are beyond Gray’s control, include Gray’s ability to complete its pending acquisition of Meredith Corporation’s local media group or other pending transactions on the terms and within the timeframe currently contemplated, any material regulatory or other unexpected requirements in connection therewith, and other future events. Gray is subject to additional risks and uncertainties described in Gray’s quarterly and annual reports filed with the Securities and Exchange Commission from time to time, including in the “Risk Factors,” and management’s discussion and analysis of financial condition and results of operations sections contained therein, which reports are made publicly available via its website, www.gray.tv. Any forward-looking statements in this communication should be evaluated in light of these important risk factors. This press release reflects management’s views as of the date hereof. Except to the extent required by applicable law, Gray undertakes no obligation to update or revise any information contained in this communication beyond the date hereof, whether as a result of new information, future events or otherwise.
Contact Data
Gray Contacts: www.gray.tv Jim Ryan, Executive Vice President and Chief Financial Officer, 404-504-9828 Kevin P. Latek, Executive Vice President, Chief Legal and Development Officer, 404-266-8333
Gray Announces Closing Of Offering Of $1,300.0 Million Of 5.375% Senior Notes Due 2031
ATLANTA, Nov. 09, 2021 (GLOBE NEWSWIRE) — Gray Television, Inc. (“Gray”) (NYSE: GTN) announced today that it has completed its previously announced offering of $1,300.0 million in aggregate principal amount of 5.375% senior notes due 2031 (the “Notes”) by Gray Escrow II, Inc., a special purpose wholly owned subsidiary of Gray (the “Escrow Issuer”). The Notes were issued at 100.000% of par.
At closing, the proceeds of the Notes were funded into an escrow account. The Notes were sold to finance, together with cash on hand and anticipated borrowings under Gray’s senior credit facility, Gray’s pending merger with Meredith Corporation (“Meredith”), pursuant to which Gray will acquire Meredith’s local media group, immediately after and subject to Meredith’s spin-off of its national media group to the Meredith shareholders (the “Meredith Acquisition”), which is expected to close prior to Gray’s 2021 fiscal year end. If the Meredith Acquisition is consummated and certain other conditions are satisfied, the net proceeds from the offering will be released from the escrow account to fund the Meredith Acquisition, the Escrow Issuer will merge with and into Gray, and Gray will become the primary obligor under the Notes (the “Assumption”).
Following the Assumption, the Notes will be guaranteed, jointly and severally, by each existing and future restricted subsidiary of Gray that guarantees Gray’s existing senior credit facility.
Interest on the Notes accrues from November 9, 2021 and is payable semiannually, on May 15 and November 15 of each year, commencing May 15, 2022. The Notes mature on November 15, 2031.
The Notes and the related guarantees have not been, and will not be, registered under the Securities Act of 1933 or the securities laws of any other jurisdiction and may not be offered or sold in the United States absent registration or an applicable exemption therefrom. The Notes were offered only to qualified institutional buyers under Rule 144A and to persons outside the United States under Regulation S.
Cautionary Statements for Purposes of the “Safe Harbor” Provisions of the Private Securities Litigation Reform Act
This press release contains certain forward-looking statements that are based largely on Gray’s current expectations and reflect various estimates and assumptions by Gray. These statements are statements other than those of historical fact, and may be identified by words such as “estimates,” “expect,” “anticipate,” “will,” “implied,” “assume” and similar expressions. Forward-looking statements are subject to certain risks, trends and uncertainties that could cause actual results and achievements to differ materially from those expressed in such forward-looking statements. Such risks, trends and uncertainties, which in some instances are beyond Gray’s control, include Gray’s ability to complete its pending acquisition of Meredith Corporation’s local media group or other pending transactions on the terms and within the timeframe currently contemplated, any material regulatory or other unexpected requirements in connection therewith, and other future events. Gray is subject to additional risks and uncertainties described in Gray’s quarterly and annual reports filed with the Securities and Exchange Commission from time to time, including in the “Risk Factors,” and management’s discussion and analysis of financial condition and results of operations sections contained therein, which reports are made publicly available via its website, www.gray.tv. Any forward-looking statements in this communication should be evaluated in light of these important risk factors. This press release reflects management’s views as of the date hereof. Except to the extent required by applicable law, Gray undertakes no obligation to update or revise any information contained in this communication beyond the date hereof, whether as a result of new information, future events or otherwise.
Contact Data
Gray Contacts: www.gray.tv Jim Ryan, Executive Vice President and Chief Financial Officer, 404-504-9828 Kevin P. Latek, Executive Vice President, Chief Legal and Development Officer, 404-266-8333
E.W. Scripps (SSP) – We Are Connected

Monday, November 08, 2021
E.W. Scripps (SSP)
We Are Connected!
The E.W. Scripps Co. (www.scripps.com) serves audiences and businesses through a growing portfolio of television, print and digital media brands. After approval of its acquisition of two Granite Broadcasting stations later this year, Scripps will own 21 local television stations as well as daily newspapers in 13 markets across the United States. It also runs an expanding collection of local and national digital journalism and information businesses including digital video news service Newsy. Scripps also produces television programming, runs an award-winning investigative reporting newsroom in Washington, D.C., and serves as the longtime steward of one of the nation’s largest, most successful and longest-running educational programs, Scripps National Spelling Bee. Founded in 1879, Scripps is focused on the stories of tomorrow.
Michael Kupinski, Director of Research, Noble Capital Markets, Inc.
Refer to the full report for the price target, fundamental analysis, and rating.
Q3 exceeds expectations. Total company revenues increased 11.7% to $555.2 million, which was slightly above our $546.8 million estimate. The largest upside revenue variance was in the company’s Networks segment, which increased 17.8%, above our 14.2% growth estimate and above management’s previous guidance of up mid teens. Adjusted EBITDA was $132.4 million, 14.3% above our $115.8 million estimate. The largest EBITDA variance was in its Network segment. Our original estimates factored in higher costs due to the launch of Newsy, Defy and True—-.
Limited supply chain/labor shortage impact. All of its leading advertising categories are trending favorably and more than offsetting the Auto category, which has been hurt by chip shortages. Management indicated that Auto may not rebound until the second half 2022. Nonetheless, all other categories are growing nicely, including a large emerging ad category, Sports Betting …
This research is provided by Noble Capital Markets, Inc., a FINRA and S.E.C. registered broker-dealer (B/D).
*Analyst certification and important disclosures included in the full report. NOTE: investment decisions should not be based upon the content of this research summary. Proper due diligence is required before making any investment decision.