Release – FAT Brands Inc. Reports Third Quarter 2024 Financial Results

Research News and Market Data on FAT

LOS ANGELES, Oct. 30, 2024 (GLOBE NEWSWIRE) — FAT (Fresh. Authentic. Tasty.) Brands Inc. (NASDAQ: FAT) (“FAT Brands” or the “Company”) today reported financial results for the fiscal third quarter ended September 29, 2024.

Andy Wiederhorn, Chairman of FAT Brands, said, “Over the last three years, we have expanded our brand portfolio to include 18 distinct concepts while our footprint has increased tenfold, now encompassing over 2,300 locations across more than 40 countries and 49 U.S. states or territories. We opened 22 new units during the third quarter, bringing our year-to-date openings to 71 new units and are on track to end the year with 100 new units.”

Wiederhorn added, “We have signed 225 development deals year-to-date versus 226 deals in all of 2023, bringing our current development pipeline to approximately 1,000 locations. This is a strong indicator of confidence within the FAT franchise system.”

Ken Kuick, Co-Chief Executive Officer of FAT Brands, said, “We continue to prioritize accelerated growth in our Polished Casual category, particularly through Twin Peaks, our fastest-growing concept. Year to date, we opened nine new lodges, bringing our total to 115 locations. We also completed our first Smokey Bones to Twin Peaks conversion in Lakeland, Florida during the third quarter, with our second conversion underway and several more planned for next year.”

Rob Rosen, Co-Chief Executive Officer of FAT Brands, said, “In May, Twin Peaks and Smokey Bones, as a combined entity, took a significant step towards becoming a standalone public company. We view this potential IPO or alternative transaction as a strategic opportunity to unlock value for FAT shareholders. Shortly, we intend to refinance Twin Peaks’ securitization debt, which will optimize our financial structure prior to any IPO or other transaction.”

Fiscal Third Quarter 2024 Highlights

  • Total revenue grew 31.1% to $143.4 million compared to $109.4 million in the fiscal third quarter of 2023
    • System-wide sales grew 6.4% in the fiscal third quarter of 2024 compared to the prior year fiscal quarter
    • Year-to-date system-wide same-store sales declined 2.7% compared to the prior year
    • 22 new store openings during the fiscal third quarter of 2024
  • Net loss of $44.8 million, or $2.74 per diluted share, compared to $24.7 million, or $1.59 per diluted share, in the fiscal third quarter of 2023
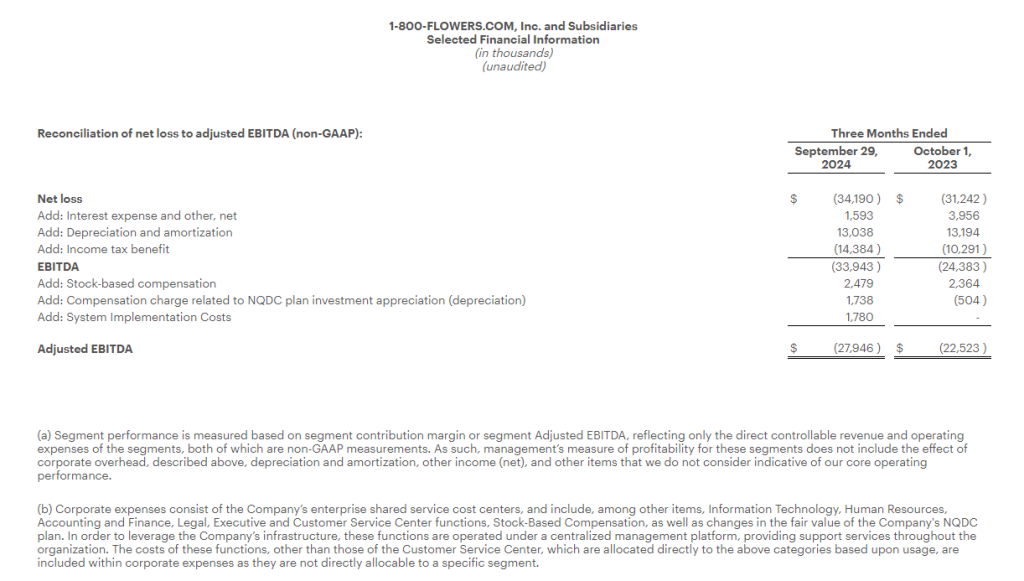
  • EBITDA(1) of $1.7 million compared to $10.8 million in the fiscal third quarter of 2023
  • Adjusted EBITDA(1) of $14.1 million compared to $21.9 million in the fiscal third quarter of 2023
  • Adjusted net loss(1) of $38.0 million, or $2.34 per diluted share, compared to adjusted net loss(1) of $17.1 million, or $1.14 per diluted share, in the fiscal third quarter of 2023

(1) EBITDA, adjusted EBITDA and adjusted net loss are non-GAAP measures defined below, under “Non-GAAP Measures”. Reconciliation of GAAP net loss to EBITDA, adjusted EBITDA and adjusted net loss are included in the accompanying financial tables.

Summary of Fiscal Third Quarter 2024 Financial Results

Total revenue increased $34.0 million, or 31.1%, in the third quarter of 2024 to $143.4 million compared to $109.4 million in the same period of 2023, driven by the acquisition of Smokey Bones in September 2023 and revenues from new restaurant openings.

Costs and expenses consist of general and administrative expense, cost of restaurant and factory revenues, depreciation and amortization, refranchising net loss and advertising fees. Costs and expenses increased $49.5 million, or 48.1%, in the third quarter of 2024 to $152.2 million compared to the same period in the prior year, primarily due to the acquisition of Smokey Bones in September 2023 and increased activity from Company-owned restaurants and the Company’s factory.

General and administrative expense increased $10.0 million, or 41.0%, in the third quarter of 2024 to $34.5 million compared to $24.5 million in the same period in the prior year, primarily due to the acquisition of Smokey Bones in September 2023 and increased professional fees related to pending litigation.

Cost of restaurant and factory revenues was related to the operations of the company-owned restaurant locations and dough factory and increased $37.6 million, or 63.6%, in the third quarter of 2024, primarily due to the acquisition of Smokey Bones in September 2023 and higher company-owned restaurant sales.

Depreciation and amortization increased $3.7 million, or 52.5% in the third quarter of 2024 compared to the same period in the prior year, primarily due to the acquisition of Smokey Bones in September 2023 and depreciation of new property and equipment at company-owned restaurant locations.

Refranchising net loss, comprised of restaurant operating costs, net of food sales, was $0.2 million in the third quarter of 2024 compared to $0.4 million in the third quarter of 2023.

Advertising expenses decreased $1.6 million in the third quarter of 2024 compared to the prior year period. These expenses vary in relation to advertising revenues.

Total other expense, net, for the third quarter of 2024 and 2023 was $35.8 million and $32.6 million, respectively, which is inclusive of interest expense of $35.5 million and $29.7 million, respectively. This increase is primarily due to new debt issuances. Total other expense, net, for the third quarter of 2023 also consisted of a $2.7 million net loss on the extinguishment of debt.

Adjusted net loss(1) was $38.0 million, or $2.34 per diluted share, compared to adjusted net loss(1) of $17.1 million, or $1.14 per diluted share, in the fiscal third quarter of 2023.

Key Financial Definitions

New store openings – The number of new store openings reflects the number of stores opened during a particular reporting period. The total number of new stores per reporting period and the timing of stores openings has, and will continue to have, an impact on our results.

Same-store sales growth – Same-store sales growth reflects the change in year-over-year sales for the comparable store base, which we define as the number of stores open and in the FAT Brands system for at least one full fiscal year. For stores that were temporarily closed, sales in the current and prior period are adjusted accordingly. Given our focused marketing efforts and public excitement surrounding each opening, new stores often experience an initial start-up period with considerably higher than average sales volumes, which subsequently decrease to stabilized levels after three to six months. Additionally, when we acquire a brand, it may take several months to integrate fully each location of said brand into the FAT Brands platform. Thus, we do not include stores in the comparable base until they have been open and in the FAT Brands system for at least one full fiscal year.

System-wide sales growth – System-wide sales growth reflects the percentage change in sales in any given fiscal period compared to the prior fiscal period for all stores in that brand only when the brand is owned by FAT Brands. Because of acquisitions, new store openings and store closures, the stores open throughout both fiscal periods being compared may be different from period to period.

Conference Call and Webcast

FAT Brands will host a conference call and webcast to discuss its fiscal third quarter 2024 financial results today at 5:00 PM ET. Hosting the conference call and webcast will be Andy Wiederhorn, Chairman of the Board, and Ken Kuick, Co-Chief Executive Officer and Chief Financial Officer.

The conference call can be accessed live over the phone by dialing 1-877-704-4453 from the U.S. or 1-201-389-0920 internationally. A replay will be available after the call until Wednesday, November 20, 2024, and can be accessed by dialing 1-844-512-2921 from the U.S. or 1-412-317-6671 internationally. The passcode is 13748855. The webcast will be available at www.fatbrands.com under the “Investors” section and will be archived on the site shortly after the call has concluded.

About FAT (Fresh. Authentic. Tasty.) Brands

FAT Brands (NASDAQ: FAT) is a leading global franchising company that strategically acquires, markets, and develops fast casual, quick-service, casual dining, and polished casual dining concepts around the world. The Company currently owns 18 restaurant brands: Round Table Pizza, Fatburger, Marble Slab Creamery, Johnny Rockets, Fazoli’s, Twin Peaks, Smokey Bones, Great American Cookies, Hot Dog on a Stick, Buffalo’s Cafe & Express, Hurricane Grill & Wings, Pretzelmaker, Elevation Burger, Native Grill & Wings, Yalla Mediterranean and Ponderosa and Bonanza Steakhouses and franchises and owns approximately 2,300 units worldwide. For more information, please visit www.fatbrands.com.

Forward-Looking Statements

This press release contains forward-looking statements within the meaning of the Private Securities Litigation Reform Act of 1995, including statements relating to the future financial and operating results of the Company, the timing and performance of new store openings, our ability to conduct future accretive acquisitions and our pipeline of new store locations. Forward-looking statements generally use words such as “expect,” “foresee,” “anticipate,” “believe,” “project,” “should,” “estimate,” “will,” “plans,” “forecast,” and similar expressions, and reflect our expectations concerning the future. Forward-looking statements are subject to significant business, economic and competitive risks, uncertainties and contingencies, many of which are difficult to predict and beyond our control, which could cause our actual results to differ materially from the results expressed or implied in such forward-looking statements. We refer you to the documents that we file from time to time with the Securities and Exchange Commission, such as our reports on Form 10-K, Form 10-Q and Form 8-K, for a discussion of these and other risks and uncertainties that could cause our actual results to differ materially from our current expectations and from the forward-looking statements contained in this press release. We undertake no obligation to update any forward-looking statements to reflect events or circumstances occurring after the date of this press release.

Non-GAAP Measures (Unaudited)

This press release includes the non-GAAP financial measures of EBITDA, adjusted EBITDA and adjusted net loss.

EBITDA is defined as earnings before interest, taxes, and depreciation and amortization. We use the term EBITDA, as opposed to income from operations, as it is widely used by analysts, investors, and other interested parties to evaluate companies in our industry. We believe that EBITDA is an appropriate measure of operating performance because it eliminates the impact of expenses that do not relate to business performance. EBITDA is not a measure of our financial performance or liquidity that is determined in accordance with generally accepted accounting principles (“GAAP”), and should not be considered as an alternative to net loss as a measure of financial performance or cash flows from operations as measures of liquidity, or any other performance measure derived in accordance with GAAP.

Adjusted EBITDA is defined as EBITDA (as defined above), excluding expenses related to acquisitions, refranchising loss, impairment charges, and certain non-recurring or non-cash items that the Company does not believe directly reflect its core operations and may not be indicative of the Company’s recurring business operations.

Adjusted net loss is a supplemental measure of financial performance that is not required by or presented in accordance with GAAP. Adjusted net loss is defined as net loss plus the impact of adjustments and the tax effects of such adjustments. Adjusted net loss is presented because we believe it helps convey supplemental information to investors regarding our performance, excluding the impact of special items that affect the comparability of results in past quarters to expected results in future quarters. Adjusted net loss as presented may not be comparable to other similarly titled measures of other companies, and our presentation of adjusted net loss should not be construed as an inference that our future results will be unaffected by excluded or unusual items. Our management uses this non-GAAP financial measure to analyze changes in our underlying business from quarter to quarter based on comparable financial results.

Reconciliations of net loss presented in accordance with GAAP to EBITDA, adjusted EBITDA and adjusted net loss are set forth in the tables below.

Investor Relations:
ICR
Michelle Michalski
ir-fatbrands@icrinc.com
646-277-1224

Media Relations:
Erin Mandzik
emandzik@fatbrands.com
860-212-6509

FAT Brands Inc. Consolidated Statements of Operations

Click Here for Full Report

Nasdaq, S&P 500 Slide as Meta and Microsoft Trigger AI Spending Concerns

Key Points:
– Meta and Microsoft’s AI spending plans trigger a broad tech stock decline.
– U.S. 10-year Treasury yield climbs to 4.33%, pressuring equities.
– Core PCE inflation and jobless claims data keep Fed policy under scrutiny.

Wall Street’s main indexes dropped sharply on Thursday, driven by renewed concerns over Big Tech’s escalating artificial intelligence (AI) expenses. While both Meta and Microsoft posted better-than-expected quarterly earnings, their plans to increase already significant spending on AI infrastructure raised red flags among investors. This push toward higher AI investment triggered a sell-off in the technology sector as fears surfaced that such costs could eat into future profitability.

The Nasdaq Composite, heavily influenced by tech giants, fell approximately 2%, while the S&P 500 dropped about 1.6%, reflecting the widespread impact of these concerns. Meta and Microsoft’s focus on AI investments caused their shares to slide, signaling that, despite their strong earnings, heightened spending in this area could offset potential gains. This trend extended to other major technology companies, such as Amazon and Apple, which are also slated to report earnings soon. Investors will closely monitor their results as the “Magnificent Seven” tech giants—the group of leading high-value companies that have largely driven market gains—determine much of the market sentiment around AI and technology spending.

Bond markets added another layer of volatility to the day’s trading activity. U.S. Treasury yields rose, with the 10-year yield hitting 4.33%, its highest level in months. A stronger dollar also accompanied this climb in yields, placing additional pressure on stocks, particularly in sectors sensitive to rate fluctuations. Meanwhile, across the Atlantic, the UK faced a bond market sell-off, fueled by inflation fears related to recent fiscal stimulus, adding further tension to global markets.

Compounding the market’s cautious mood was new economic data reflecting inflationary pressures and resilient employment. The Personal Consumption Expenditures (PCE) index, the Federal Reserve’s favored inflation gauge, showed core inflation rising 2.7% in September, maintaining August’s rate and slightly exceeding economists’ expectations. The data hints that inflationary forces might still be persistent, adding pressure on the Federal Reserve as it prepares for its next policy meeting. Investors are now left questioning whether the Fed might adjust its rate policy to control inflation, particularly as a series of rate cuts had been anticipated.

Additionally, weekly jobless claims fell to 216,000, a five-month low that was below market expectations of 230,000. This lower-than-expected figure further indicates a strong job market, a factor that could complicate the Fed’s decision on interest rates. Combined with last month’s spike in private payrolls, this data builds a case for economic resilience, though the Fed must balance this with inflation management. With the critical monthly jobs report due Friday, investors anticipate further insights into employment trends and inflation risks as they navigate these mixed signals.

This blend of rising bond yields, mixed tech earnings, and economic data reflecting both inflation and robust employment presents a complex landscape for investors. The challenges of AI’s impact on Big Tech’s financials, alongside uncertain Fed policy in the face of economic data, have amplified market volatility. The coming weeks, including additional earnings from major tech players, Middle Eastern tensions, the Nov. 5 U.S. election, and the Fed’s upcoming policy meeting, suggest that market fluctuations will likely continue.

Release – Harte Hanks to Report Third Quarter 2024 Financial Results on November 14, 2024

ACCESSWIRE | Article Logo

Thursday, 31 October 2024 08:00 AM

CHELMSFORD, MA / ACCESSWIRE / October 31, 2024 / Harte Hanks, Inc. (NASDAQ:HHS), a leading global customer experience company focused on bringing companies closer to customers for over 100 years, announced today that the company will release financial results for the third quarter of 2024, the period ended September 30, 2024, on Thursday, November 14, 2024, after the close of the market.

The Company will host a conference call and live webcast to discuss these results at 4:30 p.m. EDT on the same day. Interested parties may access the webcast at https://www.webcaster4.com/Webcast/Page/2810/51436 or access the conference call by dialing 888-506-0062 in the United States or 973-528-0011 from outside the U.S. and using access code 687861.

A replay of the call can also be accessed via phone through November 28, 2024 by dialing (877) 481-4010 from the U.S., or (919) 882-2331 from outside the U.S. The conference call replay passcode is 51436.

About Harte Hanks:

Harte Hanks (NASDAQ:HHS) is a leading global customer experience company whose mission is to partner with clients to provide them with CX strategy, data-driven analytics and actionable insights combined with seamless program execution to better understand, attract and engage their customers.

Using its unparalleled resources and award-winning talent in the areas of Customer Care, Fulfillment and Logistics, and Marketing Services, Harte Hanks has a proven track record of driving results for some of the world’s premier brands, including GlaxoSmithKline, Unilever, Pfizer, Warner Bros Discovery, Volvo, Ford, FedEx, Midea, and IBM among others. Headquartered in Chelmsford, Massachusetts, Harte Hanks has over 2,000 employees in offices across the Americas, Europe, and Asia Pacific.

For more information, visit hartehanks.com

As used herein, “Harte Hanks” or “the Company” refers to Harte Hanks, Inc. and/or its applicable operating subsidiaries, as the context may require. Harte Hanks’ logo and name are trademarks of Harte Hanks, Inc.

Investor Relations Contact:

Rob Fink or Tom Baumann
646.809.4048 / 646.349.6641
FNK IR
HHS@fnkir.com

SOURCE: Harte Hanks, Inc.

Release – Cocrystal Pharma’s Co-CEOs Highlight Pioneering Approach to Antiviral Drug Candidates Targeting Influenza and Coronaviruses as Fall Flu and COVID Season Begins

Research News and Market Data on COCP

October 31, 2024

 Download as PDF

The Company’s antiviral candidate for seasonal and pandemic influenza shows in vitro activity against the avian influenza A PB2 protein, whereas current influenza vaccines offer no protection against pandemic avian influenza

BOTHELL, Wash., Oct. 31, 2024 (GLOBE NEWSWIRE) — As the fall seasonal influenza and COVID season gets underway in the Northern Hemisphere, Cocrystal Pharma, Inc. (Nasdaq: COCP) (“Cocrystal” or the “Company”) highlights the ability of the Company’s innovative structure-based drug discovery platform technology to discover and develop novel broad-spectrum antivirals therapeutics to treat a wide range of viral diseases, including newly emerging pandemic strains such as recent H5N1 avian influenza identified in the US.

“As our nation enters the fall flu and COVID season and learns of the emerging highly pathogenic avian H5N1 influenza A strain in dairy cattle and humans, the need for more effective antivirals is clear. Current flu vaccines are developed for seasonal influenza strains, not for pandemic avian influenza strains. Also, treatment-emergent resistance to approved antivirals and transmission of resistant viruses has been a challenging issue,” said Sam Lee, PhD, President and co-CEO of Cocrystal. “For example, the widespread oseltamivir (Tamiflu®) resistance of the pandemic avian influenza strains could create a serous public health situation. Clearly, there continues to be an unmet need for therapeutics with a high barrier to resistance.

“We believe our approach makes it possible to develop highly effective therapeutics for noroviruses, coronaviruses and influenza A because we target the highly conserved, essential function of viral enzymes, regardless of whether the strain is seasonal or pandemic,” he added. “We recently revealed the high-resolution cocrystal structure of the avian influenza PB2 protein complexed with CC-42344, further confirming that our PB2 inhibitor CC-42344 binds to its highly conserved PB2 region, indicating activity against this strain.”

Cocrystal’s platform utilizes Nobel Prize-winning technology to develop a new class of direct-acting antivirals that work against enzymes that are essential for viral replication. The Company is evaluating its oral CC-42344 in a Phase 2a study in healthy subjects infected with a seasonal influenza A strain. Topline safety and tolerability results from this trial are expected by the end of 2024, and preparations are underway for an Investigational New Drug (IND) application to conduct a late-stage clinical study with CC-42344 in the U.S.

The Company is also conducting a Phase 1 study with its oral protease inhibitor CDI-988, the first pan-viral drug candidate in clinical evaluation for both noroviruses and coronaviruses. Topline safety and tolerability results of the multiple-ascending cohorts are expected late this year or early next year. There is no approved vaccine or antiviral for norovirus. Norovirus is highly contagious and is the most common cause of acute gastroenteritis, which has gained notoriety for outbreaks in closed quarters such as on cruise ships and in nursing homes. According to the Centers for Disease Control and Prevention (CDC), an estimated 685 million cases and an estimated 200,000 deaths are attributed to norovirus each year worldwide, with an estimated societal cost of approximately $60 billion.

“We view the next viral pandemic as a question of timing as seasonal viruses like flu and COVID continue to evolve,” said James Martin, CFO and co-CEO of Cocrystal. “Our proprietary technology platform allows us to efficiently discover and develop potent, broad-spectrum, effective antiviral drug candidates for pandemic and seasonal outbreaks relatively quickly and far less costly than traditional approaches to drug development. As a small company, Cocrystal is highly efficient in utilizing our groundbreaking technology to develop differentiated antivirals for high-value indications with the goal of improving people’s lives.”

Avian Influenza
A multistate outbreak of highly pathogenic avian influenza in dairy cows was initially reported in March 2024. This is the first time that avian flu viruses were found in cows, with outbreaks now confirmed in herds in 14 states. In April 2024 the CDC confirmed an avian flu infection in a person exposed to dairy cows that were presumed to be infected with the virus. This is believed to be the first instance of likely mammal to human spread of this virus. In September 2024 the CDC reported the first human case of avian influenza without a known occupational exposure to sick or infected animals. As of October 30, 2024, the CDC has reported 36 human cases of this highly pathogenic avian influenza A in the U.S. during 2024.

The CDC analyzed blood collected from people of all ages in all 10 Health & Human Services regions during the 2022-2023 and 2021-2022 flu seasons. These samples were challenged with the avian flu subtype H5N1 virus to determine whether there was an antibody reaction. Data from this study suggest that there is extremely low to no population immunity to clade 2.3.4.4b A (H5N1) viruses in the U.S. Antibody levels remained low regardless of whether or not participants received a seasonal flu vaccination, meaning that seasonal flu vaccination did not produce antibodies to avian flu H5N1 viruses. 

Antiviral Influenza Candidate CC-42344
CC-42344 is Cocrystal’s novel, broad-spectrum investigational antiviral candidate for the treatment of pandemic and seasonal influenza A. CC-42344 inhibits the first step in influenza A’s viral replication by binding to a highly conserved PB2 site of the influenza polymerase complex that is essential to replication and was discovered using Cocrystal’s proprietary structure-based drug discovery platform technology.

Cocrystal is evaluating safety, viral and clinical measures of oral CC-42344 in healthy volunteers who are challenged with influenza A in a Phase 2a human challenge study underway in the United Kingdom. CC-42344 was advanced into this study following favorable safety and tolerability results reported in a Phase 1 study in healthy volunteers conducted in Australia. In vitro testing showed CC-42344’s excellent antiviral activity against influenza A strains, including pandemic and seasonal strains, as well as against strains resistant to Tamiflu® and Xofluza®, while also demonstrating favorable pharmacokinetic and safety profiles.

Cocrystal used its structure-based platform to determine the high resolution X-ray crystal structure of the recent avian influenza A (H5N1) PB2 protein, and confirmed activity of CC-42344 in vitro (NIH GeneBank ID:influenza A/Texas/37/2024(H5N1). The crystal structure of the avian influenza A (H5N1) PB2 protein showed new mutations located outside the PB2 active site. Subsequent studies showed that CC-42344 binds to the active site of the avian influenza A (H5N1) PB2 protein as previously demonstrated with the pandemic and seasonal influenza A PB2.

Structure-Based Platform Technology
Cocrystal’s proprietary structural biology, along with its expertise in enzymology and medicinal chemistry, enable its development of novel antiviral agents. The Company’s platform provides a three-dimensional structure of inhibitor complexes at near-atomic resolution, providing immediate insight to guide Structure Activity Relationships. This helps to identify novel binding sites and allows for a rapid turnaround of structural information through highly automated X-ray data processing and refinement. The goal of this technology is to facilitate the development of best-in-class antiviral therapies that have fast onset of action and/or shortened treatment time, are safe, well tolerated and easy to administer, are effective against all viral subtypes that cause disease and have a high barrier to viral resistance.

About Cocrystal Pharma, Inc.
Cocrystal Pharma, Inc. is a clinical-stage biotechnology company discovering and developing novel antiviral therapeutics that target the replication process of influenza viruses, coronaviruses (including SARS-CoV-2), noroviruses, and hepatitis C viruses. Cocrystal employs unique structure-based technologies and Nobel Prize-winning expertise to create first- and best-in-class antiviral drugs. For further information about Cocrystal, please visit www.cocrystalpharma.com.

Cautionary Note Regarding Forward-Looking Statements
This press release contains forward-looking statements within the meaning of the Private Securities Litigation Reform Act of 1995, including statements regarding the potential efficacy of Cocrystal’s product candidates against certain viruses, ongoing research and development efforts including the expected timing of clinical studies and topline results for such product candidates, and the potential market for such product candidates. The words “believe,” “may,” “estimate,” “continue,” “anticipate,” “intend,” “should,” “plan,” “could,” “target,” “potential,” “is likely,” “will,” “expect” and similar expressions, as they relate to us, are intended to identify forward-looking statements. We have based these forward-looking statements largely on our current expectations and projections about future events. Some or all of the events anticipated by these forward-looking statements may not occur. Important factors that could cause actual results to differ from those in the forward-looking statements include, but are not limited to, risks relating to our ability to obtain regulatory authority for and proceed with clinical trials including the recruiting of volunteers for such studies by our clinical research organizations and vendors, the results of such studies, our collaboration partners’ technology and software performing as expected, general risks arising from clinical studies, receipt of regulatory approvals, regulatory changes, and potential development of effective treatments and/or vaccines by competitors, including as part of the programs financed by the U.S. government, and potential mutations in a virus we are targeting that may result in variants that are resistant to a product candidate we develop. Further information on our risk factors is contained in our filings with the SEC, including our Annual Report on Form 10-K for the year ended December 31, 2023. Any forward-looking statement made by us herein speaks only as of the date on which it is made. Factors or events that could cause our actual results to differ may emerge from time to time, and it is not possible for us to predict all of them. We undertake no obligation to publicly update any forward-looking statement, whether as a result of new information, future developments or otherwise, except as may be required by law.

Investor Contact:
Alliance Advisors IR
Jody Cain
310-691-7100
jcain@allianceadvisors.com

Media Contact:
JQA Partners
Jules Abraham
917-885-7378
Jabraham@jqapartners.com

# # #

Primary Logo

Source: Cocrystal Pharma, Inc.

Released October 31, 2024

Release – 1-800-FLOWERS.COM, Inc. Reports Fiscal 2025 First Quarter Results

Research News and Market Data on FLWS

Oct 31, 2024

Generates Revenues of $242.1 million and a Net Loss of $34.2 million

Gross Profit Margin Increases 20 basis points to 38.1%

Reports Adjusted EBITDA(1) Loss of $27.9 million  

(1) Refer to “Definitions of Non-GAAP Financial Measures” and the tables attached at the end of this press release for reconciliation of non-GAAP results to applicable GAAP results.)

JERICHO, N.Y.–(BUSINESS WIRE)– 1-800-FLOWERS.COM, Inc. (NASDAQ: FLWS), a leading provider of gifts designed to help inspire customers to give more, connect more, and build more and better relationships, today reported results for its Fiscal 2025 first quarter ended September 29, 2024.

“Our first quarter performance generally came in-line with our expectations, as we began to see a slight improvement in our e-commerce revenue trends during the quarter, our gross profit margin continued to grow, and we reduced expenses as a result of our Work Smarter initiatives to operate more efficiently,” said Jim McCann, Chairman and Chief Executive Officer of 1-800-FLOWERS.COM, Inc. “We expect the improvement in our e-commerce revenue trends to accelerate as we move closer to the holiday selling season, and our revenues will further benefit from the growth of wholesale orders this year. Through the Relationship Innovation initiatives that we implemented over the last two years, we have expanded our offerings and broadened our price points, providing gift givers with more choices at prices that span from budget-friendly to premium. We look forward to helping our customers connect and express their sentiments with the important people in their lives.”

Fiscal 2025 First Quarter Highlights

  • Total consolidated revenues decreased 10.0% to $242.1 million, as compared with the prior year period.
  • E-commerce revenues decreased 8.0% over the prior year period, comprised of a 6.5% decline in orders and a 1.5% decline in Average Order Value (AOV).
  • Gross profit margin increased 20 basis points to 38.1%, as compared with the prior year period.
  • Operating expenses declined $0.2 million to $139.3 million, as compared with the prior year period. Excluding the impact of non-recurring charges in the current period associated with new systems implementation costs, as well as the impact of the Company’s non-qualified deferred compensation plan in both periods, operating expenses declined by $4.2 million to $135.8 million, as compared with the prior year period.
  • Net loss for the quarter was $34.2 million, or ($0.53) per share, as compared to a net loss of $31.2 million, or ($0.48) per share in the prior year period.
  • Adjusted Net Loss1 was $32.9 million, or ($0.51) per share, compared with an Adjusted Net Loss1 of $31.2 million, or ($0.48) per share, in the prior year period.
  • Adjusted EBITDA1 loss for the quarter was $27.9 million, as compared with an Adjusted EBITDA1 loss of $22.5 million in the prior year period.
  • 1-800-FLOWERS.COM, Inc. was named one of Newsweek’s Most Admired Workplaces for 2025.

Segment Results

The Company provides Fiscal 2025 first quarter financial results for its Gourmet Foods and Gift Baskets, Consumer Floral and Gifts, and BloomNet® segments in the tables attached to this release and as follows:

  • Gourmet Foods and Gift Baskets: Revenues for the quarter declined 14.4% to $84.0 million as compared with the prior year period. This decline reflects the timing of approximately $3.0 million of wholesale orders that shifted from the first quarter into the second quarter. Gross profit margin increased 50 basis points to 32.0%, benefiting from the Company’s inventory optimization efforts and a decline in certain commodity costs. Excluding the impact of the systems implementation costs, adjusted segment contribution margin1 loss was $11.3 million, compared with a loss of $11.0 million in the prior year period.
  • Consumer Floral & Gifts: Revenues for the quarter declined 4.9% to $135.2 million as compared with the prior year period. Gross profit margin increased 30 basis points to 39.9%. Segment contribution margin1 was $4.9 million, compared with $8.8 million in the prior year period.
  • BloomNet: Revenues for the quarter declined 20.1% to $23.1 million as compared with the prior year period. Revenue and gross margin were impacted by the lower volume of lower margin orders processed by BloomNet. Gross profit margin decreased 20 basis points to 50.0% due to deleveraging on the lower sales volume. Segment contribution margin1 was $6.8 million, compared with $9.4 million in the prior year period.

Company Guidance

For Fiscal 2025, the Company continues to expect its revenue trend to improve as the fiscal year progresses benefiting from the Company’s Relationship Innovation initiatives that have expanded the Company’s product offerings, broadened price points, and enhanced the user experience, combined with increased marketing spend. The Adjusted EBITDA range reflects the acknowledgement that the consumer environment remains uncertain.

As a result, for Fiscal 2025 the Company continues to expect:

  • total revenues on a percentage basis to be in a range of flat to a decrease in the low-single digits, as compared with the prior year;
  • Adjusted EBITDA1 to be in a range of $85 million to $95 million; and
  • Free Cash Flow1 to be in a range of $45 million to $55 million.

Conference Call

The Company will conduct a conference call to discuss the above details and attached financial results today, October 31, 2024, at 8:00 a.m. (ET). The conference call will be webcast from the Investors section of the Company’s website at www.1800flowersinc.com. A recording of the call will be posted on the Investors section of the Company’s website within two hours of the call’s completion. A telephonic replay of the call can be accessed beginning at 2:00 p.m. (ET) today through November 7, 2024, at: (US) 1-877-344-7529; (Canada) 855-669-9658; (International) 1-412-317-0088; enter conference ID #: 1727189.

Definitions of non-GAAP Financial Measures:

We sometimes use financial measures derived from consolidated financial information, but not presented in our financial statements prepared in accordance with U.S. generally accepted accounting principles (“GAAP”). Certain of these are considered “non-GAAP financial measures” under the U.S. Securities and Exchange Commission rules. Non-GAAP financial measures referred to in this document are either labeled as “non-GAAP” or designated as such with a “1”. See below for definitions and the reasons why we use these non-GAAP financial measures. Where applicable, see the Selected Financial Information below for reconciliations of these non-GAAP measures to their most directly comparable GAAP financial measures. Reconciliations for forward-looking figures would require unreasonable efforts at this time because of the uncertainty and variability of the nature and amount of certain components of various necessary GAAP components, including, for example, those related to compensation, tax items, amortization or others that may arise during the year, and the Company’s management believes such reconciliations would imply a degree of precision that would be confusing or misleading to investors. For the same reasons, the Company is unable to address the probable significance of the unavailable information. The lack of such reconciling information should be considered when assessing the impact of such disclosures.

EBITDA and Adjusted EBITDA:

We define EBITDA as net income (loss) before interest, taxes, depreciation, and amortization. Adjusted EBITDA is defined as EBITDA adjusted for the impact of stock-based compensation, Non-Qualified Plan Investment appreciation/depreciation, and for certain items affecting period-to-period comparability. See Selected Financial Information for details on how EBITDA and Adjusted EBITDA were calculated for each period presented. The Company presents EBITDA and Adjusted EBITDA because it considers such information meaningful supplemental measures of its performance and believes such information is frequently used by the investment community in the evaluation of similarly situated companies. The Company uses EBITDA and Adjusted EBITDA as factors to determine the total amount of incentive compensation available to be awarded to executive officers and other employees. The Company’s credit agreement uses EBITDA and Adjusted EBITDA to determine its interest rate and to measure compliance with certain covenants. EBITDA and Adjusted EBITDA are also used by the Company to evaluate and price potential acquisition candidates. EBITDA and Adjusted EBITDA have limitations as analytical tools and should not be considered in isolation or as a substitute for analysis of the Company’s results as reported under GAAP. Some of the limitations are: (a) EBITDA and Adjusted EBITDA do not reflect changes in, or cash requirements for, the Company’s working capital needs; (b) EBITDA and Adjusted EBITDA do not reflect the significant interest expense, or the cash requirements necessary to service interest or principal payments, on the Company’s debts; and (c) although depreciation and amortization are non-cash charges, the assets being depreciated and amortized may have to be replaced in the future and EBITDA does not reflect any cash requirements for such capital expenditures. EBITDA and Adjusted EBITDA should only be used on a supplemental basis combined with GAAP results when evaluating the Company’s performance.

Segment Contribution Margin and Adjusted Segment Contribution Margin

We define Segment Contribution Margin as earnings before interest, taxes, depreciation, and amortization, before the allocation of corporate overhead expenses. Adjusted Segment Contribution Margin is defined as Segment Contribution Margin adjusted for certain items affecting period-to-period comparability. See Selected Financial Information for details on how Segment Contribution Margin and Adjusted Segment Contribution Margin were calculated for each period presented. When viewed together with our GAAP results, we believe Segment Contribution Margin and Adjusted Segment Contribution Margin provide management and users of the financial statements meaningful information about the performance of our business segments. Segment Contribution Margin and Adjusted Segment Contribution Margin are used in addition to and in conjunction with results presented in accordance with GAAP and should not be relied upon to the exclusion of GAAP financial measures. The material limitation associated with the use of Segment Contribution Margin and Adjusted Segment Contribution Margin is that they are an incomplete measure of profitability as they do not include all operating expenses or non-operating income and expenses. Management compensates for this limitation when using these measures by looking at other GAAP measures, such as Operating Income and Net Income.

Adjusted Net Income (Loss) and Adjusted or Comparable Net Income (Loss) Per Common Share:

We define Adjusted Net Income (Loss) and Adjusted or Comparable Net Income (Loss) Per Common Share as Net Income (Loss) and Net Income (Loss) Per Common Share adjusted for certain items affecting period-to-period comparability. See Selected Financial Information below for details on how Adjusted Net Income (Loss) Per Common Share and Adjusted or Comparable Net Income (Loss) Per Common Share were calculated for each period presented. We believe that Adjusted Net Income (Loss) and Adjusted or Comparable Net Income (Loss) Per Common Share are meaningful measures because they increase the comparability of period-to-period results. Since these are not measures of performance calculated in accordance with GAAP, they should not be considered in isolation of, or as a substitute for, GAAP Net Income (Loss) and Net Income (Loss) Per Common Share, as indicators of operating performance and they may not be comparable to similarly titled measures employed by other companies.

Free Cash Flow:

We define Free Cash Flow as net cash provided by operating activities less capital expenditures. The Company considers Free Cash Flow to be a liquidity measure that provides useful information to management and investors about the amount of cash generated by the business after the purchases of fixed assets, which can then be used to, among other things, invest in the Company’s business, make strategic acquisitions, strengthen the balance sheet, and repurchase stock or retire debt. Free Cash Flow is a liquidity measure that is frequently used by the investment community in the evaluation of similarly situated companies. Since Free Cash Flow is not a measure of performance calculated in accordance with GAAP, it should not be considered in isolation or as a substitute for analysis of the Company’s results as reported under GAAP. A limitation of the utility of Free Cash Flow as a measure of financial performance is that it does not represent the total increase or decrease in the Company’s cash balance for the period.

About 1-800-FLOWERS.COM, Inc.

1-800-FLOWERS.COM, Inc. is a leading provider of gifts designed to help inspire customers to give more, connect more, and build more and better relationships. The Company’s e-commerce business platform features an all-star family of brands, including: 1-800-Flowers.com®, 1-800-Baskets.com®, Cheryl’s Cookies®, Harry & David®, PersonalizationMall.com®, Shari’s Berries®, FruitBouquets.com®, Things Remembered®Moose Munch®, The Popcorn Factory®, Wolferman’s Bakery®, Vital Choice®, Simply Chocolate® and Scharffen Berger®. Through the Celebrations Passport® loyalty program, which provides members with free standard shipping and no service charge on eligible products across our portfolio of brands, 1-800-FLOWERS.COM, Inc. strives to deepen relationships with customers. The Company also operates BloomNet®, an international floral and gift industry service provider offering a broad-range of products and services designed to help members grow their businesses profitably; Napco℠, a resource for floral gifts and seasonal décor; DesignPac Gifts, LLC, a manufacturer of gift baskets and towers; Alice’s Table®, a lifestyle business offering fully digital livestreaming and on demand floral, culinary and other experiences to guests across the country; and Card Isle®, an e-commerce greeting card service. 1-800-FLOWERS.COM, Inc. was recognized among America’s Most Trustworthy Companies by Newsweek. 1-800-FLOWERS.COM, Inc. was also recognized as one of America’s Most Admired Workplaces for 2025 by Newsweek and was named to the Fortune 1000 list in 2022. Shares in 1-800-FLOWERS.COM, Inc. are traded on the NASDAQ Global Select Market, ticker symbol: FLWS. For more information, visit 1800flowersinc.com.

FLWS–COMP
FLWS-FN

Special Note Regarding Forward Looking Statements:

This press release contains forward-looking statements within the meaning of the Private Securities Litigation Reform Act of 1995. These forward-looking statements represent the Company’s current expectations or beliefs concerning future events and can generally be identified using statements that include words such as “estimate,” “expects,” “project,” “believe,” “anticipate,” “intend,” “plan,” “foresee,” “forecast,” “likely,” “should,” “will,” “target” or similar words or phrases. These forward-looking statements are subject to risks, uncertainties, and other factors, many of which are outside of the Company’s control, which could cause actual results to differ materially from the results expressed or implied in the forward-looking statements, including, but not limited to, statements regarding the Company’s ability to achieve its guidance for the full Fiscal year; the Company’s ability to leverage its operating platform and reduce its operating expense ratio; its ability to successfully integrate acquired businesses and assets; its ability to successfully execute its strategic initiatives; its ability to cost effectively acquire and retain customers; the outcome of contingencies, including legal proceedings in the normal course of business; its ability to compete against existing and new competitors; its ability to manage expenses associated with sales and marketing and necessary general and administrative and technology investments; its ability to reduce promotional activities and achieve more efficient marketing programs; and general consumer sentiment and industry and economic conditions that may affect levels of discretionary customer purchases of the Company’s products. The Company undertakes no obligation to publicly update any of the forward-looking statements, whether because of new information, future events or otherwise, made in this release or in any of its SEC filings. Consequently, you should not consider any such list to be a complete set of all potential risks and uncertainties. For a more detailed description of these and other risk factors, refer to the Company’s SEC filings, including the Company’s Annual Reports on Form 10-K and its Quarterly Reports on Form 10-Q.

Note: The following tables are an integral part of this press release without which the information presented in this press release should be considered incomplete.

Investor Contact:

Andy Milevoj

amilevoj@1800flowers.com


Media Contact:

Cherie Gallarello

cgallarello@1800flowers.com

Source: 1-800-FLOWERS.COM, Inc.

Perfect Corp. (PERF) – Developing Additional Revenue Growth Catalysts


Thursday, October 31, 2024

Patrick McCann, CFA, Research Analyst, Noble Capital Markets, Inc.

Michael Kupinski, Director of Research, Equity Research Analyst, Digital, Media & Technology , Noble Capital Markets, Inc.

Refer to the full report for the price target, fundamental analysis, and rating.

Strong Q3 results. The company demonstrated attractive 11% revenue growth in Q3 with revenue of $16.1 million, slightly better than our estimate of $15.7 million. Adj. EBITDA and adj. net income for the quarter were both better than our expectations, due to lower-than-expected marketing, G&A, and R&D expenses.

Revenue drivers. The company’s B2C segment drove Q3 revenue growth, while the B2B segment revenue was more flat, as some of the company’s enterprise clients have faced economic challenges. Importantly, the company’s B2C web-based offering should bolster B2C revenue growth. As for B2B, interest rate cuts should have a positive impact on clients’ enterprise software budgets. Moreover, the company could increase contract values through new services, such as Perfect GPT.  


Get the Full Report

Equity Research is available at no cost to Registered users of Channelchek. Not a Member? Click ‘Join’ to join the Channelchek Community. There is no cost to register, and we never collect credit card information.

This Company Sponsored Research is provided by Noble Capital Markets, Inc., a FINRA and S.E.C. registered broker-dealer (B/D).

*Analyst certification and important disclosures included in the full report. NOTE: investment decisions should not be based upon the content of this research summary. Proper due diligence is required before making any investment decision. 

NN, Inc. (NNBR) – A First Look at the Third Quarter


Thursday, October 31, 2024

Joe Gomes, CFA, Managing Director, Equity Research Analyst, Generalist , Noble Capital Markets, Inc.

Joshua Zoepfel, Research Associate, Noble Capital Markets, Inc.

Refer to the full report for the price target, fundamental analysis, and rating.

Focused on Business Wins and Costs. NN is continuing to achieve business wins with $15 million in new business wins in the quarter, totaling $49 million year-to-date, near the bottom of its $55-70 million range for the year. The Company’s transformation program is moving faster than anticipated, as evidenced by the new business growth, along with operational efficiency and structural cost reductions. An example of the latter being the previous sale of the plastics plant in July and closure of the Dowagiac plant to move operations to China, further lowering costs.

3Q Results. Third quarter results were slightly below expectations with net sales of $113.6 million, below last year’s $124.4 million and our estimate of $125 million, due to the sale of the Lubbock operations. Excluding the sale, rationalized volume at plants undergoing turnarounds, and a customer settlement, sales were down 0.5%. Adjusted EBITDA was $11.6 million, down from $14.5 million last year and our $13.9 million estimate. With decisions such as the plant closure and higher margins of new business, we expect improved performance in the short term.


Get the Full Report

Equity Research is available at no cost to Registered users of Channelchek. Not a Member? Click ‘Join’ to join the Channelchek Community. There is no cost to register, and we never collect credit card information.

This Company Sponsored Research is provided by Noble Capital Markets, Inc., a FINRA and S.E.C. registered broker-dealer (B/D).

*Analyst certification and important disclosures included in the full report. NOTE: investment decisions should not be based upon the content of this research summary. Proper due diligence is required before making any investment decision. 

FAT Brands (FAT) – Challenged Operational Results; But Moving Forward With Value Creation


Thursday, October 31, 2024

FAT Brands (NASDAQ: FAT) is a leading global franchising company that strategically acquires, markets, and develops fast casual, quick-service, casual dining, and polished casual dining concepts around the world. The Company currently owns 17 restaurant brands: Round Table Pizza, Fatburger, Marble Slab Creamery, Johnny Rockets, Fazoli’s, Twin Peaks, Great American Cookies, Hot Dog on a Stick, Buffalo’s Cafe & Express, Hurricane Grill & Wings, Pretzelmaker, Elevation Burger, Native Grill & Wings, Yalla Mediterranean and Ponderosa and Bonanza Steakhouses, and franchises and owns over 2,300 units worldwide. For more information on FAT Brands, please visit www.fatbrands.com.

Joe Gomes, CFA, Managing Director, Equity Research Analyst, Generalist , Noble Capital Markets, Inc.

Joshua Zoepfel, Research Associate, Noble Capital Markets, Inc.

Refer to the full report for the price target, fundamental analysis, and rating.

Overview. FAT Brands 3Q24 results were below our expectations, mostly due to underperformance at the Smokey Bones brand. Development deals continued strongly, although new store openings are below plan as franchisees have taken a more conservative stance on new openings. Management continues to move forward with value creation efforts, specifically with Twin Peaks, and is hopeful of announcing additional developments in the coming weeks.

3Q24 Results. Revenue of $143.3 million was up 31.1% y-o-y but was down from $152 million reported in 2Q24. We had estimated $159.9 million. Adjusted EBITDA totaled $14.1 million, down from $21.9 million in 3Q23 and $15.7 million in 2Q24. FAT Brands reported a net loss of $44.8 million, or $2.74/sh, compared to a net loss of $24.7 million, or $1.59/sh, last year. We had forecasted a net loss of $32 million, or $1.88/sh.


Get the Full Report

Equity Research is available at no cost to Registered users of Channelchek. Not a Member? Click ‘Join’ to join the Channelchek Community. There is no cost to register, and we never collect credit card information.

This Company Sponsored Research is provided by Noble Capital Markets, Inc., a FINRA and S.E.C. registered broker-dealer (B/D).

*Analyst certification and important disclosures included in the full report. NOTE: investment decisions should not be based upon the content of this research summary. Proper due diligence is required before making any investment decision. 

Super Micro Computer Stock Plummets After Ernst & Young Resignation

Key Points:
– Super Micro Computer’s stock plummeted over 30% after EY resigned, citing a lack of trust in management’s financial representations.
– The resignation follows allegations from Hindenburg Research of accounting manipulation and an investigation by the U.S. Department of Justice.
– The company’s future remains uncertain as it navigates significant financial and regulatory challenges.

Super Micro Computer, Inc. (SMCI) faced a dramatic setback today, with shares plunging over 30% following the resignation of its accounting firm, Ernst & Young (EY). This sudden market reaction has raised alarms among investors, spotlighting significant concerns about the company’s financial integrity and future prospects.

In a filing with the SEC, EY disclosed that it could no longer rely on management’s representations or the Audit Committee’s assurances, leading to its resignation while conducting an audit for the fiscal year ending June 30, 2024. This lack of confidence from a major accounting firm is particularly troubling, considering the scrutiny surrounding Super Micro’s financial practices. In its response, Super Micro expressed disagreement with EY’s decision, emphasizing that its Special Committee has yet to finalize its review. Nonetheless, the company stated it takes EY’s concerns seriously and will carefully consider the findings and any recommended actions.

EY’s resignation comes on the heels of a scathing report from Hindenburg Research, which accused Super Micro of accounting manipulation and highlighted several red flags, including undisclosed related party transactions and potential sanctions violations. Following this report, Super Micro’s stock took a nosedive, dropping nearly 20% after the company delayed its annual report filing on August 28, 2024. To date, Super Micro has not filed its annual report for the 2024 fiscal year, which has further exacerbated investor anxiety.

Adding to the turbulence, the U.S. Department of Justice has reportedly launched an investigation into Super Micro Computer. While this inquiry is still in its early stages, it underscores the serious nature of the allegations and the potential legal repercussions for the company. The combination of regulatory scrutiny and damaging reports has created a challenging landscape for Super Micro, making it increasingly difficult to regain investor confidence.

Once a darling in the AI data center space, Super Micro’s stock had been buoyed by strong investor interest earlier this year. However, today’s sharp decline reflects a stark shift in sentiment. The outcomes of the Special Committee’s review and the DOJ investigation will be crucial in shaping the company’s path forward.

Super Micro Computer is at a critical juncture following EY’s resignation and mounting regulatory pressures. The company’s ability to navigate these challenges will determine its future trajectory. As always, thorough research and a clear understanding of the associated risks are essential for anyone observing this tumultuous environment.

Release – FAT Brands Inc. Announces Fourth Quarter Cash Dividend on Class A Common Stock and Class B Common Stock

Research News and Market Data on FAT

LOS ANGELES, Oct. 30, 2024 (GLOBE NEWSWIRE) — FAT (Fresh. Authentic. Tasty.) Brands Inc. (NASDAQ: FAT), a leading global franchising company and parent company of iconic brands including Round Table Pizza, Fatburger, Marble Slab Creamery, Johnny Rockets, Twin Peaks, Fazoli’s, Smokey Bones and 11 other restaurant concepts, announced today that its Board of Directors has declared the Company’s fiscal 2024 fourth quarter cash dividend of $0.14 per share on each outstanding share of Class A common stock and Class B common stock. The dividend is payable on November 29, 2024 to holders of record of Class A common stock and Class B common stock as of the close of business on November 15, 2024.

The declaration and payment of future dividends, as well as the amounts thereof, are subject to the discretion of the Company’s Board of Directors. The amount and size of any future dividends will depend upon the Company’s future results of operations, financial condition, capital levels, cash requirements and other factors. There can be no assurance that the Company will declare and pay dividends in future periods.

About FAT (Fresh. Authentic. Tasty.) Brands

FAT Brands Inc. (NASDAQ: FAT) (the Company) is a leading global franchising company that strategically acquires, markets and develops quick service, fast casual and casual dining restaurant concepts around the world. The Company currently owns eighteen restaurant brands: Round Table Pizza, Fatburger, Marble Slab Creamery, Johnny Rockets, Fazoli’s, Twin Peaks, Smokey Bones, Great American Cookies, Hot Dog on a Stick, Buffalo’s Cafe & Express, Hurricane Grill & Wings, Pretzelmaker, Elevation Burger, Native Grill & Wings, Yalla Mediterranean, Ponderosa and Bonanza Steakhouses and franchises and owns over 2,300 units worldwide. For more information, please visit www.fatbrands.com.

Forward Looking Statements

This press release contains forward-looking statements within the meaning of the Private Securities Litigation Reform Act of 1995. Forward-looking statements are subject to significant business, economic and competitive risks, uncertainties and contingencies, many of which are difficult to predict and beyond our control, which could cause our actual results to differ materially from the results expressed or implied in such forward-looking statements. We refer you to the documents we file from time to time with the Securities and Exchange Commission, such as our reports on Form 10-K, Form 10-Q and Form 8-K, for a discussion of these risks, uncertainties and contingencies. We undertake no obligation to update any forward-looking statement to reflect events or circumstances occurring after the date of this press release.

Investor Relations:
ICR
Michelle Michalski
IR-FATBrands@icrinc.com
646-277-1224

Media Relations:
FAT Brands Inc.
Erin Mandzik
emandzik@fatbrands.com
860-212-6509

Release – Great Lakes Dredge and Dock Corporation Schedules Announcement of 2024 Third Quarter Results

Research News and Market Data on GLDD

HOUSTON, Oct. 29, 2024 (GLOBE NEWSWIRE) — Great Lakes Dredge & Dock Corporation (NASDAQ: GLDD) today announced that it will release the financial results for its three and nine months ended September 30, 2024 on Tuesday, November 5, 2024 at 7:00 a.m. C.S.T. A conference call with the Company will be held the same day at 9:00 a.m. C.S.T.

Investors and analysts are encouraged to pre-register for the conference call by using the link below. Participants who pre-register will be given a unique PIN to gain immediate access to the call. Pre-registration may be completed at any time up to the call start time.

To pre-register, go to https://register.vevent.com/register/BI597f0aa2b02d4d84a95557b710d6eec6

The live call and replay can also be heard at https://edge.media-server.com/mmc/p/ykthkeg2 or on the Company’s website, www.gldd.com, under Events on the Investor Relations page. A copy of the press release will be available on the Company’s website.

The Company
Great Lakes Dredge & Dock Corporation (“Great Lakes” or the “Company”) is the largest provider of dredging services in the United States. In addition, Great Lakes is fully engaged in expanding its core business into the rapidly developing offshore wind energy industry. The Company has a long history of performing significant international projects. The Company employs experienced civil, ocean and mechanical engineering staff in its estimating, production and project management functions. In its over 134-year history, the Company has never failed to complete a marine project. Great Lakes owns and operates the largest and most diverse fleet in the U.S. dredging industry, comprised of approximately 200 specialized vessels. Great Lakes has a disciplined training program for engineers that ensures experienced-based performance as they advance through Company operations. The Company’s Incident-and Injury-Free® (IIF®) safety management program is integrated into all aspects of the Company’s culture. The Company’s commitment to the IIF® culture promotes a work environment where employee safety is paramount.

For further information contact:
Tina Baginskis
Director, Investor Relations
630-574-3024

This press release was published by a CLEAR® Verified individual.

Release – GDEV Announces Leadership Transition

Research News and Market Data on GDEV

October 30, 2024 – Limassol, Cyprus

October 30, 2024 – Limassol, Cyprus – GDEV Inc. (NASDAQ: GDEV), an international gaming and entertainment company (“GDEV” or the “Company”), announces changes to its Board of Directors and executive leadership team as part of its ongoing strategy to enhance operational efficiency and support its global growth ambitions. 

Olga Loskutova, who has served as an Independent Director on GDEV’s Board since 2022, will be stepping down from her position on the Board of Directors to assume the role of Chief Operating Officer (COO) of GDEV. Olga brings with her a wealth of experience in global business and general management, positioning her to provide management, leadership, and vision to guide GDEV Inc. towards meeting both its short-term and long-term strategic goals.

Following Olga’s transition, GDEV’s Board will consist of six members, with four remaining independent directors. In addition, Olga’s seat on the Nomination and Compensation Committee, on which she previously served, has been assumed by current independent director Tal Shoham.

Anton Reinhold, the former COO of GDEV, will now fully focus on his current role as CEO of Nexters Global Ltd., GDEV’s flagship game studio. This decision will enable him to dedicate his efforts to further expanding the Hero Wars franchise and driving the development of new products within the studio.

“During 2 years as an independent board member, I’ve had the opportunity to gain invaluable insight into the company and the gaming industry as a whole,” said Olga Loskutova. “In my time on the board, I’ve come to admire what makes GDEV truly special – its values, exceptional people, and bold ambitions. I am excited to step into this role and partner with the CEO and the team to help GDEV achieve its strategic goals.”

ABOUT GDEV

GDEV is a gaming and entertainment holding company, focused on development and growth of its franchise portfolio across various genres and platforms. With a diverse range of subsidiaries including Nexters and Cubic Games, among others, GDEV strives to create games that will inspire and engage millions of players for years to come. Its franchises, such as Hero Wars, Island Hoppers, Pixel Gun 3D and others have accumulated over 550 million installs and $2.5 bln of bookings worldwide. For more information, please visit www.gdev.inc

CONTACTS:

Investor Relations

Roman Safiyulin | Chief Corporate Development Officer

investor@gdev.inc

CAUTIONARY STATEMENT REGARDING FORWARD-LOOKING STATEMENTS

Certain statements in this press release may constitute “forward-looking statements” for purposes of the federal securities laws. Such statements are based on current expectations that are subject to risks and uncertainties. In addition, any statements that refer to projections, forecasts or other characterizations of future events or circumstances, including any underlying assumptions, are forward-looking statements.

The forward-looking statements contained in this press release are based on the Company’s current expectations and beliefs concerning future developments and their potential effects on the Company. There can be no assurance that future developments affecting the Company will be those that the Company has anticipated. Forward-looking statements involve a number of risks, uncertainties (some of which are beyond the Company’s control) or other assumptions. You should carefully consider the risks and uncertainties described in the “Risk Factors” section of the Company’s 2023 Annual Report on Form 20-F, filed by the Company on April 29, 2024, and other documents filed by the Company from time to time with the Securities and Exchange Commission. Should one or more of these risks or uncertainties materialize, or should any of the Company’s assumptions prove incorrect, actual results may vary in material respects from those projected in these forward-looking statements. Forward-looking statements speak only as of the date they are made. Readers are cautioned not to put undue reliance on forward-looking statements, and the Company undertakes no obligation to update or revise any forward-looking statements, whether as a result of new information, future events or otherwise, except as may be required under applicable securities laws. 

Perfect Corp. (PERF) – B2C Drives Q3 Beat


Wednesday, October 30, 2024

Patrick McCann, CFA, Research Analyst, Noble Capital Markets, Inc.

Michael Kupinski, Director of Research, Equity Research Analyst, Digital, Media & Technology , Noble Capital Markets, Inc.

Refer to the full report for the price target, fundamental analysis, and rating.

Q3 beat. Perfect Corp. reported better-than-expected Q3 results. The company reported Q3 revenue of $16.1 million, slightly better than our estimate of $15.7 million. Adj. EBITDA of $1.2 million and adj. net income of $3.2 million were also better than our estimates of a loss of $0.3 million and a gain of $1.6 million, respectively. Figure #1 Q3 Results highlights how the performance compared with our forecast.  

B2C leading the way. Management noted that the company’s B2C segment was the key revenue growth driver in the quarter. Moreover, the company is poised to capitalize on an expanding B2C opportunity set with a web-based service offering. Notably, web-based services offer higher margins than the company’s mobile app offerings, due to the lack of Android and iOS app store fees.


Get the Full Report

Equity Research is available at no cost to Registered users of Channelchek. Not a Member? Click ‘Join’ to join the Channelchek Community. There is no cost to register, and we never collect credit card information.

This Company Sponsored Research is provided by Noble Capital Markets, Inc., a FINRA and S.E.C. registered broker-dealer (B/D).

*Analyst certification and important disclosures included in the full report. NOTE: investment decisions should not be based upon the content of this research summary. Proper due diligence is required before making any investment decision.