Michael Heim, Senior Vice President, Equity Research Analyst, Energy & Transportation, Noble Capital Markets, Inc.
Refer to the full report for the price target, fundamental analysis, and rating.
Hemisphere Energy reported 2024-4Q production results. Hemisphere Energy reported production of 3,375 boe/d, a 16% increase over the same period in 2022 and an 11% increase over 2023-3Q results. Production for the most recent quarter surpassed the 3,325 boe/d rate we had been using in our models.
Management gives initial 2024 production, pricing, and cost guidance. Management gave initial 2024 production, cash flow and capital expenditure guidance. Guidance was largely in line with our expectations.
Equity Research is available at no cost to Registered users of Channelchek. Not a Member? Click ‘Join’ to join the Channelchek Community. There is no cost to register, and we never collect credit card information.
This Company Sponsored Research is provided by Noble Capital Markets, Inc., a FINRA and S.E.C. registered broker-dealer (B/D).
*Analyst certification and important disclosures included in the full report. NOTE: investment decisions should not be based upon the content of this research summary. Proper due diligence is required before making any investment decision.
Healthcare technology firm HEALWELL AI is starting 2024 off strong with the strategic acquisition of Intrahealth Systems, a global provider of electronic health record (EHR) software. This $24 million deal provides HEALWELL with a platform to showcase and scale up its impressive AI capabilities within the massive EHR solutions market.
For investors focused on healthcare tech and AI, this is an exciting play on some of the most promising trends reshaping the industry. As digital health and telemedicine expand rapidly, there is surging demand for next-gen EHR systems equipped with cutting-edge analytics and AI.
HEALWELL is aiming to be at the forefront of this movement by uniting its physician-designed AI with Intrahealth’s established EHR solutions and multi-national customer base.
With over 15,000 clinicians and millions of patients served across Canada, Australia, and New Zealand, Intrahealth boasts an impressive footprint and high-margin recurring revenue exceeding $12 million annually.
HEALWELL plans to turbocharge Intrahealth’s offerings by embedding its own AI-powered clinical decision support software. This technology has already demonstrated major promise in preventative care by enabling earlier disease detection and personalized interventions.
Integrating these AI capabilities into a widely adopted EHR platform like Intrahealth opens up tremendous possibilities to amplify outcomes and lower costs for healthcare providers globally. This direction aligns perfectly with growing adoption of value-based care models that prioritize proactive, tech-enabled, and patient-centric treatment.
For HEALWELL specifically, the benefits of acquiring Intrahealth extend well beyond the technology integration upside. This established player provides HEALWELL with a stable source of profitable SaaS revenue to complement its R&D pipeline. And Intrahealth’s international reach significantly expands HEALWELL’s total addressable market.
The deal also furthers HEALWELL’s broader acquisition-driven strategy focused on consolidating AI, data science, and digital health assets. Intrahealth delivers an ideal platform to demonstrate the power of HEALWELL’s innovations to a large audience of potential customers and partners.
With healthcare spending continuing to spiral globally, there is tremendous appetite for tools that can optimize care and reduce waste. This thematic tailwind, combined with Intrahealth’s impressive financials and HEALWELL’s tech prowess, makes the acquisition look like a savvy move.
The opportunity in AI-enhanced software platforms like EHR looks especially strong when considering the sheer size of the healthcare IT market. According to Grand View Research, this sector is projected to reach $230 billion by 2028, expanding at nearly 12% annually.
Within this landscape, EHR systems are a central focus, with MarketsandMarkets forecasting this specific niche to be worth $48 billion globally by 2027. First movers with differentiated offerings stand to grab significant market share as adoption of next-gen EHR accelerates.
By snapping up Intrahealth, HEALWELL is positioning itself as a frontrunner in this race to redefine the EHR status quo. Investors interested healthcare technology and AI should keep a close eye on how successfully HEALWELL leverages this strategic acquisition. The company’s progress integrating its robust AI into Intrahealth’s solutions will be an important proof point.
Overall, the Intrahealth deal provides HEALWELL with both an immediate boost in revenue and profitability, plus a long-term growth driver if the combined EHR/AI offering gains traction. This is exactly the sort of calculated, opportunistic move investors should want to see in an emerging healthcare technology leader like HEALWELL.
The New Year has kicked off with a bang in biotech, as CG Oncology has completed the first initial public offering in the space for 2024. The cancer-focused biotech raised a whopping $380 million in its IPO on the Nasdaq, sailing past its initial target range of $181 million.
CG Oncology priced its shares at $19 apiece, above the $16-18 range it had set ahead of the IPO. The impressive deal is being viewed by many analysts and investors as a positive indicator that the biotech IPO market is rebounding in 2024 after a relatively slow 2023.
The robust demand for CG Oncology stock reflects renewed optimism and openness to investing in early-stage biotech companies, especially those with innovative science and strong leadership teams.
CG Oncology is developing a novel oncolytic virus therapy known as cretostimogene grenadenorepvec for the treatment of non-muscle invasive bladder cancer. Oncolytic viruses represent an exciting new approach in cancer treatment, wherein specially engineered viruses are able to infect and destroy cancer cells directly while also stimulating anti-tumor immune responses.
Cretostimogene grenadenorepvec is an adenovirus that has been engineered to replicate selectively in bladder cancer cells and stimulate the immune system by expressing granulocyte-macrophage colony-stimulating factor (GM-CSF). Early stage clinical data have shown promising signs of efficacy.
The company plans to use the IPO proceeds to fund a Phase 3 clinical trial of its lead candidate as well as earlier stage pipeline programs. Success in the Phase 3 study could support regulatory approval and commercialization.
CG Oncology was founded in 2018 by a veteran team of biotech entrepreneurs and scientists. The company pursued a pre-IPO crossover financing round in 2022, enabling it to build momentum heading into its public debut.
The IPO success places CG Oncology in a strong position to advance its pipeline. With the influx of capital, the company will be able to aggressively pursue its clinical development plans without relying heavily on external partners.
Moreover, the validation and visibility provided by being a public company can potentially help CG Oncology forge productive collaborations and access additional funding in the future.
Looking ahead, the positive investor response to CG Oncology seems likely to pave the way for more biotech IPOs in 2024. A robust IPO market provides fuel for innovation and discoveries that can transform patient lives.
The biotech sector sputtered in 2022, with only around 20 IPOs completed versus more than 50 in 2021. However, sentiment appears to be shifting, perhaps signaling sunnier days ahead.
In addition to favorable market conditions, biotech companies pursuing IPOs seem to be taking valuable lessons from 2022 by tightening focus on fundamentals like drug efficacy and visibility on clinical milestones.
Other than CG Oncology, a host of biotechs have already filed with SEC intentions to go public in 2024, spanning exciting areas like gene therapy, neurology, and synthetic biology.
With fresh capital and investor enthusiasm, the next generation of biotech companies can pursue ambitious goals to develop innovative medicines. More early-stage companies may also gain the funding needed to initiate or advance clinical trials.
CG Oncology’s big IPO pop reflects the right combination of cutting-edge science, unmet medical need, and strong leadership. This formula will likely be replicated by other emerging biotech stars in the making.
In all, the successful CG Oncology IPO kicks off 2024 as a promising year for biotech funding, innovation, and progress against once intractable diseases. Investors and industry observers will be tracking the IPO market closely through the year for signs of sustained momentum. If the appetite for compelling biotech stories persists, it could drive a much-needed renaissance helping to unlock new medical frontiers.
Mark your calendars! Don’t miss Noble Capital Markets’ Emerging Growth Virtual Healthcare Equity Conference April 17-18. This exclusive virtual event connects investors with 50 leading public biotech, healthcare services, and medical device companies. Presenting company slots are available.
ORME was created to reward customers for interacting with brands and retailers
NEW YORK, Jan. 24, 2024 (GLOBE NEWSWIRE) — Xcel Brands, Inc. (NASDAQ: XELB) (“Xcel” or the “Company”), a media and consumer products company with expertise in livestream shopping and social commerce, today announced its 30% investment in ORME, a groundbreaking short-form video (SFV) marketplace designed to revolutionize social commerce.
“ORME is an opportunity with unicorn potential,” said Robert W. D’Loren, Chairman and Chief Executive Officer of Xcel. “ORME is redefining how consumers interact with brands and products, creating a seamless and engaging shopping experience that provides a nearly infinite return on ad spend for brands and gives all shoppers an opportunity to participate in the retail commerce flywheel.”
Faisal Ahmed, CEO of ORME, Inc., highlighted, “ORME is more than a marketplace; it is a community where social sharing and referral incentives include and reward shoppers and influencers. This feature not only amplifies brand content but also offers fee earning potential through referrals, leveraging the power of social networks and word-of-mouth marketing.”
ORME is set to transform the retail model from a one-to-many to a many-to-many experience. Combining the best aspects of affiliate, influencer, and digital marketing into a performance-based model, ORME presents a whole new experience for shoppers, influencers, brands, and retailers.
For shoppers and influencers, ORME creates a unique environment where they can create fun content, tell inspiring stories, learn from authentic people, explore an array of products in fashion, beauty, home, pet, and wellness sectors, and even earn performance-based cash fees for sharing content. For brands and retailers, ORME offers free, simple, and fast integration with all e-commerce platforms and an easy, efficient, and controlled content creation process. The platform also boasts a personalized AI-powered content and product recommendation engine, a style chatbot, and a content editor filter.
ORME aims to solve the issues with low conversion rates with affiliate, influencer and digital marketing, and the lack of an end-to-end SFV platform in the US. According to McKinsey & Company, on average, 28% of video shopping leads are converted into sales, a statistic that ORME plans to capitalize on.
The SFV and social commerce market is growing rapidly. Affiliate and banner marketing is a $12 billion market globally, with video shopping projected to be a $35 billion market in the US in 2024. Social media influencer marketing spend by brands was around $16.4 billion in 2022 and is increasing at a rate of 18.8% per annum.
About Xcel Brands
Xcel Brands, Inc. (NASDAQ: XELB) is a media and consumer products company engaged in the design, marketing, live streaming, social commerce sales of branded apparel, footwear, accessories, fine jewelry, home goods and other consumer products, and the acquisition of dynamic consumer lifestyle brands. Xcel was founded in 2011 with a vision to reimagine shopping, entertainment, and social media as one thing. Xcel owns the Judith Ripka, Halston, LOGO by Lori Goldstein, and C. Wonder by Christian Siriano brands and a minority stake in the Isaac Mizrahi brand. It also owns and manages the Longaberger brand through its controlling interest in Longaberger Licensing LLC and a 50% interest in a JV in TWRHLL (“Tower Hill”) by Christie Brinkley. Xcel is pioneering a true modern consumer products sales strategy which includes the promotion and sale of products under its brands through interactive television, digital live-stream shopping, social commerce, brick-and-mortar retail, and e-commerce channels to be everywhere its customer’s shop. The company’s brands have generated in excess of $4 billion in retail sales via livestreaming in interactive television and digital channels alone. Headquartered in New York City, Xcel Brands is led by an executive team with significant live streaming, production, merchandising, design, marketing, retailing, and licensing experience, and a proven track record of success in elevating branded consumer products companies. www.xcelbrands.com.
About ORME
ORME is based in New York and is a next generation short form video marketplace inspiring our users through honest and authentic content created by shoppers, creators, influencers and brands wherever they create, watch, listen, connect and socialize in the digital universe. ORME was cofounded by Xcel Brands and KonnectBio, Inc.
ORME is committed to evolving through innovations in technology including the major application of AI, making deep connections with our users and community and providing opportunity to all in the retail commerce flywheel. ORME makes the everyday shopper a paid influencer. www.ormelive.com
Forward Looking Statements
This press release contains forward-looking statements. All statements other than statements of historical fact contained in this press release, including statements regarding future events, our future financial performance, business strategy and plans and objectives of management for future operations, are forward-looking statements. We have attempted to identify forward-looking statements by terminology including “anticipates,” “believes,” “can,” “continue,” “ongoing,” “could,” “estimates,” “expects,” “intends,” “may,” “appears,” “suggests,” “future,” “likely,” “goal,” “plans,” “potential,” “projects,” “predicts,” “seeks,” “should,” “would,” “guidance,” “confident” or “will” or the negative of these terms or other comparable terminology. These forward-looking statements include, but are not limited to, statements regarding our anticipated revenue, expenses, profitability, strategic plans and capital needs. These statements are based on information available to us on the date hereof and our current expectations, estimates and projections and are not guarantees of future performance. Forward-looking statements involve known and unknown risks, uncertainties, assumptions and other factors, including, without limitation, the risks discussed in the “Risk Factors” section and elsewhere in the Company’s Annual Report on form 10-K for the year ended December 31, 2022 and its other filings with the SEC, which may cause our or our industry’s actual results, levels of activity, performance or achievements to differ materially from those expressed or implied by these forward-looking statements. Moreover, we operate in a very competitive and rapidly changing environment. New risks emerge from time to time, and it is not possible for us to predict all risk factors, nor can we address the impact of all factors on our business or the extent to which any factor, or combination of factors, may cause our actual results to differ materially from those contained in any forward-looking statements. You should not place undue reliance on any forward-looking statements. Except as expressly required by the federal securities laws, we undertake no obligation to update any forward-looking statements, whether as a result of new information, future events, changed circumstances or any other reason.
For further information please contact:
Dave Gentry, CEO RedChip Companies Inc. 407-491-4498 XELB@redchip.com
Vancouver, British Columbia–(Newsfile Corp. – January 25, 2024) – Hemisphere Energy Corporation (TSXV: HME) (OTCQX: HMENF) (“Hemisphere” or the “Company”) is pleased to provide a corporate update, announce the declaration of a quarterly dividend payment to shareholders, and deliver guidance for 2024.
Corporate Update
Hemisphere realized another successful year in 2023, balancing production growth with balance sheet strength and shareholder return. During the year, $17.5 million was returned to shareholders in the form of dividends ($13.1 million) and share buybacks ($4.4 million), representing an approximate 14% yield to shareholders based on the market capitalization of Hemisphere at year-end.
The Company achieved record average production in the fourth quarter of 3,375 boe/d (99% heavy oil), which represents a 16% increase over the same period in 2022. This growth in production year-over-year is the combined result of Hemisphere’s successful third quarter drilling program with the Company’s effective enhanced oil recovery (“EOR”) polymer flood projects. Hemisphere’s annual average production for 2023 was approximately 3,100 boe/d (99% heavy oil), representing 10% growth as compared to 2022.
Balance sheet strength continued to be a priority in 2023, with Hemisphere exiting the year in a cash position. Hemisphere funded all of its shareholder returns and entire $16 million capital expenditure1 program on 2023 cash flow. In addition to drilling 8 successful Atlee Buffalo wells and upgrading some of its facilities, the Company acquired over 2,500 hectares of new land in Saskatchewan and Alberta. Hemisphere has plans to drill a new prospect on some of these Saskatchewan lands in the first half of 2024, and believes it to be prospective for EOR polymer flooding.
Given the significant free cash flow generated by Hemisphere’s ultra-low production decline and long-life reserve asset base, the Company was able to complement its $0.025 per share quarterly base dividend with a $0.03 per share special dividend paid in the fourth quarter of 2023. This brought total shareholder returns last year to $0.13 per share in dividends. Hemisphere also invested $4.4 million into its normal course issuer bid (“NCIB”) share buyback program to purchase and cancel 3.5 million shares in 2023.
Quarterly Dividend
Hemisphere is pleased to announce that its Board of Directors has approved a quarterly cash dividend of $0.025 per common share in accordance with the Company’s dividend policy. The dividend will be paid on February 23, 2024 to shareholders of record as of the close of business on February 9, 2024. The dividend is designated as an eligible dividend for income tax purposes.
2024 Corporate Guidance
Hemisphere’s Board of Directors has approved a 2024 capital expenditure program of $21 million, which is planned to be entirely funded by Hemisphere’s estimated 2024 adjusted funds flow1 (“AFF”) of $40 million and is anticipated to provide 10% annual production growth. The majority of capital will be allocated to drilling and facility work, with approximately 10% allotted to exploration and land acquisition. Over half of the planned capital expenditures are scheduled for the third quarter, providing Hemisphere with the flexibility to adjust plans subject to the commodity price environment.
The start of 2024 brought with it some extreme cold weather which has substantially affected corporate production during the month of January. The failure of an electrical panel at Hemisphere’s G pool facility resulted in the loss of power to its operations. Subsequent sustained -40°C weather led to freezing of most of the G pool wells and facility, which experienced 5 days of complete downtime and an additional few days of lower production as equipment was repaired and wells were brought back online. All impacts of this production disruption have been accounted for in the guidance set out below, and the team has now restored operations back to normal levels.
After capital expenditures and asset retirement obligations (“ARO”), 2024 free funds flow1 (“FFF”) is estimated to be $19 million, of which approximately 50% is planned to be paid in quarterly dividends as shown in the table below. The balance of cash will be used for discretionary purposes, which may include potential acceleration of other development or exploration projects, acquisitions, and additional return of capital to shareholders through Hemisphere’s NCIB program and/or special dividends.
Management believes that the 2024 development plan provides stable production growth and consistent shareholder returns, while still allowing for modest investment in a new EOR play with exciting growth potential for the Company.
Highlights and assumptions of Hemisphere’s guidance at US$75/bbl WTI are as follows:
Average annual production of 3,400 boe/d (99% heavy oil), a 10% increase as compared to 2023
Average WTI price of US$75/bbl, with sensitivities shown at US$65/bbl and US$85/bbl
WCS differential of US$15.50/bbl and quality adjustment of $7.50/bbl
CAD/US FX of 1.35
Operating and transportation costs of $14.85/boe
Royalties and GORRs on gross revenue of 20% at US$75/bbl WTI, 18% at US$65/bbl WTI, and 22% at US$85/bbl WTI
Net G&A of $3.65/boe
Tax Costs of $7.29/boe at US$75/bbl WTI, $4.91/boe at US$65/bbl WTI, and $9.53/boe at US$85/bbl WTI
2024 Corporate Guidance(2)
US$65 WTI
US$75 WTI
US$85 WTI
Adjusted Funds Flow (AFF)
$ million
31
40
49
AFF per Basic Share(1,3)
$/share
0.32
0.41
0.49
Capital Expenditures& ARO
$ million
21
21
21
Free Funds Flow (FFF)
$ million
10
19
28
FFF per Basic Share(1,3)
$ million
0.10
0.19
0.28
Dividend per Basic Share(3)
$ million
0.10
0.10
0.10
Notes:
(1) AFF, Capital Expenditures, and FFF are non-IFRS financial measures that are forward looking and do not have any standardized meaning under IFRS and therefore may not be comparable to similar measures presented by other entities. AFF per basic share and FFF per basic share are non-IFRS financial ratios that are forward looking and do not have any standardized meaning under IFRS and therefore may not be comparable to similar ratios presented by other entities and include non-IFRS financial measure components of AFF and FFF. See “Non-IFRS Measures“. (2) See assumptions noted above within “2024 Corporate Guidance”. (3) Using a 2024 weighted average of 98,988,539 basic shares issued and outstanding. (4) The amounts above do not include potential future purchases through the Company’s NCIB program or other discretionary uses of available funds.
About Hemisphere Energy Corporation
Hemisphere is a dividend-paying Canadian oil company focused on maximizing value-per-share growth with the sustainable development of its high netback, ultra-low decline conventional heavy oil assets through EOR polymer flood projects. Hemisphere trades on the TSX Venture Exchange as a Tier 1 issuer under the symbol “HME” and on the OTCQX Venture Marketplace under the symbol “HMENF”.
For further information, please visit the Company’s website at www.hemisphereenergy.ca to view its corporate presentation or contact:
Don Simmons, President & Chief Executive Officer Telephone: (604) 685-9255 Email: info@hemisphereenergy.ca
Certain statements included in this news release constitute forward-looking statements or forward-looking information (collectively, “forward-looking statements”) within the meaning of applicable securities legislation. Forward-Looking statements are typically identified by words such as anticipate, continue, estimate, expect, forecast, may, will, project, could, plan, intend, should, believe, outlook, potential, target, and similar words suggesting future events or future performance. In particular, but without limiting the generality of the foregoing, this news release includes forward-looking statements regarding the Company’s plans to drill its new Saskatchewan prospect in early 2024 and its belief that it is prospective for EOR polymer flooding; the record date and payment date for Hemisphere’s quarterly dividend; that Hemisphere’s 2024 capital budget is planned to be entirely funded by Hemisphere’s estimated 2024 AFF and is anticipated to provide 10% annual production growth, including that the majority of capital will be allocated to drilling and facility work, with approximately 10% of it allotted to exploration and land acquisition as well as expectations for the timing of such expenditures; Hemisphere’s anticipation that approximately 50% of estimated $19 million in free funds flow will be paid in quarterly dividends with the balance of cash being used for discretionary purposes, which may include potential acceleration of other development or exploration projects, acquisitions, and additional return of capital to shareholders through Hemisphere’s NCIB program and/or special dividends; the expected manner in which the Company’s 2024 capital budget will be spent, including the timing of such expenditures and any discretionary amounts, which may include potential acceleration of other development or exploration projects, acquisitions, and return of capital to shareholders through Hemisphere’s NCIB program and/or dividends, and the anticipated effects thereof, including as set forth under “2024 Corporate Guidance” and the Company’s dividend policy and the other matters and guidance set forth under “2024 Corporate Guidance”.
Forward‐Looking statements are based on a number of material factors, expectations or assumptions of Hemisphere which have been used to develop such statements and information, but which may prove to be incorrect. Although Hemisphere believes that the expectations reflected in such forward‐looking statements or information are reasonable, undue reliance should not be placed on forward‐looking statements because Hemisphere can give no assurance that such expectations will prove to be correct. In addition to other factors and assumptions which may be identified herein (including the assumptions noted in respect of “2024 Corporate Guidance”), assumptions have been made regarding, among other things: the current and go-forward oil price environment; that Hemisphere will continue to conduct its operations in a manner consistent with past operations; that results from drilling and development activities are consistent with past operations; the quality of the reservoirs in which Hemisphere operates and continued performance from existing wells; the continued and timely development of infrastructure in areas of new production; inflationary pressure and related costs; that the Company’s dividend policy will remain the same and the Company will continue to be able to declare dividends; the accuracy of the estimates of Hemisphere’s reserve volumes; certain commodity price and other cost assumptions; continued availability of debt and equity financing and cash flow to fund Hemisphere’s current and future plans and expenditures; the impact of increasing competition; the general stability of the economic and political environment in which Hemisphere operates; the general continuance of current industry conditions; the timely receipt of any required regulatory approvals; the ability of Hemisphere to obtain qualified staff, equipment and services in a timely and cost efficient manner; drilling results; the ability of the operator of the projects in which Hemisphere has an interest in to operate the field in a safe, efficient and effective manner; the ability of Hemisphere to obtain financing on acceptable terms; field production rates and decline rates; the accuracy of the Company’s reservoir modelling; the ability to replace and expand oil and natural gas reserves through acquisition, development and exploration; the timing and cost of pipeline, storage and facility construction and expansion and the ability of Hemisphere to secure adequate product transportation; future commodity prices; currency, exchange and interest rates; regulatory framework regarding royalties, taxes and environmental matters in the jurisdictions in which Hemisphere operates; and the ability of Hemisphere to successfully market its oil and natural gas products.
The forward‐looking statements included in this news release are not guarantees of future performance and should not be unduly relied upon. Such information and statements, including the assumptions made in respect thereof, involve known and unknown risks, uncertainties and other factors that may cause actual results or events to defer materially from those anticipated in such forward‐looking statements including, without limitation: changes in commodity prices; regulatory risks, including penalties or other remedial actions, the ability of the Company to maintain legal title to its properties; changes in the demand for or supply of Hemisphere’s products, the early stage of development of some of the evaluated areas and zones; unanticipated operating results or production declines; results of Hemisphere’s waterflood operations; the ability of Hemisphere to, pending future events, return capital to shareholders as a result of any required third party approvals; changes in budgets; changes in tax or environmental laws, royalty rates or other regulatory matters; changes in development plans of Hemisphere or by third party operators of Hemisphere’s properties, increased debt levels or debt service requirements; inaccurate estimation of Hemisphere’s oil and gas reserve volumes; limited, unfavourable or a lack of access to capital markets; increased costs; a lack of adequate insurance coverage; the impact of competitors; and certain other risks detailed from time‐to‐time in Hemisphere’s public disclosure documents, (including, without limitation, those risks identified in this news release and in Hemisphere’s most recent Annual Information Form).
The forward‐looking statements contained in this news release speak only as of the date of this news release, and Hemisphere does not assume any obligation to publicly update or revise any of the included forward‐looking statements, whether as a result of new information, future events or otherwise, except as may be required by applicable securities laws.
Forward-Looking Financial Information
This news release may contain future oriented financial information (“FOFI”) within the meaning of applicable securities laws, including with respect to the Company’s anticipated 2024 Free Funds Flow and Adjusted Funds Flow. The FOFI has been prepared by management to provide an outlook of the Company’s activities and results. The FOFI has been prepared based on a number of assumptions including the assumptions discussed and disclosed above, including in relation to “2024 Corporate Guidance” above and “Forward-Looking Statements” above and that the Company is cash taxable in 2024. Readers are cautioned that the assumptions used in the preparation of such information, although considered reasonable at the time of preparation, may prove to be imprecise and, as such, undue reliance should not be placed on FOFI. The Company’s actual results, performance or achievement could differ materially from those expressed in, or implied by, these FOFI, or if any of them do so, what benefits the Company will derive therefrom. The Company has included the FOFI in order to provide readers with a more complete perspective on the Company’s future operations and such information may not be appropriate for other purposes. The Company disclaims any intention or obligation to update or revise any FOFI statements, whether as a result of new information, future events or otherwise, except as required by law.
Non-IFRS and Other Measures
This news release contains terms that are non-IFRS measures or ratios that are forward-looking and commonly used in the oil and gas industry which are not defined by or calculated in accordance with International Financial Reporting Standards (“IFRS”), such as: (i) adjusted funds flow (ii) adjusted funds flow per basic share; (iii) capital expenditures; (iv) free funds flow; and (v) free funds flow per basic share. These terms should not be considered an alternative to, or more meaningful than the comparable IFRS measures (as determined in accordance with IFRS) which in the case of funds flow is cash provided by operating activities, in the case of adjusted funds flow (and adjusted funds flow per share) is cash provided by operating activities and in the case of capital expenditures is cash flow used in investing activities. There is no IFRS measure that is reasonably comparable to free funds flow. These measures are commonly used in the oil and gas industry and by Hemisphere to provide shareholders and potential investors with additional information regarding: (i) in the case of adjusted funds flow and free funds flow, the Company’s ability to generate the funds necessary to support future growth through capital investment and to repay any debt.
Hemisphere’s determination of these measures may not be comparable to that reported by other companies. Adjusted funds flow is calculated as cash generated by operating activities, before changes in non-cash working capital and adjusted for any decommissioning expenditures; Adjusted funds flow per share is calculated using the outstanding basic shares of the company as footnoted in the 2024 Corporate Guidance table; Free Funds Flow is calculated as Adjusted Funds Flow less capital expenditures; and Free funds flow per share is calculated using the outstanding basic shares of the company as footnoted in the 2024 Corporate Guidance table. The Company has provided additional information on how these measures are calculated, including a reconciliation of such measures to their comparable IFRS measure, in the Management’s Discussion and Analysis for the year ended December 31, 2022 and the interim period ended September 30, 2023, which are available under the Company’s SEDAR+ profile at www.sedarplus.ca.
In respect of any forward-looking non-IFRS measures, there is no significant difference between the non-GAAP financial measure that are forward-looking information and the equivalent historical non-GAAP financial measures.
In this news release, Hemisphere uses the term market capitalization at year-end. Hemisphere’s market capitalization was $128 million at the close of December 29, 2023, the last trading day of the year.
Oil and Gas Advisories
Any references in this news release to recent production rates (including as a result of recent waterflood activities) which may be considered to be initial rates and are useful in confirming the presence of hydrocarbons; however, such rates are not determinative of the rates at which such wells will continue production and decline thereafter and are not necessarily indicative of long-term performance or ultimate recovery. While encouraging, readers are cautioned not to place reliance on such rates in calculating the aggregate production for the Company. Such rates are based on field estimates and may be based on limited data available at this time.
A barrel of oil equivalent (“boe”) may be misleading, particularly if used in isolation. A boe conversion ratio of 6 Mcf:1 Bbl is based on an energy equivalency conversion method primarily applicable at the burner tip and does not represent a value equivalency at the wellhead. In addition, given that the value ratio based on the current price of crude oil as compared to natural gas is significantly different from the energy equivalency of 6:1, utilizing a conversion on a 6:1 basis may be misleading as an indication of value.
Definitions and Abbreviations
bbl
Barrel
WTI
West Texas Intermediate
bbl/d
barrels per day
WCS
Western Canadian Select
$/bbl
dollar per barrel
US$
United States Dollar
boe
barrel of oil equivalent
boe/d
barrel of oil equivalent per day
IFRS
International Financial Reporting Standards
$/boe
dollar per barrel of oil equivalent
G&A
General and Administrative Costs
Neither the TSX Venture Exchange nor its Regulation Services Provider (as that term is defined in the policies of the TSX Venture Exchange) accepts responsibility for the adequacy or accuracy of this news release.
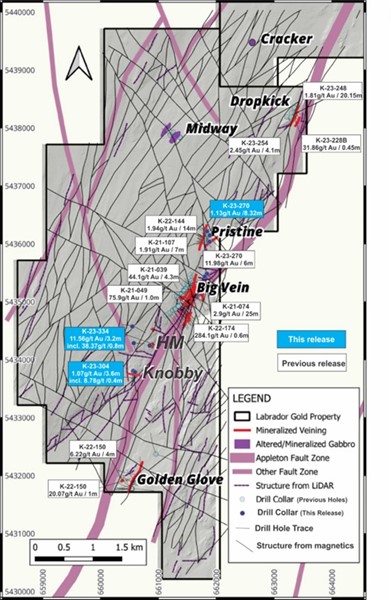
TORONTO, Jan. 25, 2024 (GLOBE NEWSWIRE) — Labrador Gold Corp. (TSX.V:LAB | OTCQX:NKOSF | FNR: 2N6) (“LabGold” or the “Company”) is pleased to announce results from recent drilling targeting the highly prospective Appleton Fault Zone. The drilling is part of the Company’s ongoing 100,000 metre diamond drilling program at its 100% owned Kingsway Project.
The latest results include holes drilled at Pristine, the NE extension of Big Vein, initial holes at Knobby and Peter Easton as well as the first hole in the new HM occurrence.
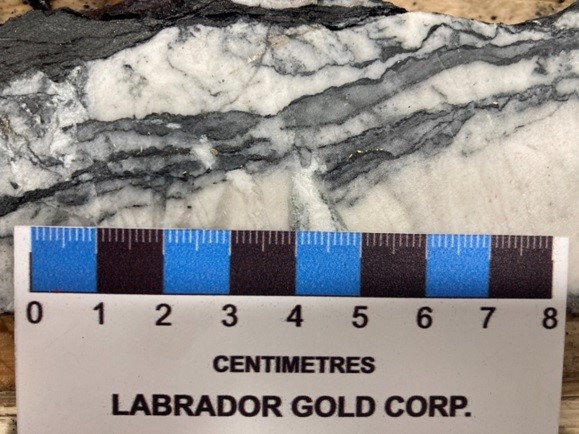
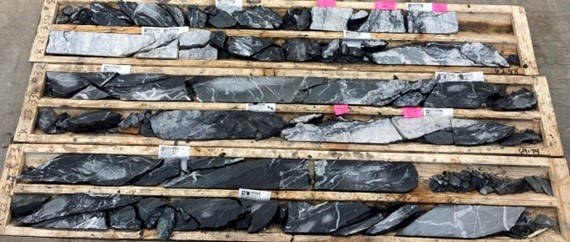
Hole K-23-334 was a short hole drilled into the HM occurrence to test for gold mineralization at depth below the quartz vein at surface. Most of the hole was anomalous in gold grading 0.87g/t Au over 55.9 metres that included a zone with 27 grains of visible gold that graded 38.37g/t Au over 0.8 metres from 61.4 metres near the bottom of the hole. The HM occurrence was found by prospecting and is located approximately 570m along strike to the southwest of Big Vein and a similar distance northeast of Knobby. Hole K-23-334 is the only hole drilled into this occurrence to date.
Results from Hole K-23-304, drilled at Knobby intersected two quartz zones containing visible gold at 42 and 49 metres. These intersections graded 1.27g/t Au over 0.42 metres and 8.78g/t Au over 0.4 metres, respectively.
“We are excited by the results from the first hole at HM. While it is good to see the high grade associated with the visible gold, it is very encouraging to see continuous, anomalous gold in the country rock to the quartz veins throughout much of the hole,” said Roger Moss, President and CEO of Labrador Gold. “This new occurrence, the seventh to be found by the LabGold team since we started work on the property, continues to demonstrate the significant prospectivity of the area around the Appleton Fault Zone at Kingsway. With a total strike length of approximately 12km across the property, we are optimistic that more occurrences will be uncovered going forward.”
Figure 1. Visible gold grains in quartz vein from Hole K-23-334.
Figure 2. Mineralized quartz vein intervals in Hole K-23-334.
Hole K-23-291 drilled at Pristine intersected near surface gold mineralization grading 1.13g/t Au over 8.32 metres from 15 metres including 2.31g/t over 3 metres. Holes drilled at Peter Easton and to the northeast of Big Vein tested structures interpreted from airborne magnetics and three of the four holes did not intersect gold mineralization
Hole ID
From (m)
To (m)
Interval (m)
Au (g/t)
Zone
K-23-334
8.70
64.60
55.90
0.87
HM
including
61.40
64.60
3.20
11.56
including
61.40
62.20
0.80
38.37
K-23-304
42.78
43.20
0.42
1.27
Knobby
48.80
52.40
3.60
1.07
including
48.80
49.20
0.40
8.78
K-23-302
nsv
Knobby
K-23-291
15.00
23.32
8.32
1.13
Pristine
including
15.00
18.00
3.00
2.31
48.70
49.25
0.55
1.51
K-23-290
52.36
54.12
1.76
1.06
Pristine
K-23-289
nsv
Peter Easton
K-23-288
318.00
320.00
2.00
1.64
Big Vein
K-23-287
nsv
Pristine
K-23-286
nsv
Peter Easton
K-23-285
100.00
101.80
1.80
1.33
Pristine
183.32
224.00
40.68
0.18
K-23-284
nsv
Big Vein
Table 1. Summary of recent assay results. All intersections are downhole length as there is insufficient Information to calculate true width.
Hole number
Easting
Northing
Elevation
Azimuth
Dip
Total Depth
K-23-334
660889
5434242
32
75
45
73
K-23-304
660576
5433754
42
187
45
157
K-23-302
660597
5433754
39
187
45
157
K-23-291
661909
5436148
54
0
90
176
K-23-290
661848
5436193
58
190
60
159.5
K-23-289
660584
5434277
52
160
45
235
K-23-288
661860
5435469
36
130
65
401
K-23-287
661848
5436194
58
0
90
179
K-23-286
660572
5434583
71
275
45
259
K-23-285
661898
5436043
51
315
65
224
K-23-283
660574
5434583
72
120
45
181
K-23-284
661832
5435419
35
130
65
383
Table 2. Drill collar details.
Figure 3. Kingsway occurrences with highlights of recent drilling.
QA/QC True widths of the reported intersections have yet to be calculated. Assays are uncut. Samples of HQ split core are securely stored prior to shipping to Eastern Analytical Laboratory in Springdale, Newfoundland for assay. Eastern Analytical is an ISO/IEC17025 accredited laboratory. Samples are routinely analyzed for gold by standard 30g fire assay with atomic absorption finish as well as by ICP-OES for an additional 34 elements. Samples containing visible gold are assayed by metallic screen/fire assay, as are any samples with fire assay results greater than 1g/t Au. The company submits blanks and certified reference standards at a rate of approximately 5% of the total samples in each batch. Approximately 5% of sample pulps are submitted to Bureau Veritas, an ISO 17025 accredited Laboratory in Vancouver, BC for check assays.
Qualified Person Roger Moss, PhD., P.Geo., President and CEO of LabGold, a Qualified Person in accordance with Canadian regulatory requirements as set out in NI 43-101, has read and approved the scientific and technical information that forms the basis for the disclosure contained in this release.
About Labrador Gold Labrador Gold is a Canadian based mineral exploration company focused on the acquisition and exploration of prospective gold projects in Eastern Canada.
Labrador Gold’s flagship property is the 100% owned Kingsway project in the Gander area of Newfoundland. The three licenses comprising the Kingsway project cover approximately 12km of the Appleton Fault Zone which is associated with numerous gold occurrences in the region. Infrastructure in the area is excellent located just 18km from the town of Gander with road access to the project, nearby electricity and abundant local water. LabGold is drilling a projected 100,000 metres targeting high-grade epizonal gold mineralization along the Appleton Fault Zone with encouraging results. The Company has approximately $7 million in working capital and is well funded to carry out the planned program.
The Hopedale property covers much of the Florence Lake greenstone belt that stretches over 60 km. The belt is typical of greenstone belts around the world but has been underexplored by comparison. Work to date by Labrador Gold show gold anomalies in rocks, soils and lake sediments over a 3 kilometre section of the northern portion of the Florence Lake greenstone belt in the vicinity of the known Thurber Dog gold showing where grab samples assayed up to 7.8g/t gold. In addition, anomalous gold in soil and lake sediment samples occur over approximately 40 km along the southern section of the greenstone belt (see news release dated January 25th 2018 for more details). Labrador Gold now controls approximately 40km strike length of the Florence Lake Greenstone Belt.
The Company has 170,009,979 common shares issued and outstanding and trades on the TSX Venture Exchange under the symbol LAB.
For more information please contact: Roger Moss, President and CEO Tel: 416-704-8291
Neither TSX Venture Exchange nor its Regulation Services Provider (as that term is defined in policies of the TSX Venture Exchange) accepts responsibility for the adequacy or accuracy of this release .
Forward-Looking Statements: This news release contains forward-looking statements that involve risks and uncertainties, which may cause actual results to differ materially from the statements made. When used in this document, the words “may”, “would”, “could”, “will”, “intend”, “plan”, “anticipate”, “believe”, “estimate”, “expect” and similar expressions are intended to identify forward-looking statements. Such statements reflect our current views with respect to future events and are subject to risks and uncertainties. Many factors could cause our actual results to differ materially from the statements made, including those factors discussed in filings made by us with the Canadian securities regulatory authorities. Should one or more of these risks and uncertainties, such as actual results of current exploration programs, the general risks associated with the mining industry, the price of gold and other metals, currency and interest rate fluctuations, increased competition and general economic and market factors, occur or should assumptions underlying the forward looking statements prove incorrect, actual results may vary materially from those described herein as intended, planned, anticipated, or expected. We do not intend and do not assume any obligation to update these forward-looking statements, except as required by law. Shareholders are cautioned not to put undue reliance on such forward-looking statements
Photos accompanying this announcement are available at:
RICHMOND, Va.–(BUSINESS WIRE)– Bowlero Corp. (NYSE: BOWL) (“Bowlero” or the “Company”), the global leader in bowling entertainment, will report financial results for the second quarter of fiscal 2024 on Monday, February 5, 2024, before the U.S. stock market opens. Management will discuss the results via webcast at 10:00 AM ET on the same day.
The live webcast, replay, and results presentation will be available in the Events & Presentations section of the Bowlero Investor Relations website at https://ir.bowlerocorp.com/.
About Bowlero Corp Bowlero is the global leader in bowling entertainment. With approximately 350 bowling centers across North America, Bowlero serves more than 40 million guest visits annually through a family of brands that include Bowlero, Lucky Strike and AMF. In 2019, Bowlero acquired the Professional Bowlers Association, the major league of bowling, which boasts thousands of members and millions of fans across the globe. For more information on Bowlero, please visit BowleroCorp.com.
Michael Heim, Senior Vice President, Equity Research Analyst, Energy & Transportation, Noble Capital Markets, Inc.
Refer to the full report for the price target, fundamental analysis, and rating.
Fiscal third quarter results continued AZZ’s upward trend. AZZ reported strong results in the third quarter as sales continued to expand and operating margins increased. While there was a nonrecurring boost to AZZ’s nonconsolidated division, that should not take away from favorable results at AZZ’s Metal Coating and Precoat Metals divisions. We look for top-line growth to continue at a 2-3% rate and for EBITDA margins to continue to expand towards 25% with a continued shift toward the higher-margin Metal Coating division.
Coating company stocks have risen in recent months. The DJIA has risen 14% in the last three months. AZZ’s increase of 33% over that time period leads its coating peer group, but other stocks such as Chemours (CC) and Sherwin-Williams (SHW) have also risen more than 25%. As a result, the peer group median forward P/E has risen to 17 times from 15 times and the median EV/EBITDA has increased to 13 times from 10 times.
Equity Research is available at no cost to Registered users of Channelchek. Not a Member? Click ‘Join’ to join the Channelchek Community. There is no cost to register, and we never collect credit card information.
This Company Sponsored Research is provided by Noble Capital Markets, Inc., a FINRA and S.E.C. registered broker-dealer (B/D).
*Analyst certification and important disclosures included in the full report. NOTE: investment decisions should not be based upon the content of this research summary. Proper due diligence is required before making any investment decision.
Two of the biggest tech giants, Meta and Microsoft, recently hit major market cap milestones as part of the ongoing record rally in tech stocks.
Meta’s market cap surpassed the $1 trillion during intraday trading on January 24th, marking the first time the company reclaimed this valuation since 2021. Meta previously hit the $1 trillion mark in September 2021 at the height of its stock’s popularity.
Driving Meta’s soaring stock price is a nearly 200% surge over the past year, as CEO Mark Zuckerberg enacted cost-cutting that included laying off over 20,000 employees. After its stock plummeted to a six-year low in 2022, Zuckerberg has described 2023 as a “year of efficiency.”
Shareholders are bullish on Meta’s focus on expanding its position in artificial intelligence. Last week, Zuckerberg revealed the company is ramping up AI investments, procuring hundreds of thousands of high-powered AI chips from Nvidia. This signals Meta is spending billions to compete in the red-hot AI space.
On the same day Meta topped $1 trillion, Microsoft also briefly surpassed the $3 trillion mark during trading on January 24th. This comes around two weeks after Microsoft temporarily overtook Apple as the world’s most valuable company in mid-January. While Apple has since regained the top valuation spot, Microsoft remains hot on its heels.
Fueling Microsoft’s continued share price gains is optimism around the company’s AI initiatives. Microsoft stock is up over 7% year-to-date amid strong demand for AI capabilities, especially in generative AI.
Analysts predict Microsoft will post a solid earnings beat for its upcoming quarterly report, citing its leadership in enterprise-level AI as a key advantage. Microsoft seems poised to capitalize on the explosion of interest in AI technologies like ChatGPT.
AI Arms Race
The back-to-back market cap milestones from Meta and Microsoft highlight the massive investments pouring into artificial intelligence right now.
With breakout successes like ChatGPT demonstrating new possibilities for generative AI, tech giants are racing to stake their claims. The companies leading development of advanced AI stand to reap substantial rewards.
Both Meta and Microsoft are positioning themselves at the forefront of this AI arms race. In addition to its major chip purchases, Meta recently unveiled its own chatbot project, BlenderBot. Microsoft is integrating generative AI into Bing search and other offerings.
The tech world’s strike into AI looks poised to pay off based on the positive investor sentiment boosting Meta and Microsoft’s valuations. However, the AI hype cycle could eventually lead to a correction for these high-flying stocks.
For now, shareholders seem willing to bet on the transformative potential of artificial intelligence. And the tech giants pouring money into AI research appear ready to capitalize on this enthusiasm.
Big Tech Boosts Markets
Meta and Microsoft reaching new market cap heights also highlights the outsized impact of Big Tech on the broader stock market. The performance of tech stocks is a key factor driving indexes like the S&P 500 to record levels.
Despite some pockets of weakness, optimism around AI and other emerging technologies continues fueling upward momentum. The Nasdaq index, heavily weighted toward tech, rose over 12% in 2023 even as the overall market declined.
This dynamic shows no signs of changing in 2024. Tech stocks led markets higher to begin the year, with the Nasdaq up close to 10% in January as of this writing. Stocks like Meta and Microsoft hitting new milestones reflects their leadership in this rally.
However, extended runs by Big Tech raise risks of overheating and heighten their influence on market swings. With Apple, Microsoft, Amazon, Alphabet and other tech giants comprising over 20% of the S&P 500, their performance significantly impacts overall returns.
Nonetheless, bullish sentiment toward AI and other disruptive tech breakthroughs appears likely to keep lifting valuations. As giants like Meta and Microsoft position themselves to capitalize on these trends, their gravity on markets looks set to rise.
NAYA Biosciences is expanding its clinical portfolio through the acquisition of an innovative gene therapy program from Florida Biotechnologies focused on treating rare mitochondrial diseases. This binding deal demonstrates NAYA’s strategy to rapidly build pipeline assets in high-potential areas like gene therapy.
NAYA has entered into a binding letter of intent to acquire Florida Biotechnologies for $20 million in NAYA shares, with potential milestone payments up to $5 million more. The deal specifically targets Florida Biotech’s clinical-stage gene therapy for Leber’s Hereditary Optic Neuropathy (LHON).
LHON is a rare mitochondrial genetic disease leading to progressive vision loss and blindness. There are currently no approved treatments. Florida Biotech’s AAV gene therapy aims to deliver functional copies of the mutated gene to restore cellular function.
Encouraging Safety Data
This therapeutic has already demonstrated encouraging safety data in a 28-patient Phase 1 trial conducted by Florida Biotech and the University of Miami’s Bascom Palmer Eye Institute. Building on this initial study, NAYA aims to accelerate Phase 2 development and provide early access to patients.
The therapy delivers the gene of interest inside an adeno-associated virus (AAV) vector containing a mitochondrial targeting sequence. This sequence enables delivery specifically to mitochondria, the key site of pathology in LHON and many other mitochondrial diseases.
Broad Applicability
While the lead indication is LHON, NAYA highlights this approach has potential for various mitochondrial orphan diseases. The platform’s strong intellectual property covers use of different AAV capsids and routes of administration.
This flexibility and the high unmet need enables a streamlined regulatory path, including Regenerative Medicine Advanced Therapy and priority review voucher opportunities. The technology has already received over $6 million in grant funding to date.
The asset aligns with NAYA’s focus on innovative regenerative medicine approaches with near-term clinical potential. Gene therapy represents a key component of NAYA’s strategy to build a pipeline addressing major unmet needs.
Expertise in Developing Gene Therapies
NAYA has extensive in-house expertise to advance the acquired AAV gene therapy through late-stage trials toward commercialization. For example, NAYA Chief Medical Officer Dr. Fred Grossman previously led development of the first approved gene therapy, Glybera, during his time at uniQure.
Florida Biotech co-founder Dr. Peter Kash also joins NAYA’s board, bringing over 36 years of biotech leadership experience, including developing and financing gene therapy pioneer Kite Pharma. This expertise will prove valuable for unlocking the platform’s full potential.
Execution of Broader Growth Strategy
NAYA Biosciences was formed earlier in 2023 through the merger of Clinigence Holdings and 4Front Biotech. This deal created a holding company structure to facilitate pipeline expansion through additional strategic acquisitions.
The Florida Biotechnologies program represents the next step in this growth strategy. NAYA plans to continue acquiring high-potential clinical assets to build a robust portfolio spanning gene therapy, oncology, fertility and other areas.
These efforts support NAYA’s overall mission of providing patients earlier access to transformative therapies. The company aims to take an entrepreneurial approach to aggressively advance new technologies through development.
Pending Merger to Unlock Public Markets
NAYA’s deal to acquire Florida Biotechnologies is contingent upon the completion of NAYA’s previously announced merger with fertility company INVO Bioscience, expected in Q1 2024.
The merger will create a publicly traded life sciences company under the INVO name, providing access to capital to support NAYA’s development programs and commercialization. The combined company is valued at over $100 million.
Conclusion
In summary, NAYA Bioscience’s move to acquire Florida Biotechnologies’ AAV gene therapy strengthens its pipeline and aligns with its strategy to focus on high-potential clinical assets. Leveraging its development expertise, NAYA is positioned to accelerate this innovative therapy toward commercialization and fill an important unmet need for patients with mitochondrial diseases.
Cancer research is rapidly evolving thanks to innovative biotech companies utilizing cutting-edge technology like artificial intelligence. One company at the forefront of this biotech revolution is Evaxion Biotech, which is developing novel personalized cancer vaccines powered by its proprietary AI platform.
As highlighted in a recent company press release, Evaxion is expanding its cancer vaccine pipeline to target a new class of AI-discovered tumor antigens called endogenous retroviruses (ERVs). ERVs are remnants of ancient viruses in our DNA that are often abnormally activated in cancer cells, making them visible targets for cancer vaccines.
Evaxion’s focus on ERV-based vaccines represents a breakthrough, transformative concept in cancer treatment. The company’s AI technology allows for identification of the most relevant ERV targets from patient genomic data, enabling truly personalized cancer vaccines.
Such precision vaccines could provide solutions for cancer patients unresponsive to current immunotherapies like checkpoint inhibitors. Evaxion aims to expedite development of this personalized vaccine approach, with initial proof-of-concept studies beginning mid-2024.
Evaxion’s pivot to ERV-based vaccines is powered by its proprietary AI platform, AI-Immunology. This technology integrates advanced computational models that can decode the complexity of the human immune system’s interaction with cancer.
AI-Immunology allows rapid prediction and design of novel immunotherapy candidates. This is lightyears beyond traditional vaccine discovery dependent on lengthy trial-and-error experiments.
Evaxion’s AI technology provides a holistic, personalized approach to identify the most relevant targets and optimal vaccine strategies for each patient. This is key for developing effective cancer immunotherapies against the incredible heterogeneity seen across tumors and patients.
AI-Immunology represents a scalable, adaptable platform that can be applied to infectious diseases as well. Evaxion is also pursuing viral and bacterial vaccines powered by its AI discovery engine.
Evaxion aims to accelerate innovation of its AI-discovered cancer vaccines. As indicated in its recent press release, the company has already initiated preclinical ERV vaccine studies, with plans for early proof-of-concept data by mid-2024.
This represents a rapid timeline from discovery to initial validation, enabled by AI-Immunology’s predictive modeling capabilities. Evaxion notes there is already significant interest around its ERV vaccine concept, which may help attract partners and investment to further accelerate development.
The company’s expedited progress exemplifies the ability of emerging biotech firms to move quickly from ideas to validation. Unencumbered by legacy infrastructure, these agile startups can transition discoveries into the clinic at unprecedented speed.
Investment Commentary
Evaxion’s pioneering AI platform and progress on its cancer vaccine pipeline highlights the compelling investment opportunities in emerging biotech companies.
These small firms offer differentiated technologies like AI-Immunology that enable transformative innovation not easily captured within larger pharmaceutical companies. First-mover advantage allows rapid value creation.
However, biotech investment carries significant risk. Clinical failures remain high across the industry. Diversification across a basket of emerging firms helps mitigate risks.
The conference provides access to executive management teams from over 50 public microcap companies in the biotech, healthcare, and medical devices sector. It represents an excellent opportunity for exposure to innovative companies shaping the future of healthcare.
Biotech Revolution
We are in the midst of a biotechnology revolution led by innovative emerging firms. New technologies like AI and genomic profiling are unlocking unprecedented insights into disease biology and enabling personalized therapeutics.
Evaxion’s focus on AI-powered cancer vaccines represents just one example of transformative innovation occurring in the biotech sector. Other areas of rapid progress include gene therapies, cell therapies, targeted oncology treatments, and more.
Driven by these technological breakthroughs, the pace of biopharmaceutical advancement today is unprecedented. Venture capital investment in U.S. biotech startups hit record levels in 2021, topping $30 billion across over 1,000 deals.
Careful selection of companies with differentiated technologies like Evaxion’s AI platform can yield exciting returns. Ongoing evaluation of clinical execution remains key, as early scientific promise must still translate to real-world efficacy.
Overall, the biotech arena offers fertile ground for investment in innovation. The upcoming Noble Capital Markets Virtual Healthcare Conference highlights the wealth of emerging firms driving the biotechnology revolution.
NAPLES, Fla., Jan. 24, 2024 (GLOBE NEWSWIRE) — Beasley Broadcast Group, Inc. (Nasdaq: BBGI) (“Beasley” or the “Company”), a multi-platform media company, announced today that it will report its 2023 fourth quarter and full year financial results before the market opens on Monday, February 12, 2024. The Company will host a conference call and webcast at 11:00 a.m. ET that morning to review the results.
To access the conference call, interested parties may dial 877-407-4018 or 201-689-8471, conference ID 13744073 (domestic and international callers). Participants can also listen to a live webcast of the call at the Company’s website at www.bbgi.com. Please allow 15 minutes to register and download and install any necessary software. Following its completion, a replay of the webcast can be accessed for five days on the Company’s website, www.bbgi.com.
Questions from analysts, institutional investors and debt holders may be e-mailed to ir@bbgi.com at any time up until 9:00 a.m. ET on February 12, 2024. Management will answer as many questions as possible during the conference call and webcast (provided the questions are not addressed in their prepared remarks).
About Beasley Broadcast Group Beasley Broadcast Group, Inc. (www.bbgi.com) was founded in 1961 by George G. Beasley and owns 59 AM and FM stations in 13 large- and mid-size markets in the United States. Beasley radio stations reach over 30 million unique consumers weekly over-the-air, online and on smartphones and tablets, and millions regularly engage with the Company’s brands and personalities through digital platforms such as Facebook, Twitter, text, apps and email. For more information, please visit www.bbgi.com.
For further information, or to receive future Beasley Broadcast Group news announcements via e-mail, please contact Beasley Broadcast Group, at 239-263-5000 or email@bbgi.com, or Joseph Jaffoni, JCIR, at 212-835-8500 or bbgi@jcir.com.
Research demonstrated that activation of the inflammasome/ASC speck pathway has a vital role in synaptic degeneration in Alzheimer’s Disease (AD).
ZyVersa is developing IC 100, a monoclonal antibody targeting inflammasome ASC specks to block initiation and perpetuation of damaging inflammation in the central nervous system and peripheral tissues.
WESTON, Fla., Jan. 24, 2024 (GLOBE NEWSWIRE) — ZyVersa Therapeutics, Inc. (Nasdaq: ZVSA or “ZyVersa”), a clinical stage specialty biopharmaceutical company developing first-in-class drugs for treatment of inflammatory and renal diseases, is pleased to announce that world renowned inflammasome researchers and inventors of ZyVersa’s Inflammasome ASC Inhibitor IC 100 have published a scientific paper in the peer-reviewed journal, Alzheimer’s & Dementia: Translational Research & Clinical Interventions.
In the paper titled, “Association of region-specific hippocampal reduction of neurogranin with inflammasome proteins in postmortem brains of Alzheimer’s disease,” the researchers demonstrated that loss of plasticity and neuronal scaffolding proteins, part of the neurodegenerative process leading to memory and learning deficits in AD, is associated with recruitment of ASC molecules and formation of inflammasome complexes in both neurons and microglia.
“Our data emphasize that the synapse may be more vulnerable when the inflammatory machinery is activated, supporting the potential role of targeting ASC specks during the progression of AD pathology,” said Dr. Regina T. Vontell, Research Assistant Professor and Associate Director, Brain Endowment Bank at the University of Miami Miller School of Medicine.
“Our earlier data demonstrated that ASC correlated with Aβ and p-tau in postmortem cases with AD pathology, and that neurons in areas of the brain that are particularly susceptible to death in the early and intermediate stages of the disease process could be identified through imaging studies with Inflammasome ASC inhibitor IC 100. This further supports the therapeutic potential of targeting ASC in patients with AD,” stated Dr. Robert W. Keane, Professor, Physiology and Biophysics, Neurological Surgery and Microbiology, and Immunology at the University of Miami Miller School of Medicine, and a member of ZyVersa’s Inflammatory Disease Scientific Advisory Board.
Stephen C. Glover, ZyVersa’s Co-founder, Chairman, CEO and President, commented, “The research published in Alzheimer’s & Dementia: Translational Research & Clinical Interventions reinforces the therapeutic potential of ZyVersa’s Inflammasome ASC Inhibitor IC 100 in neurological diseases. Preclinical studies have demonstrated reduced inflammatory activity and/or improved outcomes in multiple sclerosis, age-related inflammation, spinal cord injury, and two different models of brain injury.”
IC 100 is a novel humanized IgG4 monoclonal antibody that inhibits the inflammasome adaptor protein ASC. IC 100 was designed to attenuate both initiation and perpetuation of the inflammatory response. It does so by binding to a specific region of the ASC component of multiple types of inflammasomes, including NLRP1, NLRP2, NLRP3, NLRC4, AIM2, Pyrin. Intracellularly, IC 100 binds to ASC monomers, inhibiting inflammasome formation, thereby blocking activation of IL-1β early in the inflammatory cascade. IC 100 also binds to ASC in ASC Specks, both intracellularly and extracellularly, further blocking activation of IL-1β and the perpetuation of the inflammatory response that is pathogenic in inflammatory diseases. Because active cytokines amplify adaptive immunity through various mechanisms, IC 100, by attenuating cytokine activation, also attenuates the adaptive immune response.
About ZyVersa Therapeutics, Inc.
ZyVersa (Nasdaq: ZVSA) is a clinical stage specialty biopharmaceutical company leveraging advanced, proprietary technologies to develop first-in-class drugs for patients with renal and inflammatory diseases who have significant unmet medical needs. The Company is currently advancing a therapeutic development pipeline with multiple programs built around its two proprietary technologies – Cholesterol Efflux Mediator™ VAR 200 for treatment of kidney diseases, and Inflammasome ASC Inhibitor IC 100, targeting damaging inflammation associated with numerous CNS and other inflammatory diseases. For more information, please visit www.zyversa.com.
Certain statements contained in this press release regarding matters that are not historical facts, are forward-looking statements within the meaning of Section 21E of the Securities Exchange Act of 1934, as amended, and the Private Securities Litigation Reform Act of 1995. These include statements regarding management’s intentions, plans, beliefs, expectations, or forecasts for the future, and, therefore, you are cautioned not to place undue reliance on them. No forward-looking statement can be guaranteed, and actual results may differ materially from those projected. ZyVersa Therapeutics, Inc (“ZyVersa”) uses words such as “anticipates,” “believes,” “plans,” “expects,” “projects,” “future,” “intends,” “may,” “will,” “should,” “could,” “estimates,” “predicts,” “potential,” “continue,” “guidance,” and similar expressions to identify these forward-looking statements that are intended to be covered by the safe-harbor provisions. Such forward-looking statements are based on ZyVersa’s expectations and involve risks and uncertainties; consequently, actual results may differ materially from those expressed or implied in the statements due to a number of factors, including ZyVersa’s plans to develop and commercialize its product candidates, the timing of initiation of ZyVersa’s planned preclinical and clinical trials; the timing of the availability of data from ZyVersa’s preclinical and clinical trials; the timing of any planned investigational new drug application or new drug application; ZyVersa’s plans to research, develop, and commercialize its current and future product candidates; the clinical utility, potential benefits and market acceptance of ZyVersa’s product candidates; ZyVersa’s commercialization, marketing and manufacturing capabilities and strategy; ZyVersa’s ability to protect its intellectual property position; and ZyVersa’s estimates regarding future revenue, expenses, capital requirements and need for additional financing.
New factors emerge from time-to-time, and it is not possible for ZyVersa to predict all such factors, nor can ZyVersa assess the impact of each such factor on the business or the extent to which any factor, or combination of factors, may cause actual results to differ materially from those contained in any forward-looking statements. Forward-looking statements included in this press release are based on information available to ZyVersa as of the date of this press release. ZyVersa disclaims any obligation to update such forward-looking statements to reflect events or circumstances after the date of this press release, except as required by applicable law.
This press release does not constitute an offer to sell, or the solicitation of an offer to buy, any securities.
Corporate and IR Contact: Karen Cashmere Chief Commercial Officer kcashmere@zyversa.com 786-251-9641
Media Contacts Tiberend Strategic Advisors, Inc. Casey McDonald cmcdonald@tiberend.com 646-577-8520