Gerry Smith to Return from Temporary Medical Leave and Resume CEO Role on February 1
David Szymanski, Long-Time Member of ODP’s Board of Directors, to Retire from the Board on February 13
BOCA RATON, Fla.–(BUSINESS WIRE)–Jan. 29, 2024– The ODP Corporation (“ODP” or the “Company”) (NASDAQ:ODP), a leading provider of business services, products and digital workplace technology solutions to businesses and consumers, today announced that, following his temporary medical leave, Mr. Gerry Smith will resume his position as Chief Executive Officer (“CEO”), effective February 1, 2024. Upon Mr. Smith’s return, Mr. Joseph S. Vassalluzzo, who had been appointed by the Company’s Board of Directors to assume Mr. Smith’s authority and responsibilities during his medical leave, will return to his sole role as independent non-executive Chairman of the Board.
Mr. Smith said, “I would like to thank everyone for the support they showed during my leave, and especially to Joe for stepping in and leading the Company during my absence. I am very excited about returning to the helm, and eager to continue driving our corporate transformation and maximizing value for our stakeholders.”
In addition, Dr. David Szymanski, a member of ODP’s Board of Directors, notified the Company of his intention to retire from the Board, with his resignation effective February 13, 2024. Dr. Szymanski has served as a director of the Company and its predecessor, OfficeMax Incorporated, since 2004.
Mr. Vassalluzzo said, “On behalf of the Board and the Company, I would like to thank David for his long, dedicated service to ODP. He has been a valued member of the Board with his extensive retail experience, and as he retires from the Board, we wish him well in his future pursuits.”
Dr. Szymanski said, “It has been a pleasure for me to serve on ODP’s Board over the last decade. With the Company well positioned for future growth, and supported by an exceptional leadership team, I feel that now is the right time for me to step aside and provide others with the opportunity to participate and contribute to this great company as it moves forward.”
About The ODP Corporation
The ODP Corporation (NASDAQ:ODP) is a leading provider of products, services, and technology solutions through an integrated business-to-business (B2B) distribution platform and omni-channel presence, which includes supply chain and distribution operations, dedicated sales professionals, a B2B digital procurement solution, online presence, and a network of Office Depot and OfficeMax retail stores. Through its operating companies ODP Business Solutions, LLC; Office Depot, LLC; Veyer, LLC; and Varis, Inc, The ODP Corporation empowers every business, professional, and consumer to achieve more every day. For more information, visit theodpcorp.com.
This communication may contain forward-looking statements within the meaning of the Private Securities Litigation Reform Act of 1995. These statements or disclosures may discuss goals, intentions and expectations as to future trends, plans, events, results of operations, cash flow or financial condition, the potential impacts on our business due to the unknown severity and duration of the COVID-19 pandemic, or state other information relating to, among other things, the Company, based on current beliefs and assumptions made by, and information currently available to, management. Forward-looking statements generally will be accompanied by words such as “anticipate,” “believe,” “plan,” “could,” “estimate,” “expect,” “forecast,” “guidance,” “expectations”, “outlook,” “intend,” “may,” “possible,” “potential,” “predict,” “project,” “propose” or other similar words, phrases or expressions, or other variations of such words. These forward-looking statements are subject to various risks and uncertainties, many of which are outside of the Company’s control. There can be no assurances that the Company will realize these expectations or that these beliefs will prove correct, and therefore investors and stakeholders should not place undue reliance on such statements.
Factors that could cause actual results to differ materially from those in the forward-looking statements include, among other things, highly competitive office products market and failure to differentiate the Company from other office supply resellers or respond to decline in general office supplies sales or to shifting consumer demands; competitive pressures on the Company’s sales and pricing; the risk that the Company is unable to transform the business into a service-driven, B2B platform that such a strategy will not result in the benefits anticipated; the risk that the Company will not be able to achieve the expected benefits of its strategic plans, including its strategic shift to maintain all of its businesses under common ownership; the risk that the Company may not be able to realize the anticipated benefits of acquisitions due to unforeseen liabilities, future capital expenditures, expenses, indebtedness and the unanticipated loss of key customers or the inability to achieve expected revenues, synergies, cost savings or financial performance; the risk that the Company is unable to successfully maintain a relevant omni-channel experience for its customers; the risk that the Company is unable to execute the Maximize B2B Restructuring Plan successfully or that such plan will not result in the benefits anticipated; failure to effectively manage the Company’s real estate portfolio; loss of business with government entities, purchasing consortiums, and sole-or limited-source distribution arrangements; failure to attract and retain qualified personnel, including employees in stores, service centers, distribution centers, field and corporate offices and executive management, and the inability to keep supply of skills and resources in balance with customer demand; failure to execute effective advertising efforts and maintain the Company’s reputation and brand at a high level; disruptions in computer systems, including delivery of technology services; breach of information technology systems affecting reputation, business partner and customer relationships and operations and resulting in high costs and lost revenue; unanticipated downturns in business relationships with customers or terms with the suppliers, third-party vendors and business partners; disruption of global sourcing activities, evolving foreign trade policy (including tariffs imposed on certain foreign made goods); exclusive Office Depot branded products are subject to additional product, supply chain and legal risks; product safety and quality concerns of manufacturers’ branded products and services and Office Depot private branded products; covenants in the credit facility; general disruption in the credit markets; incurrence of significant impairment charges; retained responsibility for liabilities of acquired companies; fluctuation in quarterly operating results due to seasonality of the Company’s business; changes in tax laws in jurisdictions where the Company operates; increases in wage and benefit costs and changes in labor regulations; changes in the regulatory environment, legal compliance risks and violations of the U.S. Foreign Corrupt Practices Act and other worldwide anti-bribery laws; volatility in the Company’s common stock price; changes in or the elimination of the payment of cash dividends on Company common stock; macroeconomic conditions such as higher interest rates and future declines in business or consumer spending; increases in fuel and other commodity prices and the cost of material, energy and other production costs, or unexpected costs that cannot be recouped in product pricing; unexpected claims, charges, litigation, dispute resolutions or settlement expenses; catastrophic events, including the impact of weather events on the Company’s business; the discouragement of lawsuits by shareholders against the Company and its directors and officers as a result of the exclusive forum selection of the Court of Chancery, the federal district court for the District of Delaware or other Delaware state courts by the Company as the sole and exclusive forum for such lawsuits; and the impact of the COVID-19 pandemic on the Company’s business. The foregoing list of factors is not exhaustive. Investors and shareholders should carefully consider the foregoing factors and the other risks and uncertainties described in the Company’s Annual Reports on Form 10-K, Quarterly Reports on Form 10-Q, and Current Reports on Form 8-K filed with the U.S. Securities and Exchange Commission. The Company does not assume any obligation to update or revise any forward-looking statements.
The latest Job Openings and Labor Turnover Survey (JOLTS) report released Tuesday by the Bureau of Labor Statistics showed job openings rose to 9.02 million in December, up from a revised 8.92 million in November. This was higher than economist forecasts of 8.75 million openings.
The December JOLTS report indicates ongoing tightness in the US labor market, as job openings remain stubbornly high even as the Federal Reserve has aggressively raised interest rates over the past year to cool demand and curb inflationary pressures.
On the surface, the rise in openings appears a negative sign for monetary policy aimed at loosening the jobs market. However, the increase was small, and openings remain well below the March 2023 peak of 11.9 million. The quits rate, which measures voluntary departures and is an indicator of workers’ confidence in ability to find new jobs, also edged down to 2.1% in December, though it remains elevated historically.
This suggests the Fed’s policy actions may be having a gradual effect, but the labor market remains tight overall. Layoffs also stayed low in December, with just 1.6 million separations due to layoffs or discharges during the month. The labor force participation rate ticked up to 62.3% in December, so labor supply is expanding somewhat, though participation remains below pre-pandemic levels.
For the Fed, the report provides ammunition on both sides of the debate as to whether a pause in rate hikes is warranted or further increases are needed to achieve a soft landing. Markets see a mixed bag, with the US dollar index largely unchanged on the day and Treasury yields seeing only slight moves following the release.
Impact on Economic Outlook
The bigger picture is that while job openings are declining, they remain unusually high, indicative of continued broad demand for workers across sectors like healthcare, manufacturing, and hospitality. Businesses appear eager to hire even amidst an economic slowdown and uncertainty about the outlook.
This need for workers will support consumer spending, the primary engine of US GDP growth, as long as hiring remains robust and layoffs low. But it also means upward pressure on wages as employers compete for talent, which could fuel inflation. Herein lies the conundrum for monetary policy.
The strength of the labor market is a double-edged sword – positive for growth in the near term, but concerning for the Fed’s inflation fight if it necessitates further large wage increases.
Chair Powell has been adamant the Fed’s priority is reducing inflation, even at the risk of economic pain. With the jobs market still hot in late 2023, further rate hikes seem likely at upcoming policy meetings absent a substantial cooling in inflation or rise in unemployment.
Payroll growth could slow in 2024 from levels above 400,000 per month in 2023, but demand remains too high relative to labor supply. The Fed wants meaningful softening in job openings and wage growth, which has yet to fully materialize. Unemployment would likely need to rise to the high 3% range or beyond to reduce wage pressures.
The JOLTS report provides important context on the state of the labor market amid crosscurrents in other economic data. Manufacturing has slowed and housing has declined, but consumers keep spending and job switching remains high. The Fed is unlikely to declare victory or shift to rate cuts with this conflicting mix of weak and resilient activity.
The path for monetary policy and markets will depend on which direction the trends in openings, wages, inflation and jobs growth tilt in coming months. For now, the JOLTS report gives the sense of an economy and labor market that are cooling gradually under the weight of higher rates rather than slowing precipitously.
David Garrison named permanent Chief Financial Officer David Fisher Named Chief Transformation Officer
Harte Hanks, Inc. (NASDAQ: HHS), a leading global customer experience company focused on bringing companies closer to customers for 100 years, today announced that David Garrison, an experienced finance executive with more than 20 years of public company CFO experience currently serving as Interim Chief Financial Officer, has been named as Harte Hanks’ permanent Chief Financial Officer effective January 29, 2024. In addition, David Fisher, an accomplished executive with over 25 years of experience focused on strategic initiatives, cost structure transformation, financial planning and analysis, has been named Chief Transformation Officer.
Garrison, who joined Harte Hanks in an interim capacity in October, 2023, brings notable expertise in cost containment, streamlining operations, and ERP implementations. He joins Harte Hanks from Digital Lumens Incorporated, an IoT lighting fixture and factory automation technology company that was spun out of Osram Sylvania, where he served as CFO for the last two years. As part of this role, he was instrumental in selling a product line to a strategic buyer and selling the remaining operating entity to a foreign company. Previously, he spent three years as Chief Financial Officer for Sensera, Inc., an Australian listed medical and IoT technology company, where he played an important role in turning around operations to facilitate a sale. Previously, he served as Managing Director of IW Ventures LLC, a financial consultant, and TTcogen LLC, a joint venture between Tecogen Inc. and Tedom a.s. From 2014 to 2017, Garrison served as CFO of Tecogen Inc., a NASDAQ-listed company that designs, manufactures and sells industrial and commercial cogeneration systems, where he supported growth with cost controls to drive margin expansion and profitability. He has an MBA from Boston University and has led several Greater Boston-based companies through successful growth-driven integrations, transactions, and implementations.
Fisher has been consulting for Harte Hanks since March of 2023, most recently leading the Company’s engagement with the Kearney organization. He will now lead the execution of Project Elevate, Harte Hanks’ transformation and modernization initiative. He brings expertise in strategic initiatives, cost transformation, financial planning & analysis, accounting, strategic sourcing, procurement and risk management. He joined Harte Hanks from Tribune Publishing, where he served as Senior Vice President and Chief Procurement Officer. Previously, he was SVP of Corporate Finance & Planning, and VP of Corporate Development at Tribune. Before that, he served as SVP of Finance for Source Interlink, and was an Assurance Manager for BDO USA, LLP. He has a Bachelor’s Degree in accounting/business management from the Wisconsin School of Business and is a Certified Public Accountant (CPA).
“We continue to enhance our senior leadership team with modern skillsets to advance our ‘Project Elevate’ initiative. We are well underway on an end-to-end transformation of our business,” said Kirk Davis, Chief Executive Officer . “David Garrison has proven his value in a short period of time, advancing our ERP and cost containment efforts while advancing digital initiatives to streamline processes and modernize our business.
“David Fisher and I have enjoyed prior success in working with the Kearney organization. We have accelerated our transformation commitment and see compelling growth and optimization opportunities ahead as we execute our plan. I’m heartened by our entire senior team’s commitment to becoming a more profitable and growth-focused organization. These two appointments, in conjunction with the recent appointment of Kelly Waller as our new SVP, Sales and Marketing, and other senior team members, have us well positioned for 2024.”
About Harte Hanks:
Harte Hanks (NASDAQ: HHS ) is a leading global customer experience company whose mission is to partner with clients to provide them with CX strategy, data-driven analytics and actionable insights combined with seamless program execution to better understand, attract and engage their customers.
Using its unparalleled resources and award-winning talent in the areas of Customer Care, Fulfillment and Logistics, and Marketing Services, Harte Hanks has a proven track record of driving results for some of the world’s premier brands, including Bank of America, GlaxoSmithKline, Unilever, Pfizer, HBOMax, Volvo, Ford, FedEx, Midea, Sony and IBM among others. Headquartered in Chelmsford, Massachusetts, Harte Hanks has over 2,500 employees in offices across the Americas, Europe, and Asia Pacific.
As used herein, “Harte Hanks” or “the Company” refers to Harte Hanks, Inc. and/or its applicable operating subsidiaries, as the context may require. Harte Hanks’ logo and name are trademarks of Harte Hanks.
Our press release and related earnings conference call contain “forward-looking statements” within the meaning of U.S. federal securities laws. All such statements are qualified by this cautionary note, provided pursuant to the safe harbor provisions of Section 27A of the Securities Act of 1933 and Section 21E of the Securities Exchange Act of 1934. Statements other than historical facts are forward-looking and may be identified by words such as “may,” “will,” “expects,” “believes,” “anticipates,” “plans,” “estimates,” “seeks,” “could,” “intends,” or words of similar meaning. These forward-looking statements are based on current information, expectations and estimates and involve risks, uncertainties, assumptions and other factors that are difficult to predict and that could cause actual results to vary materially from what is expressed in or indicated by the forward-looking statements. In that event, our business, financial condition, results of operations or liquidity could be materially adversely affected and investors in our securities could lose part or all of their investments. These risks, uncertainties, assumptions and other factors include: (a) local, national and international economic and business conditions, including (i) the outbreak of diseases, such as the COVID-19 coronavirus, which has curtailed travel to and from certain countries and geographic regions, created supply chain disruption and shortages, disrupted business operations and reduced consumer spending, (ii) market conditions that may adversely impact marketing expenditures, (iii) the impact of the Russia/Ukraine conflict on the global economy and our business, including impacts from related sanctions and export controls and (iv) the impact of economic environments and competitive pressures on the financial condition, marketing expenditures and activities of our clients and prospects; (b) the demand for our products and services by clients and prospective clients, including (i) the willingness of existing clients to maintain or increase their spending on products and services that are or remain profitable for us, and (ii) our ability to predict changes in client needs and preferences; (c) economic and other business factors that impact the industry verticals we serve, including competition and consolidation of current and prospective clients, vendors and partners in these verticals; (d) our ability to manage and timely adjust our facilities, capacity, workforce and cost structure to effectively serve our clients; (e) our ability to improve our processes and to provide new products and services in a timely and cost-effective manner though development, license, partnership or acquisition; (f) our ability to protect our facilities against security breaches and other interruptions and to protect sensitive personal information of our clients and their customers; (g) our ability to respond to increasing concern, regulation and legal action over consumer privacy issues, including changing requirements for collection, processing and use of information; (h) the impact of privacy and other regulations, including restrictions on unsolicited marketing communications and other consumer protection laws; (i) fluctuations in fuel prices, paper prices, postal rates and postal delivery schedules; (j) the number of shares, if any, that we may repurchase in connection with our repurchase program; (k) unanticipated developments regarding litigation or other contingent liabilities; (l) our ability to complete anticipated divestitures and reorganizations, including cost-saving initiatives; (m) our ability to realize the expected tax refunds; and (n) other factors discussed from time to time in our filings with the Securities and Exchange Commission, including under “Item 1A. Risk Factors” in our Annual Report on Form 10-K for the year ended December 31, 2022 which was filed on March 31, 2023. The forward-looking statements in this press release and our related earnings conference call are made only as of the date hereof, and we undertake no obligation to update publicly any forward-looking statement, even if new information becomes available or other events occur in the future.
Snail is a leading, global independent developer and publisher of interactive digital entertainment for consumers around the world, with a premier portfolio of premium games designed for use on a variety of platforms, including consoles, PCs and mobile devices.
Michael Kupinski, Director of Research, Equity Research Analyst, Digital, Media & Technology , Noble Capital Markets, Inc.
Jacob Mutchler, Research Associate, Noble Capital Markets, Inc.
Refer to the full report for the price target, fundamental analysis, and rating.
Tweaking Q4 estimates. We are lowering our Q4 revenue forecast from $38 million to $31.6 million, reflecting deferred revenue that will be recognized in 2024.Despite the deferred revenue, we are conservatively maintaining our 2024 revenue forecast.
Engaged userbase. The company held the ARKade Ambassador program, an influencer initiative, from October 25 through year end. The initiative coincided with the release of Ark: Survival Ascended on Steam and drove significant viewer engagement. In total, the ARKade content received viewership of 186,509,155 minutes.
Equity Research is available at no cost to Registered users of Channelchek. Not a Member? Click ‘Join’ to join the Channelchek Community. There is no cost to register, and we never collect credit card information.
This Company Sponsored Research is provided by Noble Capital Markets, Inc., a FINRA and S.E.C. registered broker-dealer (B/D).
*Analyst certification and important disclosures included in the full report. NOTE: investment decisions should not be based upon the content of this research summary. Proper due diligence is required before making any investment decision.
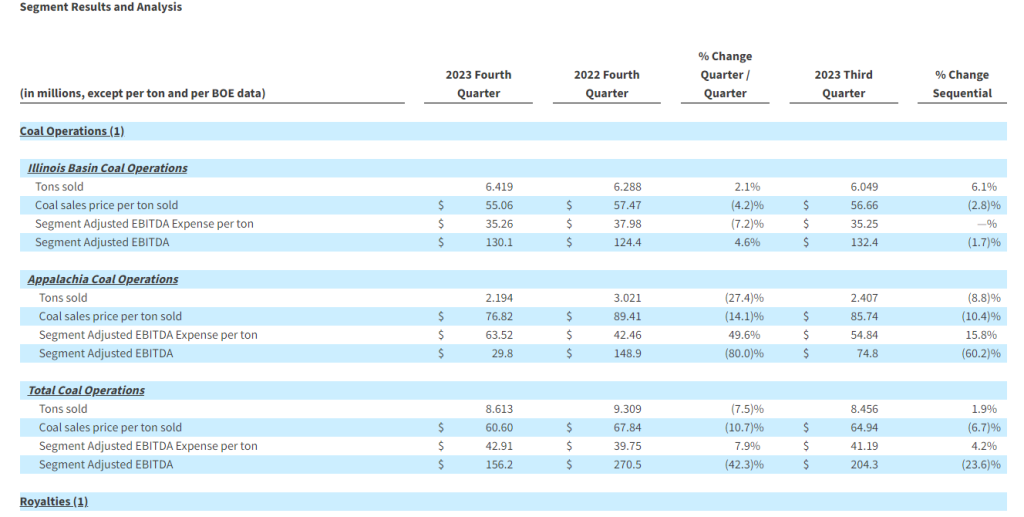
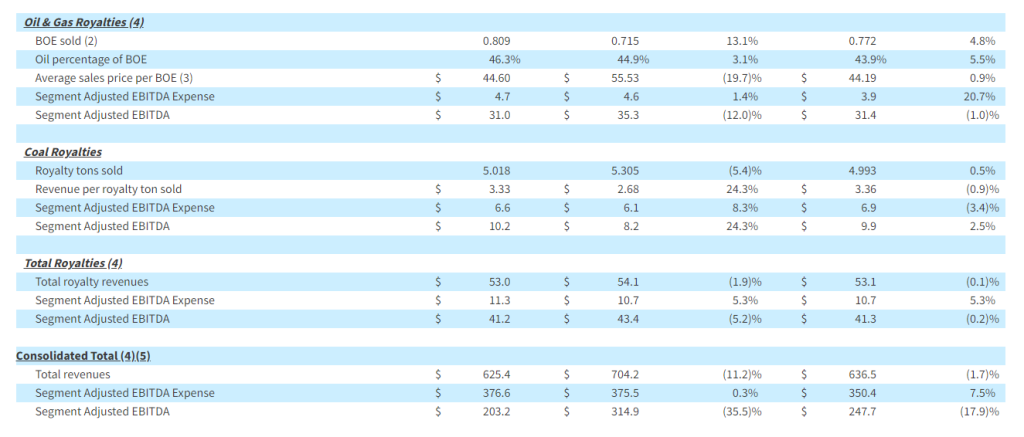
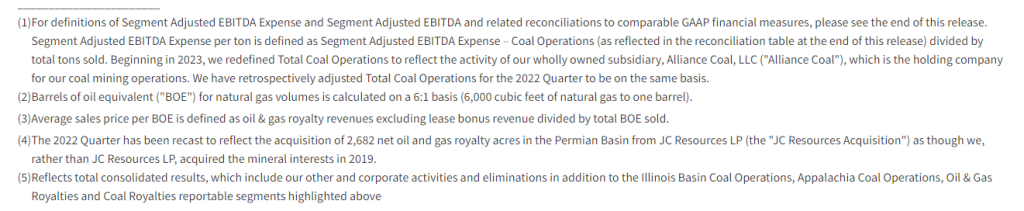
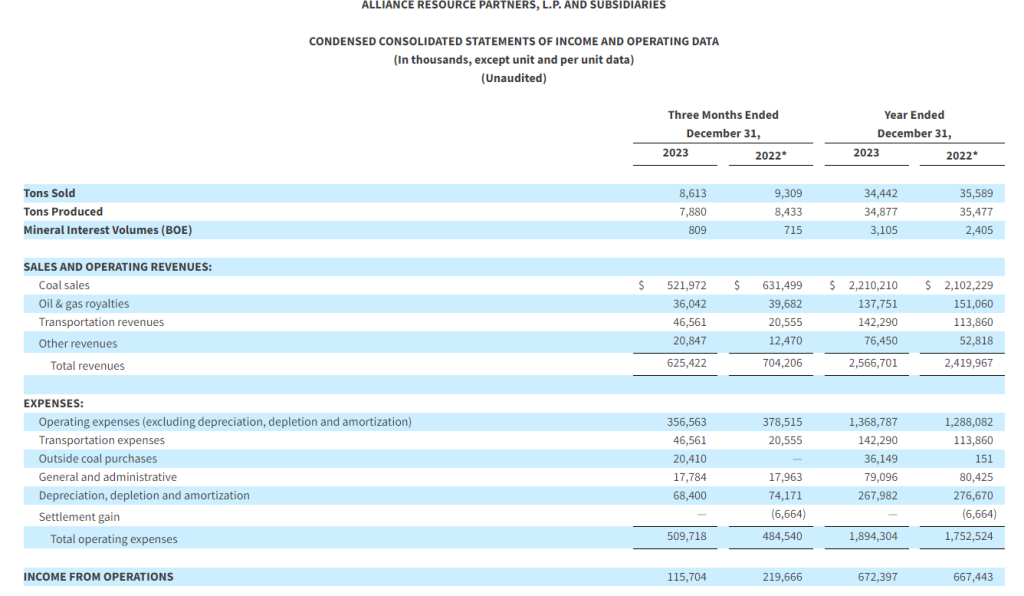
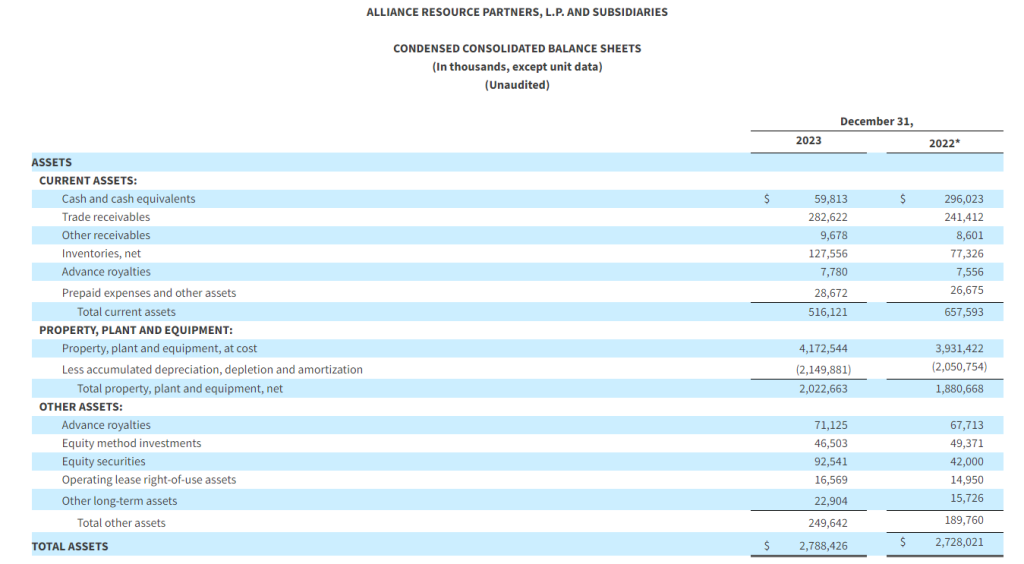
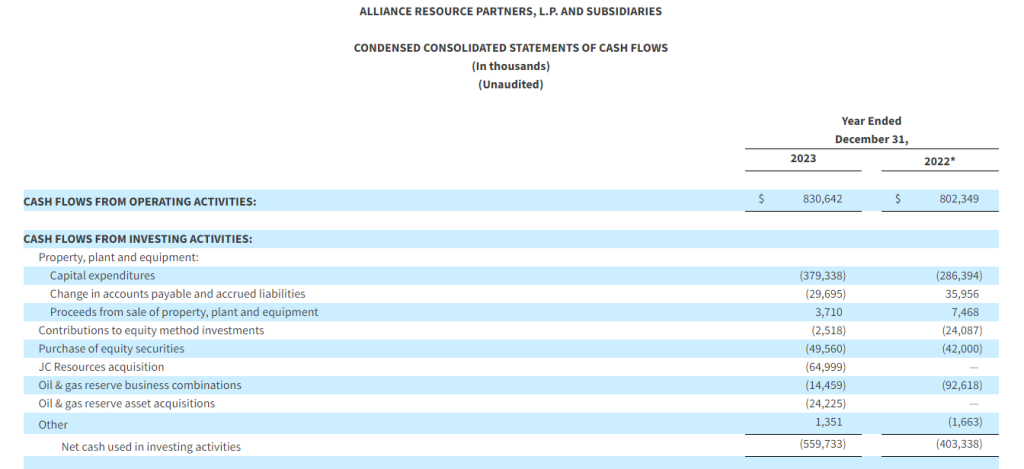
ARLP is a diversified natural resource company that generates operating and royalty income from coal produced by its mining complexes and royalty income from mineral interests it owns in strategic oil & gas producing regions in the United States, primarily the Permian, Anadarko and Williston basins. ARLP currently produces coal from seven mining complexes its subsidiaries operate in Illinois, Indiana, Kentucky, Maryland and West Virginia. ARLP also operates a coal loading terminal on the Ohio River at Mount Vernon, Indiana. ARLP markets its coal production to major domestic and international utilities and industrial users and is currently the second largest coal producer in the eastern United States. In addition, ARLP is positioning itself as an energy provider for the future by leveraging its core technology and operating competencies to make strategic investments in the fast growing energy and infrastructure transition.
Mark Reichman, Managing Director, Equity Research Analyst, Natural Resources, Noble Capital Markets, Inc.
Refer to the full report for the price target, fundamental analysis, and rating.
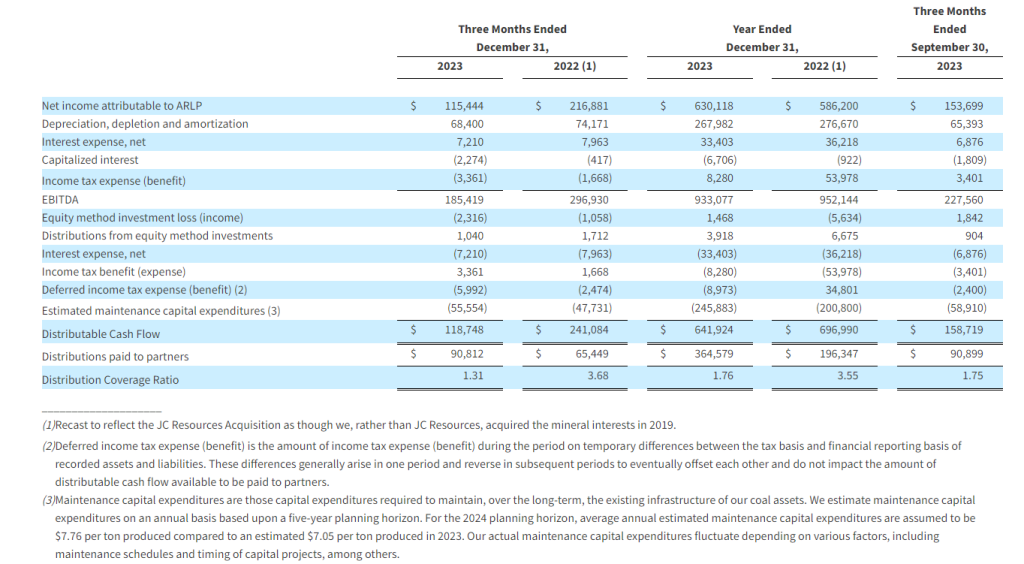
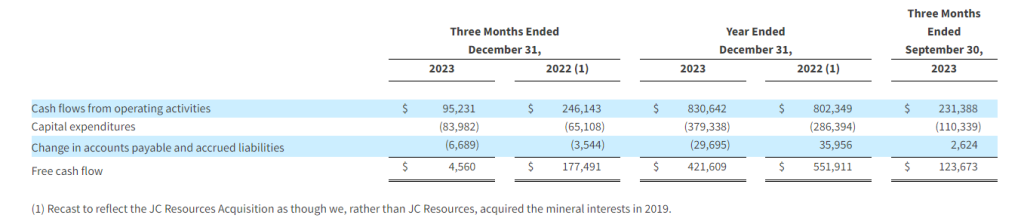
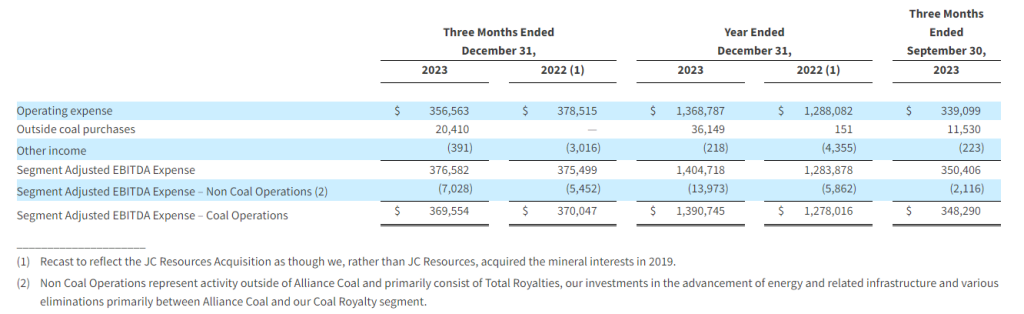
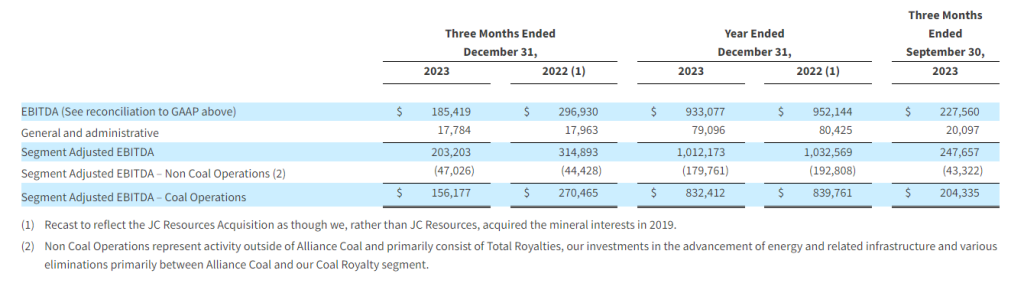
Fourth quarter and full year 2023 financial results. Alliance reported fourth-quarter EBITDA and earnings per unit (EPU) of $185.4 million and $0.88, respectively, compared to $296.9 million and $1.63 during the prior year period. We had forecast EBITDA and EPU of $226.6 million and $1.02. On a full year basis, Alliance generated EBITDA and EPU of $933.1 million and $4.81, respectively, compared to our estimates of $969.9 million and $4.95. Fourth quarter results were negatively impacted by lower Appalachia coal volumes due to reduced recoveries, fewer operating units at MC Mining, and challenging conditions that delayed development of a new longwall district at Alliance’s Mettiki operation. Operating expenses increased $20.4 million due to outside coal purchases and accounted for a portion of the variance to our earnings estimate.
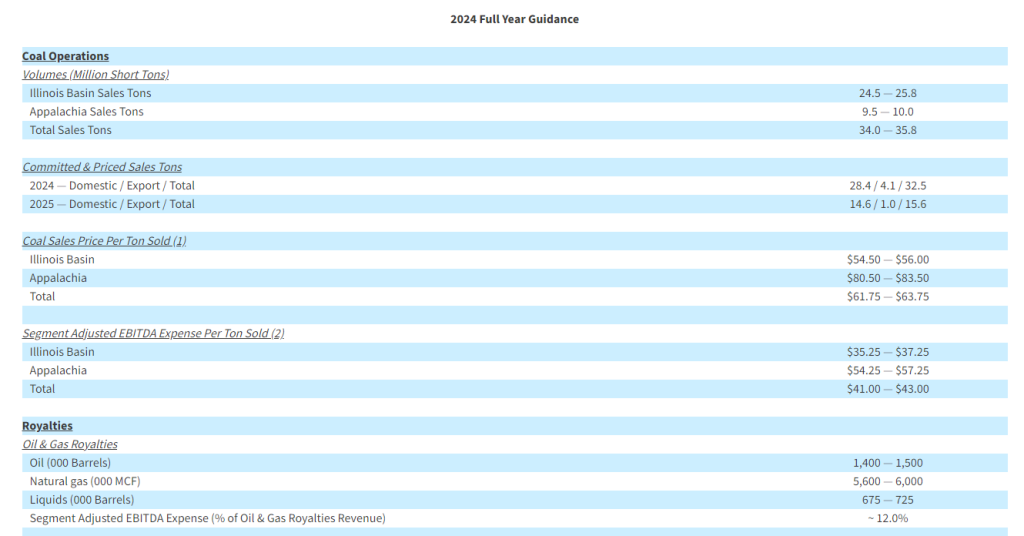
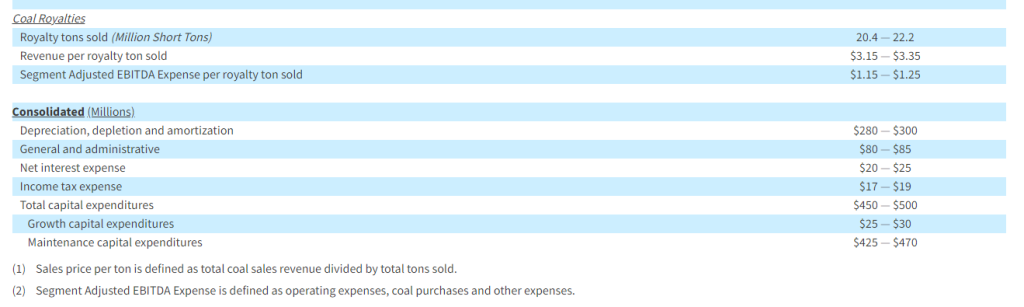
Management guidance for 2024. Total coal sales are expected to be in the range of 34.0 million to 35.8 million tons, while the coal sales price per ton is expected to be in the range of $61.75 to $63.75. Segmented adjusted EBITDA expense per ton sold is expected to be $41.00 to $43.00. The company has committed and priced over 90% of 2024 expected coal sales volumes, or 32.5 million tons of which 4.1 million tons will be sold in the export market.
Equity Research is available at no cost to Registered users of Channelchek. Not a Member? Click ‘Join’ to join the Channelchek Community. There is no cost to register, and we never collect credit card information.
This Company Sponsored Research is provided by Noble Capital Markets, Inc., a FINRA and S.E.C. registered broker-dealer (B/D).
*Analyst certification and important disclosures included in the full report. NOTE: investment decisions should not be based upon the content of this research summary. Proper due diligence is required before making any investment decision.
CALGARY, AB, Jan. 29, 2024 /CNW/ – InPlay Oil Corp. (TSX: IPO) (OTCQX: IPOOF) (“InPlay” or the “Company”) is pleased to announce that its Board of Directors have approved a capital program of $64 – $67 million for 2024.
2024 Capital Program Highlights
InPlay’s 2024 exploration and development capital program of $64 – $67 million is forecast to deliver the following(5):
Annual average production of 9,000 – 9,500 boe/d (59% – 61% light crude oil and NGLs);
Drilling program focused on high return oil weighted locations driving annual oil production growth at the midpoint of guidance of 7% over 2023;
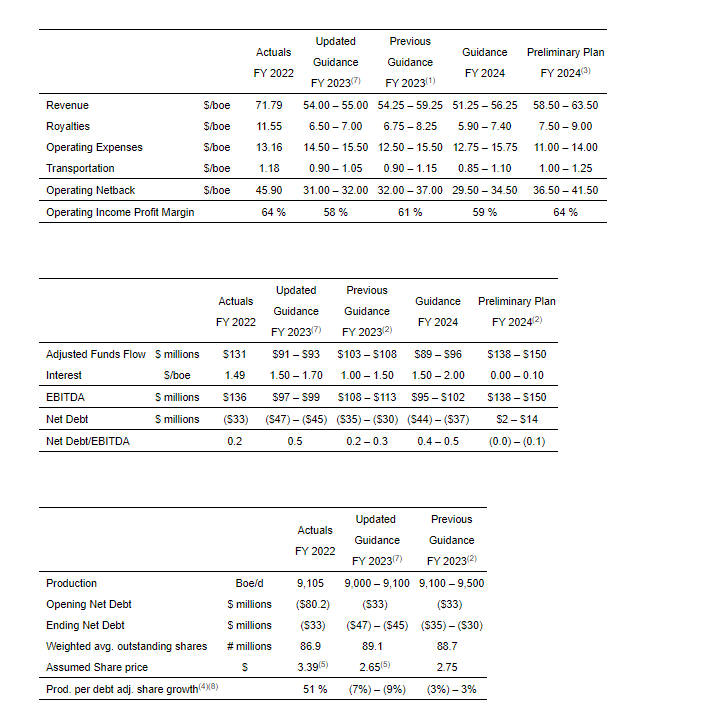
Operating income profit margin(2) of approximately 59%;
Reduction in capital spending of 20% – 25% compared to 2023 including reduced facilities and infrastructure spending by over 50% providing strong capital efficiencies;
Adjusted Funds Flow (“AFF”)(4) of $89 – $96 million;
Free Adjusted Funds Flow (“FAFF”)(2) of $22 – $32 million;
Net debt(4) of $37 – $44 million with a net debt to EBITDA ratio(2) of 0.4 – 0.5 times which is among the lower leverage ratios amongst our peers;
Base dividend of $16 – $17 million at the current monthly dividend rate of $0.015/share ($0.18/share annualized) which represents approximately an 8% yield at the current share price; and
Significant unutilized financial liquidity which can be used to pursue potential tactical capital investments.
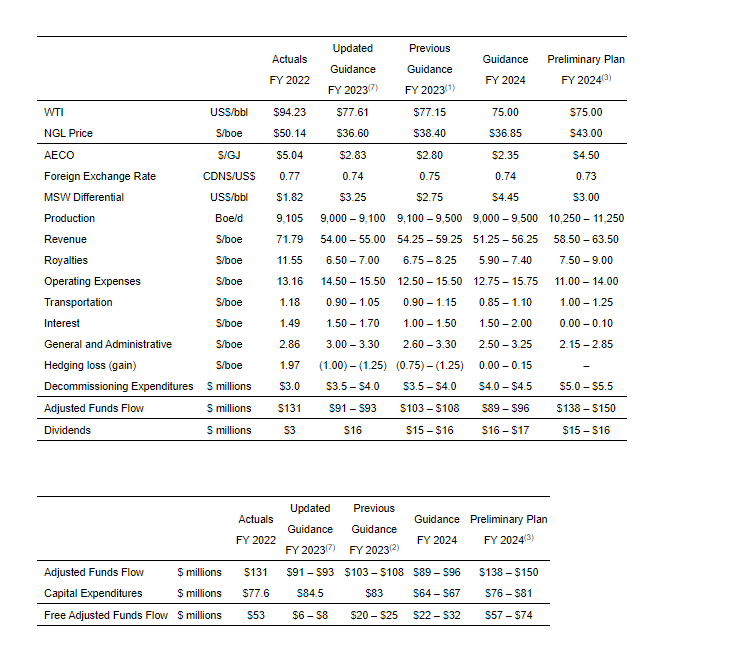
The table below highlights our 2024 guidance:
2024(5)
WTI (US$/bbl)
75.00
Production (boe/d) (1)
9,000 – 9,500
Capital ($ millions)
64 – 67
Net wells
14.0 – 15.0
AFF ($ millions) (4)
89 – 96
FAFF ($ millions) (2)
22 – 32
Net Debt at Year-end ($ millions) (4)
(44) – (37)
Annual Net Debt / EBITDA (2)
0.4 – 0.5
Dividend ($ millions)
16 – 17
The amounts above do not include potential future purchases through the Company’s normal course issuer bid (“NCIB”).
With continued commodity price volatility, specifically weak natural gas fundamentals, and current low investor sentiment, InPlay has taken a measured and disciplined approach to capital allocation for 2024, seeking to maximize capital efficiencies, AFF(2), and FAFF(2) supporting strong returns to shareholders with a priority on maintaining our pristine balance sheet. Despite a 20% to 25% reduction in capital spending year over year, InPlay is forecasting to deliver approximately 7% growth in our oil volumes as we focus on higher oil weighted assets that deliver greater returns. The capital program is designed to responsibly manage the pace of development, maintain flexibility and remain focused on delivering return of capital to shareholders.
Given the higher rate of return of InPlay’s oil weighted properties, the Company plans to direct its 2024 capital budget towards oil weighted drilling in the Cardium and Belly River. Plans are to drill approximately 11 – 12 net Extended Reach Horizontal (“ERH”) Cardium wells in Willesden Green and Pembina. Also, 3.0 net wells are planned in the Belly River taking advantage of the very high oil weighting of approximately 90%. These Belly River wells exhibit increasing oil rates over the first three quarters of production and a low decline rate thereafter. Our two most recent horizontal wells drilled in the Belly River, which came online in November 2022, have delivered operating netbacks of approximately $71.25/boe since being brought on production. Our higher oil weighted locations are characterized by strong light oil rates with lower total boe/d rate relative to wells with higher natural gas weightings. The Company’s 2024 drilling program plans on drilling fewer wells in 2024 compared to 2023, as a result of our cautious, disciplined capital approach for the year and is structured to take advantage of improving differentials starting in the second quarter of 2024 and throughout the balance of the year. Facility capital in 2024 is forecasted to be approximately $6.4 million less than 2023 due to the reduced drilling program and significant capital spent on two major natural gas plant upgrades completed in 2023.
InPlay’s first quarter of 2024 drilling program consists of five (4.9 net) ERH Cardium wells and three (0.7 net) non-operated ERH Cardium wells. Drilling has started on a two well (1.9 net) pad in Willesden Green which is expected to come on production in February. Capital activity will then move to Pembina to drill three (3.0 net) Cardium ERH wells. These wells will offset our five successful wells drilled in 2023 characterized by low decline rates and high light oil and liquids weighting with average initial production (“IP”) rates of 257 boe/d (89% light crude oil and liquids), 265 boe/d (86% light crude oil and liquids) and 239 boe/d (82% light crude oil and liquids) over their first 30, 60 and 180 days respectively.
InPlay made significant investments in 2023 to increase operated natural gas takeaway capacity for future growth in Willesden Green and to mitigate potential production issues arising from third party outage and capacity constraints. These projects have already shown their value by reducing back pressure on wells, lowering declines and providing more consistent runtimes while improving our liquids weighting with a higher natural gas liquids recovery. To further enhance our natural gas takeaway capabilities, InPlay has entered into a long term Gas Handling Agreement with an industry partner guaranteeing access to natural gas takeaway and processing capacity in the Company’s Pembina area where we were initially curtailed by approximately 6 mmcfd and associated oil and liquids starting on February 15, 2023 with the gradual reduction in curtailments and the full resumption of production in September 2023. This contract will allow InPlay to restart with certainty of capacity the development of this prolific and strong rate of return growth area where drilling activity has not occurred since the spring of 2022. InPlay plans on drilling a three (3.0 net) ERH Cardium well pad in this area in the third quarter of 2024. The Company projects fewer operated and non-operated turnarounds and other infrastructure issues during 2024 after an unprecedented high level of disruptions in 2023.
To mitigate risk and add stability during periods of market volatility, commodity hedges have been secured through 2024 and into 2025 as summarized below.
Q1/24
Q2/24
Q3/24
Q4/24
Q1/25
Natural Gas AECO Swap (mcf/d)
–
1,900
1,900
640
–
Hedged price ($AECO/mcf)
–
2.00
2.00
2.00
–
Natural Gas AECO Costless Collar (mcf/d)
4,870
3,790
3,790
5,050
3,790
Hedged price ($AECO/mcf)
2.48 – 3.82
2.08 – 2.77
2.08 – 2.77
2.27 – 3.04
2.48 – 3.46
Crude Oil Costless Collar (bbl/d)
–
1,000
–
–
–
Hedged price ($USD WTI/bbl)
–
72.00 – 80.25
–
–
–
Crude Oil Costless Collar (bbl/d)
330
–
–
–
–
Hedged price ($CAD WTI/bbl)
95.00 – 110.00
–
–
–
–
Crude Oil WTI Three-way Collar (bbl/d) (7)
–
–
1,000
1,000
–
Low sold put price ($USD WTI/bbl)
–
–
64.00
64.00
–
Mid bought put price ($USD WTI/bbl)
–
–
74.00
74.00
–
High sold call price ($USD WTI/bbl)
–
–
82.48
82.48
–
InPlay will continue to prudently allocate capital resources and adjust its capital plans in consideration of commodity prices, inflationary cost pressures and other aspects impacting our business. Should commodity prices improve and stabilize, InPlay will remain disciplined and flexible and can quickly adjust capital activity to respond to changing market conditions.
2023 Update
InPlay’s fourth quarter capital program consisted of drilling two (1.6 net) ERH wells in Willesden Green that were brought on production in November. Also, the company drilled its first (1.0 net) multilateral Belly River horizontal well which was brought on production in December. The well has been on production for approximately one month and is still in its initial stages of cleanup and early production results are meeting our internal expectations with oil cuts increasing, consistent with offsetting wells.
The increase in North American natural gas production coupled with a warm start to winter has natural gas storage inventories at very high levels resulting in weaker than expected natural gas prices during the fourth quarter that continued into 2024. Crude oil differentials began to weaken in November and widened throughout the quarter which impacted realized oil pricing during this period. Higher differentials are extending into the first quarter of 2024 but forward indices show them improving and narrowing starting in the second quarter of 2024 and throughout the remainder of the year.
Annual average production for 2023 is forecast to be approximately 9,050 boe/d(1) (58% light crude oil & NGLs) which was impacted by approximately 650 boe/d over the year due to extraordinary curtailments experienced from third party capacity constraints and turnarounds, Alberta wildfires, and from delays in starting up our natural gas facility in the third quarter as discussed in our prior press releases.
The table below highlights our updated forecasted 2023 guidance:
2023(3)
WTI (US$/bbl)
77.61
Production (boe/d) (1)
9,000 – 9,100
Capital ($ millions)
84.5
Net wells
17.1
AFF ($ millions) (4)
91 – 93
FAFF ($ millions) (2)
6 – 8
Net Debt at Year-end ($ millions) (4)
(45) – (47)
Dividend ($ millions)
16
See Reader Advisories for previous guidance and underlying assumptions.
As commented on above, continued commodity price volatility and current weak industry sentiment has resulted in the Company taking a conservative, disciplined approach to capital allocation in 2024. Preliminary estimates and plans for 2025 and beyond will be dependent on the stability of commodity prices and industry sentiment balancing manageable growth and ensuring the long term sustainability of our return of capital to shareholder strategy. As a result, the Company withdraws its preliminary estimates and plans for 2025.
We look forward to the profitable development of our high rate of return asset base and continuing to provide strong returns to shareholders through 2024 and beyond. On behalf of our employees, management team and Board of Directors, we would like to thank our shareholders for their support.
For further information please contact:
Doug Bartole President and Chief Executive Officer InPlay Oil Corp. Telephone: (587) 955-0632
See “Reader Advisories – Production Breakdown by Product Type”
2.
Non-GAAP financial measure or ratio that does not have a standardized meaning under International Financial Reporting Standards (IFRS) and GAAP and therefore may not be comparable with the calculations of similar measures for other companies. Please refer to “Non-GAAP and Other Financial Measures” contained within this press release.
3.
Based on estimated, unaudited year-end 2023 results. See “Reader Advisories – Forward Looking Information and Statements” for underlying assumptions related to our estimated, unaudited year-end 2023 results.
4.
Capital management measure. See “Non-GAAP and Other Financial Measures” contained within this press release.
5.
See “Reader Advisories – Forward Looking Information and Statements” for key budget and underlying assumptions related to our 2024 capital program and associated guidance.
6.
Supplementary financial measure. See “Non-GAAP and Other Financial Measures” contained within this press release.
7.
The WTI three-way collars are a combination high priced sold call, low priced sold put and a mid-priced bought put. The high sold call price is the maximum price the Company will receive for the contract volumes. The mid bought put price is the minimum price InPlay will receive, unless the market price falls below the low sold put strike price, in which case InPlay receives market price plus the difference between the mid bought put price minus the low sold put price.
Reader Advisories
Non-GAAP and Other Financial Measures
Throughout this press release and other materials disclosed by the Company, InPlay uses certain measures to analyze financial performance, financial position and cash flow. These non-GAAP and other financial measures do not have any standardized meaning prescribed under GAAP and therefore may not be comparable to similar measures presented by other entities. The non-GAAP and other financial measures should not be considered alternatives to, or more meaningful than, financial measures that are determined in accordance with GAAP as indicators of the Company performance. Management believes that the presentation of these non-GAAP and other financial measures provides useful information to shareholders and investors in understanding and evaluating the Company’s ongoing operating performance, and the measures provide increased transparency and the ability to better analyze InPlay’s business performance against prior periods on a comparable basis.
Non-GAAP Financial Measures and Ratios
Included in this document are references to the terms “free adjusted funds flow”, “operating income”, “operating netback per boe”, “operating income profit margin”, “Net Debt to EBITDA”, “Production per debt adjusted share” and “EV / DAAFF”. Management believes these measures and ratios are helpful supplementary measures of financial and operating performance and provide users with similar, but potentially not comparable, information that is commonly used by other oil and natural gas companies. These terms do not have any standardized meaning prescribed by GAAP and should not be considered an alternative to, or more meaningful than “profit (loss) before taxes”, “profit (loss) and comprehensive income (loss)”, “adjusted funds flow”, “capital expenditures”, “corporate acquisitions, net of cash acquired”, “net debt”, “weighted average number of common shares (basic)” or assets and liabilities as determined in accordance with GAAP as a measure of the Company’s performance and financial position.
Free Adjusted Funds Flow
Management considers FAFF an important measure to identify the Company’s ability to improve its financial condition through debt repayment and its ability to provide returns to shareholders. FAFF should not be considered as an alternative to or more meaningful than AFF as determined in accordance with GAAP as an indicator of the Company’s performance. FAFF is calculated by the Company as AFF less exploration and development capital expenditures and property dispositions (acquisitions) and is a measure of the cashflow remaining after capital expenditures before corporate acquisitions that can be used for additional capital activity, corporate acquisitions, repayment of debt or decommissioning expenditures or potentially return of capital to shareholders. Refer to the “Forward Looking Information and Statements” section for a calculation of forecast FAFF.
Operating Income/Operating Netback per boe/Operating Income Profit Margin
InPlay uses “operating income”, “operating netback per boe” and “operating income profit margin” as key performance indicators. Operating income is calculated by the Company as oil and natural gas sales less royalties, operating expenses and transportation expenses and is a measure of the profitability of operations before administrative, share-based compensation, financing and other non-cash items. Management considers operating income an important measure to evaluate its operational performance as it demonstrates its field level profitability. Operating income should not be considered as an alternative to or more meaningful than net income as determined in accordance with GAAP as an indicator of the Company’s performance. Operating netback per boe is calculated by the Company as operating income divided by average production for the respective period. Management considers operating netback per boe an important measure to evaluate its operational performance as it demonstrates its field level profitability per unit of production. Operating income profit margin is calculated by the Company as operating income as a percentage of oil and natural gas sales. Management considers operating income profit margin an important measure to evaluate its operational performance as it demonstrates how efficiently the Company generates field level profits from its sales revenue. Refer to the “Forward Looking Information and Statements” section for a calculation of operating income, operating netback per boe and operating income profit margin.
Net Debt to EBITDA
Management considers Net Debt to EBITDA an important measure as it is a key metric to identify the Company’s ability to fund financing expenses, net debt reductions and other obligations. EBITDA is calculated by the Company as adjusted funds flow before interest expense. When this measure is presented quarterly, EBITDA is annualized by multiplying by four. When this measure is presented on a trailing twelve month basis, EBITDA for the twelve months preceding the net debt date is used in the calculation. This measure is consistent with the EBITDA formula prescribed under the Company’s Senior Credit Facility. Net Debt to EBITDA is calculated as Net Debt divided by EBITDA. Refer to the “Forward Looking Information and Statements” section for a calculation of forecast Net Debt to EBITDA.
Production per Debt Adjusted Share
InPlay uses “Production per debt adjusted share” as a key performance indicator. Debt adjusted shares should not be considered as an alternative to or more meaningful than common shares as determined in accordance with GAAP as an indicator of the Company’s performance. Debt adjusted shares is a non-GAAP measure used in the calculation of Production per debt adjusted share and is calculated by the Company as common shares outstanding plus the change in net debt divided by the Company’s current trading price on the TSX, converting net debt to equity. Debt adjusted shares should not be considered as an alternative to or more meaningful than weighted average number of common shares (basic) as determined in accordance with GAAP as an indicator of the Company’s performance. Management considers Debt adjusted share to be a key performance indicator as it adjusts for the effects of capital structure in relation to the Company’s peers. Production per debt adjusted share is calculated by the Company as production divided by debt adjusted shares. Management considers Production per debt adjusted share is a key performance indicator as it adjusts for the effects of changes in annual production in relation to the Company’s capital structure. Refer to the “Forward Looking Information and Statements” section for a calculation of forecast Production per debt adjusted share.
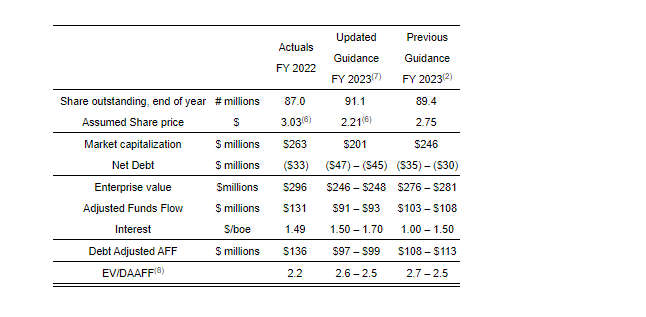
EV / DAAFF
InPlay uses “enterprise value to debt adjusted AFF” or “EV/DAAFF” as a key performance indicator. EV/DAAFF is calculated by the Company as enterprise value divided by debt adjusted AFF for the relevant period. Debt adjusted AFF (“DAAFF”) is calculated by the Company as adjusted funds flow plus financing costs. Enterprise value is a capital management measure that is used in the calculation of EV/DAAFF. Enterprise value is calculated as the Company’s market capitalization plus net debt. Management considers enterprise value a key performance indicator as it identifies the total capital structure of the Company. Management considers EV/DAAFF a key performance indicator as it is a key metric used to evaluate the sustainability of the Company relative to other companies while incorporating the impact of differing capital structures. Refer to the “Forward Looking Information and Statements” section for a calculation of forecast EV/DAAFF.
Capital Management Measures
Adjusted Funds Flow
Management considers adjusted funds flow to be an important measure of InPlay’s ability to generate the funds necessary to finance capital expenditures. Adjusted funds flow is a GAAP measure and is disclosed in the notes to the Company’s financial statements for the year ending December 31, 2022 and the most recently filed quarterly financial statements. All references to adjusted funds flow throughout this document are calculated as funds flow adjusting for decommissioning expenditures and transaction and integration costs. Decommissioning expenditures are adjusted from funds flow as they are incurred on a discretionary and irregular basis and are primarily incurred on previous operating assets. Transaction costs are non-recurring costs for the purposes of an acquisition, making the exclusion of these items relevant in Management’s view to the reader in the evaluation of InPlay’s operating performance. The Company also presents adjusted funds flow per share whereby per share amounts are calculated using weighted average shares outstanding consistent with the calculation of profit per common share.
Net Debt
Net debt is a GAAP measure and is disclosed in the notes to the Company’s financial statements for the year ending December 31, 2022 and the most recently filed quarterly financial statements. The Company closely monitors its capital structure with the goal of maintaining a strong balance sheet to fund the future growth of the Company. The Company monitors net debt as part of its capital structure. The Company uses net debt (bank debt plus accounts payable and accrued liabilities less accounts receivables and accrued receivables, prepaid expenses and deposits and inventory) as an alternative measure of outstanding debt. Management considers net debt an important measure to assist in assessing the liquidity of the Company.
Supplementary Measures
“Average realized crude oil price” is comprised of crude oil commodity sales from production, as determined in accordance with IFRS, divided by the Company’s crude oil production. Average prices are before deduction of transportation costs and do not include gains and losses on financial instruments.
“Average realized NGL price” is comprised of NGL commodity sales from production, as determined in accordance with IFRS, divided by the Company’s NGL production. Average prices are before deduction of transportation costs and do not include gains and losses on financial instruments.
“Average realized natural gas price” is comprised of natural gas commodity sales from production, as determined in accordance with IFRS, divided by the Company’s natural gas production. Average prices are before deduction of transportation costs and do not include gains and losses on financial instruments.
“Average realized commodity price” is comprised of commodity sales from production, as determined in accordance with IFRS, divided by the Company’s production. Average prices are before deduction of transportation costs and do not include gains and losses on financial instruments.
“Adjusted funds flow per weighted average basic share” is comprised of adjusted funds flow divided by the basic weighted average common shares.
“Adjusted funds flow per weighted average diluted share” is comprised of adjusted funds flow divided by the diluted weighted average common shares.
“Adjusted funds flow per boe” is comprised of adjusted funds flow divided by total production.
Preliminary Financial Information
The Company’s expectations set forth in the updated forecasted 2023 guidance are based on, among other things, the Company’s anticipated financial results for the three and twelve month periods ended December 31, 2023. The Company’s anticipated financial results are unaudited and preliminary estimates that: (i) represent the most current information available to management as of the date of hereof; (ii) are subject to completion of audit procedures that could result in significant changes to the estimated amounts; and (iii) do not present all information necessary for an understanding of the Company’s financial condition as of, and the Company’s results of operations for, such periods. The anticipated financial results are subject to the same limitations and risks as discussed under “Forward Looking Information and Statements” below. Accordingly, the Company’s anticipated financial results for such periods may change upon the completion and approval of the financial statements for such periods and the changes could be material.
Forward-Looking Information and Statements
This news release contains certain forward–looking information and statements within the meaning of applicable securities laws. The use of any of the words “expect”, “anticipate”, “continue”, “estimate”, “may”, “will”, “project”, “should”, “believe”, “plans”, “intends”, “forecast” and similar expressions are intended to identify forward-looking information or statements. In particular, but without limiting the foregoing, this news release contains forward-looking information and statements pertaining to the following: the Company’s business strategy, milestones and objectives; all estimates and guidance related to the year ended 2023 results; the Company’s planned 2024 capital program including wells to be drilled and completed and the timing of the same; 2024 guidance based on the planned capital program and all associated underlying assumptions set forth in this press release including, without limitation, forecasts of 2024 annual average production levels, adjusted funds flow, free adjusted funds flow, Net Debt/EBITDA ratio, operating income profit margin, and Management’s belief that the Company can grow some or all of these attributes and specified measures; light crude oil and NGLs weighting estimates; expectations regarding future commodity prices; future oil and natural gas prices; future liquidity and financial capacity; future results from operations and operating metrics; future costs, expenses and royalty rates; future interest costs; the exchange rate between the $US and $Cdn; future development, exploration, acquisition, development and infrastructure activities and related capital expenditures, including our planned 2024 capital program; the amount and timing of capital projects;; and methods of funding our capital program.
The internal projections, expectations, or beliefs underlying our Board approved 2024 capital budget and associated guidance are subject to change in light of, among other factors, the impact of world events including the Russia/Ukraine conflict and war in the Middle East, ongoing results, prevailing economic circumstances, volatile commodity prices, and changes in industry conditions and regulations. InPlay’s 2024 financial outlook and guidance provides shareholders with relevant information on management’s expectations for results of operations, excluding any potential acquisitions or dispositions, for such time periods based upon the key assumptions outlined herein. Readers are cautioned that events or circumstances could cause capital plans and associated results to differ materially from those predicted and InPlay’s guidance for 2024 may not be appropriate for other purposes. Accordingly, undue reliance should not be placed on same.
Without limitation of the foregoing, readers are cautioned that the Company’s future dividend payments to shareholders of the Company, if any, and the level thereof will be subject to the discretion of the Board of Directors of InPlay. The Company’s dividend policy and funds available for the payment of dividends, if any, from time to time, is dependent upon, among other things, levels of FAFF, leverage ratios, financial requirements for the Company’s operations and execution of its growth strategy, fluctuations in commodity prices and working capital, the timing and amount of capital expenditures, credit facility availability and limitations on distributions existing thereunder, and other factors beyond the Company’s control. Further, the ability of the Company to pay dividends will be subject to applicable laws, including satisfaction of solvency tests under the Business Corporations Act (Alberta), and satisfaction of certain applicable contractual restrictions contained in the agreements governing the Company’s outstanding indebtedness.
Forward-looking statements or information are based on a number of material factors, expectations or assumptions of InPlay which have been used to develop such statements and information but which may prove to be incorrect. Although InPlay believes that the expectations reflected in such forward-looking statements or information are reasonable, undue reliance should not be placed on forward-looking statements because InPlay can give no assurance that such expectations will prove to be correct. In addition to other factors and assumptions which may be identified herein, assumptions have been made regarding, among other things: the impact of increasing competition; the general stability of the economic and political environment in which InPlay operates; the timely receipt of any required regulatory approvals; the ability of InPlay to obtain qualified staff, equipment and services in a timely and cost efficient manner; drilling results; the ability of the operator of the projects in which InPlay has an interest in to operate the field in a safe, efficient and effective manner; the ability of InPlay to obtain debt financing on acceptable terms; the anticipated tax treatment of the monthly base dividend; the timing and amount of purchases under the Company’s NCIB; field production rates and decline rates; the ability to replace and expand oil and natural gas reserves through acquisition, development and exploration; the timing and cost of pipeline, storage and facility construction and the ability of InPlay to secure adequate product transportation; future commodity prices; that various conditions to a shareholder return strategy can be satisfied; the ongoing impact of the Russia/Ukraine conflict and war in the Middle East; currency, exchange and interest rates; regulatory framework regarding royalties, taxes and environmental matters in the jurisdictions in which InPlay operates; and the ability of InPlay to successfully market its oil and natural gas products.
The forward-looking information and statements included herein are not guarantees of future performance and should not be unduly relied upon. Such information and statements, including the assumptions made in respect thereof, involve known and unknown risks, uncertainties and other factors that may cause actual results or events to defer materially from those anticipated in such forward-looking information or statements including, without limitation: the continuing impact of the Russia/Ukraine conflict and war in the Middle East; inflation and the risk of a global recession; changes in our planned 2023 capital program; changes in our approach to shareholder returns; changes in commodity prices and other assumptions outlined herein; the risk that dividend payments may be reduced, suspended or cancelled; the potential for variation in the quality of the reservoirs in which we operate; changes in the demand for or supply of our products; unanticipated operating results or production declines; changes in tax or environmental laws, royalty rates or other regulatory matters; changes in development plans or strategies of InPlay or by third party operators of our properties; changes in our credit structure, increased debt levels or debt service requirements; inaccurate estimation of our light crude oil and natural gas reserve and resource volumes; limited, unfavorable or a lack of access to capital markets; increased costs; a lack of adequate insurance coverage; the impact of competitors; and certain other risks detailed from time-to-time in InPlay’s continuous disclosure documents filed on SEDAR including our Annual Information Form and our MD&A.
This press release contains future-oriented financial information and financial outlook information (collectively, “FOFI”) about InPlay’s financial and leverage targets and objectives, potential dividends, share buybacks and beliefs underlying our Board approved 2024 capital budget and associated guidance, all of which are subject to the same assumptions, risk factors, limitations, and qualifications as set forth in the above paragraphs. The actual results of operations of InPlay and the resulting financial results will likely vary from the amounts set forth in this press release and such variation may be material. InPlay and its management believe that the FOFI has been prepared on a reasonable basis, reflecting management’s reasonable estimates and judgments. However, because this information is subjective and subject to numerous risks, it should not be relied on as necessarily indicative of future results. Except as required by applicable securities laws, InPlay undertakes no obligation to update such FOFI. FOFI contained in this press release was made as of the date of this press release and was provided for the purpose of providing further information about InPlay’s anticipated future business operations and strategy. Readers are cautioned that the FOFI contained in this press release should not be used for purposes other than for which it is disclosed herein.
The forward-looking information and statements contained in this news release speak only as of the date hereof and InPlay does not assume any obligation to publicly update or revise any of the included forward-looking statements or information, whether as a result of new information, future events or otherwise, except as may be required by applicable securities laws.
Risk Factors to FLI
Risk factors that could materially impact successful execution and actual results of the Company’s 2023 and 2024 capital program and associated guidance and estimates include:
volatility of petroleum and natural gas prices and inherent difficulty in the accuracy of predictions related thereto;
the extent of any unfavourable impacts of wildfires in the province of Alberta.
changes in Federal and Provincial regulations;
the Company’s ability to secure financing for the Board approved 2024 capital program and longer-term capital plans sourced from AFF, bank or other debt instruments, asset sales, equity issuance, infrastructure financing or some combination thereof; and
those additional risk factors set forth in the Company’s MD&A and most recent Annual Information Form filed on SEDAR
Key Budget and Underlying Material Assumptions to FLI
The key budget and underlying material assumptions used by the Company in the development of its current and previous 2023 guidance and 2024 guidance are as follows:
The change in production per debt adjusted share growth between previous and updated guidance is primarily due to 2023 production being impacted by approximately 650 boe/d as a result of curtailments, Alberta wildfires, natural gas facility startup delays as discussed in the body of this press release.
(1)
As previously released August 14, 2023.
(2)
As previously released November 9, 2023.
(3)
As previously released January 18, 2023.
(4)
Production per debt adjusted share is calculated by the Company as production divided by debt adjusted shares. Debt adjusted shares is calculated by the Company as common shares outstanding plus the change in net debt divided by the Company’s current trading price on the TSX, converting net debt to equity. Future share prices are assumed to be consistent with the current share price.
(5)
Weighted average share price throughout 2022 and 2023.
(6)
Ending share price at December 31, 2022 and December 31, 2023.
(7)
The change in the 2023 forecasted results from prior guidance results from an increase in capital expenditures and decrease in adjusted funds flow as a result of a reduction to production, a higher natural gas weighting of total production and lower AECO natural gas prices than previously forecasted.
(8)
The Company has withdrawn its 2024 and 2025 production per debt adjusted share and EV/DAAFF forecast for 2024 and 2025. The Company believes that these metrics can be quite variable and hard to reasonably estimate given the volatility in the Company’s share price, which is a material assumption used in the calculation of these metrics.
(9)
Continued commodity price volatility and current weak industry sentiment has resulted in the Company taking a conservative and disciplined approach to capital allocation in 2024 and future years. Preliminary estimates and plans for 2025 and beyond will be dependent on the stability of commodity prices and industry sentiment balancing manageable growth and ensuring the long term sustainability of our return of capital to shareholder strategy. As a result, the Company withdraws its preliminary estimates and plans for 2025.
See “Production Breakdown by Product Type” below
Quality and pipeline transmission adjustments may impact realized oil prices in addition to the MSW Differential provided above
Changes in working capital are not assumed to have a material impact between the years presented above.
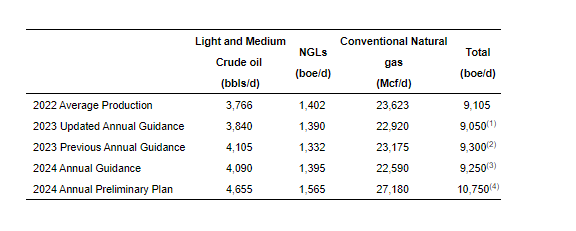
Production Breakdown by Product Type
Disclosure of production on a per boe basis in this press release consists of the constituent product types as defined in NI 51–101 and their respective quantities disclosed in the table below:
Notes:
1.
This reflects the mid-point of the Company’s 2023 updated production guidance range of 9,000 to 9,100 boe/d.
2.
This reflects the mid-point of the Company’s 2023 previous production guidance range of 9,100 to 9,500 boe/d.
3.
This reflects the mid-point of the Company’s 2024 production guidance range of 9,000 to 9,500 boe/d.
4.
This reflects the midpoint of the Company’s annual production previous preliminary estimate range.
5.
With respect to forward–looking production guidance, product type breakdown is based upon management’s expectations based on reasonable assumptions but are subject to variability based on actual well results.
References to crude oil, light oil, NGLs or natural gas production in this press release refer to the light and medium crude oil, natural gas liquids and conventional natural gas product types, respectively, as defined in National Instrument 51-101, Standards of Disclosure for Oil and Gas Activities (“NI 51-101”).
BOE Equivalent
Barrel of oil equivalents or BOEs may be misleading, particularly if used in isolation. A BOE conversion ratio of 6 mcf: 1 bbl is based on an energy equivalency conversion method primarily applicable at the burner tip and does not represent a value equivalency at the wellhead. Given that the value ratio based on the current price of crude oil as compared to natural gas is significantly different than the energy equivalency of 6:1, utilizing a 6:1 conversion basis may be misleading as an indication of value.
Initial Production Rates
References in this press release to IP rates, other short-term production rates or initial performance measures relating to new wells are useful in confirming the presence of hydrocarbons; however, such rates are not determinative of the rates at which such wells will commence production and decline thereafter and are not indicative of long-term performance or of ultimate recovery. While encouraging, readers are cautioned not to place reliance on such rates in calculating the aggregate production for the Company. Accordingly, the Company cautions that the test results should be considered to be preliminary.
First Year of Giving Supports 43 Organizations Across FAT Brands’ Communities
LOS ANGELES, Jan. 29, 2024 (GLOBE NEWSWIRE) — FAT (Fresh. Authentic. Tasty.) Brands Inc., a leading global franchising company that owns restaurant brands including Johnny Rockets, Fatburger, Round Table Pizza, Twin Peaks, Fazoli’s, and 13 other concepts, is pleased to announce the impact FAT Brands Foundation had in its local communities during its first year of giving. In 2023, over $250,000 was awarded to 43 local non-profits across 19 states and Washington D.C.
The foundation’s impact was widespread, standing behind causes such as food insecurity, health, education, youth development, the arts, and more. Notably, the foundation supported the critical work of non-profits in FAT Brands’ communities, including organizations tied to the fires in Maui, Hawaii, and the tragedy in Allen, Texas.
“We are proud of not only getting the foundation off the ground in 2023, but also doubling down on our commitment to serve by providing funding and physical volunteers for boots-on-the-ground work in various FAT Brands’ communities,” said Jessica Wiederhorn, President of FAT Brands Foundation. “This year was just the beginning and we have built a strong framework – supporting the unique and important work of 43 organizations. We look forward to bringing to life even more opportunities – through funding and volunteer work – in the coming years.”
Looking to 2024, the foundation is committed to continuing its work supporting local non-profits that provide essential programs to help communities and families thrive. For organizations interested in applying for a grant, for those interested in donating to the foundation or to view the 2023 FAT Brands Foundation Impact Report, please visit www.fatbrands.com/foundation.
FAT Brands (NASDAQ: FAT) is a leading global franchising company that strategically acquires, markets and develops fast casual, quick-service, casual and polished casual dining restaurant concepts around the world. The Company currently owns 18 restaurant brands: Round Table Pizza, Fatburger, Marble Slab Creamery, Johnny Rockets, Fazoli’s, Twin Peaks, Great American Cookies, Smokey Bones, Hot Dog on a Stick, Buffalo’s Cafe & Express, Hurricane Grill & Wings, Pretzelmaker, Elevation Burger, Native Grill & Wings, Yalla Mediterranean and Ponderosa and Bonanza Steakhouses, and franchises and owns over 2,300 units worldwide. For more information on FAT Brands, please visit www.fatbrands.com.
About FAT Brands Foundation
Founded in 2022, the FAT Brands Foundation was created to uplift and unite the communities in which FAT Brands operates. While the company’s 18-brand portfolio is deeply rooted in charitable initiatives both locally and nationally, FAT Brands, as an organization, is seeking to magnify those efforts further. The 501(c)(3) organization is aimed at partnering with local non-profit organizations to provide essential programs to help families and communities thrive.
NEW PRECLINICAL DATA ON UNI-494 IN ACUTE KIDNEY INJURY
LOS ALTOS, Calif., Jan. 29, 2024 (GLOBE NEWSWIRE) — Unicycive Therapeutics, Inc. (Nasdaq: UNCY), a clinical-stage biotechnology company developing therapies for patients with kidney disease (the “Company or “Unicycive”), today announced that two presentations related to UNI-494 will be presented at the 29th International Conference on Advances in Critical Care Nephrology AKI and CRRT 2024 taking place March 12-15, 2024, in San Diego, CA.
Shalabh Gupta, MD, Chief Executive Officer of Unicycive, commented, “We are looking forward to presenting data on the efficacy of our second clinical stage program UNI-494 in animal models of delayed graft function, a manifestation of acute kidney injury (AKI) that occurs during kidney transplantation resulting in loss of kidney function. We are also presenting a poster describing our ongoing Phase 1 clinical trial design for UNI-494 in healthy volunteers. Based on the results from this trial, we will determine the best path forward for the program. While our primary focus is on advancing our lead drug, OLC (Oxylanthanum Carbonate) towards a New Drug Application submission, we continue to build a body of data on UNI-494 as it progresses through its first clinical trial.”
Title:
Intravenous Administration of UNI-494 Ameliorates Acute Kidney Injury in Rat Model of Delayed Graft Function
Lead Author:
Satya Medicherla, Ph.D.
Type:
Oral Presentation
Date/Time:
Tuesday, March 12, 2024 / 5:30 – 7:30 p.m. PT
Title:
UNI-494 Phase I Safety, Tolerability and Pharmacokinetics: Trial in Progress
Lead Author:
Guru Reddy, PH.D.
Type:
Poster
Date/Time:
March 12th from 5:30 – 7:30 p.m. PT and March 13th from 6:00 – 8:00 p.m. PT
About UNI-494
UNI-494 is a novel nicotinamide ester derivative and a selective ATP-sensitive mitochondrial potassium channel activator. Mitochondrial dysfunction plays a critical role in the progression of acute kidney injury and chronic kidney disease. UNI-494 has a novel mechanism of action that restores mitochondrial function and may be beneficial for the treatment of several diseases including kidney disease. Unicycive is currently conducting a Phase 1 dose-ranging safety study in healthy volunteers in the United Kingdom that is expected to complete this year. UNI-494 is protected by issued patent(s) in the U.S. and Europe and a wide range of patent applications worldwide.
About Unicycive Therapeutics
Unicycive Therapeutics is a biotechnology company developing novel treatments for kidney diseases. Unicycive’s lead drug candidate, oxylanthanum carbonate (OLC), is a novel investigational phosphate binding agent being developed for the treatment of hyperphosphatemia in chronic kidney disease patients on dialysis. UNI-494 is a patent-protected new chemical entity in late preclinical development for the treatment of acute kidney injury. For more information, please visit Unicycive.com and follow us on LinkedIn and YouTube.
Forward-looking statements
Certain statements in this press release are forward-looking within the meaning of the Private Securities Litigation Reform Act of 1995. These statements may be identified using words such as “anticipate,” “believe,” “forecast,” “estimated” and “intend” or other similar terms or expressions that concern Unicycive’s expectations, strategy, plans or intentions. These forward-looking statements are based on Unicycive’s current expectations and actual results could differ materially. There are several factors that could cause actual events to differ materially from those indicated by such forward-looking statements. These factors include, but are not limited to, clinical trials involve a lengthy and expensive process with an uncertain outcome, and results of earlier studies and trials may not be predictive of future trial results; our clinical trials may be suspended or discontinued due to unexpected side effects or other safety risks that could preclude approval of our product candidates; risks related to business interruptions, which could seriously harm our financial condition and increase our costs and expenses; dependence on key personnel; substantial competition; uncertainties of patent protection and litigation; dependence upon third parties; and risks related to failure to obtain FDA clearances or approvals and noncompliance with FDA regulations. Actual results may differ materially from those indicated by such forward-looking statements as a result of various important factors, including: the uncertainties related to market conditions and other factors described more fully in the section entitled ‘Risk Factors’ in Unicycive’s Annual Report on Form 10-K for the year ended December 31, 2022, and other periodic reports filed with the Securities and Exchange Commission. Any forward-looking statements contained in this press release speak only as of the date hereof, and Unicycive specifically disclaims any obligation to update any forward-looking statement, whether as a result of new information, future events or otherwise.
Results from two positive Phase 3 studies point to Tonmya’s (TNX-102 SL) potential as a new first-line medicine for chronic use in managing fibromyalgia, a debilitating condition suffered by 6-12 million adults in the U.S.
New Drug Application (NDA) submission to the FDA planned for second half of 2024 under the 505(b)(2) regulatory pathway
CHATHAM, N.J., Jan. 29, 2024 (GLOBE NEWSWIRE) — Tonix Pharmaceuticals Holding Corp. (Nasdaq: TNXP) (Tonix or the Company), a biopharmaceutical company with marketed products and a pipeline of development candidates, today announced that the U.S. Food and Drug Administration (FDA) has conditionally accepted the trade name, Tonmya™, for the Company’s drug product candidate TNX-102 SL for the management of fibromyalgia.
Tonmya is a patented sublingual tablet formulation of cyclobenzaprine hydrochloride developed for the management of fibromyalgia. In December 2023, the Company announced highly statistically significant and clinically meaningful topline results in RESILIENT, a second positive Phase 3 clinical trial of Tonmya for the management of fibromyalgia. In the study, Tonmya met its pre-specified primary endpoint, significantly reducing daily pain compared to placebo (p=0.00005) in participants with fibromyalgia. Statistically significant and clinically meaningful results were also seen in all key secondary endpoints related to improving sleep quality, reducing fatigue and improving overall fibromyalgia symptoms and function. RELIEF, the first positive Phase 3 trial of Tonmya in fibromyalgia, was completed in December 2020. It met its pre-specified primary endpoint of daily pain reduction compared to placebo (p=0.010) and showed activity in key secondary endpoints. Tonix plans to have a pre-NDA meeting with U.S. Food and Drug Administration (FDA) in the first half of 2024 and to submit a New Drug Application (NDA) to the FDA in the second half of 2024 for Tonmya for the management of fibromyalgia.
“We are very pleased with the FDA’s conditional acceptance of Tonmya as the brand name for TNX-102 SL,” said Seth Lederman, M.D., President and Chief Executive Officer of Tonix Pharmaceuticals. “With this acceptance, we remain excited for what we believe is an important opportunity to offer the first FDA-approved drug for fibromyalgia patients in more than a decade.”
About Tonmya™ (formerly known as TNX-102 SL)
Tonmya is a patented sublingual tablet formulation of cyclobenzaprine hydrochloride which is designed for daily administration at bedtime with a proposed mechanism of improving sleep quality in fibromyalgia. Tonmya provides rapid transmucosal absorption and reduced production of a long half-life active metabolite, norcyclobenzaprine, due to bypass of first-pass hepatic metabolism. As a multifunctional agent with potent binding and antagonist activities at the 5-HT2A-serotonergic, α1-adrenergic, H1-histaminergic, and M1-muscarinic cholinergic receptors, Tonmya is in development as a daily bedtime treatment for fibromyalgia, fibromyalgia-type Long COVID (formally known as post-acute sequelae of COVID-19 [PASC]), alcohol use disorder, and agitation in Alzheimer’s disease. The United States Patent and Trademark Office (USPTO) issued United States Patent No. 9636408 in May 2017, Patent No. 9956188 in May 2018, Patent No. 10117936 in November 2018, Patent No. 10,357,465 in July 2019, and Patent No. 10736859 in August 2020. The Protectic™ protective eutectic and Angstro-Technology™ formulation claimed in the patent are important elements of Tonix’s proprietary Tonmya composition. These patents are expected to provide Tonmya, upon NDA approval, with U.S. market exclusivity until 2034/2035. In addition, Tonix has pending but not issued U.S. patent applications directed to the transmucosal absorption of CBP-HCl, with U.S. market exclusivity expected until 2033, for treating depressive symptoms in fibromyalgia, with U.S. market exclusivity expected until 2032, and for treating pain in fibromyalgia with U.S. market exclusivity expected until 2041.
Tonix Pharmaceuticals Holding Corp.*
Tonix is a biopharmaceutical company focused on commercializing, developing, discovering and licensing therapeutics to treat and prevent human disease and alleviate suffering. Tonix’s development portfolio is focused on central nervous system disorders. Tonix’s priority is to submit a New Drug Application (NDA) to the FDA for Tonmya, which has completed two positive Phase 3 studies for the management of fibromyalgia. Tonix intends to meet with the FDA in the first half of 2024 and submit an NDA for the approval of Tonmya for the management of fibromyalgia in the second half of 2024. TNX-102 SL is being developed to treat fibromyalgia-type Long COVID, a chronic post-acute COVID-19 condition, and topline results from a proof-of-concept study were reported in the third quarter of 2023. TNX-1300 (cocaine esterase) is a biologic designed to treat cocaine intoxication and has been granted Breakthrough Therapy designation by the FDA. A Phase 2 study of TNX-1300 is expected to be initiated in the first quarter of 2024. Tonix’s rare disease development portfolio includes TNX-2900 (intranasal potentiated oxytocin) for the treatment of Prader-Willi syndrome (PWS). TNX-2900 has been granted Orphan Drug designation by the FDA and an investigational new drug (IND) application has been cleared to support a Phase 2 study in PWS patients. Tonix’s immunology development portfolio includes biologics to address organ transplant rejection, autoimmunity and cancer, including TNX-1500, which is a humanized monoclonal antibody targeting CD40-ligand (CD40L or CD154) being developed for the prevention of allograft rejection and for the treatment of autoimmune diseases. A Phase 1 study of TNX-1500 was initiated in the third quarter of 2023. Tonix’s infectious disease pipeline includes TNX-801, a vaccine in development to prevent smallpox and mpox. TNX-801 also serves as the live virus vaccine platform or recombinant pox vaccine platform for other infectious diseases, including TNX-1800, in development as a vaccine to protect against COVID-19. During the fourth quarter of 2023, TNX-1800 was selected by the U.S. National Institutes of Health (NIH), National Institute of Allergy and Infectious Diseases (NIAID) Project NextGen for inclusion in Phase 1 clinical trials. The infectious disease development portfolio also includes TNX-3900 and TNX-4000, which are classes of broad-spectrum small molecule oral antivirals. Tonix Medicines, our commercial subsidiary, markets Zembrace® SymTouch® (sumatriptan injection) 3 mg and Tosymra® (sumatriptan nasal spray) 10 mg under a transition services agreement with Upsher-Smith Laboratories, LLC from whom the products were acquired on June 30, 2023. Zembrace SymTouch and Tosymra are each indicated for the treatment of acute migraine with or without aura in adults.
*Tonix’s product development candidates are investigational new drugs or biologics and have not been approved for any indication.
Zembrace SymTouch and Tosymra are registered trademarks of Tonix Medicines. All other marks are property of their respective owners.
This press release and further information about Tonix can be found at www.tonixpharma.com.
Forward Looking Statements
Certain statements in this press release are forward-looking within the meaning of the Private Securities Litigation Reform Act of 1995. These statements may be identified by the use of forward-looking words such as “anticipate,” “believe,” “forecast,” “estimate,” “expect,” and “intend,” among others. These forward-looking statements are based on Tonix’s current expectations and actual results could differ materially. There are a number of factors that could cause actual events to differ materially from those indicated by such forward-looking statements. These factors include, but are not limited to, risks related to the failure to obtain FDA clearances or approvals and noncompliance with FDA regulations; risks related to the failure to successfully market any of our products; risks related to the timing and progress of clinical development of our product candidates; our need for additional financing; uncertainties of patent protection and litigation; uncertainties of government or third party payor reimbursement; limited research and development efforts and dependence upon third parties; and substantial competition. As with any pharmaceutical under development, there are significant risks in the development, regulatory approval and commercialization of new products. Tonix does not undertake an obligation to update or revise any forward-looking statement. Investors should read the risk factors set forth in the Annual Report on Form 10-K for the year ended December 31, 2022, as filed with the Securities and Exchange Commission (the “SEC”) on March 13, 2023, and periodic reports filed with the SEC on or after the date thereof. All of Tonix’s forward-looking statements are expressly qualified by all such risk factors and other cautionary statements. The information set forth herein speaks only as of the date thereof.
HOUSTON, Jan. 29, 2024 (GLOBE NEWSWIRE) — Orion Group Holdings, Inc. (NYSE: ORN) (the “Company”), a leading specialty construction company, today announced the rebranding of its subsidiary TAS Concrete Construction (“TAS”) as Orion. This move reflects the Company’s strategic initiative to integrate its different service offerings under one banner to leverage Orion’s brand reputation and to deliver greater value and seamless execution for its customers.
TAS Concrete Construction was acquired by Orion Group Holdings, Inc. in 2015 and has continued to operate under the TAS name until now. The Company’s concrete segment, formerly known as TAS, and its marine segment will now operate together under the Orion name providing its customers with a single source for specialty construction and engineering.
“By unifying under the Orion banner, we will have a more recognizable presence in the national market, enhancing our brand and market opportunities. This integration will unlock new potential for growth, foster collaboration across teams, and support our mission to deliver high-quality solutions with predictable excellence,” said Travis Boone, Chief Executive Officer of Orion Group Holdings, Inc.
Through the fourth quarter 2023 and January 2024, Orion was awarded $244.2 million in new contracts, including $38.7 million for a beach stabilization project in Texas and $24.1 million for dredging work in Louisiana.
About Orion Group Holdings, Inc.
Orion Group Holdings, Inc., a leading specialty construction company serving the infrastructure, industrial and building sectors, provides services both on and off the water in the continental United States, Alaska, Hawaii, Canada and the Caribbean Basin through its marine segment and its concrete segment. The Company’s marine segment provides construction and dredging services relating to marine transportation facility construction, marine pipeline construction, marine environmental structures, dredging of waterways, channels and ports, environmental dredging, design, and specialty services. Its concrete segment provides turnkey concrete construction services including place and finish, site prep, layout, forming, and rebar placement for large commercial, structural and other associated business areas. The Company is headquartered in Houston, Texas with regional offices strategically located across its operating areas. (oriongroupholdingsinc.com)
Forward-Looking Statements
The matters discussed in this press release may constitute or include projections or other forward-looking statements within the meaning of the “safe harbor” provisions of Section 27A of the Securities Exchange Act of 1933, as amended, and Section 21E of the Securities Exchange Act of 1934, as amended, of which provisions the Company is availing itself. Certain forward-looking statements can be identified by the use of forward-looking terminology, such as ‘believes’, ‘expects’, ‘may’, ‘will’, ‘could’, ‘should’, ‘seeks’, ‘approximately’, ‘intends’, ‘plans’, ‘estimates’, or ‘anticipates’, or the negative thereof or other comparable terminology, or by discussions of strategy, plans, objectives, intentions, estimates, forecasts, outlook, assumptions, or goals. In particular, statements regarding future operations or results, including those set forth in this press release, and any other statement, express or implied, concerning future operating results or the future generation of or ability to generate revenues, income, net income, gross profit, EBITDA, Adjusted EBITDA, Adjusted EBITDA margin, or cash flow, including to service debt, and including any estimates, forecasts or assumptions regarding future revenues or revenue growth, are forward-looking statements. Forward-looking statements also include project award announcements, estimated project start dates, anticipated revenues, and contract options which may or may not be awarded in the future. Forward-looking statements involve risks, including those associated with the Company’s fixed price contracts that impacts profits, unforeseen productivity delays that may alter the final profitability of the contract, cancellation of the contract by the customer for unforeseen reasons, delays or decreases in funding by the customer, levels and predictability of government funding or other governmental budgetary constraints, and any potential contract options which may or may not be awarded in the future, and are at the sole discretion of award by the customer. Past performance is not necessarily an indicator of future results. In light of these and other uncertainties, the inclusion of forward-looking statements in this press release should not be regarded as a representation by the Company that the Company’s plans, estimates, forecasts, goals, intentions, or objectives will be achieved or realized. Readers are cautioned not to place undue reliance on these forward-looking statements, which speak only as of the date hereof. The Company assumes no obligation to update information contained in this press release whether as a result of new developments or otherwise, except as required by law.
Please refer to the Company’s 2022 Annual Report on Form 10-K, filed on March 16, 2023, which is available on its website at www.oriongroupholdingsinc.com or at the SEC’s website at www.sec.gov, for additional and more detailed discussion of risk factors that could cause actual results to differ materially from our current expectations, estimates or forecasts.
WillScot Mobile Mini Holdings Corp. announced Monday that it will acquire modular rental provider McGrath RentCorp in a $3.8 billion deal. The acquisition aims to solidify WillScot’s position as a leading provider of modular space and portable storage solutions across North America.
Under the terms of the agreement, McGrath shareholders will receive $123 per share, comprised of 60% cash and 40% WillScot stock. This reflects a 10.1% premium over McGrath’s share price as of January 26th. Once completed, McGrath shareholders will own approximately 12.6% of the combined company.
The deal comes as WillScot looks to expand its footprint and diversify its customer segments through McGrath’s complementary business. McGrath serves over 10,000 business customers with modular building leasing and sales solutions across the U.S.
According to WillScot CEO Brad Soultz, “The transaction will further accelerate our growth, with combined 2023 pro forma revenue of $3.2 billion and adjusted EBITDA of $1.4 billion, we will be on path to achieve a $700 million free cash flow run-rate twelve months after we close.”
WillScot expects to realize $50 million in run-rate cost synergies within two years following the close of the acquisition in Q2 2024. The company has a track record of successfully integrating past deals and meeting synergy targets.
The combined company will be able to cross-sell value-added products and services and roll out operations best practices across the broader customer base. It will also have increased scale and expanded infrastructure to accelerate organic growth strategies already in place.
Along with revenue and cost synergies, the deal provides WillScot with greater geographic diversification and depth in adjacent sectors like electronic test equipment rental through McGrath’s TRS-RenTelco business.
On the financial front, the combined company is projected to generate approximately $3.2 billion in revenue and $1.4 billion in adjusted EBITDA in 2023. It expects to produce around $700 million in free cash flow within twelve months after the merger is finalized.
To fund the cash component of the acquisition, WillScot has secured committed bridge financing of $1.75 billion, along with expanded capacity from its existing credit facilities. The company is committed to rapid deleveraging and plans to achieve a 3.0-3.5x net leverage ratio within a year post-close.
McGrath’s board has unanimously approved the transaction. With shareholder approval and regulator sign-off, the buyout is anticipated to close during Q2 2024. Until then, McGrath will operate as an independent, publicly traded company.
The acquisition is the latest in WillScot’s strategy to capitalize on demand growth for modular space and storage solutions. The company has acquired over 15 businesses since going public in 2017, including the transformative $1.2 billion merger with Mobile Mini in 2020.
For McGrath shareholders, the deal provides a significant premium and ongoing upside through ownership stake in WillScot. It also enables McGrath’s rental solutions to reach a wider audience through WillScot’s expansive branch network and customer base.
Clinical research company Science 37 announced Monday that it has entered into a definitive agreement to be acquired by telehealth provider eMed in a deal valued at approximately $38 million. Under the agreement, eMed will commence a tender offer to purchase all outstanding shares of Science 37 stock for $5.75 per share in cash, representing a 21.3% premium over Science 37’s share price last week.
The deal will allow eMed to leverage Science 37’s remote clinical trial capabilities and proprietary Metasite technology platform to expand patient access and accelerate enrollment for clinical studies. Science 37’s decentralized clinical trial model enables patients to participate from home via telehealth, rather than having to travel to physical trial sites.
This acquisition comes at a pivotal time, as the biotech industry embraces virtual and hybrid trial designs in the wake of the COVID-19 pandemic. Science 37 was an early pioneer in decentralized trials, giving the company a first-mover advantage. According to Science 37 CEO David Coman, “eMed provides the greatest value to our stockholders, customers, patients, and employees. Stockholders will receive a premium, trial sponsors will gain greater access to patients, faster enrollment, and confidence in the Company’s capital position.”
For eMed, the deal significantly expands its digital healthcare footprint, adding Science 37’s network of telehealth investigators, coordinators, and software platform to its existing suite of at-home diagnostics and virtual care services. eMed was an early mover as well, having developed the first at-home COVID-19 test kit in 2020. Since then, the company has expanded into at-home testing and treatment for flu, UTIs, and other conditions.
The combined resources of both companies will provide end-to-end support for decentralized clinical trials, from patient recruitment to at-home sample collection to telemedicine visits. This could be a game-changer in improving patient diversity in trials and enabling studies focused on rare diseases or targeted therapies.
According to Science 37’s latest financial update, the company expects approximately $58-59 million in revenue for 2023 and over $50 million in cash reserves as of December 31, 2023. The company projected 2023 revenue of $50-60 million.
Science 37’s board of directors unanimously approved the acquisition deal with eMed. Major Science 37 shareholders, including Redmile Group, LLC, have also agreed to tender their shares in support of the acquisition.
The deal is expected to close in Q1 2024, pending tender of a majority of outstanding Science 37 shares and satisfaction of other customary closing conditions. Once completed, Science 37 will become a privately held subsidiary of eMed.
This Science 37 acquisition comes on the heels of eMed’s parent company, Evernow Inc., raising $100 million in Series B funding last March. The current deal highlights continued investor appetite for telehealth and digital health companies that are expanding access to care.
The Science 37 and eMed deal also demonstrates the growing intersection between telehealth and clinical research. Other companies like Medable and Excelya are exploring how hybrid and decentralized trials can boost patient recruitment and retention. By meeting patients where they are, virtual trials enable more representative, diverse study populations.
While some industry experts say a hybrid approach will become the standard, decentralized trials are still a relatively new model. This acquisition provides eMed with a first-mover advantage, but expect other digital health companies to underscore their clinical trial offerings moving forward. In the meantime, all eyes will be on eMed and Science 37 as they pioneer the next generation of virtual clinical research.
Record full year 2023 total revenue of $2.6 billion, coal sales price realizations of $64.17 per ton sold, and net income of $630.1 million
Full year 2023 EBITDA of $933.1 million
Fourth quarter 2023 total revenue of $625.4 million, EBITDA of $185.4 million, and net income of $115.4 million
Completed $24.8 million in oil & gas mineral interest acquisitions during fourth quarter 2023 and $110.9 million during full year 2023, resulting in record BOE volumes
Reduced debt by $22.9 million during fourth quarter 2023 and $85.0 million during full year 2023, resulting in total and net leverage ratios of 0.37 times and 0.31 times, respectively
In January 2024, declared quarterly cash distribution of $0.70 per unit, or $2.80 per unit annualized
2024 expected coal sales volumes over 90% committed and priced at levels similar to 2023
TULSA, Okla.–(BUSINESS WIRE)– Alliance Resource Partners, L.P. (NASDAQ: ARLP) (“ARLP” or the “Partnership”) today reported financial and operating results for the quarter and full year ended December 31, 2023 (the “2023 Quarter” and “2023 Full Year”). This release includes comparisons of results to the quarter and year ended December 31, 2022 (the “2022 Quarter” and “2022 Full Year”, respectively), as well as the quarter ended September 30, 2023 (the “Sequential Quarter”). All references in the text of this release to “net income” refer to “net income attributable to ARLP.” For a definition of EBITDA and related reconciliation to its comparable GAAP financial measure, please see the end of this release.
2023 Full Year performance saw total revenues increase $146.7 million to a record $2.6 billion primarily due to higher coal sales revenues. Coal sales prices and coal sales revenues during the 2023 Full Year were higher by 8.6% and 5.1%, respectively, compared to the 2022 Full Year. Increased revenues and lower income tax expense were partially offset by higher total operating expenses in the 2023 Full Year, resulting in record net income of $630.1 million, or $4.81 per basic and diluted limited partner unit, for the 2023 Full Year, compared to $586.2 million, or $4.39 per basic and diluted limited partner unit, for the 2022 Full Year, a 7.5% increase.
Total revenues in the 2023 Quarter decreased to $625.4 million compared to $704.2 million for the 2022 Quarter primarily as a result of lower coal and oil & gas prices and reduced coal sales volumes, partially offset by record oil & gas royalty volumes and higher transportation and other revenues. Lower revenues and higher total operating expenses reduced net income for the 2023 Quarter to $115.4 million, or $0.88 per basic and diluted limited partner unit, compared to $216.9 million, or $1.63 per basic and diluted limited partner unit, for the 2022 Quarter. EBITDA for the 2023 Quarter was $185.4 million compared to $296.9 million in the 2022 Quarter.
Compared to the Sequential Quarter, total revenues in the 2023 Quarter decreased 1.7% primarily as a result of lower average coal sales prices of $60.60 per ton sold compared to $64.94 per ton sold in the Sequential Quarter, partially offset by higher coal sales volumes, which increased 1.9% to 8.6 million tons sold in the 2023 Quarter. Lower revenues and higher total operating expenses contributed to a reduction in net income and EBITDA of 24.9% and 18.5%, respectively, compared to the Sequential Quarter.
CEO Commentary
“For the 2023 Full Year, we once again delivered record revenues and net income, relying upon the strength of our well-contracted coal order book and the resilience of the entire ARLP team who persevered through volatile market challenges and difficult mining conditions,” commented Joseph W. Craft III, Chairman, President and Chief Executive Officer. “Our strategic relationships with our long-standing customers were evident in the 2023 Quarter as we contracted an additional 12.0 million tons for domestic deliveries over the 2024 through 2028 time period at attractive, escalating prices, bringing our committed and priced order book for 2024 to over 90% of expected shipments.”
Mr. Craft added, “We believe the worst of the adverse geological conditions, which delayed development of a new district at Mettiki, idling the longwall there for essentially the entire second half of the 2023 Full Year, are behind us. With the longwall at Mettiki resuming production in late December 2023, we are expecting production in the first quarter of 2024, for our Appalachia operations, to compare favorably to the first quarter of 2023.”
Mr. Craft concluded, “Our Oil & Gas Royalty business completed $24.8 million in oil & gas mineral interest acquisitions during the 2023 Quarter and $110.9 million for the 2023 Full Year, resulting in record BOE volumes. We plan to continue allocating capital to grow this business line in 2024. Combining the stability of our heavily contracted coal order book with continued growth in our Oil & Gas Royalty business, we are well-positioned for another record year of revenues in 2024.”
Coal Operations
ARLP’s coal sales prices per ton declined in both regions compared to the 2022 and Sequential Quarters. Lower export pricing in the Illinois Basin reduced coal sales prices by 4.2% in the region compared to the 2022 Quarter. Compared to the Sequential Quarter, Illinois Basin coal sales prices were lower by 2.8% as a result of reduced domestic price realizations. In Appalachia, coal sales price per ton decreased by 14.1% and 10.4% compared to the 2022 and Sequential Quarters, respectively, as a result of lower domestic pricing, partially offset by higher export price realizations. Illinois Basin coal sales volumes increased by 2.1% and 6.1% compared to the 2022 and Sequential Quarters, respectively, as a result of increased volumes from our Hamilton and Warrior mines compared to the 2022 Quarter and from our Gibson South operation sequentially. Tons sold decreased in Appalachia compared to the 2022 and Sequential Quarters due to reduced volumes across the region, primarily caused by lower recoveries, fewer operating units at MC Mining, the previously mentioned challenging geologic conditions that delayed development of a new district at our Mettiki longwall operation, customer plant maintenance and a longwall move at our Tunnel Ridge mine during the 2023 Quarter. ARLP ended the 2023 Quarter with total coal inventory of 1.3 million tons, representing an increase of 0.8 million tons compared to the end of the 2022 Quarter and a decrease of 0.5 million tons compared to the end of the Sequential Quarter. 2023 Quarter coal inventory and tons sold were negatively impacted by approximately 0.6 million tons due to an unexpected temporary outage at a Gulf Coast export terminal we use for export market sales.
Segment Adjusted EBITDA Expense per ton for the 2023 Quarter decreased by 7.2% in the Illinois Basin compared to the 2022 Quarter, due primarily to increased volumes and lower expenses at our Hamilton mine, that experienced an unexpected outage in the 2022 Quarter. Segment Adjusted EBITDA Expense per ton in Appalachia increased compared to the 2022 and Sequential Quarters due primarily to lower volumes as discussed above and purchased coal.
Royalties
Segment Adjusted EBITDA for the Oil & Gas Royalties segment decreased to $31.0 million in the 2023 Quarter compared to $35.3 million and $31.4 million in the 2022 and Sequential Quarters, respectively. Compared to the 2022 Quarter, the decrease was due to lower price realizations, partially offset by record oil & gas volumes, which increased 13.1% to 809 MBOE sold in the 2023 Quarter. Higher volumes during the 2023 Quarter resulted from increased drilling and completion activities on our interests and acquisitions of additional oil & gas mineral interests.
Segment Adjusted EBITDA for the Coal Royalties segment increased to $10.2 million for the 2023 Quarter compared to $8.2 million and $9.9 million for the 2022 and Sequential Quarters, respectively. Compared to the 2022 Quarter, the increase resulted from higher average royalty rates per ton, partially offset by lower royalty tons sold and increased selling expenses. Sequentially, the increase in Segment Adjusted EBITDA for Coal Royalties primarily resulted from lower selling expenses.
Balance Sheet and Liquidity
As of December 31, 2023, total debt and finance leases outstanding were $348.1 million, including $284.6 million in ARLP’s 2025 senior notes. During the 2023 Quarter, ARLP reduced its total debt and finance leases by $22.9 million. The Partnership’s total and net leverage ratios were 0.37 times and 0.31 times, respectively, as of December 31, 2023. ARLP ended the 2023 Quarter with total liquidity of $492.1 million, which included $59.8 million of cash and cash equivalents and $432.3 million of borrowings available under its revolving credit and accounts receivable securitization facilities.
Distributions
On January 26, 2024, the Board of Directors of ARLP’s general partner (the “Board”) approved a cash distribution to unitholders for the 2023 Quarter of $0.70 per unit (an annualized rate of $2.80 per unit), payable on February 14, 2024, to all unitholders of record as of the close of trading on February 7, 2024. The announced distribution is consistent with the cash distributions for the 2022 and Sequential Quarters.
Acquisition of Oil & Gas Mineral Interests
In December 2023, ARLP closed on an acquisition of mineral interests in approximately 2,372 oil & gas net royalty acres in the Anadarko, Williston and Delaware Basins for a purchase price of $14.5 million. During the 2023 Quarter, ARLP also separately purchased approximately 864 net royalty acres in the Permian Basin for $10.3 million.
Outlook
“As we look to 2024, our coal sales book is expected to be equally as strong as last year and be the anchor to deliver another record year of revenues,” commented Mr. Craft. “Our dependability and the reliability of our coal quality is highly valued by our customers, evidenced by the premium pricing we have received, relative to the spot market, on recent commitments with domestic customers for multi-year contracts. We are entering 2024 with over 90% of our coal sales volumes committed and priced at similar levels relative to 2023. We are expecting our production to be more consistent in 2024, believing we have moved beyond the several negative geological areas that we faced in 2023.”
“We expect to complete the major infrastructure projects at Tunnel Ridge, Hamilton, Warrior and the River View complex in 2024,” Mr. Craft continued. “ARLP will start to recognize the benefits from these strategic investments in 2025 as total capital expenditures will be significantly lower and these mines will be more productive, ensuring we maintain our position as one of the most reliable, low-cost producers in the eastern United States over the next decade. We are forecasting domestic natural gas prices to rise in 2025 as new LNG terminal capacity comes online, driving an increase in natural gas exports, benefitting both our Coal and Royalties segments.”
Mr. Craft added, “As we think about the outlook for the coal industry and the markets we serve, we should all take notice that grid planners have nearly doubled five-year load growth forecasts in support of ongoing investments in U.S. industrial and manufacturing sectors, as well as rising energy needs associated with datacenters and artificial intelligence. While the speed of electrifying the transportation sector may have slowed, the enthusiasm for AI has accelerated.”
Mr. Craft concluded, “We remain confident in our projections for sustained coal demand for ARLP and the likelihood that the pre-mature closures of coal-fired power plants in the eastern U.S. will be delayed.”
ARLP is providing the following updated guidance for the full year ended December 31, 2024 (the “2024 Full Year”):
Conference Call
A conference call regarding ARLP’s 2023 Quarter and Full Year financial results is scheduled for today at 10:00 a.m. Eastern. To participate in the conference call, dial (877) 407-0784 and request to be connected to the Alliance Resource Partners, L.P. earnings conference call. International callers should dial (201) 689-8560 and request to be connected to the same call. Investors may also listen to the call via the “Investors” section of ARLP’s website at www.arlp.com.
An audio replay of the conference call will be available for approximately one week. To access the audio replay, dial U.S. Toll Free (844) 512-2921; International Toll (412) 317-6671 and request to be connected to replay using access code 13743714.
About Alliance Resource Partners, L.P.
ARLP is a diversified energy company that is currently the largest coal producer in the eastern United States, supplying reliable, affordable energy domestically and internationally to major utilities, metallurgical and industrial users. ARLP also generates operating and royalty income from mineral interests it owns in strategic coal and oil & gas producing regions in the United States. In addition, ARLP is evolving and positioning itself as a reliable energy partner for the future by pursuing opportunities that support the advancement of energy and related infrastructure.
News, unit prices and additional information about ARLP, including filings with the Securities and Exchange Commission (“SEC”), are available at www.arlp.com. For more information, contact the investor relations department of ARLP at (918) 295-7673 or via e-mail at investorrelations@arlp.com.
The statements and projections used throughout this release are based on current expectations. These statements and projections are forward-looking, and actual results may differ materially. These projections do not include the potential impact of any mergers, acquisitions or other business combinations that may occur after the date of this release. We have included more information below regarding business risks that could affect our results.
FORWARD-LOOKING STATEMENTS: With the exception of historical matters, any matters discussed in this press release are forward-looking statements that involve risks and uncertainties that could cause actual results to differ materially from projected results. Those forward-looking statements include expectations with respect to our future financial performance, coal and oil & gas consumption and expected future prices, our ability to increase unitholder distributions in future quarters, business plans and potential growth with respect to our energy and infrastructure transition investments, optimizing cash flows, reducing operating and capital expenditures, preserving liquidity and maintaining financial flexibility, and our future repurchases of units and senior notes, among others. These risks to our ability to achieve these outcomes include, but are not limited to, the following: decline in the coal industry’s share of electricity generation, including as a result of environmental concerns related to coal mining and combustion, the cost and perceived benefits of other sources of electricity and fuels, such as oil & gas, nuclear energy, and renewable fuels and the planned retirement of coal-fired power plants in the U.S.; changes in macroeconomic and market conditions and market volatility, and the impact of such changes and volatility on our financial position; changes in global economic and geo-political conditions or changes in industries in which our customers operate; changes in commodity prices, demand and availability which could affect our operating results and cash flows; the outcome or escalation of current hostilities in Ukraine and the Israel-Gaza conflict; the severity, magnitude and duration of any future pandemics and impacts of such pandemics and of businesses’ and governments’ responses to such pandemics on our operations and personnel, and on demand for coal, oil, and natural gas, the financial condition of our customers and suppliers, available liquidity and capital sources and broader economic disruptions; actions of the major oil-producing countries with respect to oil production volumes and prices could have direct and indirect impacts over the near and long term on oil & gas exploration and production operations at the properties in which we hold mineral interests; changes in competition in domestic and international coal markets and our ability to respond to such changes; potential shut-ins of production by operators of the properties in which we hold oil & gas mineral interests due to low commodity prices or the lack of downstream demand or storage capacity; risks associated with the expansion of our operations and properties; our ability to identify and complete acquisitions and to successfully integrate such acquisitions into our business and achieve the anticipated benefits therefrom; our ability to identify and invest in new energy and infrastructure transition ventures; the success of our development plans for our wholly owned subsidiary, Matrix Design Group, LLC, and our investments in emerging infrastructure and technology companies; dependence on significant customer contracts, including renewing existing contracts upon expiration; adjustments made in price, volume, or terms to existing coal supply agreements; the effects of and changes in trade, monetary and fiscal policies and laws; central bank policy actions including interest rates, bank failures and associated liquidity risks; the effects of and changes in taxes or tariffs and other trade measures adopted by the United States and foreign governments; legislation, regulations, and court decisions and interpretations thereof, both domestic and foreign, including those relating to the environment and the release of greenhouse gases, mining, miner health and safety, hydraulic fracturing, and health care; deregulation of the electric utility industry or the effects of any adverse change in the coal industry, electric utility industry, or general economic conditions; investors’ and other stakeholders’ increasing attention to environmental, social, and governance matters; liquidity constraints, including those resulting from any future unavailability of financing; customer bankruptcies, cancellations or breaches to existing contracts, or other failures to perform; customer delays, failure to take coal under contracts or defaults in making payments; our productivity levels and margins earned on our coal sales; disruptions to oil & gas exploration and production operations at the properties in which we hold mineral interests; changes in equipment, raw material, service or labor costs or availability, including due to inflationary pressures; changes in our ability to recruit, hire and maintain labor; our ability to maintain satisfactory relations with our employees; increases in labor costs including costs of health insurance and taxes resulting from the Affordable Care Act, adverse changes in work rules, or cash payments or projections associated with workers’ compensation claims; increases in transportation costs and risk of transportation delays or interruptions; operational interruptions due to geologic, permitting, labor, weather, supply chain shortage of equipment or mine supplies, or other factors; risks associated with major mine-related accidents, mine fires, mine floods or other interruptions; results of litigation, including claims not yet asserted; foreign currency fluctuations that could adversely affect the competitiveness of our coal abroad; difficulty maintaining our surety bonds for mine reclamation as well as workers’ compensation and black lung benefits; difficulty in making accurate assumptions and projections regarding post-mine reclamation as well as pension, black lung benefits, and other post-retirement benefit liabilities; uncertainties in estimating and replacing our coal mineral reserves and resources; uncertainties in estimating and replacing our oil & gas reserves; uncertainties in the amount of oil & gas production due to the level of drilling and completion activity by the operators of our oil & gas properties; uncertainties in the future of the electric vehicle industry and the market for EV charging stations; the impact of current and potential changes to federal or state tax rules and regulations, including a loss or reduction of benefits from certain tax deductions and credits; difficulty obtaining commercial property insurance, and risks associated with our participation in the commercial insurance property program; evolving cybersecurity risks, such as those involving unauthorized access, denial-of-service attacks, malicious software, data privacy breaches by employees, insiders or others with authorized access, cyber or phishing-attacks, ransomware, malware, social engineering, physical breaches, or other actions; and difficulty in making accurate assumptions and projections regarding future revenues and costs associated with equity investments in companies we do not control.
Additional information concerning these, and other factors can be found in ARLP’s public periodic filings with the SEC, including ARLP’s Annual Report on Form 10-K for the year ended December 31, 2022, filed on February 24, 2023,and ARLP’s Quarterly Reports on Form 10-Q for the quarters ended March 31, 2023, June 30, 2023 and September 30, 2023, filed on May 9, 2023, August 8, 2023 and November 8, 2023, respectively. Except as required by applicable securities laws, ARLP does not intend to update its forward-looking statements.
Reconciliation of Non-GAAP Financial Measures
Reconciliation of GAAP “net income attributable to ARLP” to non-GAAP “EBITDA” and “Distributable Cash Flow” (in thousands).
EBITDA is defined as net income attributable to ARLP before net interest expense, income taxes and depreciation, depletion and amortization. Distributable cash flow (“DCF”) is defined as EBITDA excluding equity method investment earnings, interest expense (before capitalized interest), interest income, income taxes and estimated maintenance capital expenditures and adding distributions from equity method investments. Distribution coverage ratio (“DCR”) is defined as DCF divided by distributions paid to partners.
Management believes that the presentation of such additional financial measures provides useful information to investors regarding our performance and results of operations because these measures, when used in conjunction with related GAAP financial measures, (i) provide additional information about our core operating performance and ability to generate and distribute cash flow, (ii) provide investors with the financial analytical framework upon which management bases financial, operational, compensation and planning decisions and (iii) present measurements that investors, rating agencies and debt holders have indicated are useful in assessing us and our results of operations.
EBITDA, DCF and DCR should not be considered as alternatives to net income attributable to ARLP, net income, income from operations, cash flows from operating activities or any other measure of financial performance presented in accordance with GAAP. EBITDA and DCF are not intended to represent cash flow and do not represent the measure of cash available for distribution. Our method of computing EBITDA, DCF and DCR may not be the same method used to compute similar measures reported by other companies, or EBITDA, DCF and DCR may be computed differently by us in different contexts (i.e., public reporting versus computation under financing agreements).
Reconciliation of GAAP “Cash flows from operating activities” to non-GAAP “Free cash flow” (in thousands).
Free cash flow is defined as cash flows from operating activities less capital expenditures and the change in accounts payable and accrued liabilities from purchases of property, plant and equipment. Free cash flow should not be considered as an alternative to cash flows from operating activities or any other measure of financial performance presented in accordance with GAAP. Our method of computing free cash flow may not be the same method used by other companies. Free cash flow is a supplemental liquidity measure used by our management to assess our ability to generate excess cash flow from our operations.
Reconciliation of GAAP “Operating Expenses” to non-GAAP “Segment Adjusted EBITDA Expense” and Reconciliation of non-GAAP ” EBITDA” to “Segment Adjusted EBITDA” (in thousands).
Segment Adjusted EBITDA Expense includes operating expenses, coal purchases, if applicable, and other income or expense. Transportation expenses are excluded as these expenses are passed on to our customers and, consequently, we do not realize any margin on transportation revenues. Segment Adjusted EBITDA Expense is used as a supplemental financial measure by our management to assess the operating performance of our segments. Segment Adjusted EBITDA Expense is a key component of EBITDA in addition to coal sales, royalty revenues and other revenues. The exclusion of corporate general and administrative expenses from Segment Adjusted EBITDA Expense allows management to focus solely on the evaluation of segment operating performance as it primarily relates to our operating expenses. Segment Adjusted EBITDA Expense – Coal Operations represents Segment Adjusted EBITDA Expense from our wholly-owned subsidiary, Alliance Coal, which holds our coal mining operations and related support activities.
Segment Adjusted EBITDA is defined as net income attributable to ARLP before net interest expense, income taxes, depreciation, depletion and amortization and general and administrative expenses. Segment Adjusted EBITDA – Coal Operations represents Segment Adjusted EBITDA from our wholly-owned subsidiary, Alliance Coal, which holds our coal mining operations and related support activities and allows management to focus primarily on the operating performance of our Illinois Basin and Appalachia segments.
Cary P. Marshall Senior Vice President and Chief Financial Officer 918-295-7673 investorrelations@arlp.com