Release – Salem Media Group, Inc. Announces Second Quarter 2023 Total Revenue of $65.8 Million

Research News and Market Data on SALM

August 08, 2023 4:05pm EDT

Related Documents

 AUDIO

Earnings Webcast

10-QFiling

 PDF HTML

XBRL

 ZIP XLS HTML

IRVING, Texas–(BUSINESS WIRE)– Salem Media Group, Inc. (the “company”) (Nasdaq: SALM) released its results for the three and six months ended June 30, 2023.

Second Quarter 2023 Results

For the three months ended June 30, 2023 compared to the three months ended June 30, 2022:

Consolidated

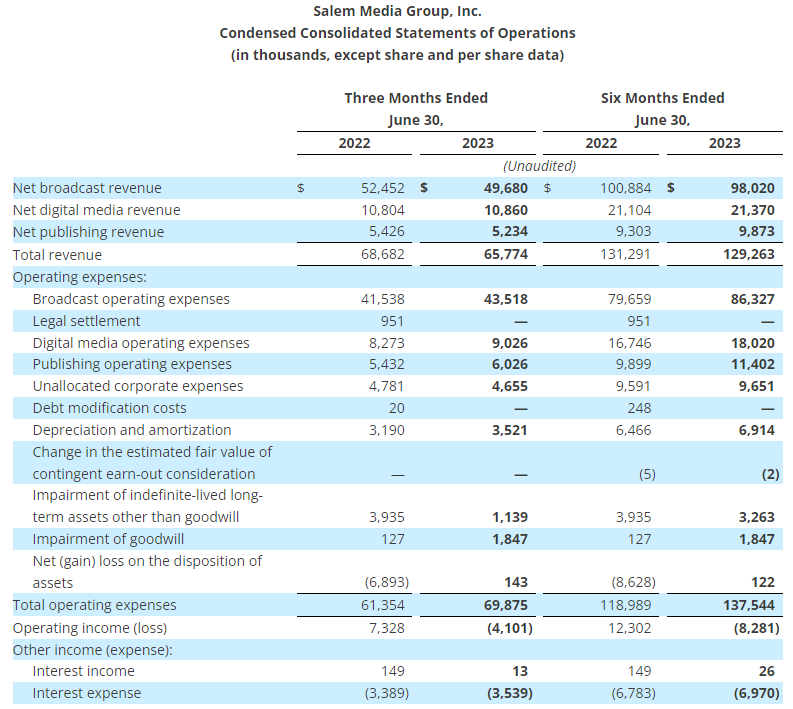
  • Total revenue decreased 4.2% to $65.8 million from $68.7 million;
  • Total operating expenses increased 13.9% to $69.9 million from $61.4 million;
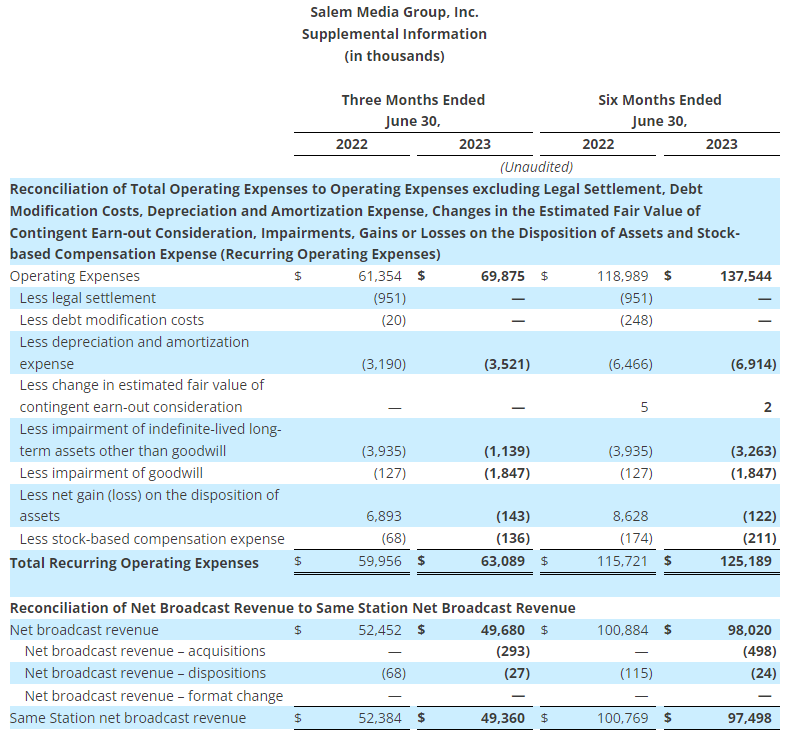
  • Operating expenses, excluding stock-based compensation expense, debt modification costs, gains and losses on the sale or disposition of assets, impairments, depreciation expense and amortization expense (1) increased 5.2% to $63.1 million from $60.0 million;
  • The company had an operating loss of $4.1 million as compared to operating income of $7.3 million;
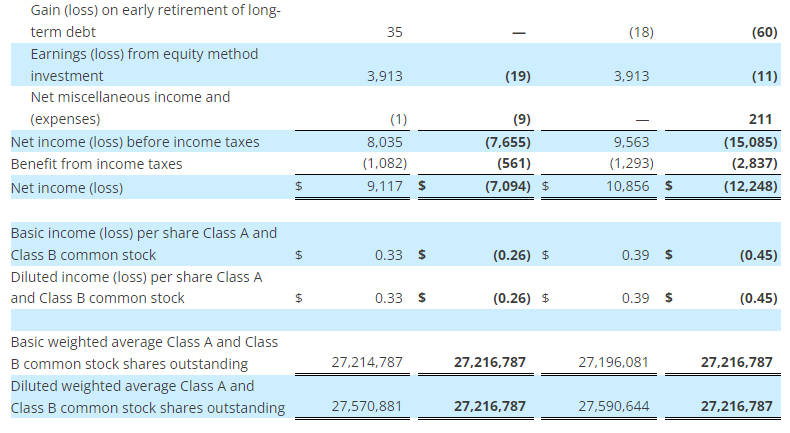
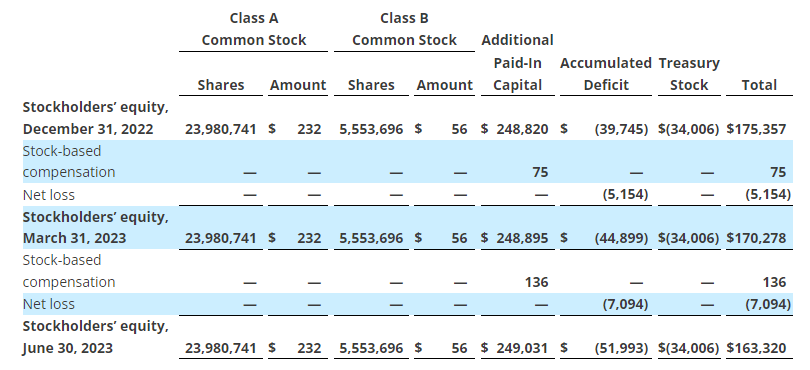
  • The company had a net loss of $7.1 million, or $0.26 net loss per share, compared to net income of $9.1 million, or $0.33 net income per diluted share;
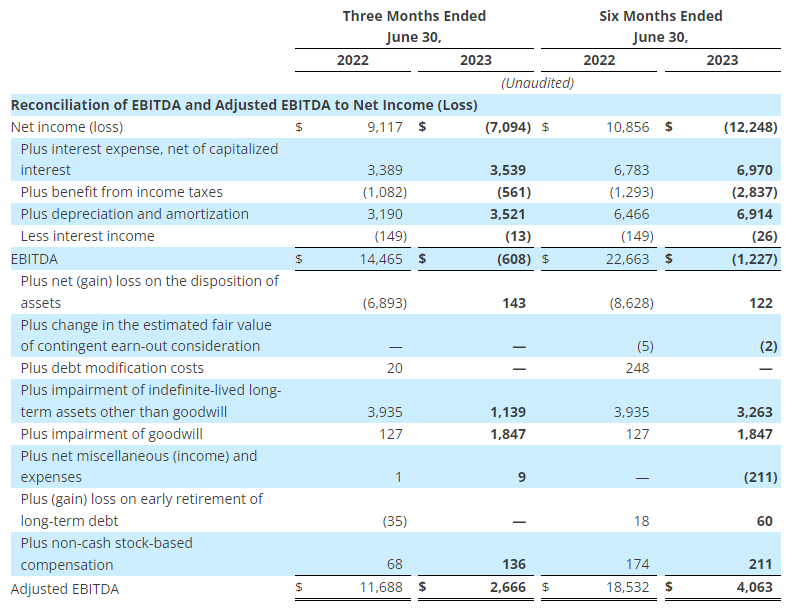
  • EBITDA (1) decreased to $(0.6) million from $14.5 million; and
  • Adjusted EBITDA (1) decreased 77.2% to $2.7 million from $11.7 million.

Broadcast

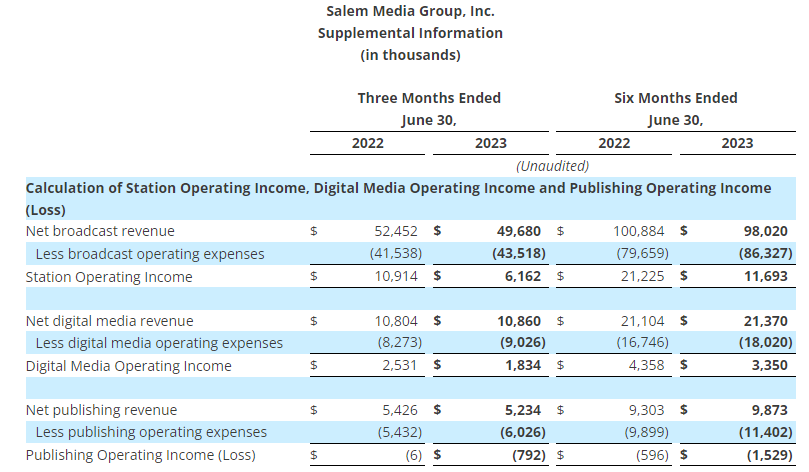
  • Net broadcast revenue decreased 5.3% to $49.7 million from $52.5 million;
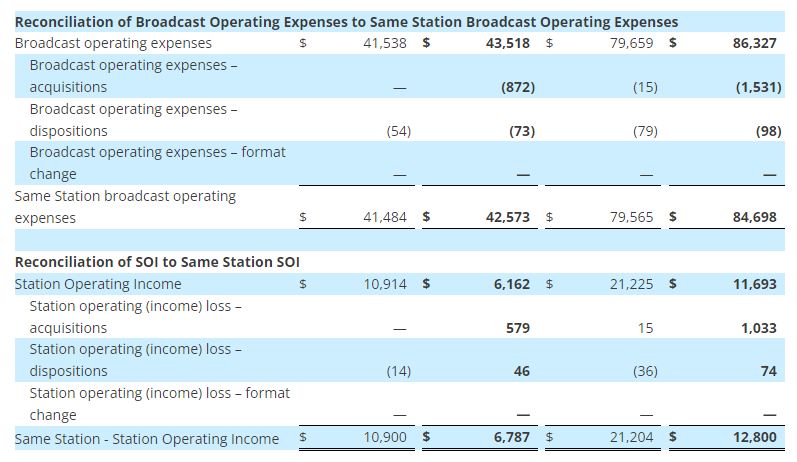
  • Station Operating Income (“SOI”) (1) decreased 43.5% to $6.2 million from $10.9 million;
  • Same Station (1) net broadcast revenue decreased 5.8% to $49.4 million from $52.4 million; and
  • Same Station SOI (1) decreased 37.7% to $6.8 million from $10.9 million.

Digital Media

  • Digital media revenue increased 0.5% to $10.9 million from $10.8 million; and
  • Digital Media Operating Income (1) decreased 27.5% to $1.8 million from $2.5 million.

Publishing

  • Publishing revenue decreased 3.5% to $5.2 million from $5.4 million; and
  • Publishing Operating Loss (1) increased to $0.8 million from $6,000.

Included in the results for the three months ended June 30, 2023 are:

  • A $1.8 million ($1.4 million, net of tax, or $0.05 per share) impairment charge to the value of goodwill in Townhall;
  • A $1.1 million ($0.8 million, net of tax, or $0.03 per share) impairment charge to the value of broadcast licenses in Portland and San Francisco;
  • A $0.1 million ($0.1 million, net of tax) net loss on the disposition of assets; and
  • A $0.1 million non-cash compensation charge ($0.1 million, net of tax) related to the expense of stock options.

Included in the results for the three months ended June 30, 2022 are:

  • A $6.9 million ($5.1 million, net of tax, or $0.19 per diluted share) net gain on the disposition of assets reflects a $6.5 million pre-tax gain on the sale of land used in the company’s Denver, Colorado broadcast operations and a $0.5 million pre-tax gain on the sale of the company’s radio stations in Louisville, Kentucky that was offset by losses from various fixed asset disposals;
  • A $3.9 million ($2.9 million, net of tax, or $0.11 per share) impairment charge to the value of broadcast licenses in Columbus, Dallas, Greenville, Honolulu, Orlando, Portland, and Sacramento;
  • A $0.1 million ($0.1 million, net of tax) goodwill impairment charge; and
  • A $0.1 million ($0.1 million, net of tax) non-cash compensation charge related to the expense of stock options.

Per share numbers are calculated based on 27,216,787 diluted weighted average shares for the three months ended June 30, 2023, and 27,570,881 diluted weighted average shares for the three months ended June 30, 2022.

Year to Date 2023 Results

For the six months ended June 30, 2023 compared to the six months ended June 30, 2022:

Consolidated

  • Total revenue decreased 1.5% to $129.3 million from $131.3 million;
  • Total operating expenses increased 15.6% to $137.5 million from $119.0 million;
  • Operating expenses, excluding gains or losses on the disposition of assets, stock-based compensation expense, debt modification costs, changes in the estimated fair value of contingent earn-out considerationimpairments, depreciation expense and amortization expense (1) increased 8.2% to $125.2 million from $115.7 million;
  • The company had an operating loss of $8.3 million as compared to operating income of $12.3 million;
  • The company recognized $3.9 million in film distribution income from an unconsolidated equity investment in the six months ended June 30, 2022;
  • The company had a net loss of $12.2 million, or $0.45 net loss per share, compared to net income of $10.9 million, or $0.39 net income per diluted share;
  • EBITDA (1) decreased to $(1.2) million from $22.7 million; and
  • Adjusted EBITDA (1) decreased 78.1% to $4.1 million from $18.5 million.

Broadcast

  • Net broadcast revenue decreased 2.8% to $98.0 million from $100.9 million;
  • SOI (1) decreased 44.9% to $11.7 million from $21.2 million;
  • Same station (1) net broadcast revenue decreased 3.2% to $97.5 million from $100.8 million; and
  • Same station SOI (1) decreased 39.6% to $12.8 million from $21.2 million.

Digital media

  • Digital media revenue increased 1.3% to $21.4 million from $21.1 million; and
  • Digital media operating income (1) decreased 23.1% to $3.4 million from $4.4 million.

Publishing

  • Publishing revenue increased 6.1% to $9.9 million from $9.3 million; and
  • Publishing Operating Loss (1) increased 156.5% to $1.5 million from $0.6 million.

Included in the results for the six months ended June 30, 2023 are:

  • A $3.2 million ($2.4 million, net of tax, or $0.09 per share) impairment charge to the value of broadcast licenses in Miami, Portland and San Francisco;
  • A $1.8 million ($1.4 million, net of tax, or $0.05 per share) impairment charge to the value of goodwill in Townhall;
  • A $0.1 million loss on the early retirement of long-term debt associated with the 2024 Notes; and
  • A $0.2 million ($0.1 million, net of tax, or $0.01 per share) non-cash compensation charge related to the expense of stock options.

Included in the results for the six months ended June 30, 2022 are:

  • A $8.6 million ($6.4 million, net of tax, or $0.23 per diluted share) net gain on the disposition of assets relates primarily to the $6.5 million pre-tax gain on the sale of land used in the company’s Denver, Colorado broadcast operations, the $1.8 million pre-tax gain on sale of land used in the company’s Phoenix, Arizona broadcast operations, and $0.5 million pre-tax gain on the sale of the company’s radio stations in Louisville, Kentucky offset by various fixed asset disposals;
  • A $3.9 million ($2.9 million, net of tax, or $0.11 per share) impairment charge to the value of broadcast licenses in Columbus, Dallas, Greenville, Honolulu, Orlando, Portland, and Sacramento;
  • A $0.1 million ($0.1 million, net of tax) goodwill impairment charge;
  • A $0.2 million ($0.2 million, net of tax, or $0.01 per share) charge for debt modification costs; and
  • A $0.2 million ($0.1 million, net of tax) non-cash compensation charge related to the expense of stock options.

Per share numbers are calculated based on 27,216,787 diluted weighted average shares for the six months ended June 30, 2023, and 27,590,644 diluted weighted average shares for the six months ended June 30, 2022.
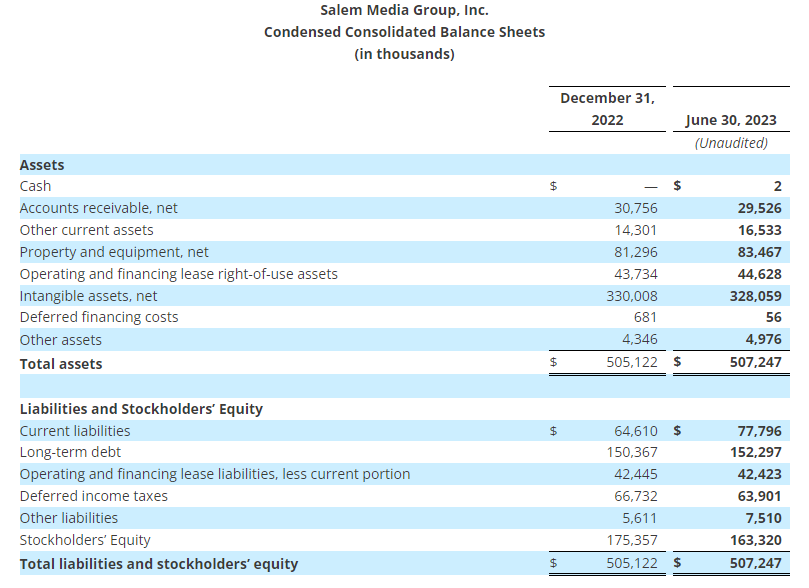
Balance Sheet

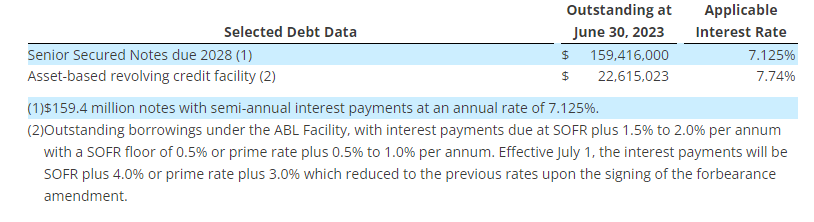
As of June 30, 2023, the company had $159.4 million outstanding on the 7.125% senior secured notes due 2028 (“2028 Notes”) and $22.6 million outstanding on the ABL facility.

Effective June 30, 2023, the company was not in compliance with its fixed charge coverage ratio. On August 7, 2023 the company signed a forbearance whereby the bank agreed not to exercise remedies on the default during the month of August. Additionally, the notional amount of the revolver was reduced from $30.0 million to $25.0 million with a minimum availability of $1.0 million. Finally, the interest rate associated with the revolver increased by two percentage points effective July 1, 2023 through the date of the forbearance amendment.

Acquisitions and Divestitures

The following transactions were completed since April 1, 2023:

  • On July 21, 2023 the company closed the sale of radio station KNTS-AM in Seattle, Washington for $0.2 million.
  • On July 13, 2023 the company closed the sale of radio station KLFE-AM in Seattle, Washington for $0.5 million. Radio station KLFE-AM was being programmed under a Time Brokerage Agreement (“TBA”) as of August 1, 2022.
  • On May 25, 2023, the company entered into a rental income purchase agreement with a related party to sell the assignment of the rents from its Greenville, South Carolina radio transmitter site for $3.5 million commencing on June 1, 2023 resulting in a pre-tax gain of $3.3 million.

Pending transactions:

  • On June 29, 2023 the company entered into an agreement to sell radio station KSAC-FM in Sacramento, California for $1.0 million subject to approval of the Federal Communications Commission (“FCC”). Radio station KSAC-FM will begin being programmed under a TBA on August 1, 2023. Based on its plan to sell the station, the company recorded an estimated pre-tax loss on the sale of assets of $3.3 million at June 30, 2023, reflecting the sales price as compared to the carrying value of the assets and the estimated cost to sell. The company expects to close the sale in the fourth quarter of this year.

Conference Call Information

The company will host a teleconference to discuss its results on August 8, 2023 at 4:00 p.m. Central Time. To access the teleconference, please dial (888) 770-7291, and then ask to be joined into the Salem Media Group Second Quarter 2023 call or listen via the investor relations portion of the company’s website, located at investor.salemmedia.com. A replay of the teleconference will be available through August 22, 2023 and can be heard by dialing (800) 770-2030, passcode 2413416 or on the investor relations portion of the company’s website, located at investor.salemmedia.com.

Follow us on Twitter @SalemMediaGrp.

Third Quarter 2023 Outlook

For the third quarter of 2023, the company is projecting total revenue to decline between 3% and 5% from the third quarter 2022 total revenue of $66.9 million. Excluding the impact of the 2022 political revenue, the company would project total revenue to decline between 1% and 3%. The company is also projecting operating expenses before gains or losses on the sale or disposal of assets, stock-based compensation expense, legal settlement, changes in the estimated fair value of contingent earn-out consideration, impairments, depreciation expense and amortization expense (“Recurring Operating Expenses”) to be between a decrease of 1% and increase of 2% compared to the third quarter of 2022 Recurring Operating Expenses of $60.8 million.

A reconciliation of Recurring Operating Expenses (a non-GAAP measure) to the most directly comparable GAAP measure is not available without unreasonable efforts on a forward-looking basis due to the potential high variability, complexity and low visibility with respect to the charges excluded from this non-GAAP financial measure, in particular, the change in the estimated fair value of earn-out consideration, impairments and gains or losses from the disposition of fixed assets. The company expects the variability of the above charges may have a significant, and potentially unpredictable, impact on its future GAAP financial results.

About Salem Media Group, Inc.

Salem Media Group is America’s leading multimedia company specializing in Christian and conservative content, with media properties comprising radio, digital media and book and newsletter publishing. Each day Salem serves a loyal and dedicated audience of listeners and readers numbering in the millions nationally. With its unique programming focus, Salem provides compelling content, fresh commentary and relevant information from some of the most respected figures across the Christian and conservative media landscape. Learn more about Salem Media Group, Inc. at www.salemmedia.comFacebook and Twitter.

Forward-Looking Statements

Statements used in this press release that relate to future plans, events, financial results, prospects or performance are forward-looking statements as defined under the Private Securities Litigation Reform Act of 1995. Actual results may differ materially from those anticipated as a result of certain risks and uncertainties, including but not limited to the ability of the company to close and integrate announced transactions, market acceptance of the company’s radio station formats, competition from new technologies, inflation and other adverse economic conditions, and other risks and uncertainties detailed from time to time in the company’s reports on Forms 10-K, 10-Q, 8-K and other filings filed with or furnished to the Securities and Exchange Commission. Readers are cautioned not to place undue reliance on these forward-looking statements, which speak only as of the date hereof. The company undertakes no obligation to update or revise any forward-looking statements to reflect new information, changed circumstances or unanticipated events.

(1)Regulation G
 
Management uses certain non-GAAP financial measures defined below in communications with investors, analysts, rating agencies, banks and others to assist such parties in understanding the impact of various items on its financial statements. The company uses these non-GAAP financial measures to evaluate financial results, develop budgets, manage expenditures and as a measure of performance under compensation programs.
 
The company’s presentation of these non-GAAP financial measures should not be considered as a substitute for or superior to the most directly comparable financial measures as reported in accordance with GAAP.
 
Regulation G defines and prescribes the conditions under which certain non-GAAP financial information may be presented in this earnings release. The company closely monitors EBITDA, Adjusted EBITDA, Station Operating Income (“SOI”), Same Station net broadcast revenue, Same Station broadcast operating expenses, Same Station Operating Income, Digital Media Operating Income, Publishing Operating Loss, and operating expenses excluding gains or losses on the disposition of assets, stock-based compensation, changes in the estimated fair value of contingent earn-out consideration, impairments, depreciation and amortization, all of which are non-GAAP financial measures. The company believes that these non-GAAP financial measures provide useful information about its core operating results, and thus, are appropriate to enhance the overall understanding of its financial performance. These non-GAAP financial measures are intended to provide management and investors a more complete understanding of its underlying operational results, trends and performance.
 
The company defines Station Operating Income (“SOI”) as net broadcast revenue minus broadcast operating expenses. The company defines Digital Media Operating Income as net Digital Media Revenue minus Digital Media Operating Expenses. The company defines Publishing Operating Loss as net Publishing Revenue minus Publishing Operating Expenses. The company defines EBITDA as net income before interest, taxes, depreciation, and amortization. The company defines Adjusted EBITDA as EBITDA before gains or losses on the disposition of assets, before debt modification costs, before changes in the estimated fair value of contingent earn-out consideration, before impairments, before net miscellaneous income and expenses, before (gain) loss on early retirement of long-term debt and before non-cash compensation expense. SOI, Digital Media Operating Income, Publishing Operating Loss, EBITDA and Adjusted EBITDA are commonly used by the broadcast and media industry as important measures of performance and are used by investors and analysts who report on the industry to provide meaningful comparisons between broadcasters. SOI, Digital Media Operating Income, Publishing Operating Loss, EBITDA and Adjusted EBITDA are not measures of liquidity or of performance in accordance with GAAP and should be viewed as a supplement to and not a substitute for or superior to its results of operations and financial condition presented in accordance with GAAP. The company’s definitions of SOI, Digital Media Operating Income, Publishing Operating Loss, EBITDA and Adjusted EBITDA are not necessarily comparable to similarly titled measures reported by other companies.
 
The company defines Same Station net broadcast revenue as broadcast revenue from its radio stations and networks that the company owns or operates in the same format on the first and last day of each quarter, as well as the corresponding quarter of the prior year. The company defines Same Station broadcast operating expenses as broadcast operating expenses from its radio stations and networks that the company owns or operates in the same format on the first and last day of each quarter, as well as the corresponding quarter of the prior year. The company defines Same Station SOI as Same Station net broadcast revenue less Same Station broadcast operating expenses. Same Station operating results include those stations that the company owns or operates in the same format on the first and last day of each quarter, as well as the corresponding quarter of the prior year. Same Station operating results for a full calendar year are calculated as the sum of the Same Station operating results for each of the four quarters of that year. The company uses Same Station operating results, a non-GAAP financial measure, both in presenting its results to stockholders and the investment community, and in its internal evaluations and management of the business. The company believes that Same Station operating results provide a meaningful comparison of period over period performance of its core broadcast operations as this measure excludes the impact of new stations, the impact of stations the company no longer owns or operates, and the impact of stations operating under a new programming format. The company’s presentation of Same Station operating results is not intended to be considered in isolation or as a substitute for the financial information prepared and presented in accordance with GAAP. The company’s definition of Same Station operating results is not necessarily comparable to similarly titled measures reported by other companies.
 
For all non-GAAP financial measures, investors should consider the limitations associated with these metrics, including the potential lack of comparability of these measures from one company to another.
 
The Supplemental Information tables that follow the condensed consolidated financial statements provide reconciliations of the non-GAAP financial measures that the company uses in this earnings release to the most directly comparable measures calculated in accordance with GAAP. The company uses non-GAAP financial measures to evaluate financial performance, develop budgets, manage expenditures, and determine employee compensation. The company’s presentation of this additional information is not to be considered as a substitute for or superior to the directly comparable measures as reported in accordance with GAAP.

The company defines EBITDA (1) as net income before interest, taxes, depreciation, and amortization. The table below presents a reconciliation of EBITDA (1) to Net Income (Loss), the most directly comparable GAAP measure. EBITDA (1) is a non-GAAP financial performance measure that is not to be considered a substitute for or superior to the directly comparable measures reported in accordance with GAAP. The company defines Adjusted EBITDA (1) as EBITDA (1) before gains or losses on the disposition of assets,before debt modification costs, before changes in the estimated fair value of contingent earn-out consideration, before impairments, before net miscellaneous income and expenses, before (gain) loss on early retirement of long-term debt, and before non-cash compensation expense. The table below presents a reconciliation of Adjusted EBITDA (1) to Net Income (Loss), the most directly comparable GAAP measure. Adjusted EBITDA (1) is a non-GAAP financial performance measure that is not to be considered a substitute for or superior to the directly comparable measures reported in accordance with GAAP.

Evan D. Masyr
Executive Vice President and Chief Financial Officer
(805) 384-4512
evan@salemmedia.com

Source: Salem Media Group, Inc.

Released August 8, 2023

Release – ACCO Brands Reports Second Quarter 2023 Results; Maintains Full Year Adjusted EPS and Raises Free Cash Flow Guidance

Research News and Market Data on ACCO

  • Reported net sales of $494 million, with gross margin expanding 450 basis points
  • Operating income of $55 million, flat to prior year; adjusted operating income of $66 million grew 14% year over year
  • EPS of $0.27; adjusted EPS of $0.38, above Company’s outlook
  • Net operating cash outflow improved $59 million year to date driven by improved working capital management
  • Maintains full year 2023 adjusted EPS outlook of $1.08 to $1.12
  • Raises full year 2023 free cash flow outlook to at least $110 million
  • Lowered end of year consolidated leverage ratio outlook

August 08, 2023 04:00 PM Eastern Daylight Time

LAKE ZURICH, Ill.–(BUSINESS WIRE)–ACCO Brands Corporation (NYSE: ACCO) today announced its second quarter and first six-month results for the period ended June 30, 2023.

“Our top priority entering 2023 was to restore our margin profile, and I’m pleased to report that we have made great progress on that front in the first half. Second quarter and year-to-date gross margin expanded 450 and 360 basis points, respectively, due to greater traction from our pricing, productivity and restructuring initiatives. This has yielded much better than expected adjusted EPS. The higher operating profits experienced through the first six months give us confidence in our full year 2023 outlook for adjusted EPS and free cash flow. While we are pleased with the strong start of the year, we are more cautious on the second half demand environment. With improved working capital management, we are well positioned to end the year with a lower leverage ratio than previously expected. We remain committed to supporting our quarterly dividend and reducing debt with our strong cash flow” said Boris Elisman, Chairman and Chief Executive Officer of ACCO Brands.

“Our results reflect the resilience of our brands and the transformative actions undertaken to expand our product categories, broaden our geographic reach, bring innovative new consumer-centric products to market and streamline our cost structure. We remain confident that our strategy has us positioned to deliver sustainable organic growth as global economies improve,” concluded Mr. Elisman.

Second Quarter Results

Net sales declined 5.3 percent to $493.6 million from $521.0 million in 2022. Adverse foreign exchange reduced sales by $0.8 million, or 0.2 percent. Comparable sales fell 5.1 percent. Both reported and comparable sales declines were due to reduced volume, reflecting a more challenging macroeconomic environment, especially in our EMEA segment, and weaker global sales of computer accessories.

Operating income was $55.2 million versus $55.4 million in 2022. In 2022, operating income benefitted from income related to a change in the value of the PowerA contingent earnout of $9.4 million, partially offset by $1.9 million in restructuring charges. Adjusted operating income increased 14 percent to $66.2 million from $58.1 million in the prior year. This increase reflects improved gross margin from the effect of cumulative global pricing and cost reduction actions, partially offset by negative fixed cost leverage and higher SG&A expense primarily due to an increase in incentive compensation.

The Company reported net income of $26.4 million, or $0.27 per share, compared with prior year net income of $39.4 million, or $0.40 per share. Reported net income in 2023 reflects higher interest, tax and non-operating pension expenses. Reported net income in 2022 benefited from the items noted above in operating income. Adjusted net income was $36.5 million, or $0.38 per share, compared with $36.0 million, or $0.37 per share in 2022. Adjusted net income reflects the increase in adjusted operating income, partially offset by higher interest and non-operating pension expenses.

Business Segment Results

ACCO Brands North America – Secondquarter segment net sales of $292.6 million decreased 4.6 percent versus the prior year. Adverse foreign exchange reduced sales by 0.5 percent. Comparable sales of $294.2 million were down 4.1 percent. Both decreases reflect softer demand from business and retail customers due to a weaker macroeconomic environment and lower volumes for computer accessories. These factors more than offset stronger pricing, and volume growth in gaming accessories. Timing for some back-to-school sales was earlier than anticipated.

Second quarter operating income in North America was $55.1 million versus $50.7 million a year earlier, and adjusted operating income was $60.7 million compared to $57.2 million a year ago. Both increases reflect the benefit of pricing and cost actions and favorable mix, which more than offset the impact of lower sales and negative fixed cost leverage.

ACCO Brands EMEA – Secondquarter segment net sales of $125.7 million decreased 8.8 percent versus the prior year. Favorable foreign exchange increased sales by 0.3 percent. Comparable sales of $125.3 million decreased 9.1 percent versus the prior-year period. Both reported and comparable sales declines reflect reduced demand due to a weaker environment in the region and lower volumes for technology accessories. This more than offset the effect of cumulative pricing actions.

Second quarter operating income in EMEA was $5.7 million versus a loss of $1.5 million a year earlier, and adjusted operating income was $9.5 million compared to $2.1 million a year ago. The increases in both reported operating income and adjusted operating income reflect improved gross margins from the cumulative effect of price increases and cost savings actions more than offsetting negative fixed cost leverage.

ACCO Brands International – Secondquarter segment sales of $75.3 million decreased 1.6 percent versus the prior year. Favorable foreign exchange increased sales by 0.7 percent. Comparable sales of $74.8 million decreased 2.3 percent versus the year-ago period. Both sales decreases reflect lower volumes due to weaker economies in Asia and Australia, mostly offset by growth in Latin America.

Second quarter operating income in the International segment was $6.7 million versus $6.3 million a year earlier, with the increase due to lower restructuring expense. Adjusted operating income was $8.3 million compared to $8.6 million a year ago.

Six Month Results

Net sales decreased 6.9 percent to $896.2 million from $962.6 million in 2022. Adverse foreign exchange reduced sales by $11.4 million, or 1.2 percent. Comparable sales decreased 5.7 percent. Both reported and comparable sales declines reflect lower volume, especially in EMEA and North America due to the challenging macroeconomic environment, lower sales of technology accessories, and the timing of back-to-school shipments and lower channel inventory compared to a year ago. These more than offset the benefit of price increases across all segments, and volume growth in Latin America.

Operating income of $65.3 million compares to operating income of $62.2 million in 2022, which included a benefit of $6.8 million related to a change in the value of the PowerA contingent earnout. Adjusted operating income of $90.5 million increased from $80.7 million last year. Both reported and adjusted operating income increases reflect the benefit of global price increases and cost reduction initiatives, partially offset by higher SG&A expense primarily due to increased incentive compensation.

Net income was $22.7 million, or $0.23 per share, compared with net income of $36.7 million, or $0.37 per share, in 2022. Reported net income in 2023 reflects higher interest, tax and non-operating pension expenses. Reported net income in 2022 benefitted from the items noted above in operating income. Adjusted net income was $45.0 million, compared with $46.4 million in 2022, and adjusted earnings per share were $0.47 for both year periods. Adjusted net income reflects the increase in adjusted operating income offset by higher interest and non-operating pension expenses.

Capital Allocation and Dividend

Year to date, the Company improved its operating cash outflow by $58.6 million to $39.3 million versus $97.9 million in the prior year, driven primarily by improved working capital management. Adjusted free cash flow improved by $50.1 million and was an outflow of $45.4 million versus an outflow of $95.5 million a year earlier. Adjusted free cash flow in 2022 excludes the contingent earnout payment.

On August 1, 2023, ACCO Brands announced that its board of directors declared a regular quarterly cash dividend of $0.075 per share. The dividend will be paid on September 12, 2023, to stockholders of record at the close of business on August 22, 2023.

Full Year 2023 and Third Quarter Outlook

The Company is updating its full year 2023 outlook and providing a 3Q outlook. For the full year, reported sales are expected to be down 1 percent to 3 percent, including a 1.5 percent positive impact from foreign exchange. The Company is also maintaining its full year adjusted EPS outlook to be in the range of $1.08 to $1.12. Mid-teen growth in adjusted operating income is expected to be partially offset by higher interest and non-cash non-operating pension expenses. The Company is raising its 2023 free cash flow outlook to at least $110 million and expects to end the year with a consolidated leverage ratio of 3.3x to 3.5x, lower than previously expected.

In the third quarter, reported sales are expected to be flat to down 3 percent, which includes approximately a 4 percent positive impact from foreign exchange. Adjusted EPS is expected to be in the range of $0.21 to $0.24, which compares to $0.25 of adjusted EPS in the prior-year third quarter.

Webcast

At 8:30 a.m. ET on August 9, 2023, ACCO Brands Corporation will host a conference call to discuss the Company’s second quarter 2023 results. The call will be broadcast live via webcast. The webcast can be accessed through the Investor Relations section of www.accobrands.com. The webcast will be in listen-only mode and will be available for replay following the event.

About ACCO Brands Corporation

ACCO Brands, the Home of Great Brands Built by Great People, designs, manufactures and markets consumer and end-user products that help people work, learn, play and thrive. Our widely recognized brands include AT-A-GLANCE®, Five Star®, Kensington®, Leitz®, Mead®, PowerA®, Swingline®, Tilibra® and many others. More information about ACCO Brands Corporation (NYSE: ACCO) can be found at www.accobrands.com.

Non-GAAP Financial Measures

In addition to financial results reported in accordance with generally accepted accounting principles (GAAP), we have provided certain non-GAAP financial information in this earnings release to aid investors in understanding the Company’s performance. Each non-GAAP financial measure is defined and reconciled to its most directly comparable GAAP financial measure in the “About Non-GAAP Financial Measures” section of this earnings release.

Forward-Looking Statements

Statements contained herein, other than statements of historical fact, particularly those anticipating future financial performance, business prospects, growth, strategies, business operations and similar matters, results of operations, liquidity and financial condition, are “forward-looking statements” within the meaning of the Private Securities Litigation Reform Act of 1995. These statements are based on the beliefs and assumptions of management based on information available to us at the time such statements are made. These statements, which are generally identifiable by the use of the words “will,” “believe,” “expect,” “intend,” “anticipate,” “estimate,” “forecast,” “project,” “plan,” and similar expressions, are subject to certain risks and uncertainties, are made as of the date hereof, and we undertake no duty or obligation to update them. Because actual results may differ materially from those suggested or implied by such forward-looking statements, you should not place undue reliance on them when deciding whether to buy, sell or hold the Company’s securities.

Our outlook is based on certain assumptions, which we believe to be reasonable under the circumstances. These include, without limitation, assumptions regarding the impact of the war in Ukraine; the impact of inflation and global economic uncertainties, fluctuations in foreign currency exchange rates and acquisitions; and the other factors described below.

Among the factors that could cause our actual results to differ materially from our forward-looking statements are: our ability to successfully execute our restructuring plans and realize the benefits of our productivity initiatives; our ability to obtain additional price increases and realize longer-term cost reductions; the ongoing impact of the COVID-19 pandemic; a relatively limited number of large customers account for a significant percentage of our sales; issues that influence customer and consumer discretionary spending during periods of economic uncertainty or weakness; risks associated with foreign currency exchange rate fluctuations; challenges related to the highly competitive business environment in which we operate; our ability to develop and market innovative products that meet consumer demands and to expand into new and adjacent product categories that are experiencing higher growth rates; our ability to successfully expand our business in emerging markets and the exposure to greater financial, operational, regulatory, compliance and other risks in such markets; the continued decline in the use of certain of our products; risks associated with seasonality; the sufficiency of investment returns on pension assets, risks related to actuarial assumptions, changes in government regulations and changes in the unfunded liabilities of a multi-employer pension plan; any impairment of our intangible assets; our ability to secure, protect and maintain our intellectual property rights, and our ability to license rights from major gaming console makers and video game publishers to support our gaming accessories business; continued disruptions in the global supply chain; risks associated with inflation and other changes in the cost or availability of raw materials, transportation, labor, and other necessary supplies and services and the cost of finished goods; risks associated with outsourcing production of certain of our products, information technology systems and other administrative functions; the failure, inadequacy or interruption of our information technology systems or its supporting infrastructure; risks associated with a cybersecurity incident or information security breach, including that related to a disclosure of personally identifiable information; our ability to grow profitably through acquisitions; our ability to successfully integrate acquisitions and achieve the financial and other results anticipated at the time of acquisition, including planned synergies; risks associated with our indebtedness, including limitations imposed by restrictive covenants, our debt service obligations, and our ability to comply with financial ratios and tests; a change in or discontinuance of our stock repurchase program or the payment of dividends; product liability claims, recalls or regulatory actions; the impact of litigation or other legal proceedings; our failure to comply with applicable laws, rules and regulations and self-regulatory requirements, the costs of compliance and the impact of changes in such laws; our ability to attract and retain qualified personnel; the volatility of our stock price; risks associated with circumstances outside our control, including those caused by public health crises, such as the occurrence of contagious diseases, severe weather events, war, terrorism and other geopolitical incidents; and other risks and uncertainties described in “Part I, Item 1A. Risk Factors” in our Annual Report on Form 10-K for the year ended December 31, 2022, and in other reports we file with the Securities and Exchange Commission.

About Non-GAAP Financial Measures

We explain below how we calculate each of our non-GAAP financial measures and a reconciliation of our current period and historical non-GAAP financial measures to the most directly comparable GAAP financial measures follows.

We use our non-GAAP financial measures both to explain our results to stockholders and the investment community and in the internal evaluation and management of our business. We believe our non-GAAP financial measures provide management and investors with a more complete understanding of our underlying operational results and trends, facilitate meaningful period-to-period comparisons and enhance an overall understanding of our past and future financial performance.

Our non-GAAP financial measures exclude certain items that may have a material impact upon our reported financial results such as restructuring charges, transaction and integration expenses associated with material acquisitions, the impact of foreign currency exchange rate fluctuations and acquisitions, unusual tax items, goodwill impairment charges, and other non-recurring items that we consider to be outside of our core operations. These measures should not be considered in isolation or as a substitute for, or superior to, the directly comparable GAAP financial measures and should be read in connection with the Company’s financial statements presented in accordance with GAAP.

Our non-GAAP financial measures include the following:

Comparable Sales : Represents net sales excluding the impact of material acquisitions, if any, with current-period foreign operation sales translated at prior-year currency rates. We believe comparable sales are useful to investors and management because they reflect underlying sales and sales trends without the effect of material acquisitions and fluctuations in foreign exchange rates and facilitate meaningful period-to-period comparisons. We sometimes refer to comparable sales as comparable net sales.

Adjusted Selling, General and Administrative (SG&A) Expenses : Represents selling, general and administrative expenses excluding transaction and integration expenses related to material acquisitions. We believe adjusted SG&A expenses are useful to investors and management because they reflect underlying SG&A expenses without the effect of expenses related to acquiring and integrating acquisitions that we consider to be outside our core operations and facilitate meaningful period-to-period comparisons.

Adjusted Operating Income/Adjusted Income Before Taxes/Adjusted Net Income/Adjusted Net Income Per Diluted Share: Represents operating income, income before taxes, net income, and net income per diluted share excluding restructuring and goodwill impairment charges, the amortization of intangibles, the amortization of the step-up in value of inventory, the change in fair value of contingent consideration, transaction and integration expenses associated with material acquisitions, non-recurring items in interest expense or other income/expense such as expenses associated with debt refinancing, a bond redemption, or a pension curtailment, and other non-recurring items as well as all unusual and discrete income tax adjustments, including income tax related to the foregoing. We believe these adjusted non-GAAP financial measures are useful to investors and management because they reflect our underlying operating performance before items that we consider to be outside our core operations and facilitate meaningful period-to-period comparisons. Senior management’s incentive compensation is derived, in part, using adjusted operating income and adjusted net income per diluted share, which is derived from adjusted net income. We sometimes refer to adjusted net income per diluted share as adjusted earnings per share or adjusted EPS.

Adjusted Income Tax Expense/Rate: Represents income tax expense/rate excluding the tax effect of the items that have been excluded from adjusted income before taxes, unusual income tax items such as the impact of tax audits and changes in laws, significant reserves for cash repatriation, excess tax benefits/losses, and other discrete tax items. We believe our adjusted income tax expense/rate is useful to investors because it reflects our baseline income tax expense/rate before benefits/losses and other discrete items that we consider to be outside our core operations and facilitates meaningful period-to-period comparisons.

Adjusted EBITDA: Represents net income excluding the effects of depreciation, stock-based compensation expense, amortization of intangibles, the change in fair value of contingent consideration, interest expense, net, other (income) expense, net, and income tax expense, the amortization of the step-up in value of inventory, transaction and integration expenses associated with material acquisitions, restructuring and goodwill impairment charges, non-recurring items in interest expense or other income/expense such as expenses associated with debt refinancing, a bond redemption, or a pension curtailment and other non-recurring items. We believe adjusted EBITDA is useful to investors because it reflects our underlying cash profitability and adjusts for certain non-cash charges, and items that we consider to be outside our core operations and facilitates meaningful period-to-period comparisons.

Free Cash Flow/Adjusted Free Cash Flow: Free cash flow represents cash flow from operating activities less cash used for additions to property, plant and equipment. Adjusted free cash flow represents free cash flow, less cash payments made for contingent earnouts, plus cash proceeds from the disposition of assets. We believe free cash flow and adjusted free cash flow are useful to investors because they measure our available cash flow for paying dividends, funding strategic material acquisitions, reducing debt, and repurchasing shares.

Consolidated Leverage Ratio: Represents balance sheet debt, plus debt origination costs and less any cash and cash equivalents divided by adjusted EBITDA. We believe that consolidated leverage ratio is useful to investors since the company has the ability to, and may decide to use, a portion of its cash and cash equivalents to retire debt.

We also provide forward-looking non-GAAP comparable sales, adjusted earnings per share, free cash flow, adjusted free cash flow, adjusted EBITDA, and adjusted tax rate, and historical and forward-looking consolidated leverage ratio. We do not provide a reconciliation of these forward-looking and historical non-GAAP measures to GAAP because the GAAP financial measure is not currently available and management cannot reliably predict all the necessary components of such non-GAAP measures without unreasonable effort or expense due to the inherent difficulty of forecasting and quantifying certain amounts that are necessary for such a reconciliation, including adjustments that could be made for restructuring, integration and acquisition-related expenses, the variability of our tax rate and the impact of foreign currency fluctuation and material acquisitions, and other charges reflected in our historical results. The probable significance of each of these items is high and, based on historical experience, could be material.

Christopher McGinnis
Investor Relations
(847) 796-4320

Lori Conley
Media Relations
(937) 495-4949

Source: ACCO Brands Corporation

V2X, Inc. (VVX) – A Solid 2Q23 Beat


Wednesday, August 09, 2023

For more than 70 years, Vectrus has provided critical mission support for our customers’ toughest operational challenges. As a high-performing organization with exceptional talent, deep domain knowledge, a history of long-term customer relationships, and groundbreaking technical expertise, we deliver innovative, mission-matched solutions for our military and government customers worldwide. Whether it’s base operations support, supply chain and logistics, IT mission support, engineering and digital integration, security, or maintenance, repair and overhaul, our customers count on us for on-target solutions that increase efficiency, reduce costs, improve readiness, and strengthen national security. Vectrus is headquartered in Colorado Springs, Colo., and includes about 8,100 employees spanning 205 locations in 28 countries. In 2021, Vectrus generated sales of $1.8 billion. For more information, visit the company’s website at www.vectrus.com or connect with Vectrus on Facebook, Twitter, and LinkedIn.

Joe Gomes, Managing Director, Equity Research Analyst, Generalist , Noble Capital Markets, Inc.

Joshua Zoepfel, Research Associate, Noble Capital Markets, Inc.

Refer to the full report for the price target, fundamental analysis, and rating.

Another Excellent Quarter. Driven by expansion of existing programs, new awards, and recompete wins, V2X reported excellent results for 2Q23. Revenue of $977.9 million was up 10.2% on a pro forma basis, and well above our $905 million forecast. Adjusted EBITDA came in at $76.4 million, versus our $64.5 million estimate. Adjusted diluted EPS was $1.01 compared to our $0.74 estimate.

Opportunity Remains Robust. V2X was awarded approximately $2.1 billion of awards in the quarter, with a book-to-bill of 2.2x. Backlog grew 10% to $13 billion. The Company has $5 billion of bids awaiting award and we believe V2X is well positioned to win its fair share. The overall market opportunity exceeds $160 billion.


Get the Full Report

Equity Research is available at no cost to Registered users of Channelchek. Not a Member? Click ‘Join’ to join the Channelchek Community. There is no cost to register, and we never collect credit card information.

This Company Sponsored Research is provided by Noble Capital Markets, Inc., a FINRA and S.E.C. registered broker-dealer (B/D).

*Analyst certification and important disclosures included in the full report. NOTE: investment decisions should not be based upon the content of this research summary. Proper due diligence is required before making any investment decision. 

Salem Media Group (SALM) – Its Back Is Against The Wall, But…


Wednesday, August 09, 2023

Salem Media Group is America’s leading multimedia company specializing in Christian and conservative content, with media properties comprising radio, digital media and book and newsletter publishing. Each day Salem serves a loyal and dedicated audience of listeners and readers numbering in the millions nationally. With its unique programming focus, Salem provides compelling content, fresh commentary and relevant information from some of the most respected figures across the Christian and conservative media landscape.

Michael Kupinski, Director of Research, Equity Research Analyst, Digital, Media & Technology , Noble Capital Markets, Inc.

Jacob Mutchler, Research Associate, Noble Capital Markets, Inc.

Refer to the full report for the price target, fundamental analysis, and rating.

Soft Q2 results. Revenues of $65.8 million were better than our $64.2 million estimate, driven by improved Digital Media and Publishing revenue. Adj. EBITDA of $2.7 million was below our $3.8 million estimate, reflecting higher than expected expenses as the company continues heightened investments to ramp its digital businesses. 

Lowering full year 2023 adj. EBITDA estimate. Flowing through the Q2 results and our Q3 and Q4 revisions, we are largely maintaining our full year 2023 revenue estimate at $261.6 million and lowering our full year 2023 adj. EBITDA estimate from $18.5 million to $16.1 million. We are maintaining our full year 2024 adj. EBITDA estimate of $26.9 million at this time, which conservatively anticipates an influx of roughly $6.8 million in high margin Political advertising. 


Get the Full Report

Equity Research is available at no cost to Registered users of Channelchek. Not a Member? Click ‘Join’ to join the Channelchek Community. There is no cost to register, and we never collect credit card information.

This Company Sponsored Research is provided by Noble Capital Markets, Inc., a FINRA and S.E.C. registered broker-dealer (B/D).

*Analyst certification and important disclosures included in the full report. NOTE: investment decisions should not be based upon the content of this research summary. Proper due diligence is required before making any investment decision. 

Saga Communications, Inc. (SGA) – The Prettiest One At The Dance


Wednesday, August 09, 2023

Saga Communications, Inc. is a broadcast company whose business is primarily devoted to acquiring, developing and operating radio stations, television stations and state radio networks. Saga currently owns or operates broadcast properties in 26 markets, including 61 FM and 30 AM radio stations, 3 state radio networks, 2 farm radio networks, 5 television stations and 4 low power television stations. Saga’s strategy is to operate top billing radio and television stations in mid sized markets, defined as markets ranked (by market revenues) from 20 to 200. Saga’s radio stations employ a myriad of programming formats, including Classic Hits, Adult Contemporary, Active Rock, Oldies, News/Talk, Country and Classical. Saga’s television stations are affiliated with CBS and Fox in Joplin, MO; CBS in Greenville, MS; ABC, Fox, NBC, Telemundo and Univision in Victoria, TX. In operating its stations, Saga concentrates on the development of strong decentralized local management, which is responsible for the day-to-day operations of the stations in their market area and is compensated based on their financial performance as well as other performance factors that are deemed to effect the long-term ability of the stations to achieve financial objectives. Saga began operations in 1986 and became a publicly traded company in December 1992. The stock trades on the NYSE Amex under the ticker symbol “SGA”.

Michael Kupinski, Director of Research, Equity Research Analyst, Digital, Media & Technology , Noble Capital Markets, Inc.

Jacob Mutchler, Research Associate, Noble Capital Markets, Inc.

Refer to the full report for the price target, fundamental analysis, and rating.

Solid Q2 results. Solid Q2 revenue of $29.2 million was 1.7% better than our estimate of $28.7 million. Adj. EBITDA in quarter was $5.8 million, beating our estimate of $5.2 million by 12%. While total revenue was down a modest 2.2% year over year, there were some strong greenshoots: National advertising increased 12%, Non-Traditional Revenue increased 10% and Digital revenue increased an impressive 17%. 

Favorable digital growth trajectory. The company’s digital segment had a strong performance and now comprises 9% of total company revenue. Notably, e-commerce was particularly strong, with revenue growth of over 100%. Additionally, the company is expanding its online newspaper, Clarksville Now, in two new markets. We believe the company’s favorable digital initiatives could accelerate digital revenue growth over the next several quarters. 


Get the Full Report

Equity Research is available at no cost to Registered users of Channelchek. Not a Member? Click ‘Join’ to join the Channelchek Community. There is no cost to register, and we never collect credit card information.

This Company Sponsored Research is provided by Noble Capital Markets, Inc., a FINRA and S.E.C. registered broker-dealer (B/D).

*Analyst certification and important disclosures included in the full report. NOTE: investment decisions should not be based upon the content of this research summary. Proper due diligence is required before making any investment decision. 

MAIA Biotechnology (MAIA) – 2Q23 Reported With Trial Enrollment Making Progress


Wednesday, August 09, 2023

MAIA is a targeted therapy, immuno-oncology company focused on the development and commercialization of potential first-in-class drugs with novel mechanisms of action that are intended to meaningfully improve and extend the lives of people with cancer. Our lead program is THIO, a potential first-in-class cancer telomere targeting agent in clinical development for the treatment of NSCLC patients with telomerase-positive cancer cells. For more information, please visit www.maiabiotech.com.

Robert LeBoyer, Senior Vice President, Equity Research Analyst, Biotechnology, Noble Capital Markets, Inc.

Refer to the full report for the price target, fundamental analysis, and rating.

Second Quarter Reported With Trial Progress. MAIA reported a 2Q23 loss of $(4.5) million or $(0.35) per share, consistent with our expectations. The company gave updates to its Phase 2 THIO-101 clinical trial testing THIO in non-small cell lung cancer (NSCLC), including continued enrollment and survival of patients treated to date. Cash as of June 30, 2023 was $9.1 million.

THIO-101 Trial Update. The THIO-101 trial tests THIO in combination with Libtayo, (cemiplimab, a PD-1 checkpoint inhibitor from Regeneron) giving two mechanisms of action against the cancer cell. Patients in the trial have progressive or relapsing non-small cell lung cancer after being treated with a checkpoint inhibitor. As of July 2023, 35 patients have been enrolled, an increase over the 29 patients last reported in June 2023. We expect top-line Overall Response Rate data in late fall (3Q/4Q) 2023.


Get the Full Report

Equity Research is available at no cost to Registered users of Channelchek. Not a Member? Click ‘Join’ to join the Channelchek Community. There is no cost to register, and we never collect credit card information.

This Company Sponsored Research is provided by Noble Capital Markets, Inc., a FINRA and S.E.C. registered broker-dealer (B/D).

*Analyst certification and important disclosures included in the full report. NOTE: investment decisions should not be based upon the content of this research summary. Proper due diligence is required before making any investment decision. 

FAT Brands Inc. (FAT) – Upping Factory Utilization and Other Business Notes


Wednesday, August 09, 2023

FAT Brands (NASDAQ: FAT) is a leading global franchising company that strategically acquires, markets, and develops fast casual, quick-service, casual dining, and polished casual dining concepts around the world. The Company currently owns 17 restaurant brands: Round Table Pizza, Fatburger, Marble Slab Creamery, Johnny Rockets, Fazoli’s, Twin Peaks, Great American Cookies, Hot Dog on a Stick, Buffalo’s Cafe & Express, Hurricane Grill & Wings, Pretzelmaker, Elevation Burger, Native Grill & Wings, Yalla Mediterranean and Ponderosa and Bonanza Steakhouses, and franchises and owns over 2,300 units worldwide. For more information on FAT Brands, please visit www.fatbrands.com.

Joe Gomes, Managing Director, Equity Research Analyst, Generalist , Noble Capital Markets, Inc.

Joshua Zoepfel, Research Associate, Noble Capital Markets, Inc.

Refer to the full report for the price target, fundamental analysis, and rating.

Factory Utilization. FAT Brands has completed the rollout of cookie offerings at burger portfolio restaurants nationwide, including Fatburger, Johnny Rockets, and Elevation Burger. While consumers will benefit from additional menu choices, the real key is the potential for increased utilization of the manufacturing facility. Recall, this is an asset management will look to monetize and higher utilization will result in increased value for the asset.

Great American Cookie. The cookie concept has opened its 400th location, and operates in 31 states and five countries around the world. In the last two years, the brand has experienced accelerated growth, opening 73 new locations and entering new states such as Alaska, Arizona, Illinois and New Mexico. Just like the cookie roll out to the burger concepts, each additional Great American Cookie location adds to factory utilization.


Get the Full Report

Equity Research is available at no cost to Registered users of Channelchek. Not a Member? Click ‘Join’ to join the Channelchek Community. There is no cost to register, and we never collect credit card information.

This Company Sponsored Research is provided by Noble Capital Markets, Inc., a FINRA and S.E.C. registered broker-dealer (B/D).

*Analyst certification and important disclosures included in the full report. NOTE: investment decisions should not be based upon the content of this research summary. Proper due diligence is required before making any investment decision. 

EuroDry (EDRY) – Shipping rates fall, a vessel is detained, operating costs rise


Wednesday, August 09, 2023

EuroDry Ltd. was formed on January 8, 2018 under the laws of the Republic of the Marshall Islands to consolidate the drybulk fleet of Euroseas Ltd. into a separate listed public company. EuroDry was spun-off from Euroseas Ltd. on May 30, 2018; it trades on the NASDAQ Capital Market under the ticker EDRY. EuroDry operates in the dry cargo, drybulk shipping market. EuroDry’s operations are managed by Eurobulk Ltd., an ISO 9001:2008 and ISO 14001:2004 certified affiliated ship management company and Eurobulk (Far East) Ltd. Inc., which are responsible for the day- to-day commercial and technical management and operations of the vessels. EuroDry employs its vessels on spot and period charters and under pool agreements.

Michael Heim, Senior Vice President, Equity Research Analyst, Energy & Transportation, Noble Capital Markets, Inc.

Refer to the full report for the price target, fundamental analysis, and rating.

Results continue to slide in response to falling shipping rates and a ship detention. Average TCE rates, which showed signs of improving in April, fell in May and June to an average quarterly rate of $12,179/day versus $23,490/day. Eurodry reported that one of its ships was detained for 35 days (out of service 48 days) due to alleged pollution violations resulting in the cancellation of a high-priced charter.

Operating costs rose. Total operating costs ($12.7m versus $10.2m) rose sharply. Higher voyage expenses are related to the ship detention. Management described the rise in vessel operating expenses relative to last year as due to “inflationary increases” although that explanation does not adequately explain the quarter-over-quarter increase ($12.7m versus $11.8m) in costs.


Get the Full Report

Equity Research is available at no cost to Registered users of Channelchek. Not a Member? Click ‘Join’ to join the Channelchek Community. There is no cost to register, and we never collect credit card information.

This Research is provided by Noble Capital Markets, Inc., a FINRA and S.E.C. registered broker-dealer (B/D).

*Analyst certification and important disclosures included in the full report. NOTE: investment decisions should not be based upon the content of this research summary. Proper due diligence is required before making any investment decision. 

CoreCivic, Inc. (CXW) – Post Call Commentary and Updated Models


Wednesday, August 09, 2023

CoreCivic is a diversified, government-solutions company with the scale and experience needed to solve tough government challenges in flexible, cost-effective ways. We provide a broad range of solutions to government partners that serve the public good through high-quality corrections and detention management, a network of residential and non-residential alternatives to incarceration to help address America’s recidivism crisis, and government real estate solutions. We are the nation’s largest owner of partnership correctional, detention and residential reentry facilities, and believe we are the largest private owner of real estate used by government agencies in the United States. We have been a flexible and dependable partner for government for nearly 40 years. Our employees are driven by a deep sense of service, high standards of professionalism and a responsibility to help government better the public good. Learn more at www.corecivic.com.

Joe Gomes, Managing Director, Equity Research Analyst, Generalist , Noble Capital Markets, Inc.

Joshua Zoepfel, Research Associate, Noble Capital Markets, Inc.

Refer to the full report for the price target, fundamental analysis, and rating.

More ICE Funding? CoreCivic had a 45% increase in ICE populations from the ending of Title 42 through July 31, 2023. Further increases in populations will partly depend on funding. Already, DHS has reprogrammed existing funds and, reportedly, will seek $2 billion in supplemental funds to address shortfalls related to border security. The additional funds, if approved, are expected to fund detention spaces, alternative-to-detention tracking programs, and transportation work. Such an increase should benefit CoreCivic, in our view.

And More For Fiscal 2024? In late July, the Homeland Security bill for fiscal 2024 was approved by the full committee in the House. The bill provides $3.55 billion for custody operations, which is more than ever previously appropriated, to fund an average daily ICE detainee population of 41,500, a significant increase from the 34,000 level. While much negotiations remain to be had, such a funding increase would be a strong positive.


Get the Full Report

Equity Research is available at no cost to Registered users of Channelchek. Not a Member? Click ‘Join’ to join the Channelchek Community. There is no cost to register, and we never collect credit card information.

This Company Sponsored Research is provided by Noble Capital Markets, Inc., a FINRA and S.E.C. registered broker-dealer (B/D).

*Analyst certification and important disclosures included in the full report. NOTE: investment decisions should not be based upon the content of this research summary. Proper due diligence is required before making any investment decision. 

ACCO Brands (ACCO) – Second Quarter First Look and Management Transition


Wednesday, August 09, 2023

ACCO Brands Corporation is one of the world’s largest designers, marketers and manufacturers of branded academic, consumer and business products. Our widely recognized brands include AT-A-GLANCE®, Esselte®, Five Star®, GBC®, Kensington®, Leitz®, Mead®, PowerA®, Quartet®, Rapid®, Rexel®, Swingline®, Tilibra®, and many others. Our products are sold in more than 100 countries around the world. More information about ACCO Brands, the Home of Great Brands Built by Great People, can be found at www.accobrands.com.

Joe Gomes, Managing Director, Equity Research Analyst, Generalist , Noble Capital Markets, Inc.

Joshua Zoepfel, Research Associate, Noble Capital Markets, Inc.

Refer to the full report for the price target, fundamental analysis, and rating.

Second Quarter Results. ACCO reported net sales of $493.6 million compared to $521.0 million last year. We projected revenue of $490 million. Adverse foreign exchange reduced sales by $0.8 million, or less than 1%. Comparable sales fell 5.1%. ACCO had net income of $26.4 million, or $0.27 per diluted, compared to $39.4 million, or $0.40, last year. Adjusted EPS was $0.38, above the Company’s outlook. We estimated net income of $20 million or diluted EPS of $0.21.

Change in Guidance. ACCO is changing their outlook for the full year 2023, as sales are expected to be down 1-3% from the previous 4-7%, including a 1.5% positive impact from foreign exchange. The Company is maintaining its adjusted EPS outlook ($1.08-$1.12 range), is raising its free cash flow outlook to at least $110 million from a prior $100 million, and is lowering its expected consolidated leverage ratio of 3.3x to 3.5x from 3.5x to 3.7x. All of these are positive developments that stem from the Company’s restructuring process announced earlier this year, in our view.


Get the Full Report

Equity Research is available at no cost to Registered users of Channelchek. Not a Member? Click ‘Join’ to join the Channelchek Community. There is no cost to register, and we never collect credit card information.

This Company Sponsored Research is provided by Noble Capital Markets, Inc., a FINRA and S.E.C. registered broker-dealer (B/D).

*Analyst certification and important disclosures included in the full report. NOTE: investment decisions should not be based upon the content of this research summary. Proper due diligence is required before making any investment decision. 

Standard and Poor’s Abandons ESG Scoring

Why S&P Global Ratings Dropped Its Alphanumeric ESG Ratings

As evidence that new concepts need to go through a cycle and find their place, S&P Global Ratings has stopped including environmental, social, and governance (ESG) ratings on its reports. S&P Global Ratings is the credit ratings division of Standard & Poor’s. The division specializes in providing company-sponsored research, analysis, credit ratings, and data to assist investors in evaluating the creditworthiness and risk associated with financial instruments and entities.

In an official press release titled, S&P Global Ratings Update On ESG Credit Indicators released this month. The prominent and perhaps best-known Nationally Recognized Statistical Ratings Organization (NRSRO) revealed its decision to discontinue the publication of new ESG credit indicators, and will not be updating those ESG scores previously determined.

Source: S&P Global Ratings, Dated August 4, 2023

S&P defines ESG credit indicators as “those ESG factors that can materially influence the creditworthiness of a rated entity or issue.” The rating agency said in the release that it had initially begun publishing alphanumeric ESG credit indicators for publicly rated entities in some sectors and asset classes in 2021. “These indicators were intended to illustrate and summarize the relevance of ESG credit factors on our rating analysis through the use of an alphanumerical scale,” the agency added, “They supplemented the narrative paragraphs in our credit rating reports where we describe the impact of ESG credit factors on creditworthiness.”

It has been just two years, and S&P has changed its reporting, if not its methodology. The release explained that after further review the “dedicated analytical narrative paragraphs in our credit rating reports are most effective at providing detail and transparency on ESG credit factors material to our rating analysis, and these will remain integral to our reports.” So there is no separate breakout rating, but to the extent that an ESG related factor could impact creditworthiness, S&P will include the discussion in its write-ups, and it will be reflected when appropriate in an institutions’ security ranking.

S&P Global was clear that the immediately implemented policy does not affect its ESG principles criteria or its research and commentary on ESG-related topics, including the influence that ESG factors may have on a companies ability to pay interest and return principal.

Fitch Ratings, chief credit officer, Richard Hunter told Pension and Investments that: “Fitch believes that there are profound limits to what text disclosures can do for investors monitoring an entire portfolio of hundreds of serviced issuers and bonds. This is the second time in less than amonth that the two NRSROs demonstrated very different methodologies. After Fitch Ratings downgraded U.S. backed Treasuries and other obligations, S&P said they would not unless the U.S. was going to miss a payment.

To round out the big three institutional rating agencies,  Moody’s said in a statement that it “incorporates all risks, including those related to ESG, into its credit ratings when they are material, and also publishes ESG scores on a 1 to 5 scale.”

Take Away

The definitions, overall landscape, and actions taken to support sustainability are evolving.  S&P Global Ratings’ decision to not separately rank obligors is a strategic recalibration in its presentation of ESG factors that may impact an entities ability to pay. It believes the credit factors don’t warrant a separate carve-out within their reports – and that clarity and assessing creditworthiness is best discussed and not boiled down to an alphanumeric rating for use by investors.

Paul Hoffman

Managing Editor, Channelchek

Sources

https://www.spglobal.com/_assets/documents/ratings/esg_credit_indicators_mr.pdf

https://www.pionline.com/esg/esg-scores-ended-sp

https://www.marketplace.spglobal.com/en/datasets/s-p-global-esg-scores-(171)?

Retail Investors Await Institutional Investors’ SEC Filings

For the Third Time This Year, Investors Get to Peak Behind the “Smart Money” Curtain

What’s smart money doing?

If retail investors weren’t always eager to know what hedge fund managers, corporate insiders, and others building positions in a stock have been doing, shows like CNBC’s Closing Bell, news sources like Investors Business Daily, and communities like Seeking Alpha would get far less attention. Next week, the most followed institutional investors are expected to make their quarter-end holdings public. This will usher in a lot of buzz around the surprise changes in holdings and even short positions in celebrity investor portfolios.

Popular SEC Filings

The most popular SEC filings from the supposed “smart money” that small investors look to for ideas are:

Form 13D – This is a filing that is required to be made by any person or group that acquires 5% or more of a company’s voting securities. The filing must disclose the person’s or group’s intentions with respect to the company, such as whether they plan to take control of the company or simply invest in it.

Investors may recall Elon Musk’s accumulation of Twitter shares was incorrectly filed on form 13-G which is for passive investors. He later had to amend his filing on 13D as his accumulation of shares was discovered to be predatory.

Form 4 – This is a filing that is required to be made by any officer, director, or 10% shareholder of a company when they buy or sell shares of the company’s stock. The filing must disclose the number of shares bought or sold, the price per share, and the date of the transaction.

This is the filing that the public used to discover that in 2021, Mark Zuckerberg sold Meta (META) shares (Facebook) almost daily for a total of $4.1 billion. The same year Jeff Bezos sold $8.8 billion worth of Amazon (AMZN) stock, mostly during the month of November.

Both of the filing types mentioned above are as needed, they don’t have a recurring season. However, another popular filing is form 13-F, these much anticipated filings occur four times each year.

Form 13F – This is a quarterly report that is required to be filed by institutional investment managers with at least $100 million in assets under management. The report discloses the manager’s equity and other public securities, including the number of shares held, the CUSIP number, and the market value.

Investors will pour over the quarter-end snapshot of the account and measure changes from the prior quarter, especially from investors like Warren Buffett, Bill Ackman, and Cathie Wood for insights. When Michael Burry filed his 13-F in mid May 2022, he had a position showing that he was short Apple (AAPL). Headlines erupted across news sources, and this certainly had an impact on the tech company’s stock price as other investors questioned its high valuation against any positions they may have had.

The Consistency of the 13-F

The SEC 13-F is a regular filing for large funds. Interested investors can generally mark their calendars for when a funds 13-F will be released. The SEC requires a quarterly report filed no later than 45 days from the calendar quarter’s ends. Most popular managers wait until the last minute, as they may not be so eager to share their funds positions any sooner than needed. This means that most 13-F filings are on February 15 (or before), May 15 (or before), August 15 (or before), and November 15 (or before). In 2023, August 15th is next Tuesday. During the second quarter of 2023 there seemed to have been significant sector rotation, and a reduction in short positions among large funds. This will make for above average interest.

Famous Investors that file a Form 13F

The legendary investor Warren Buffett is the CEO of Berkshire Hathaway. His company’s Form 13F filings are closely watched by investors around the world.

Warren Buffett, last filed a 13-F on May 15, 2023

Ray Dalio is the founder of Bridgewater Associates, one of the world’s largest hedge funds. His company’s Form 13F filings are also very popular with investors.

Ray Dalio, founder of Bridgewater Associates, last filed a 13-F on May 15, 2023

Michael Burry is the investor who famously bet against the housing market in the lead-up to the 2008 financial crisis. His company’s Form 13F filings are often seen as positions of a highly regarded contrarian.

Dr. Michael Burry, last filed a 13-F on May 15, 2023

Cathie Wood is the CEO of ARK Invest, a firm that invests in disruptive technologies. Her company’s Form 13F filings are often seen as a bellwether for the future of technology. Wood is always open and transparent about her funds holdings. This may explain why she is among the earliest filers after each quarter-end.

Cathie Wood, last filed a 13-F on July 10, 2023 for the second quarter ended June 31, 2023

Drawbacks to Using Form 13F

While Form 13F filings can be a valuable source of information for investors, it isn’t magic. And if it is going to weigh heavily as part of an investor’s selection process, some drawbacks should be considered.

The information is delayed: Form 13F filings are not real-time information. They are usually filed 45 days after the end of the quarter, so the information is already outdated by the time it is available to the public.

The information is not complete: Form 13F filings only disclose the top 10 holdings of each fund. This means that investors do not have a complete picture of the fund’s portfolio.

It is not always clear if a position is based on expectations for the one holding, or should be viewed in light of the full portfolio, balancing risk and potential reward. For example, an investment manager may be bullish on tech and long a tech megacap with a lower than average P/E ratio and as of the same filing, short a similar amount of a tech megacap with a higher P/E ratio. The fund manager may be bullish on both, and the nature of the positions may indicate an expectation that the P/E ratios are likely to move toward a similar ratio. If there is just a focus on one side (long or short), the investor may read the intentions or expectations wrong.

Take Away

As earnings season fades, the third week in August will provide a mountain of information on what institutional investors were doing during the second quarter. This is a great place to find ideas and understand any changes in flows.

Investors should be cautioned that this is only a June 30th snap shot, and these holdings may have changed days later.’

Paul Hoffman

Managing Editor, Channelchek

Sources

https://fintel.io/search?search=ray+dalio+13-f

https://fintel.io/i13fs/ark-investment-management

https://whalewisdom.com/filer/scion-asset-management-llc

https://www.vrresearch.com/blog/learn-about-hedge-funds-from-13f-filings

https://www.forbes.com/sites/rachelsandler/2022/01/06/mark-zuckerberg-sold-facebook-stock-nearly-every-weekday-last-year-for-almost-11-months/?sh=6cebeeb03f71

https://www.sec.gov/Archives/edgar/data/1418091/000110465922045641/tm2212748d1_sc13da.htm

Release – FAT Brands Completes Cookie Rollout Initiative Across Burger Concepts

Research News and Market Data on FAT

AUGUST 08, 2023

Company-Owned Cookie Dough Facility Now Serving Fatburger and Johnny Rockets

LOS ANGELES, Aug. 08, 2023 (GLOBE NEWSWIRE) — FAT (Fresh. Authentic. Tasty.) Brands Inc., parent company of Fatburger, Johnny Rockets and 15 other restaurant concepts, today announces the rollout of cookie offerings at burger portfolio restaurants nationwide – Fatburger, Johnny Rockets and Elevation Burger.

The sweet menu rollout is a strategic optimization that leverages FAT Brands’ company-owned manufacturing facility, which produces cookie dough and pretzel mix for sister portfolio brands Great American Cookies and Pretzelmaker. Elevation Burger completed its cookie roll-out earlier in April of this year.

“For both Fatburger and Johnny Rockets, we see these additions as a way to further build and enhance our dessert programs,” said Taylor Fischer, Vice President of Marketing of FAT Brands’ Fast Casual Division. “Playing into synergies is at the core of FAT Brands’ DNA. We are thrilled to be able to tap into our cookie dough facility to provide more delicious offerings for our fans.”

For more information or to find a Fatburger near you, please visit www.Fatburger.com. For more information or to find a Johnny Rockets near you, please visit www.JohnnyRockets.com.

About FAT (Fresh. Authentic. Tasty.) Brands

FAT Brands (NASDAQ: FAT) is a leading global franchising company that strategically acquires, markets, and develops fast-casual, quick-service, casual dining, and polished casual dining concepts around the world. The Company currently owns 17 restaurant brands: Round Table Pizza, Fatburger, Marble Slab Creamery, Johnny Rockets, Fazoli’s, Twin Peaks, Great American Cookies, Hot Dog on a Stick, Buffalo’s Cafe & Express, Hurricane Grill & Wings, Pretzelmaker, Elevation Burger, Native Grill & Wings, Yalla Mediterranean and Ponderosa and Bonanza Steakhouses, and franchises and owns over 2,300 units worldwide. For more information on FAT Brands, please visit www.fatbrands.com.

About Fatburger

An all-American, Hollywood favorite, Fatburger is a fast-casual restaurant serving big, juicy, tasty burgers, crafted specifically to each customer’s liking. With a legacy spanning 70 years, Fatburger’s extraordinary quality and taste inspire fierce loyalty amongst its fan base, which includes a number of A-list celebrities and athletes. Featuring a contemporary design and ambience, Fatburger offers an unparalleled dining experience, demonstrating the same dedication to serving gourmet, homemade, custom-built burgers as it has since 1952 – The Last Great Hamburger Stand.

About Johnny Rockets

Founded in 1986 on iconic Melrose Avenue in Los Angeles, Johnny Rockets is a world-renowned, international restaurant franchise that offers high quality, innovative menu items including Certified Angus Beef® cooked-to-order hamburgers, veggie burgers, chicken sandwiches, crispy fries and rich, delicious hand-spun shakes and malts. With over 325 locations in over 25 countries around the globe, this dynamic lifestyle brand offers friendly service and upbeat music contributing to the chain’s signature atmosphere of relaxed, casual fun. For more information, visit www.johnnyrockets.com.

MEDIA CONTACT:
Erin Mandzik, FAT Brands
emandzik@fatbrands.com
860-212-6509