Ocugen, Inc. is a biotechnology company focused on developing and commercializing novel gene therapies, biologicals, and vaccines. The lead product, Covaxin, is a killed-virus vaccine for COVID-19 in-licensed from Bharat Biotech (India). The lead product in its gene therapy program, OCU400, is in Phase 1/2 clinical trials for retinitis pigmentosa.
Robert LeBoyer, Vice President, Research Analyst, Life Sciences , Noble Capital Markets, Inc.
Refer to the full report for the price target, fundamental analysis, and rating.
Bridging Study Shows Equivalence. Ocugen announced that its Phase 2/3 immuno-bridging study for Covaxin met both its co-primary immunogenicity endpoints. The study was designed to demonstrate that vaccination with Covaxin in US patients stimulated immunogenicity that is equivalent to the Phase 3 study conducted by Bharat Biotech in India in 2020. The study also assessed the boosting effect of Covaxin in patients previously receiving an mRNA or viral vector vaccine.
Study Design. The OCU-002 immuno-bridging study was a randomized, placebo-controlled study that enrolled 419 patients at 8 clinical sites. This was intended to test Covaxin in a demographically diverse population of healthy adults in the US with current SARS-CoV-2 strains. Participants received a first dose of Covaxin or placebo followed by a second dose 28 days later. The immune response was evaluated using microneutralization test (MNT) assay by a blinded observer.
Equity Research is available at no cost to Registered users of Channelchek. Not a Member? Click ‘Join’ to join the Channelchek Community. There is no cost to register, and we never collect credit card information.
This Company Sponsored Research is provided by Noble Capital Markets, Inc., a FINRA and S.E.C. registered broker-dealer (B/D).
*Analyst certification and important disclosures included in the full report. NOTE: investment decisions should not be based upon the content of this research summary. Proper due diligence is required before making any investment decision.
Mark Reichman, Senior Research Analyst, Natural Resources, Noble Capital Markets, Inc.
Refer to the full report for the price target, fundamental analysis, and rating.
Lithium from Nevada claystone. Cypress Development is advancing its 100%-owned Clayton Valley Lithium Project in Nevada. Cypress intends to mine claystone, produce a high-grade lithium concentrate solution using a chloride leach process, and apply a licensed direct lithium extraction process based on ion-exchange to produce lithium carbonate suitable for battery producers supplying the growing electric vehicle and battery storage market.
Funding from the U.S. Department of Energy. The U.S. Department of Energy’s (DOE) Loan Programs Office (LPO) recently offered a conditional commitment to lend up to US$700 million to develop Ioneer’s (Nasdaq: IONR) Rhyolite Ridge lithium-boron mining project in Nevada. In our view, the loan reflects the U.S. government’s commitment to assure domestic supplies of lithium and other critical minerals for the growing electric vehicle battery market.
Equity Research is available at no cost to Registered users of Channelchek. Not a Member? Click ‘Join’ to join the Channelchek Community. There is no cost to register, and we never collect credit card information.
This Company Sponsored Research is provided by Noble Capital Markets, Inc., a FINRA and S.E.C. registered broker-dealer (B/D).
*Analyst certification and important disclosures included in the full report. NOTE: investment decisions should not be based upon the content of this research summary. Proper due diligence is required before making any investment decision.
Michael Kupinski, Director of Research, Noble Capital Markets, Inc.
Jacob Mutchler, Research Associate, Noble Capital Markets, Inc.
Refer to the bottom of the report for important disclosures
Overview:Will It Be A Happy New Year? The full impact of the recent increase in interest rates likely have not been fully reflected in the economy. But, many media stocks seem to anticipate that the industry is in a downturn now. Notably, some stocks have recently performed better and the current fundamentals are not falling off of a cliff.
Digital Media: Coming Off Of Its Sugar High?While Google now plans to phase out cookies in the second half of 2024, it is likely that the plan will affect 2023 as marketers and publishers prepare for the deprecation of cookies.
Television Broadcasting: A Watershed Year For Streaming. Streaming has now eclipsed both broadcast TV and cable TV in terms of viewing based on Nielsen data. Recently, Netflix launched a new pricing plan on November 3 which offers a basic tier, with advertising, at a low price point of $6.99. What does this mean for the TV industry?
Radio Broadcasting:Digital Is Bolstering Performance. It has been a bloodbath for Radio stocks, but the fundamentals appear better than the stock performance might suggest. Radio broadcasters with significant digital businesses are anticipated to report favorable pacings in Q1.
Publishing: You Are Golden If You Have Digital. The trouble with the largest newspaper company, Gannett, has created a pall over the group as it struggles to cut expenses. But, companies with substantial digital operations have performed well. We highlight one of our current favorites Lee Enterprises (LEE).
Overview
Will It Be A Happy New Year?
2022 was one of the worse for media stock performance in recent memory, with stocks across traditional and digital media sectors down over 40% or more. Media stocks underperformed the general market, as measured by the S&P 500 Index, which was down a more moderate 19.4% on a comparable basis for the full year 2022. It is typical for media stocks to underperform in a late-stage economic cycle or in the midst of an economic downturn. But, the significant stock declines are stunning. Macro-economic issues including inflation, rising interest rates, and the prospect of a looming economic downturn, all contributed to the poor performance.
The question is “will 2023 be better?” We believe so. There has been recent signs of life. The S&P 500 increased by 7% during the fourth quarter of 2022, marking the first time the Index had increased since fourth quarter of 2021. Notably, the Noble Publishing and Noble MarTech Indices outperformed the general market in the latest quarter. But, the full impact of the recent interest rate increase likely have not been reflected in the economy. Many media stocks seem to anticipate an economic downturn, but current fundamentals do not appear to be in a freefall and may be better than expected. If the economy further deteriorates from the recent or future rate hikes, it appears now that it may adversely affect the second half of 2023. Advertising pacings appear to be holding up well so far in the first half 2023. Notably, media stocks may begin to anticipate an improving economic outlook and overlook the weak fundamental environment in the second half.
Conventional thought anticipates that increasing concerns over an economic recession may prompt mortgage rates to trend lower in 2023. Furthermore, it is possible that the Fed may lower interest rates if inflation moderates, although the Fed is not currently anticipating rate decreases in 2023. Nonetheless, this paints a favorable picture for media stocks in 2023. Traditionally, the best time to buy media stocks is in the midst of an economic downturn. In addition, these consumer cyclical stocks tend to be among the first movers in an early-stage economic cycle and tend to perform well in a moderating interest rate environment. As mentioned earlier, the stocks may currently be oversold given the prospect that the current fundamental
environment is better anticipated.
What is the risk to this favorable outlook? We believe that the resurging Chinese economy may be disruptive. Within the last month, the China’s economy has been reopened from Covid lockdowns, which may put pressure on global energy prices. Such a prospect may make our fight on inflation more stubborn to combat, potentially throwing off our favorable outlook for moderating interest rates. In our view, we are closer to the light at the end of the tunnel than we were last year. Given the prospect that these stocks tend to outperform the market in an early stage economic recovery, we believe it is time for investors to accumulate positions in the media sectors. In this quarterly, we highlight some of our favorite plays in the Digital, Media & Technology space.
Digital Media & Technology
A Year To Forget
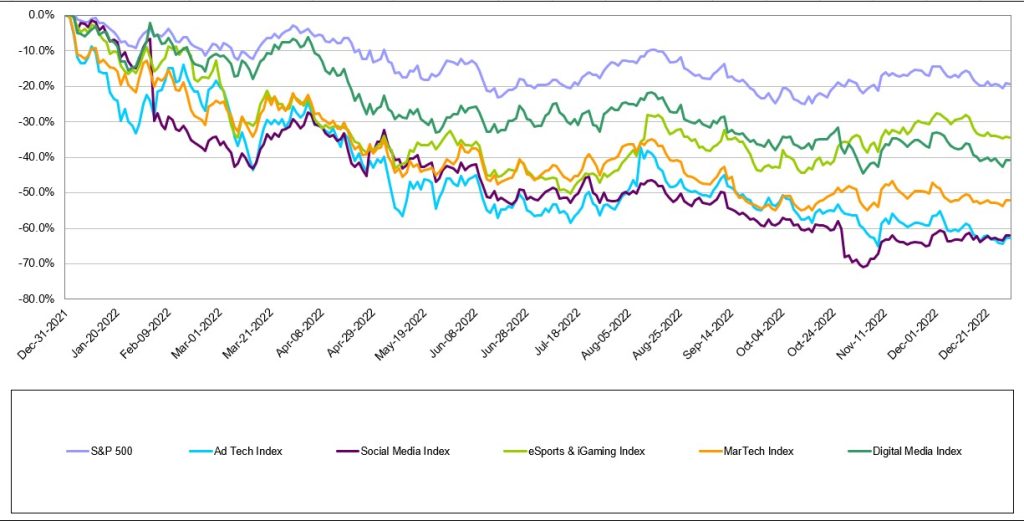
While there were signs of life in the fourth quarter of 2022 for the Internet and Digital Media sectors, 2022 was a year most investors in these sectors would like to forget. As Figure #1 LTM Internet & Digital Technology Performance illustrates, every one of these sectors substantially underperformed the S&P 500 last year. The S&P 500 Index finished the year down 19% which was substantially better than Noble’s Digital Media Index (-41%), MarTech Index (-52%), Social Media Index (-63%), and Ad Tech Index (-63%). Rather than focus on the stocks that significantly underperformed their respective Indices (and there are many), we would rather focus on the three stocks that finished 2022 up for the year.
The shares of one of our favorites, Harte Hanks (HHS)increased by 53% in 2022. The company continued its multi-year turnaround from a highly levered and unprofitable business (in 2019), to a double digit EBITDA margin business with a debt-free balance sheet. Furthermore, we believe that many of the company’s business lines have recession resilient qualities. The other stocks that performed well are Tencent (TME), whichincreased by 21%in 2022. Shares declined earlier in the year as China’s economy slowed as it maintained its Zero Covid-19 lockdowns, but surged in the fourth quarter as it appeared that the company would enjoy an increase in demand as China begins easing Covid restrictions. Finally, the shares of Perion Networks (PERI) increased by 5% in 2022 as Perion consistently beat expectation and raised its guidance throughout 2022. In the first week of 2023, the company once again pre-announced better than expected results for the fourth quarter, and shares are already up 14% since the start of the new year.
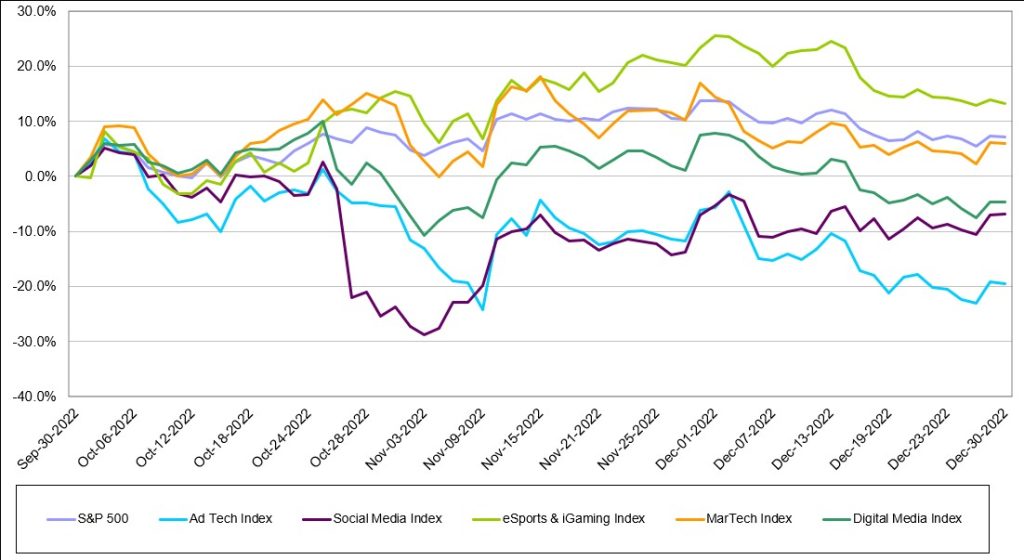
As Figure #2 Q4 Internet & Digital Technology Performancehighlights, there has been signs of life in Noble’s MarTech Index which increased 6%, roughly in-line with the market. In Noble’s MarTech Index, 11 of the 22 stocks in the index posted gains, led by Yext (YEXT; +46%), Shopify (SHOP; +29%), LiveRamp (RAMP; +29%) and Adobe (ADBE; +22%). This marks significant improvement from last quarter when only 4 of the sectors’ stocks finished the quarter in positive territory. MarTech stocks have suffered from a market reset to revenue multiples that began when the Fed began raising rates. MarTech share price declines in the first, second and third quarters of 2022 were mostly driven by multiple compression as investors rotated out of high-flying tech sectors where companies had chased growth at all costs (at the expense of profitability). Only 7 of the MarTech companies in the Index posted positive EBITDA in the latest quarter. Laggards during the fourth quarter were Noble’s Digital Media Index (-5%), Social Media Index (-7%) and Ad Tech Index (-20%).
Coming Off Of A Sugar High?
One of the largest issues affecting the Digital Media industry in 2023 will be the phase out of the use of third-party cookies. Cookies were used to track a user visits on internet sites and that data was used to model behavior. The industry has moved away from the use of cookies as governments and consumers have raised concerns over privacy issues and as consumers wanted more control over how their data is used. Governments have taken a more active role in protecting consumer privacy. California, Colorado, Connecticut, Utah, and Virginia have passed privacy laws. It is likely that there will be a federal privacy law at some point.
How will this affect the industry? We believe that there has been plenty of time to “work around” this issue. The implementation of the phase out of cookies has been delayed several times, originally announced by Google in 2020. Google now plans to phased out cookies in the second half of 2024, if it is not delayed again. As marketers and publishers prepare for the deprecation of cookies, digital advertising likely will be begin to affect 2023.
Digital Advertising Outlook for 2023
Last October eMarketer revised lower its 2023 U.S. digital advertising forecast by $5.5 billion, from $284.1 billion to $278.6 billion. While this sounds like a substantial drop in percentage terms, the 2023 guidance was lowered from 14% growth to 12% growth. Most of the global ad agencies expect digital to continue to grow by double digits driven with dollars migrating to such digital ad channels as retail media and connected TV. Both sectors continue to demonstrate impressive growth.
Retail Media – A retail media network is a retailer-owned advertising service that allows marketers to purchase advertising space across all digital assets owned by a retail business, using the retailer’s first-party data to connect with shoppers throughout the buying journey. eMarketer forecasts that retail media ad spending grew by 31% last year to $41 billion and will grow to $61 billion over the next two years, by which time it will equate to 20% of digital advertising. The leaders in retail media are Amazon, Walmart and Instacart.
Through a retail media network, partners (advertisers) get direct access to a retailer’s customers. The benefit to the partners/advertisers is that they get access to first party data. Retailers own and store this data and allow advertisers to access them through their retail media programs. The first party data is valuable because it is collected at the point of sale allowing brands to get better insights into purchase behavior. Traditional retailers are beginning to follow suit. Traditional retailers with the largest digital audiences (per comScore) are Walmart, Target, Home Depot, Lowes, CVS, Walgreens, Costco and Kohls.
On January 10th, Microsoft announced that it intended to create the industry’s most complete omnichannel retail media technology stack supported by its Promote IQ platform, a company Microsoft acquired in 2019. We expect companies that serve the retail media sector from an Ad Tech or Mar Tech standpoint are poised to benefit from secular trends in this sector.
Connected TV (CTV) – Last July, Nielsen announced that for the first time U.S. streaming TV viewership was larger than cable TV viewing. In July 2022, eMarketer forecast that CTV advertising would reach $18.9 billion in 2022. However, in October 2022, eMarketer raised its forecast for CTV advertising by $2.3 billion to $21.2 billion in 2022. In October, the forecaster also raised its 2023 CTV advertising forecast by $3 billion to $26.9 billion, up from $23.9 billion in the July 2022 forecast. The big increase is due primarily to Netflix and Disney+ announcing they were launching ad supported tiers to their streaming offerings. Ad Tech or Mar Tech companies that serve this market are also poised to benefit from secular viewing trends and the advertising dollars that are migrating to these platforms, discussed later in this report.
The ability to target specific audiences and measure specific outcomes tied to the ads that viewers watched, has made CTV a force to be reckoned with, particularly for those advertisers that are never quite sure which advertising mediums provide the highest returns. Historically, TV was a mass medium used by large brands that wanted massive reach. CTV has opened the door to a wider variety of advertisers that are looking to reach more targeted, even niche, audiences. According to MNTN, a connected TV performance marketing platform, many CTV advertisers are first-time TV advertisers. With new FAST (Free Ad-Supported Streaming TV) channels coming online every month, there is no shortage of supply coming to market. This is just one reason why eMarketer predicts CTV advertising to grow by $10+ billion over the next two years and reach nearly $32 billion in advertising revenue in 2024.
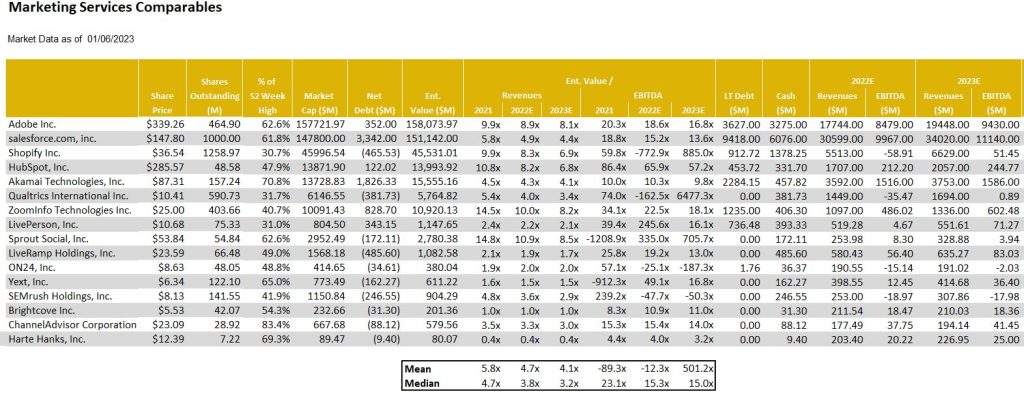
As we look toward 2023, our current favorites include Harte Hanks (HHS) and Direct Digital (DRCT). In terms of Harte Hanks, we believe that the company has recession resilient qualities and that the company’s balance sheet is in a sound position. Furthermore, given the recent rising interest rate environment, the company’s unfunded pension liabilities have dramatically improved. The company may have the opportunity to further mitigate its pension liabilities in 2023. Figure #3 Marketing Tech Comparables highlights, the shares of HHS are trading well below its peers. We believe that there is meaningful upside potential in the shares as it closes the valuation gap with its peers.
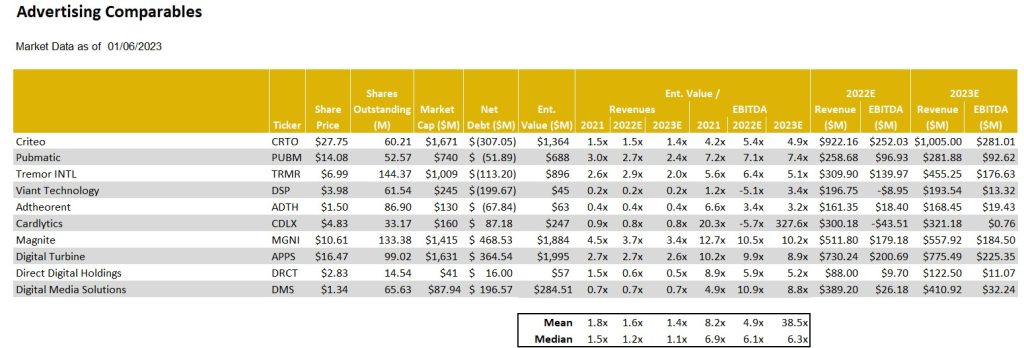
While the deprecation of cookies has created a pall over the sector, we believe that Direct Digital has worked with its Publishers to mitigate this issue. In addition, the company is a relatively small player in a very large marketplace. As such, we believe that the company has the ability to attractively grow in 2023. In our view, the shares appear to be oversold given the continuation of favorable advertising trends. Figure #4 Advertising Tech Comparables illustrates that the DRCT shares trade below the average valuation in its Advertising Marketing peer set. In our view, the valuation should be higher than the averages given that the company has leading industry revenue growth. Closing this valuation gap offers compelling stock appreciation potential.
Figure #1 LTM Internet & Digital Technology Performance
Source: Capital IQ
Figure #2 Q4 Internet & Digital Technology Performance
Source: Capital IQ
Marketing Technology
Figure #3 Marketing Tech Comparables
Source: Eikon, Company filings and Noble estimates
Figure #4 Advertising Tech Comparables
Source: Eikon, Company filings and Noble estimates
Traditional Media
Another Quarter Of Moderating Stock Performance
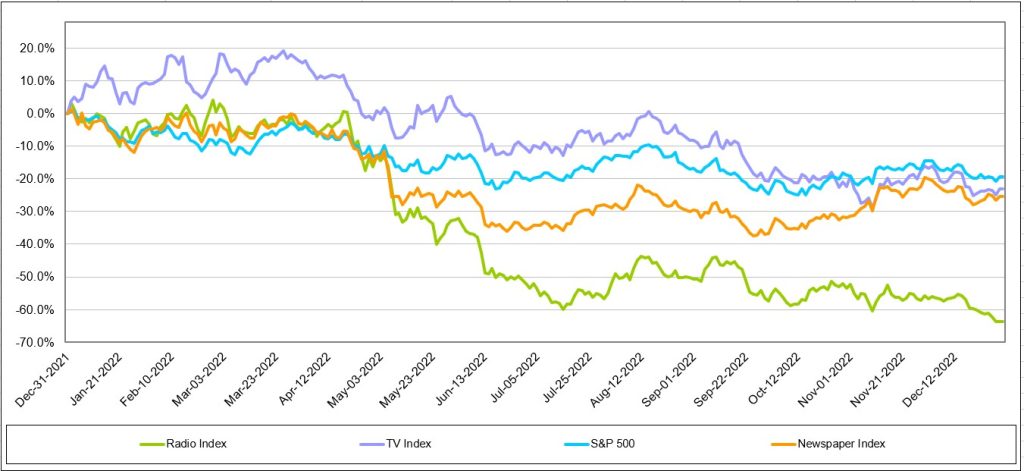
Traditional media stocks underperformed the general market in 2022, with the Radio sector the hardest hit. As Figure #5 LTM Traditional Media Performance Chart illustrates, the Noble Radio Index declined 63.8% versus 19.4% for the general market, as measured by the S&P 500, in a comparable time period. Television and Publishing stocks were down 23.2% and 25.4%, respectively, more in line with the general market returns. But, there were notable company stock performance disparities within each sector, highlighted later in this report. Larger market capitalized companies performed better, which skewed the market cap weighted Indices.
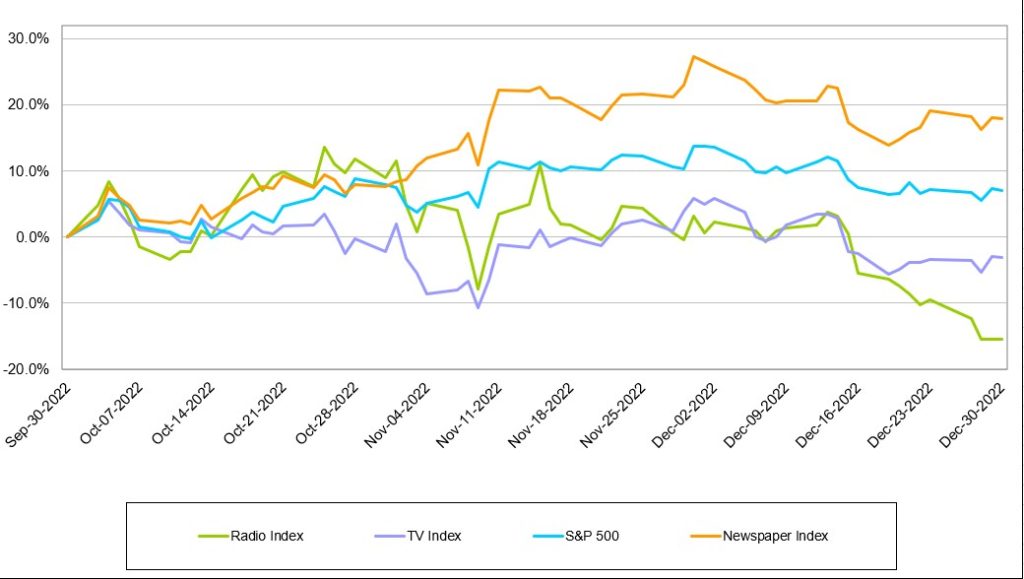
The traditional media stocks seemed to have stabilized from the rapid declines earlier in the year. Possible signs of life in the traditional media sector as well? As Figure #6 Q4 Traditional Media Performance highlights, the Publishing sector once again outperformed the general market in the quarter. The Noble Television Index declined 3.2%, but this decline moderated from the 10.1% decline in the third quarter. The Radio industry still has not yet stabilized, with the Noble Radio Index down 15.4% in the latest quarter.
Figure #5 LTM Traditional Media Performance
Source: Capital IQ
Figure #6 Q4 Traditional Media Performance
Source: Capital IQ
Television Broadcast
Will Netflix suck the air out of the room?
Netflix launched a new pricing plan on November 3 which offers a basic tier, with advertising, at a low price point of $6.99. This compares with its previous tiers of $9.99 and $19.99 for advertising free streaming. While reports indicate that the advertising platform is off to a slow start, we believe that the Netflix move could be disruptive to the Broadcast Television Network business as its lower price basic service gains traction. It is likely that there will be some cannibalization from its higher pricing tier, but we believe that the move will broaden its subscriber base. While Netflix has not considered offering live sports on its streaming platform given the cost of sports rights, we believe that the potential success of its subscription/advertising tier may provide a platform to upend that decision. There is a strong tailwind for viewership trends on streaming platforms, which now exceed that of broadcast television viewing. A decision to enter sports will be a big deal and disruptive to Network broadcasting.
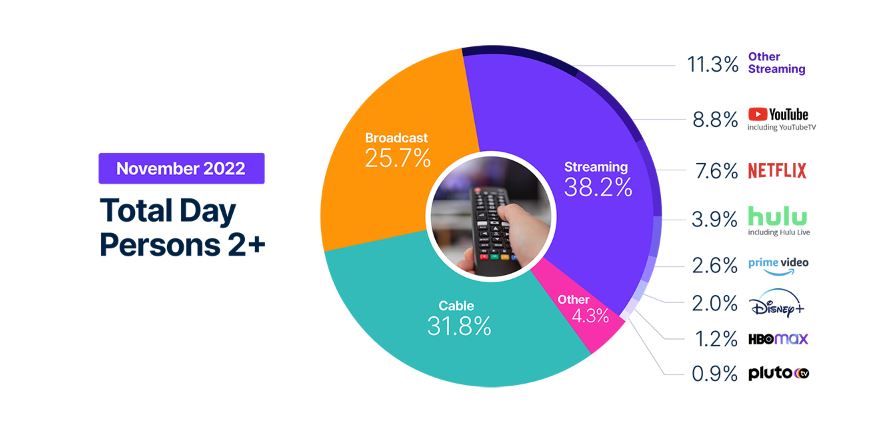
Streaming viewership not only eclipsed television viewing in July 2022, but also that of cable viewing, 34.8% versus 34.4%. In addition, based on the latest Nielsen data from November 2022, streaming now accounts for 38.2% of total viewing with Broadcast at 25.7% and cable at 31.8%. Figure #7 Viewership illustrates the November viewership data. While TV viewership increased 7.8% in November, largely due to sports content, streaming usage year over year was up more than 41%.
Figure #7 Viewership
Source: Nielsen Media Insights
Scripps Plans To Expand Sports
The declining cable subscriptions and cable viewership, especially on regional sports networks, led E.W. Scripps to launch a new Scripps Sports division. This division plans to seek broadcast rights from teams and leagues and bring that programming to broadcast television. The company plans to obtain rights either in local TV markets where it can partner with the the teams or on a national basis, utilizing its distribution on its Ion Network. It is important to note that ION is unique from other networks. Ion’s distribution is nearly 100% of the US television market given that it has local licenses and local towers in every market, it is fully distributed on cable and satellite, and is offered over the air. As such, we believe that Scripps offers a unique proposition to sports teams interested in building its audiences.
Will ATSC 3.0 Stream The Tide?
Furthermore, the broadcast industry appears to be more aggressively ramping its own streaming capabilities with the rollout of its new broadcast standard, ATSC 3.0. ATSC 3.0 is built on the same Internet Protocol as other streaming platforms, and, as such, broadcast programming and internet content can be accessible in the car, on mobile devices, as well as in the home. Importantly, the new standard can handle signal shifting, like if you were moving in a car, and the signal is more robust so you may be able to pick up more stations in a local market. While there are many opportunities for the new standard, services and offerings are still being developed. But, it offers promising opportunities for broadcasters to compete with streaming services in the future. We expect that the industry will make more announcements about this promising technology at future events, including the upcoming NAB Show, April 16-19 in Las Vegas, NV.
Are We In A Recession?
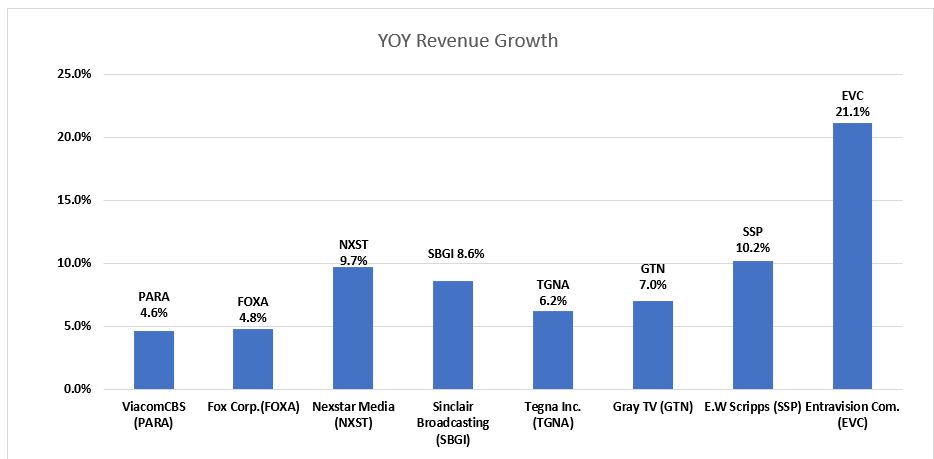
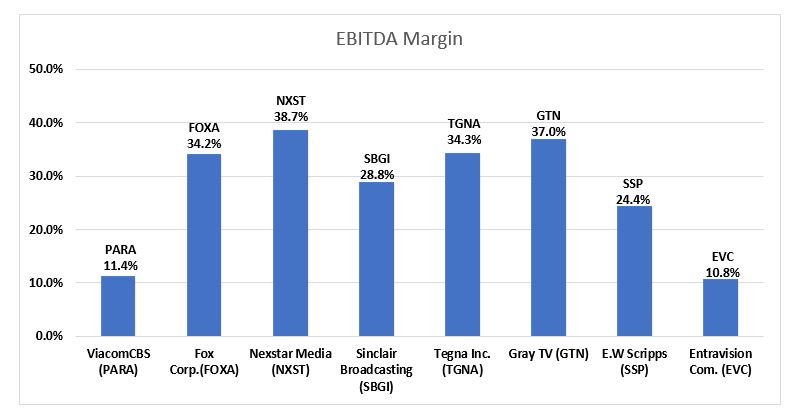
In our view, the current fundamentals may be better than the stocks project. Advertising seems to be holding up, post political advertising. As Figure #8 TV Q3 YoY Revenue Growth highlights, most companies in the industry reported strong Q3 revenue growth, influenced by a large influx of Political advertising. Figure #9 TV Q3 EBITDA Margins illustrates that the largest broadcasters, particularly Nexstar, has the largest EBITDA margins. Notably, the two stocks with the highest revenue growth in the quarter, Entravision and E.W. Scripps, performed the best in the fourth quarter, discussed later.
Notably, Local advertising appears to be fairing better than National advertising. Based on our estimates, core local advertising is expected to be down in the range of 5% to 8%, with core National down as much as the double digits. We believe that some large advertising categories like Auto, Retail and Home Improvement will show improving trends. The first quarter 2023 appears to be consistent with the fourth quarter. Smaller market TV likely will perform at the lower end of the range, while larger market TV will be at the higher end (greater core revenue decline). Broadcast Network is another story, which we believe is weak. Network has potential heightened competition. Figure #8 TV Q3 YoY Revenue Growth
Source: Eikon and Company filings
Figure #9 TV Q3 EBITDA Margins
Source: Eikon and Company filings
As mentioned earlier, the Noble Television Broadcast Index declined 3.2% in the latest quarter, underperforming the general market’s 7.2% advance. Importantly, the 3.2% decline in valuations was a moderation from the 10.1% decline in the third quarter. There were variances in the performance and some notable performers including two of our favorites: E.W. Scripps, which increased 5.8% and Entravision, which increase 5.3%. Both of these companies were among the strongest revenue performers in the third quarter. Among the poor performers was Gray Television, down a significant 33.7% and Sinclair Broadcasting, down 24.0%. With the TV stocks down a significant 23.2% for the year, have the stocks already assumed that the industry is in an economic downturn? We believe that the stock may be oversold based on the prospect that advertising is currently holding up in the first quarter.
Is There Room For Upside?
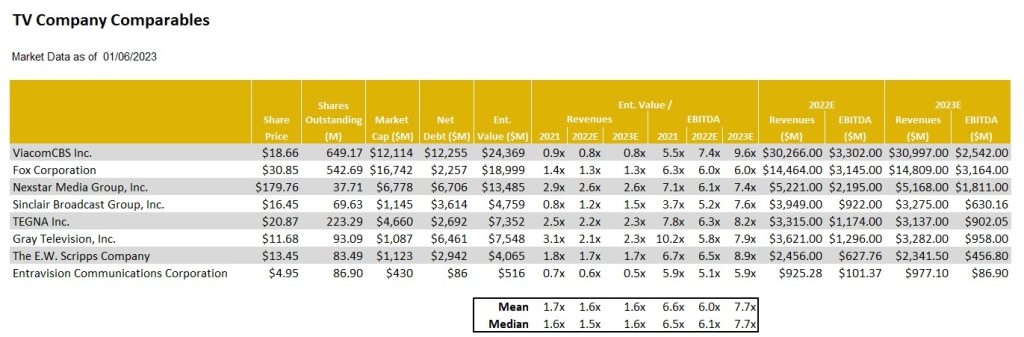
As Figure # 10 TV Industry Comparables highlight, most TV stocks are trading in a tight range of each other. The biggest variance in stock valuations is our current favorite Entravision, trading at 5.9 times EV to our 2023 EBITDA estimate, well below that of its industry peers which trade on average at 7.7 times. We believe that Entravision, which has migrated to become a leading Digital Media company which contributes roughly 80% of its total company revenues, should trade at a premium to its broadcast peers, rather than at a discount. Investors appear to be somewhat confused by the company’s relatively low EBITDA margins, which is a function of how revenues are accounted for in its Digital Media Division. We would also note that its financial profile is among the best in the industry, with a large cash position and modest net debt position of $86 million. As such, EVC leads our favorites in this sector.
Figure #10 TV Industry Comparables
Source: Eikon, Company filings and Nobles estimates
Radio Broadcast
Digital Is Bolstering Performance
The radio industry index was the worst performing index in the traditional media segment, declining 15.4% in the quarter and 63.8% for the year. The radio industry is feeling the pressure that recessionary concerns place on the demand for advertising. In addition to increased competition for audiences from digital music providers and shifting advertising dollars from radio to a more targeted advertising medium, digital media.
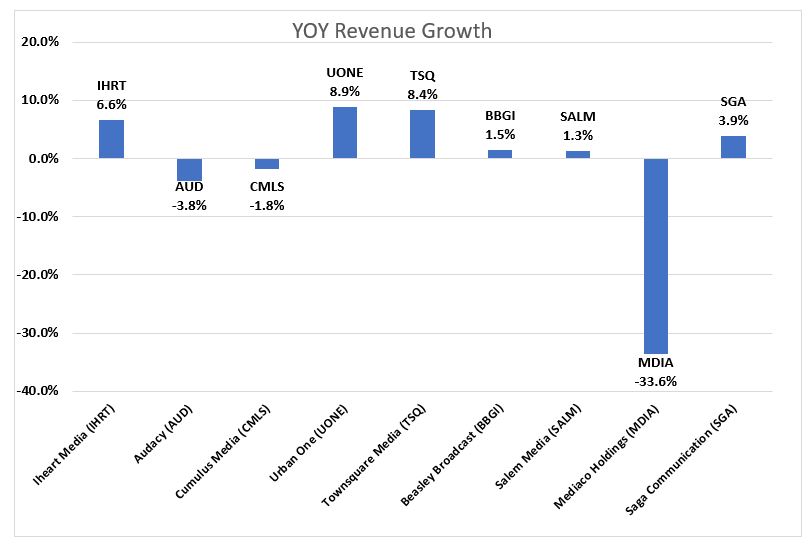
Figure #11 Radio Industry Q3 YoY Revenue Growth chart illustrates the year over year change in revenue for the third quarter. Urban One and Townsquare Media top their peers with revenue growth of 8.9% and 8.4%, respectively. A common theme with companies at the top of the list are diversified revenue streams. Salem Media and Beasley Broadcast Group are in the middle of the pack and are both taking steps to further diversify revenue. Salem has diversified into content creation and digital media and Beasley is continuing to pursue digital agency model. The median Q3 revenue growth rate was 1.5%, and the average revenue growth was -1%. The Average growth rate of -1% is skewed due to the poor performance of Medico holdings. In previous quarters Medico benefited from Covid-19 vaccine advertising campaigns and ticket sales for an annual outdoor live event that took place in Q3 of 2021. Without Covid vaccine advertising and Medico’s concert being held in Q2 2022 instead of Q3 resulted in revenue declining 33.6% on a year over year basis.
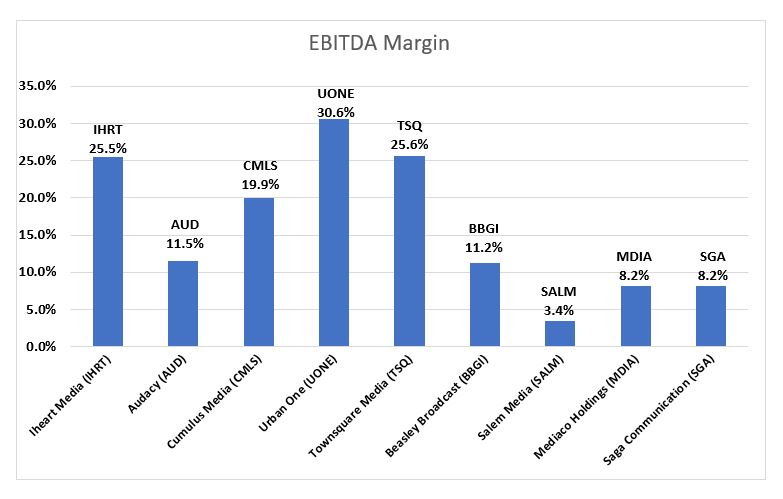
Industry adj. EBITDA margins were healthy, as Figure #12 Radio Industry Q3 EBITDA margins illustrates, Urban one, Townsquare Media and Iheart Media top the list with adj. EBITDA margins of 30.6%, 25.6% and 25.5%, respectively.
After the 2022 calendar year ended, Moody’s downgraded Cumulus Media’s Corporate Family Rating to B3 from B2. Moody’s believes Cumulus Media will face a further decline in advertising demand as the economy weakens. Moody’s could upgrade its rating if leverage decreases to 5x as a result of positive performance and could downgrade its rating if leverage ratio increases to 7x as a result of poor performance. It should be noted that Cumulus has a large cash position of $118 million and could access an additional $100 million through an asset backed loan.
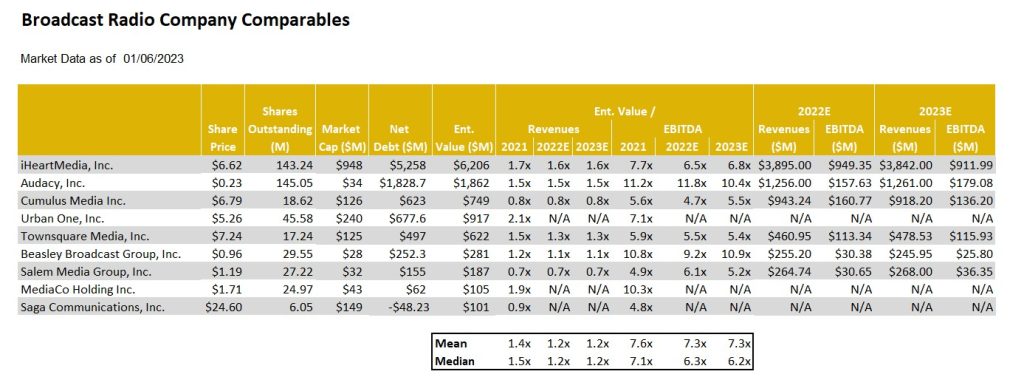
However, there are several companies in the Radio industry with improving leverage profiles. Moreover, we believe that radio companies are diversifying traditional revenue streams with digital revenue. In our view, companies that achieved a greater degree of digital transformation and are better shielded from macroeconomic headwinds. Figure #13 Radio Industry Comparables highlights, Townsquare Media, Cumulus Media, and Salem Media are among the cheapest in the group. For those companies with substantial digital media businesses that are growing rapidly, like Townsquare Media and Beasley, we believe that advertising pacings in the first quarter are likely to be positive. On the low end pacings are expected to be flat to plus 3% and may even be stronger, up 8% or more in the second quarter (although this is too early to bank). In our view, advertising for these companies do not appear to be falling off of a cliff as the stocks seem to project. As such, we believe that the Radio sector appears to be in an oversold position and should have some upside prospects in 2023. Our favorites include TSQ, SALM, BBGI, and CMLS.
Figure #11 Radio Industry Q3 YoY Revenue Growth
Source: Eikon and Company filings
Figure #12 Radio Industry Q3 EBITDA Margins
Source: Eikon and Company filings
Figure #13 Radio Industry Comparables
Source: Eikon, Company filings and Nobles estimates
Publishing
Illustrated above in Figure #6 Q4 Traditional Media Performance, the Publishing stocks had a pretty good quarter, up 17.9% as measured by the Noble Publishing Index versus the general market as measured by the S&P 500 Index up 7.1%. But the largest stocks in the index, New York Times and News Corp, were the only stocks that were up in the sector. Given that the Noble Publishing Index is market cap weighted, it was the reason that the Index was up in the quarter. Importantly, one of our favorites, Lee Enterprises was down a very modest 2.3% in the quarter. Again, the relatively favorable performance of the index was primarily due to its largest constituents, News Corp. and The New York Times, which rebounded from -29.7% and -39.1%, respectively in Q2, to -3% and +3%, respectively, in Q3 and then up 16.8% and 16.3%, respectively, in Q4.
We believe that Gannett, the nation’s largest newspaper company, continues to create a pall over the publishing group as it continues to struggle to manage cash flows with its heavy debt burden. In August, the company announced a round of lay offs of 400 employees and then announced another 200 in December. We believe that the company is trying to shore up its cash flow amidst a weak fundamental environment. Not surprisingly, the GCI shares were among the worse performers in the sector in the latest quarter, down 30%. To a large extent, the stock performance in the latest quarter reflected the various company results in Q3.
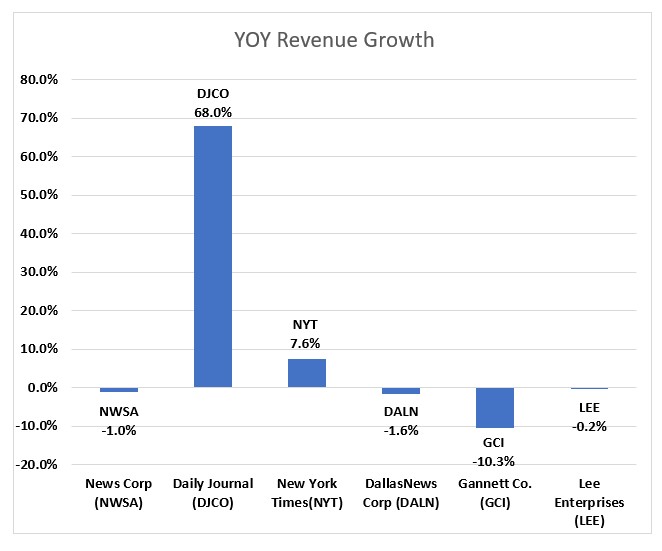
As Figure #14 Publishing Industry Q3 YoY Revenue Performance chart illustrates, Q3 publishing revenue declined on average 1.1%, which excludes the strong revenue growth of the Daily Journal. The company benefited from its Journal Technologies consulting fees which bolstered revenues in its fiscal Q4 results. In addition, during the year, the company sold marketable securities for roughly $80.6 million, realizing net gains of $14.2 million. As such, we have backed out the extraordinary results of the Daily Journal from our industry averages. Notably, Gannett had the weakest revenue performance in the latest quarter, down 10%.
The notable exceptions to the overall weak industry revenue performance was The New York Times, up 7.5% in Q3 revenues, which reflected a moderation in revenue growth from the prior quarter of an increase of 11.5%. News Corp, declined 1%, which was well below the 7.3% gain in the prior quarter. Importantly, Lee Enterprises fiscal quarter revenue was down a modest 0.2%, a sequential improvement from the modest 0.7% decrease in the prior fiscal quarter. We believe that Lee’s digital strategy continues to gain traction and that the company is very close to an inflection point toward revenue growth. We continue to note that Lee’s digital subscriptions currently lead the industry. The company has exceeded all of its peers in terms of digital subscription growth in the past 11 consecutive quarters. Furthermore, over 50% of its advertising is derived from digital. Currently, roughly 30% of the company total revenues are derived from Digital, still short of the 55% at The New York Times, but closing the gap.
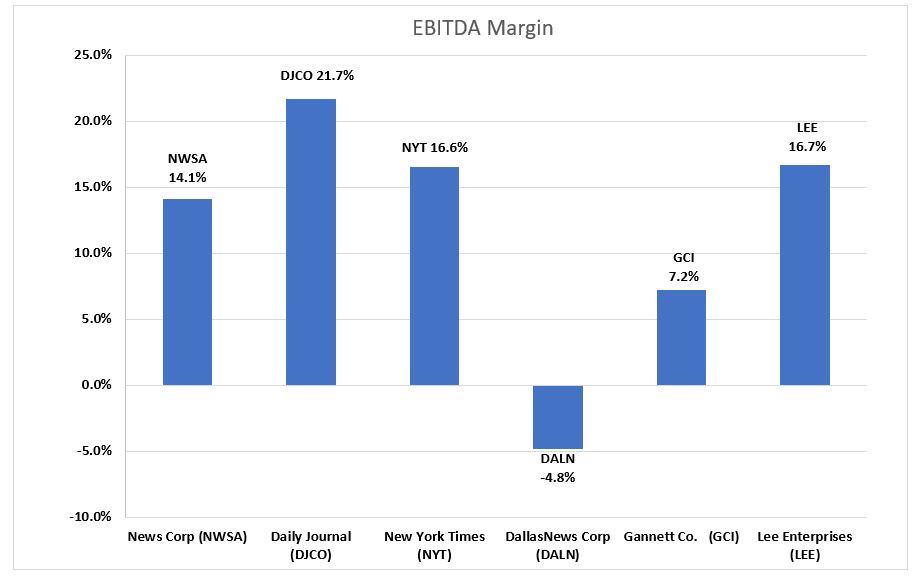
Not only is Lee performing well on the Digital revenue front, it has industry leading margins. As Figure #15 Publishing Industry Q3 EBITDA Margins illustrates, Lee’s Q3 EBITDA margins were industry leading at 16.7%, again, excluding the extraordinary results at the Daily Journal which benefited from marketable securities trading. We believe that Lee’s margins are notable given that it demonstrates that the company is managing its margins in spite of the investments in its Digital Media businesses. Its margins place it on pare with its Digital Media focused peers, such as the New York Times.
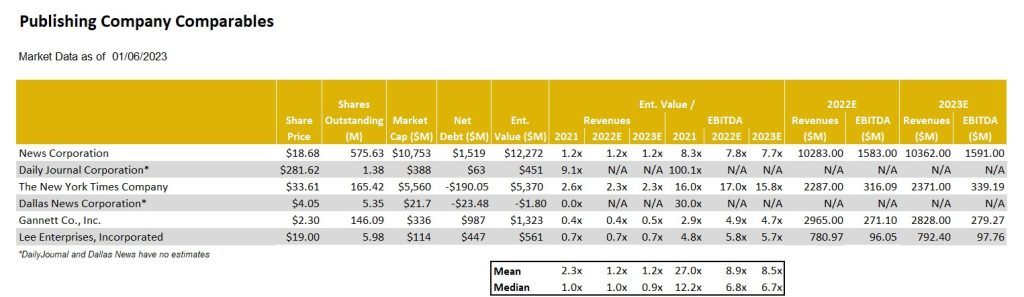
As Figure #16 Publishing Industry Comparables chart illustrates, the LEE shares trade at an average industry multiple of 5.7 times Enterprise Value to our 2023 adj. EBITDA estimate. Notably, the company is closing the gap with its Digital Media revenue contribution to that of New York Times. The New York Times carries a significantly higher stock valuation, currently trading at an estimated 15.8 times EV to 2023 adj. EBITDA. We believe that the valuation gap with the New York Times should close. As such, we view the LEE shares as among our favorites in the industry.
Figure #14 Publishing Industry Q3 YoY Revenue Growth
Source: Eikon and Company filings
Figure #15 Publishing Industry Q3 EBITDA Margins
Source: Eikon and Company filings
Figure #16 Publishing Industry Comparables
Source: Eikon, Company filings and Nobles estimates.
For additional disclosures and information on companies mentioned in this report, please click on the company name:
All statements or opinions contained herein that include the words “we”, “us”, or “our” are solely the responsibility of Noble Capital Markets, Inc.(“Noble”) and do not necessarily reflect statements or opinions expressed by any person or party affiliated with the company mentioned in this report. Any opinions expressed herein are subject to change without notice. All information provided herein is based on public and non-public information believed to be accurate and reliable, but is not necessarily complete and cannot be guaranteed. No judgment is hereby expressed or should be implied as to the suitability of any security described herein for any specific investor or any specific investment portfolio. The decision to undertake any investment regarding the security mentioned herein should be made by each reader of this publication based on its own appraisal of the implications and risks of such decision.
This publication is intended for information purposes only and shall not constitute an offer to buy/sell or the solicitation of an offer to buy/sell any security mentioned in this report, nor shall there be any sale of the security herein in any state or domicile in which said offer, solicitation or sale would be unlawful prior to registration or qualification under the securities laws of any such state or domicile. This publication and all information, comments, statements or opinions contained or expressed herein are applicable only as of the date of this publication and subject to change without prior notice. Past performance is not indicative of future results. Noble accepts no liability for loss arising from the use of the material in this report, except that this exclusion of liability does not apply to the extent that such liability arises under specific statutes or regulations applicable to Noble. This report is not to be relied upon as a substitute for the exercising of independent judgement. Noble may have published, and may in the future publish, other research reports that are inconsistent with, and reach different conclusions from, the information provided in this report. Noble is under no obligation to bring to the attention of any recipient of this report, any past or future reports. Investors should only consider this report as single factor in making an investment decision.
IMPORTANT DISCLOSURES
This publication is confidential for the information of the addressee only and may not be reproduced in whole or in part, copies circulated, or discussed to another party, without the written consent of Noble Capital Markets, Inc. (“Noble”). Noble seeks to update its research as appropriate, but may be unable to do so based upon various regulatory constraints. Research reports are not published at regular intervals; publication times and dates are based upon the analyst’s judgement. Noble professionals including traders, salespeople and investment bankers may provide written or oral market commentary, or discuss trading strategies to Noble clients and the Noble proprietary trading desk that reflect opinions that are contrary to the opinions expressed in this research report. The majority of companies that Noble follows are emerging growth companies. Securities in these companies involve a higher degree of risk and more volatility than the securities of more established companies. The securities discussed in Noble research reports may not be suitable for some investors and as such, investors must take extra care and make their own determination of the appropriateness of an investment based upon risk tolerance, investment objectives and financial status.
Company Specific Disclosures
The following disclosures relate to relationships between Noble and the company (the “Company”) covered by the Noble Research Division and referred to in this research report. Noble is not a market maker in any of the companies mentioned in this report. Noble intends to seek compensation for investment banking services and non-investment banking services (securities and non-securities related) with any or all of the companies mentioned in this report within the next 3 months
ANALYST CREDENTIALS, PROFESSIONAL DESIGNATIONS, AND EXPERIENCE
Senior Equity Analyst focusing on Basic Materials & Mining. 20 years of experience in equity research. BA in Business Administration from Westminster College. MBA with a Finance concentration from the University of Missouri. MA in International Affairs from Washington University in St. Louis. Named WSJ ‘Best on the Street’ Analyst and Forbes/StarMine’s “Best Brokerage Analyst.” FINRA licenses 7, 24, 63, 87
WARNING
This report is intended to provide general securities advice, and does not purport to make any recommendation that any securities transaction is appropriate for any recipient particular investment objectives, financial situation or particular needs. Prior to making any investment decision, recipients should assess, or seek advice from their advisors, on whether any relevant part of this report is appropriate to their individual circumstances. If a recipient was referred to Noble Capital Markets, Inc. by an investment advisor, that advisor may receive a benefit in respect of transactions effected on the recipients behalf, details of which will be available on request in regard to a transaction that involves a personalized securities recommendation. Additional risks associated with the security mentioned in this report that might impede achievement of the target can be found in its initial report issued by Noble Capital Markets, Inc.. This report may not be reproduced, distributed or published for any purpose unless authorized by Noble Capital Markets, Inc..
RESEARCH ANALYST CERTIFICATION
Independence Of View All views expressed in this report accurately reflect my personal views about the subject securities or issuers.
Receipt of Compensation No part of my compensation was, is, or will be directly or indirectly related to any specific recommendations or views expressed in the public appearance and/or research report.
Ownership and Material Conflicts of Interest Neither I nor anybody in my household has a financial interest in the securities of the subject company or any other company mentioned in this report.
More Singles and Doubles for Investors in Biotech Expected (Few Home Runs)
Biotech has been highlighted by us a few times in recent weeks because of the potential the current financial dynamics could have for companies and investors. This past weekend, fresh out of the JP Morgan Health conference, a number of major publications have echoed a similar sentiment. A weekend piece in Barron’s in particular, caught my attention — its overall conclusion is the same as our readers have seen on Channelchek, but the path taken to get to the conclusion is somewhat different.
Health Landscape
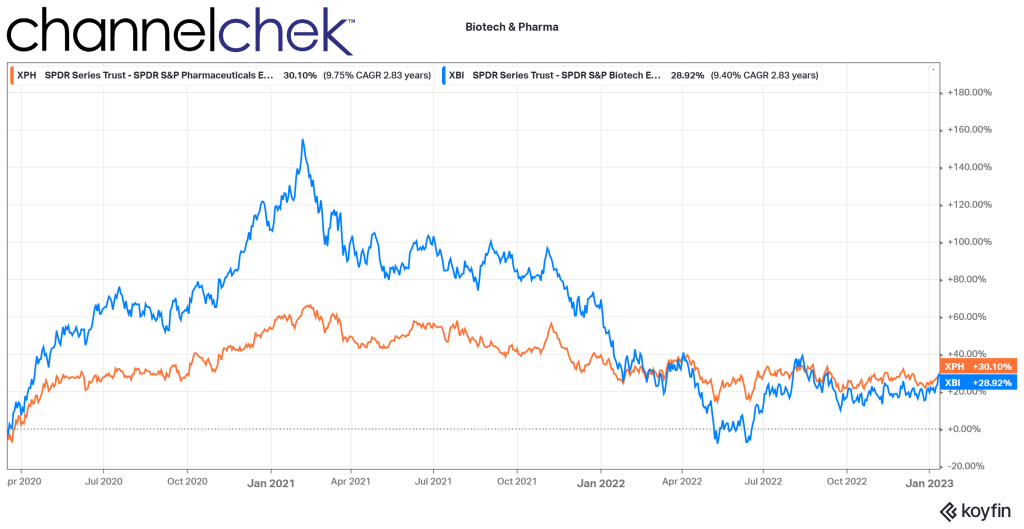
From March 2020 until February 2021, biotech stocks were on a tear. The increase of 155%, as measured by the XBI, can be attributed to the intense focus on healthcare during the period. Higher demand for anything healthcare-related drove share prices among the companies in this sector. This went a long way to provide capital to companies whose very nature are high costs and low revenue. The strength of the sector brought up the deserving, along with others that benefitted from biotech’s overall momentum.
The peak was nearly two years ago. Just as interest in biotech strengthened less than deserving companies, the weakness that followed has brought down many companies that would likely be valued much higher if not for the “throw the baby out with the bathwater” effect, especially with so many sector index fund investors.
This weakness must have been a painful transition for management of companies that are enthusiastic about the prospects of their research and development but now find they may be in survival mode and now spend more time pitching their story and plans while hoping for an overall rise in interest in the sector.
Biotech Mood 2023
The challenge for smaller biotech and medical device companies, which ordinarily spend many years developing products, while benefiting from few or none on the market, is that current valuations have made it a steeper uphill battle to raise new funds for their work and if they do, they may over dilute current shares.
There is a change in the mood of life sciences companies. the Barron’s article, titled, Tanking Biotech Stocks Will Mean a Big Year for Deals. Who Could Benefit? wrote, “With reality setting in, it’s a buyer’s market for companies looking for acquisitions and partnerships, according to the pharmaceutical and medical technology execs who gathered at the J.P. Morgan healthcare investor conference.” JP Morgan describes this annual event as the largest and most informative healthcare investment symposium in the industry. It connects global industry leaders, emerging fast-growth companies, innovative technology creators and members of the investment community.
The conference had been on hiatus for a couple of years in response to pandemic concerns. Certainly there was a lot of new and interesting information to be absorbed and understood.
An overall impression coming from this 41st health symposium is that management of the cash-starved small firms are in a situation where they either have to make a deal with a partner or acquirer or perish. The realization has set in that terms or prices they may have once been able to command are not today’s reality.
Geoff Martha , CEO of Medtronic (MDT), a medical device manufacturer, is quoted as telling Barron’s “We’re getting lots of calls from companies that literally we talked to six months ago.” He explained, back we’d offer, “we’ll buy you for X amount,” and the response would be, “No way, we’re worth [two times that].” The Medtronic CEO said they are now calling back trying to restart the conversations.
Speaking about the terms now expected, the chief financial officer of Gilead Sciences (GILD) is quoted as saying, “It’s changed completely in terms of both the deal structures they’ll contemplate, the valuations that they’re thinking about,”
Large pharmaceutical companies such as Gilead have the means to provide a non-dilutive source of funds; they are coming off a number of very profitable years and are looking for more rewarding uses of their cash. This doesn’t mean they are willing to cut large acquisition checks; the current trend seems to be more partnering deals – collaborations that keep the best ideas moving forward.
The risk-reward analysis by the large pharmaceutical companies is versus low-return financial assets on the balance sheet. “We can make a lot of investments because it’s not high cost,” says Anat Ashkenazi, CFO of Eli Lilly (LLY). “And we know some of these will fail, some will succeed. That’s how we operate.”
This has ushered in a health industry where large companies with cash to spend are capable of placing many well analyzed bets on future devices and drugs from small companies that now must make a deal or risk perishing.
Take Away
When a small biotech company gets an infusion of cash from collaborating with a big pharmaceutical company, its stock typically reacts very positively. This is not the same level of reaction as an outright purchase, but worthwhile just the same. There is an atmosphere where these partnerships and collaborations are likely to occur with more frequency. This could add to the number of small biotech stock potential winners early in 2023.
Discover Inner Details from the Health Symposium
Investors eager to discover more about the companies at the JPM conference, what was said, where the industry is going, and actionable investor possibilities, can immerse themselves in this info deeper next week.
Here’s how.
Noble Capital Markets’ equity analysts and investment bankers attended the meetings, lunches, cocktail events, and interviewed company management. Next week they will share their collective takeaways. It is perhaps better than having endured the unusually bad weather yourself in San Francisco, get more information here!
Can the S&P Hold Above 4,000? Will Fed Presidents Change Market Expectations?
The S&P 500 closed on the cusp of 4,000 last week; while this is still nearly 800 points from an all-time-high if it should break through and hold, it could have positive psychological value for equity markets.
Two reports this week that have the potential to drive direction are both released on Wednesday. They are the December numbers on retail sales and the Fed’s Beige Book. Earnings season is also in full swing beginning this week. The reporting results of companies such as Netflix on Thursday may have an impact and set the stage for specific sectors and markets.
The Beige Book will provide a sense of economic conditions across the 12 Federal Reserve Districts, measuring the period between late November and early January. The tone of the last three releases points toward the US economy sitting on the brink of recession. There will be information on how interest rates are impacting housing markets and the strength of the labor market in different districts. The evidence in the report could mean the difference between a 0.25% increase or a 0.50% increase after the FOMC meeting held on January 31 through February 1.
Monday 1/16
US Markets and Government Offices closed (MLK Jr. Day).
Tuesday 1/17
8:30 AM ET, The Empire State Manufacturing Index disappointed in December with a reading of minus 11.2. The estimate for January is less negative minus 7.5. It tallies, each first of the month, the same pool of roughly 200 manufacturing executives (usually the CEO or the president) responses to a questionnaire on an assortment of indicators from the previous month.
3:00 PM ET, John Williams, the President of the Federal Reserve Bank of New York will be speaking. The New York Fed President is a particularly influential voting member of the FOMC. There is the possibility of insight into how that member may have changed their leaning on policy, which could impact markets.
Wednesday 1/18
8:30 AM ET, PPI- Final Demand Numbers will be released for December; they are expected to have fallen 0.1 percent on the month for a year-over-year increase of 6.8%. This would compare with a 7.4% year-over-year level in November.
8:30 AM ET, Retail Sales are expected to fall 0.9% in December on top of November’s weaker-than-expected 0.6% decline. Ex-vehicle sales slipped 0.2% in November, with this measure expected to fall 0.5% in December. When excluding both vehicles and gasoline, sales are expected to read 0.1% higher.
9:00 AM ET, the President of the Atlanta Fed, Raphael Bostic, will be speaking. Any time a voting member of the FOMC is speaking publicly, there is the potential for insight into how that member may have adjusted their leaning on policy. Atlanta Fed events are often broadcast live on this YouTube channel.
9:15 AM ET, Industrial Production has been contracting, and further the contraction is expected to continue with a consensus loss estimate of 0.1% for December. Manufacturing output is expected to fall 0.2%.
9:30 AM ET, the Chief Executive Officer of the St. Louis Fed, James Bullard, will be speaking.
10:00 AM ET, Business inventories in November are expected to rise 0.4% following a 0.3% build in October.
2:00 PM ET, Beige Book Release.
Thursday 1/19
8:30 AM ET, December’s annualized rates are expected at 1.358 million for starts and 1.380 million for permits which would compare with 1.427 and 1.342 million in November.
8:30 AM ET, Jobless claims for the January 14 week are expected to rise slightly to 215,000 versus 205,000 and 206,000 in the two prior weeks.
8:30 AM ET, The Philadelphia Fed manufacturing index is expected to come in at minus 10.0 in January. This report has been contracting for six of the last seven reports.
9:00 AM ET, Federal Reserve Bank of Boston Fed President Susan Collins is scheduled to speak.
The debt ceiling may be reached as per US Treasury Secretary Janet Yellen.
Friday 1/20
• 10:00 AM ET, Existing home sales in December are expected to have declined further to a 3.955 million annualized rate versus November’s lower-than-expected 4.090 million.
1:00 PM ET, Better World Acquisition (BWAC) will be interviewed in a C-Suite style interview. A video will be made available here on Channelchek.
What Else
The Federal Reserve members can impact longer-term interest rates by impacting expectations they set through their speeches. Some say their voices have been drowned out by analysts and media reporting. For this reason, Fed rhetoric may become elevated as we approach the next FOMC meeting that begins late month.
Earnings season begins to ramp up just as a major index at psychologically important levels. This could be what sets the tone for the stock market and various sectors for the first quarter.
NEW YORK, NY / ACCESSWIRE / January 13, 2023 / Engine Gaming and Media, Inc. (“Engine” or the “Company”) (NASDAQ:GAME) (TSXV:GAME),a data-driven, gaming, media and influencer marketing platform company, today announced the company will now be releasing results before market open on Tuesday, January 17, 2023 and will hold a conference call at 8:45 a.m. Eastern Time the same day.
Please dial in at least 10 minutes before the start of the call to ensure timely participation.
A playback of the call will be available through January 24, 2023, on Engine Gaming and Media, Inc.’s Investor Relations website at ir.enginemediainc.comor via telephone replay by dialing 1-844-512-2921 or 1-412-317-6671. The Access Code is 13735206.
About Engine Gaming and Media, Inc.
Engine Gaming and Media, Inc. (NASDAQ:GAME) (TSXV:GAME) provides unparalleled live streaming data and social analytics, influencer relationship management and monetization, and programmatic advertising to support the world’s largest video gaming companies, brand marketers, ecommerce companies, media publishers and agencies to drive new streams of revenue. The company’s subsidiaries include Stream Hatchet, the global leader in gaming video distribution analytics; Sideqik, a social influencer marketing discovery, analytics, and activation platform; and Frankly Media, a digital publishing platform used to create, distribute, and monetize content across all digital channels. Engine Gaming generates revenue through a combination of software-as-a-service subscription fees, managed services, and programmatic advertising. For more information, please visit www.enginegaming.com.
Cautionary Statement on Forward-Looking Information
This news release contains forward-looking statements. Forward-looking statements involve known and unknown risks, uncertainties and other factors which may cause the actual results, performance or achievements of Engine to be materially different from any future results, performance or achievements expressed or implied by the forward-looking statements. Often, but not always, forward-looking statements can be identified by the use of words such as “plans”, “expects” or “does not expect”, “is expected”, “estimates”, “intends”, “anticipates” or “does not anticipate”, or “believes”, or variations of such words and phrases or state that certain actions, events or results “may”, “could”, “would”, “might” or “will” be taken, occur or be achieved. In respect of the forward-looking information contained herein, Engine has provided such statements and information in reliance on certain assumptions that management believed to be reasonable at the time. Forward-looking information involves known and unknown risks, uncertainties and other factors which may cause the actual results, performance or achievements stated herein to be materially different from any future results, performance or achievements expressed or implied by the forward-looking information. Actual results could differ materially from those currently anticipated due to a number of factors and risks. Accordingly, readers should not place undue reliance on forward-looking information contained in this news release.
The forward-looking statements contained in this news release are made as of the date of this release and, accordingly, are subject to change after such date. Engine does not assume any obligation to update or revise any forward-looking statements, whether written or oral, that may be made from time to time by us or on our behalf, except as required by applicable law.
Neither the TSX Venture Exchange nor its Regulation Services Provider (as that term is defined in policies of the TSX Venture Exchange) accepts responsibility for the adequacy or accuracy of this release.
Company Contact: Lou Schwartz 647-725-7765
Investor Relations Contact: Shannon Devine MZ North America Main: 203-741-8811 GAME@mzgroup.us
FLORHAM PARK, N.J., Jan. 13, 2023 (GLOBE NEWSWIRE) — PDS Biotechnology Corporation (Nasdaq: PDSB), a clinical-stage immunotherapy company developing a growing pipeline of targeted immunotherapies for cancer and infectious disease, today announced that its management will participate in a fireside chat at the B. Riley Securities 3rd Annual Oncology Conference being held virtually on January 18-19, 2023.
B. Riley Securities 3rd Annual Oncology Conference Fireside Chat: Thursday, January 19, 2023 Time: 1:00 PM EST Virtual viewers: Livestream
About PDS Biotechnology PDS Biotech is a clinical-stage immunotherapy company developing a growing pipeline of targeted cancer and infectious disease immunotherapies based on our proprietary Versamune® and Infectimune™ T cell-activating technology platforms. We believe our targeted Versamune® based candidates have the potential to overcome the limitations of current immunotherapy by inducing large quantities of high-quality, potent polyfunctional tumor specific CD4+ helper and CD8+ killer T cells. To date, our lead Versamune® clinical candidate, PDS0101, has demonstrated the potential to reduce tumors and stabilize disease in combination with approved and investigational therapeutics in patients with a broad range of HPV-expressing cancers in multiple Phase 2 clinical trials. Our Infectimune™ based vaccines have also demonstrated the potential to induce not only robust and durable neutralizing antibody responses, but also powerful T cell responses, including long-lasting memory T cell responses in pre-clinical studies to date. To learn more, please visit www.pdsbiotech.com or follow us on Twitter at @PDSBiotech.
Versamune® is a registered trademark and Infectimune™ is a trademark of PDS Biotechnology.
Mark Reichman, Senior Research Analyst, Natural Resources, Noble Capital Markets, Inc.
Refer to the full report for the price target, fundamental analysis, and rating.
Leading off 2023 with a strong treasury. Exploration at the company’s 100%-owned Kingsway gold project continues to target the Appleton Fault over a 12-kilometer strike length. To date, 63,055 meters of the planned 100,000-meter drill program has been completed. With approximately C$18 million in cash, Labrador Gold has ample financial resources to fund the remaining 37,000 meters of drilling. Assays are pending for samples from 2,700 meters of core.
Big Vein returns high-grade intercepts. The company recently released assay results from four holes, including two holes that were drilled at the north end of the Big Vein target. Hole K-22-206 intersected 20.88 grams of gold per tonne over 5 meters that included 124.2 grams of gold per tonne over 0.81 meters, and 7.41 grams of gold over 1.0 meter. It provides another example of high-grade mineralization over a reasonably long interval. Hole K-22-208 returned 1.07 grams of gold per tonne over 2.0 meters, along with 5.0 grams of gold per tonne over 1.54 meters, including 6.04 grams of gold per tonne over 1.2 meters. Results from two holes associated with the CSAMT and Golden Glove targets returned no significant values.
Equity Research is available at no cost to Registered users of Channelchek. Not a Member? Click ‘Join’ to join the Channelchek Community. There is no cost to register, and we never collect credit card information.
This Company Sponsored Research is provided by Noble Capital Markets, Inc., a FINRA and S.E.C. registered broker-dealer (B/D).
*Analyst certification and important disclosures included in the full report. NOTE: investment decisions should not be based upon the content of this research summary. Proper due diligence is required before making any investment decision.
Great Lakes Dredge & Dock Corporation is the largest provider of dredging services in the United States. In addition, Great Lakes is fully engaged in expanding its core business into the rapidly developing offshore wind energy industry. The Company has a long history of performing significant international projects. The Company employs experienced civil, ocean and mechanical engineering staff in its estimating, production and project management functions. In its over 131-year history, the Company has never failed to complete a marine project. Great Lakes owns and operates the largest and most diverse fleet in the U.S. dredging industry, comprised of approximately 200 specialized vessels. Great Lakes has a disciplined training program for engineers that ensures experienced-based performance as they advance through Company operations. The Company’s Incident-and Injury-Free® (IIF®) safety management program is integrated into all aspects of the Company’s culture. The Company’s commitment to the IIF® culture promotes a work environment where employee safety is paramount.
Joe Gomes, Senior Research Analyst, Noble Capital Markets, Inc.
Joshua Zoepfel, Research Associate, Noble Capital Markets, Inc.
Refer to the full report for the price target, fundamental analysis, and rating.
Investor Conference. Great Lakes CEO Lasse Petterson and CFO Scott Kornblau recently hosted an investor conference. While short on financials for the disappointing 2022 full year as results are not yet in, management did provide a pathway for improved performance in 2H23 and into 2024, with a longer term goal of exceeding the $150 million of EBITDA generated in 2020.
The Table Is Set. After a disappointing level of bid activity in 2022, the table appears to be overflowing for 2023. Record funding of $8.66 billion for the Army Corp of Engineers, an additional $1.48 billion under the Disaster Relief Supplemental Appropriations Act, and passage once again of the Water Resource Development Act should drive the 2023 bid cycle, including a significant number of high margin capital projects, Great Lakes’ specialty.
Equity Research is available at no cost to Registered users of Channelchek. Not a Member? Click ‘Join’ to join the Channelchek Community. There is no cost to register, and we never collect credit card information.
This Company Sponsored Research is provided by Noble Capital Markets, Inc., a FINRA and S.E.C. registered broker-dealer (B/D).
*Analyst certification and important disclosures included in the full report. NOTE: investment decisions should not be based upon the content of this research summary. Proper due diligence is required before making any investment decision.
In the future, the energy needed to run the powerful computers on board a global fleet of autonomous vehicles could generate as many greenhouse gas emissions as all the data centers in the world today.
That is one key finding of a new study from MIT researchers that explored the potential energy consumption and related carbon emissions if autonomous vehicles are widely adopted.
The data centers that house the physical computing infrastructure used for running applications are widely known for their large carbon footprint: They currently account for about 0.3 percent of global greenhouse gas emissions, or about as much carbon as the country of Argentina produces annually, according to the International Energy Agency. Realizing that less attention has been paid to the potential footprint of autonomous vehicles, MIT researchers built a statistical model to study the problem. They determined that 1 billion autonomous vehicles, each driving for one hour per day with a computer consuming 840 watts, would consume enough energy to generate about the same amount of emissions as data centers currently do.
The researchers also found that in over 90 percent of modeled scenarios, to keep autonomous vehicle emissions from zooming past current data center emissions, each vehicle must use less than 1.2 kilowatts of power for computing, which would require more efficient hardware. In one scenario — where 95 percent of the global fleet of vehicles is autonomous in 2050, computational workloads double every three years, and the world continues to decarbonize at the current rate — they found that hardware efficiency would need to double faster than every 1.1 years to keep emissions under those levels.
“If we just keep the business-as-usual trends in decarbonization and the current rate of hardware efficiency improvements, it doesn’t seem like it is going to be enough to constrain the emissions from computing onboard autonomous vehicles. This has the potential to become an enormous problem. But if we get ahead of it, we could design more efficient autonomous vehicles that have a smaller carbon footprint from the start,” says first author Soumya Sudhakar, a graduate student in aeronautics and astronautics.
Sudhakar wrote the paper with her co-advisors Vivienne Sze, associate professor in the Department of Electrical Engineering and Computer Science (EECS) and a member of the Research Laboratory of Electronics (RLE); and Sertac Karaman, associate professor of aeronautics and astronautics and director of the Laboratory for Information and Decision Systems (LIDS). The research appears today in the January-February issue of IEEE Micro.
Modeling Emissions
The researchers built a framework to explore the operational emissions from computers on board a global fleet of electric vehicles that are fully autonomous, meaning they don’t require a backup human driver.
The model is a function of the number of vehicles in the global fleet, the power of each computer on each vehicle, the hours driven by each vehicle, and the carbon intensity of the electricity powering each computer.
“On its own, that looks like a deceptively simple equation. But each of those variables contains a lot of uncertainty because we are considering an emerging application that is not here yet,” Sudhakar says.
For instance, some research suggests that the amount of time driven in autonomous vehicles might increase because people can multitask while driving, and the young and the elderly could drive more. But other research suggests that time spent driving might decrease because algorithms could find optimal routes that get people to their destinations faster.
In addition to considering these uncertainties, the researchers also needed to model advanced computing hardware and software that didn’t exist yet.
To accomplish that, they modeled the workload of a popular algorithm for autonomous vehicles, known as a multitask deep neural network, because it can perform many tasks at once. They explored how much energy this deep neural network would consume if it were processing many high-resolution inputs from many cameras with high frame rates simultaneously.
When they used the probabilistic model to explore different scenarios, Sudhakar was surprised by how quickly the algorithms’ workload added up.
For example, if an autonomous vehicle has 10 deep neural networks processing images from 10 cameras, and that vehicle drives for one hour a day, it will make 21.6 million inferences each day. One billion vehicles would make 21.6 quadrillion inferences. To put that into perspective, all of Facebook’s data centers worldwide make a few trillion inferences each day (1 quadrillion is 1,000 trillion).
“After seeing the results, this makes a lot of sense, but it is not something that is on a lot of people’s radar. These vehicles could actually be using a ton of computer power. They have a 360-degree view of the world, so while we have two eyes, they may have 20 eyes, looking all over the place and trying to understand all the things that are happening at the same time,” Karaman says.
Autonomous vehicles would be used for moving goods, as well as people, so there could be a massive amount of computing power distributed along global supply chains, he says. And their model only considers computing — it doesn’t take into account the energy consumed by vehicle sensors or the emissions generated during manufacturing.
Keeping Emissions in Check
To keep emissions from spiraling out of control, the researchers found that each autonomous vehicle needs to consume less than 1.2 kilowatts of energy for computing. For that to be possible, computing hardware must become more efficient at a significantly faster pace, doubling in efficiency about every 1.1 years.
One way to boost that efficiency could be to use more specialized hardware, which is designed to run specific driving algorithms. Because researchers know the navigation and perception tasks required for autonomous driving, it could be easier to design specialized hardware for those tasks, Sudhakar says. But vehicles tend to have 10- or 20-year lifespans, so one challenge in developing specialized hardware would be to “future-proof” it so it can run new algorithms.
In the future, researchers could also make the algorithms more efficient, so they would need less computing power. However, this is also challenging because trading off some accuracy for more efficiency could hamper vehicle safety.
Now that they have demonstrated this framework, the researchers want to continue exploring hardware efficiency and algorithm improvements. In addition, they say their model can be enhanced by characterizing embodied carbon from autonomous vehicles — the carbon emissions generated when a car is manufactured — and emissions from a vehicle’s sensors.
While there are still many scenarios to explore, the researchers hope that this work sheds light on a potential problem people may not have considered.
“We are hoping that people will think of emissions and carbon efficiency as important metrics to consider in their designs. The energy consumption of an autonomous vehicle is really critical, not just for extending the battery life, but also for sustainability,” says Sze.
Cathie Wood Reveals 2022’s Most Disruptive and Innovative Technologies
ARK Invest’s Cathie Wood penned a lookback-themed article about the innovations and disruptive companies of 2022. The purpose seemed to be to remind followers that although during the year, investors may have become disheartened with innovation, ‘look at the amazing opportunities that occurred.’ The innovations and companies highlighted were somewhat overlooked; following the path we are accustomed to from many breakthroughs, they fly under the radar. Then, suddenly they’re widely adopted. Below are many of her picks for innovation and companies she may now wish her funds held large positions in.
The Future of Internet
Suddenly everyone is talking about ChatGPT. According to Wood, artificial intelligence (AI), specifically, ChatGPT is advancing at a pace that is surprising even by standards set by earlier versions. This version of GPT-3, optimized for conversation, signed up one million users in just five days. By comparison, this onboarding of users is incredibly fast benchmarked against the original GPT-3, which took 24 months to reach the same level.
In 2022, TV advertising in the US underwent significant changes. Traditional, non-addressable, non-interactive TV ad spending dropped by 2% to $70 billion, according to Wood. Connected TV (CTV) ad spending on the same terms increased by 14% to ~$21 billion. Pure-play CTV operator Roku’s advertising platform revenue increased 15% year-over-year in the third quarter, the latest report available, while traditional TV scatter markets plummeted 38% year-over-year in the US. Roku maintained its position in the CTV market as the leading smart TV vendor in the US, accounting for 32% of the market.
Digital Wallets are replacing both credit cards and cash. In the category of offline commerce. They overtook cash as the top transaction method in 2020 and accounted for 50% of global online commerce volume in 2021. As an example of the growth, Square’s payment volume soared 193%, six times faster than the 30% increase in total retail spending 2019-2022 (relative to pre-COVID levels).
While overall e-commerce spending increased by 99% over the last three years, social commerce merchandise volume grew even faster. Shopify’s gross merchandise volume grew by 312%, almost four times faster than overall e-commerce and taking a significant share from other retail.
Underlying public blockchains continue to process transactions despite what may be going on surrounding the connected industries. Wood says it highlights that “their transparent, decentralized, and auditable ledgers could be a solution to the fraud and mismanagement associated with centralized, opaque institutions.” She explains, “After the FTX collapse, the share of trading volume on decentralized exchanges, which allow for trading without a central intermediary, rose 37% from 8.35% to 11.44%.
Genomic Revolution
Base editing and multiplexing have the potential to provide more effective CAR-T treatments for patients with otherwise incurable cancers. Cathie Wood provided an example from 2022 about a young girl in the UK with leukemia that went from hopeless in May to Canver-free in November.
In 2022 Dutch scientists at the Hubrecht Institute, UMC Utrecht, and the Oncode Institute used another form of gene editing called prime editing to correct the mutation that causes cystic fibrosis in human stem cells. Another example of how it is being adopted comes from Korean researchers at Yonsei University that used prime editing successfully to treat liver and eye diseases in adult mice.
CRISPR gene editing in Cathie’s words, “has delivered functional cures for beta-thalassemia and sickle cell disease.” She gives examples: CRISPR Therapeutics and Vertex Pharmaceuticals which together have treated more than 75 patients, resulting in some well-publicized “functional cures”. They are expecting FDA approval for Exa-Cel, the treatment for sickle cell and beta thalassemia, in early 2023.
In the category the Ark Invest founder referred to as other cell and gene therapies, she says in 2022, regulators approved several landmark cell and gene therapies. The examples she used to highlight this are Hemgenix for the treatment of Haemophilia B, Zyntelgo for beta thalassemia, Skysona for cerebral adrenoleukodystrophy, Yescarta and Breyanzi for Non-Hodgkin lymphoma, Tecartus for mantle cell lymphoma, and Carvykti and Abecma for multiple myeloma.
Liquid biopsies, blood tests via molecular diagnostic testing are enabling the early detection of colorectal cancer which, if discovered at or before stage 1, have a five-year survival rate greater than 90%. Late-stage or metastatic cancers account for more than 55% of deaths over a five-year period, but only 17% of new diagnoses.
Autonomous Technology & Robotics
During 2022 electric vehicle maker Tesla sales increased by 49% even as automobile sales declined by 8%. Tesla’s share of total auto sales in the US has increased to 3.8% from 1.4% in three years.
During 2022, GM expanded its autonomous driving taxi service to most of San Francisco in the first large-scale rollout in a major US city. Then it launched in both Phoenix and Austin late in the year. The automaker with a stodgy reputation, managed to compress the time to commercialization from nine years in San Francisco to just 90 days in Austin. Tesla, for its part, expanded access to its FSD (full self-driving) beta software to all owners in North America who had requested access.
By January 4, 2023, both Amazon and Walmart had begun deliveries using drones in select US cities. Autonomous logistics technology is no longer futuristic and is likely to continue being adopted and expanded.
Across the top 50 medical device companies, 90% rely on 3D printing for prototyping, testing, and even in some cases printing medical devices.
In 2022, SpaceX nearly doubled the number of rockets it launched to 61. It reused the same rocket in as few as 21 days, a dramatic improvement over the 356 days required for its first rocket reuse. Private Space Exploration is a reality. 61 rockets is an average of more than one per week.
Take Away
Hedge fund manager Cathie Wood took the new year as an opportunity to communicate examples of game-changing innovation that the equity market largely ignored in 2022. She finds these as confidence building that the premise of many of her managed funds is with merit. More importantly, in the face of market headwinds and media criticism, she wants these examples to help boost investor confidence “that ARK’s strategies are on the right side of change.” She tells readers, “innovation solves problems and has historically gained share during turbulent times.”
MCLEAN, Va., Jan. 12, 2023 /PRNewswire/ — V2X, Inc., (NYSE: VVX), a leading provider of critical mission solutions and support to defense clients globally, announced that on December 30, 2022, the company made a $25 million prepayment on its $185 million Second Lien Term Loan.
“We are pleased to announce the $25 million prepayment of our Second Lien Term Loan, which demonstrates our commitment to lowering interest expense and increasing returns to shareholders,” said Susan Lynch, Senior Vice President and Chief Financial Officer. “We continue to see opportunities to further improve the company’s cost of capital and drive additional interest expense savings.”
ABOUT V2X V2X is a leading provider of critical mission solutions and support to defense clients globally, formed by the 2022 merger of Vectrus and Vertex to build on more than 120 combined years of successful mission support. The Company delivers a comprehensive suite of integrated solutions across the operations and logistics, aerospace, training and technology markets to national security, defense, civilian and international clients. Our global team of approximately 15,000 employees brings innovation to every point in the mission lifecycle, from preparation, to operations, to sustainment, as they tackle the most complex challenges with agility, grit and dedication.
IRVING, Texas–(BUSINESS WIRE)– Salem Media Group, Inc. (NASDAQ: SALM) announced today the promotion of Andy Massingill to the position of Senior Director of Digital Sales. Jon Latzer, Vice President/General Manager of Salem Surround said, “Over the past three years, Andy has led his team to unprecedented revenue heights. His leadership across the Western Region played a significant factor in Salem’s overall revenue growth. In addition to Andy’s leadership for the Western Region, Andy will work closely with Chris Gould, Senior Vice President National Programming and Ministry Relations and all our National Ministry partners to better leverage our digital assets, generating more time with our quality audience while delivering outstanding results,” Latzer said.
“The last three years have been an incredible journey with Salem and the Western Region. I’m proud of our work, the work we will continue to do, and the relationships established across the board. I am very excited to work with Chris and our National Ministry partners who are at the core fabric of what Salem stands for,” said Massingill.
ABOUT SALEM MEDIA GROUP:
Salem Media Group is America’s leading multimedia company specializing in Christian and conservative content, with media properties comprising radio, digital media and book and newsletter publishing. Each day Salem serves a loyal and dedicated audience of listeners and readers numbering in the millions nationally. With its unique programming focus, Salem provides compelling content, fresh commentary and relevant information from some of the most respected figures across the Christian and conservative media landscape. Learn more about Salem Media Group, Inc. at www.salemmedia.com, Facebook and Twitter.