Office Depot, Inc., together with its subsidiaries, supplies a range of office products and services. It offers merchandise, such as general office supplies, computer supplies, business machines and related supplies, and office furniture through its chain of office supply stores under the Office Depot, Foray, Ativa, Break Escapes, Worklife, and Christopher Lowell brand names. The company also provides graphic design, printing, reproduction, mailing, shipping, and other services through design, print, and ship centers. It has operations throughout North America, Europe, Asia, and Central America. The company also sells its products and services through direct mail catalogs, contract sales force, Internet sites, and retail stores, through a mix of company-owned operations, joint ventures, licensing and franchise agreements, alliances, and other arrangements. As of December 31, 2008, Office Depot operated 1,267 North American retail division office supply stores and 162 international division retail stores, as well as participated under licensing and merchandise arrangements in 98 stores. The company was founded in 1986 and is based in Boca Raton, Florida.
Joe Gomes, CFA, Managing Director, Equity Research Analyst, Generalist , Noble Capital Markets, Inc.
Joshua Zoepfel, Research Associate, Noble Capital Markets, Inc.
Refer to the full report for the price target, fundamental analysis, and rating.
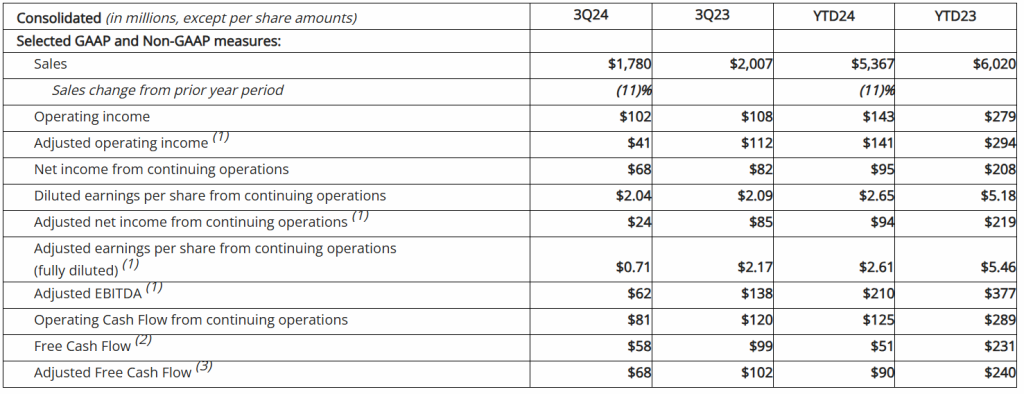
3Q24 Results. Weak macroeconomic and business conditions resulted in challenging performance in the quarter. Third quarter revenue of $1.78 billion declined 11% y-o-y. Adjusted operating income was $41 million, down from $112 million in 3Q23. Adjusted EBITDA fell to $62 million from $138 million. ODP reported adjusted net income from continuing operations of $24 million, or EPS of $0.71, versus $85 million, or EPS of $2.17, in the same period last time.
Accelerating the Pivot. Given the recent operating challenges, ODP is accelerating its B2B pivot. The Company is leveraging its differentiated core strengths to pivot towards higher growth B2B opportunities. Recent contract wins, including a 10-year $1.5 billion contract with a reseller organization and a new contract with one of the world’s largest social media-focused e-commerce companies, are reflective of these efforts.
Equity Research is available at no cost to Registered users of Channelchek. Not a Member? Click ‘Join’ to join the Channelchek Community. There is no cost to register, and we never collect credit card information.
This Company Sponsored Research is provided by Noble Capital Markets, Inc., a FINRA and S.E.C. registered broker-dealer (B/D).
*Analyst certification and important disclosures included in the full report. NOTE: investment decisions should not be based upon the content of this research summary. Proper due diligence is required before making any investment decision.
Seanergy Maritime Holdings Corp. is a prominent pure-play Capesize shipping company listed in the U.S. capital markets. Seanergy provides marine dry bulk transportation services through a modern fleet of Capesize vessels. The Company’s operating fleet consists of 18 vessels (1 Newcastlemax and 17 Capesize) with an average age of approximately 13.4 years and an aggregate cargo carrying capacity of approximately 3,236,212 dwt. Upon completion of the delivery of the previously announced Capesize vessel acquisition, the Company’s operating fleet will consist of 19 vessels (1 Newcastlemax and 18 Capesize) with an aggregate cargo carrying capacity of approximately 3,417,608 dwt. The Company is incorporated in the Marshall Islands and has executive offices in Glyfada, Greece. The Company’s common shares trade on the Nasdaq Capital Market under the symbol “SHIP”.
Mark Reichman, Managing Director, Equity Research Analyst, Natural Resources, Noble Capital Markets, Inc.
Hans Baldau, Research Associate, Noble Capital Markets, Inc.
Refer to the full report for the price target, fundamental analysis, and rating.
Third quarter financial results. The company reported third quarter adjusted EBITDA and earnings per share (EPS) of $26.8 million and $0.69, respectively, exceeding our estimates of $25.5 million and $0.61. Revenue was $1.1 million above our estimate, while expenses were only modestly higher. The variance to our net revenue estimate is attributed to lower commissions and greater fees from related parties. Operating income was $17.7 million compared to our estimate of $17.0 million.
Updating estimates. We are lowering our 2024 adjusted EBITDA and EPS estimates to $101.7 million and $2.52, respectively, from our previous estimates of $102.1 million and $2.56. Additionally, we are lowering our 2025 adjusted EBITDA and EPS estimates to $93.7 million and $1.93, respectively, from $102.0 million and $2.39. The revisions are mainly due to lower time charter equivalent (TCE) rates and more dry-docking days in 2025, resulting in lower operating days and net revenue than previously estimated.
Equity Research is available at no cost to Registered users of Channelchek. Not a Member? Click ‘Join’ to join the Channelchek Community. There is no cost to register, and we never collect credit card information.
This Company Sponsored Research is provided by Noble Capital Markets, Inc., a FINRA and S.E.C. registered broker-dealer (B/D).
*Analyst certification and important disclosures included in the full report. NOTE: investment decisions should not be based upon the content of this research summary. Proper due diligence is required before making any investment decision.
CoreCivic is a diversified, government-solutions company with the scale and experience needed to solve tough government challenges in flexible, cost-effective ways. We provide a broad range of solutions to government partners that serve the public good through high-quality corrections and detention management, a network of residential and non-residential alternatives to incarceration to help address America’s recidivism crisis, and government real estate solutions. We are the nation’s largest owner of partnership correctional, detention and residential reentry facilities, and believe we are the largest private owner of real estate used by government agencies in the United States. We have been a flexible and dependable partner for government for nearly 40 years. Our employees are driven by a deep sense of service, high standards of professionalism and a responsibility to help government better the public good. Learn more at www.corecivic.com.
Joe Gomes, CFA, Managing Director, Equity Research Analyst, Generalist , Noble Capital Markets, Inc.
Joshua Zoepfel, Research Associate, Noble Capital Markets, Inc.
Refer to the full report for the price target, fundamental analysis, and rating.
Solid Results and a Favorable Reaction. CoreCivic reported above expected 3Q24 results, driven by higher compensated occupancy and continued cost management. Notably, the results were achieved even with the headwinds of CalCity and South Texas, which resulted in ICE revenue declining 3.4% y-o-y. Excluding the South Texas facility, ICE revenue rose 10.9% y-o-y. CXW shares reacted favorably to the election results, rising nearly 30% to close at $17.58 yesterday.
Third Quarter Detail. Total revenue was at $491.6 million (including $5.7 million of deferred revenue related to South Texas), above our forecast of $479.5 million and above last year’s $483.7 million. Occupancy rates increased to 75.2% from 72.0% in the prior year. Operating margin improved 130 basis points y-o-y, reflecting the increased top line and cost control. Adjusted EBITDA was $83.3 million, up from $75.2 million. Net income was $21.1 million, or $0.19 per diluted share, compared to $13.9 million or $0.12 last year. Adjusted EPS was $0.20 versus $0.14 last year. We estimated net income of $10 million or $0.09 per diluted share.
Equity Research is available at no cost to Registered users of Channelchek. Not a Member? Click ‘Join’ to join the Channelchek Community. There is no cost to register, and we never collect credit card information.
This Company Sponsored Research is provided by Noble Capital Markets, Inc., a FINRA and S.E.C. registered broker-dealer (B/D).
Patrick McCann, CFA, Research Analyst, Noble Capital Markets, Inc.
Michael Kupinski, Director of Research, Equity Research Analyst, Digital, Media & Technology , Noble Capital Markets, Inc.
Refer to the full report for the price target, fundamental analysis, and rating.
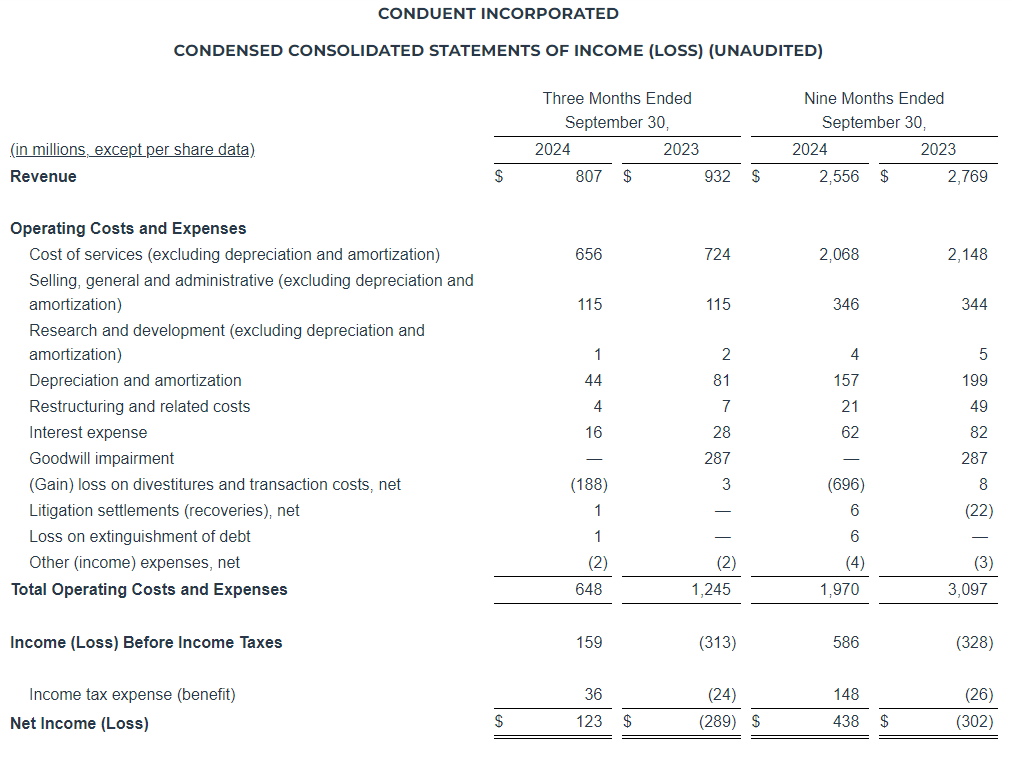
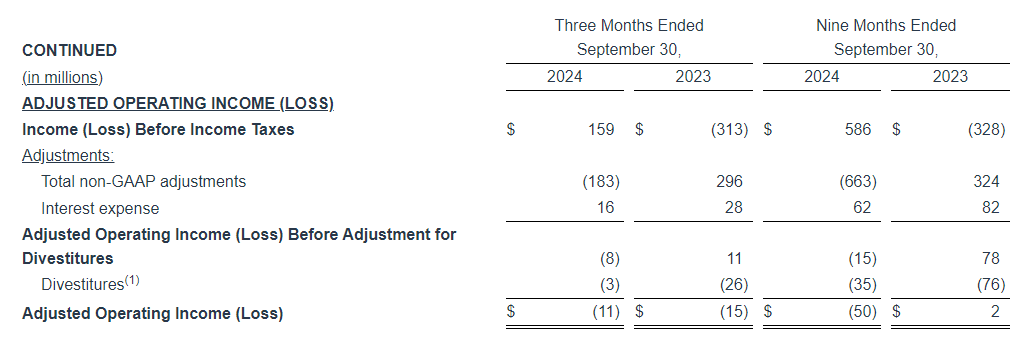
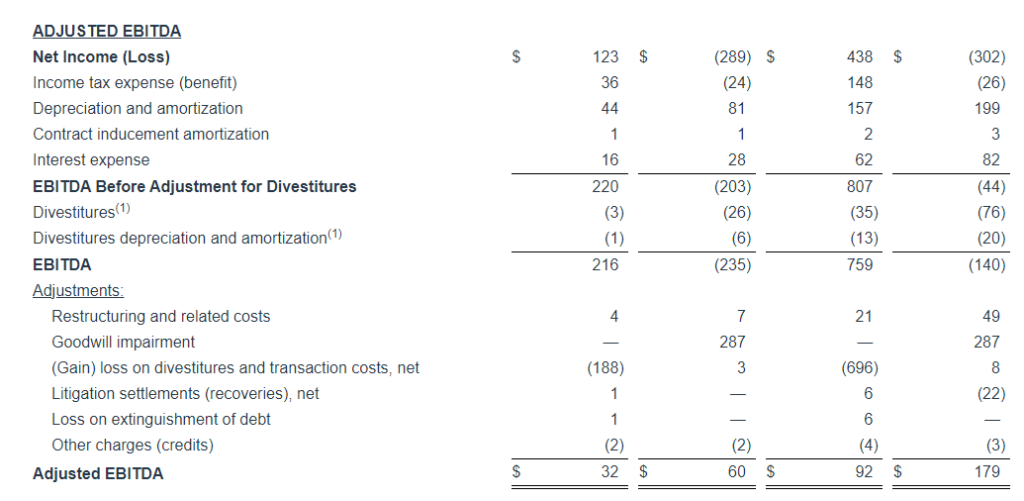
Q3 in line. The company reported a solid Q3 with revenue that was largely in line with our estimate and adj. EBITDA that was better than expected. Revenue of $807 million compared with our estimate of $814 million and adj. EBITDA of $36 million compared with our estimate of $24 million, illustrated in Figure #1 Q3 Results.
Revenue trends should improve. Adj. revenue, which excludes divested business units, was down in each of the 3 segments and down roughly 8% overall. In the company’s largest segment, Commercial, adj. revenue was down 3%, due to lower volumes. Importantly though, new business signings helped to mitigate the weakness and new business momentum is expected to continue for the remainder of the year.
Equity Research is available at no cost to Registered users of Channelchek. Not a Member? Click ‘Join’ to join the Channelchek Community. There is no cost to register, and we never collect credit card information.
This Company Sponsored Research is provided by Noble Capital Markets, Inc., a FINRA and S.E.C. registered broker-dealer (B/D).
*Analyst certification and important disclosures included in the full report. NOTE: investment decisions should not be based upon the content of this research summary. Proper due diligence is required before making any investment decision.
Joe Gomes, CFA, Managing Director, Equity Research Analyst, Generalist , Noble Capital Markets, Inc.
Joshua Zoepfel, Research Associate, Noble Capital Markets, Inc.
Refer to the full report for the price target, fundamental analysis, and rating.
AI Revenue In-line. As of October 31, Bit Digital had 256 servers actively generating revenue and earned approximately $4.3 million of unaudited revenue during the month, in-line with the prior month. With the recent agreement signed with Boosteroid, we expect an uptick in revenue in the coming months.
Mining Business. The Company produced 52.2 BTC in the month, a 1.4% increase from 51.5 BTC in September. The active hash rate was 2.43 EH/s, flat with the prior month. In our view, management is continuing to take an opportunistic approach to mining, with additional miner acquisitions based on appropriate returns on invested capital.
Equity Research is available at no cost to Registered users of Channelchek. Not a Member? Click ‘Join’ to join the Channelchek Community. There is no cost to register, and we never collect credit card information.
This Company Sponsored Research is provided by Noble Capital Markets, Inc., a FINRA and S.E.C. registered broker-dealer (B/D).
*Analyst certification and important disclosures included in the full report. NOTE: investment decisions should not be based upon the content of this research summary. Proper due diligence is required before making any investment decision.
Key Points: – Avid Bioservices will be acquired by GHO Capital and Ampersand Capital in a $1.1 billion deal, with a 13.8% per-share premium. – Acquisition to enhance Avid’s biologics CDMO services with expanded resources for development and manufacturing. – Expected to close in Q1 2025, enabling Avid to operate privately and accelerate its service offerings for the biotechnology sector.
Avid Bioservices, Inc. (NASDAQ: CDMO), a major biologics contract development and manufacturing organization (CDMO), announced its acquisition by GHO Capital Partners LLP and Ampersand Capital Partners for approximately $1.1 billion. The all-cash transaction positions Avid for substantial growth, with the backing of experienced healthcare-focused investors to expand its development and manufacturing capabilities in the biotechnology sector. This acquisition marks a strategic move for GHO and Ampersand, leveraging Avid’s expertise to strengthen their portfolios in the life sciences industry.
Under the agreement terms, GHO and Ampersand will acquire Avid’s outstanding shares for $12.50 each in cash, reflecting a 13.8% premium over Avid’s closing share price and a 21.9% premium over its 20-day average. This values the transaction at $1.1 billion, enhancing Avid’s growth potential within a private company framework where it can develop its offerings with the support of dedicated capital and expanded industry networks.
Alan MacKay and Mike Mortimer, Managing Partners of GHO, expressed their excitement to work with Avid’s team to realize the company’s full potential, calling Avid “an ideal addition” that exemplifies their mission to improve healthcare access through efficient manufacturing and high-quality innovation. The deal will enable Avid to maintain its focus on serving the biotechnology and pharmaceutical sectors, helping it meet growing demand for complex biologics at clinical and commercial stages. Additionally, the acquisition aligns with GHO and Ampersand’s broader healthcare strategies, aiming to optimize Avid’s impact in global markets.
Nick Green, President and CEO of Avid, noted that partnering with GHO and Ampersand comes at an opportune time, as Avid has been strategically expanding to meet a broader range of customer needs. He emphasized that this partnership will further Avid’s impact, positioning it to better serve biopharma innovators by utilizing GHO and Ampersand’s resources. “After years of investment and expansion, now is the right time to move forward as a private company,” Green stated, expressing confidence that this move will significantly enhance Avid’s capabilities.
The acquisition is expected to support Avid’s future projects, including cell line development, CGMP clinical and commercial manufacturing, analytical testing, and expanded services for early-stage programs. This additional support allows Avid to optimize customer offerings, broaden its expertise, and develop new industry capabilities that align with its dedication to quality and regulatory standards.
The acquisition, unanimously approved by Avid’s board of directors, is expected to close in Q1 2025, pending customary approvals. Avid’s shares will no longer be publicly traded after the acquisition, and the company will continue to operate under its current name and brand identity, with its headquarters remaining in Tustin, California. Financial and legal advising for Avid are being handled by Moelis & Company LLC and Cooley LLP, respectively, while GHO and Ampersand are advised by William Blair & Company and Ropes & Gray LLP.
This partnership reflects GHO and Ampersand’s strategic investment approach, enabling Avid to strengthen its leadership in biologics manufacturing and develop solutions that respond to high-growth demand in the industry.
Key Points: – Sonnet BioTherapeutics priced a $5 million public offering to fund research and trials. – The offering sparked a significant increase in Sonnet’s trading volume. – Sonnet advances its FHAB platform with promising cancer treatments like SON-1411 and SON-1010.
Sonnet BioTherapeutics (NASDAQ: SONN), a clinical-stage biotech company specializing in oncology-focused immunotherapies, has priced a $5.0 million underwritten public offering. The offering includes 1,111,111 shares of common stock, each sold with one common warrant for the purchase of an additional two shares, at a combined price of $4.50 per share. This offering is set to close on or around November 7, 2024, and is expected to generate gross proceeds of approximately $5.0 million before underwriting discounts and commissions.
The proceeds from this offering are intended to fund Sonnet’s ongoing research and development, clinical trials, working capital, and liability repayments, advancing the company’s mission to develop novel biologic therapies for cancer treatment. While the offering is an exciting opportunity for the company to secure necessary funding, it also brings with it potential risks, including the possibility of shareholder dilution through the issuance of new shares and warrants.
Notably, Sonnet’s share price has seen increased volatility today, with trading volume significantly surging. This rise in trading activity follows the announcement of the offering and its anticipated closure. As is often the case with at-the-market offerings under Nasdaq rules, the pricing of the shares could pressure the stock value in the short term. However, investors may also be reacting positively to the financial backing that will enable Sonnet to accelerate the clinical development of its promising drug pipeline.
Sonnet is known for its proprietary FHAB (Fully Human Albumin Binding) platform, which enables the development of biologic drugs designed to target tumor and lymphatic tissues more efficiently. This technology utilizes a human single-chain antibody fragment (scFv) to hitch a ride on human serum albumin, guiding the drug directly to the target tissue for improved therapeutic effectiveness. The FHAB platform is adaptable, enabling the creation of a wide range of therapeutic candidates, including cytokines, peptides, antibodies, and vaccines.
One of Sonnet’s leading therapeutic candidates is SON-1411, a novel bifunctional fusion protein designed to enhance the efficacy of the immune response against cancer. SON-1411 combines IL-18BPR (a receptor that binds IL-18) with IL-12 and is linked to the FHAB platform. This innovative approach is aimed at overcoming limitations observed in previous IL-18-based therapies, which suffered from poor efficacy due to the presence of IL-18 binding protein (IL-18BP) in the tumor microenvironment. By modifying the IL-18 domain, SON-1411 seeks to bypass this issue and enhance the therapeutic potential of IL-18 in cancer treatment.
In addition to SON-1411, Sonnet is also advancing SON-1010, an IL-12-FHAB fusion protein, through clinical trials for solid tumors and ovarian cancer. The company is evaluating SON-1010 in collaboration with Roche, in combination with the immune checkpoint inhibitor atezolizumab, for the treatment of platinum-resistant ovarian cancer. Moreover, Sonnet is working on SON-1210, a combination of IL-12-FHAB and IL-15, for the treatment of solid tumors like pancreatic cancer.
Despite the potential dilution concerns stemming from the offering, the announcement underscores the company’s strategic commitment to advancing its promising drug candidates. As Sonnet BioTherapeutics progresses through clinical trials and secures additional funding, the surge in trading volume today suggests strong market interest in the company’s future prospects. The funding from the offering will be crucial in supporting Sonnet’s clinical trials and advancing the company’s vision of delivering targeted, effective treatments for cancer patients.
PRINCETON, N.J., Nov. 06, 2024 (GLOBE NEWSWIRE) — PDS Biotechnology Corporation (Nasdaq: PDSB) (“PDS Biotech” or the “Company”), a late-stage immunotherapy company focused on transforming how the immune system targets and kills cancers and the development of infectious disease vaccines, today announced that the Company will host a conference call to report financial results for the quarter ended September 30, 2024, and provide a clinical program update on Thursday, November 14, 2024, at 8:30 a.m. Eastern Time.
Conference Call Details
Date: November 14, 2024 Time: 8:30 a.m. Eastern Time Dial-in: 1-877-704-4453 or 1-201-389-0920 Webcast Registration: Click Here Call MeTM Registration: Click Here (Available 15 minutes prior to call)
About PDS Biotechnology PDS Biotechnology is a late-stage immunotherapy company focused on transforming how the immune system targets and kills cancers and the development of infectious disease vaccines. The Company plans to initiate a pivotal clinical trial in 2024 to advance its lead program in advanced HPV16-positive head and neck squamous cell cancers. PDS Biotech’s lead investigational targeted immunotherapy Versamune® HPV is being developed in combination with a standard-of-care immune checkpoint inhibitor, and also in a triple combination including PDS01ADC, an IL-12 fused antibody drug conjugate (ADC), and a standard-of-care immune checkpoint inhibitor. We believe that proof-of-concept long-term data have shown positive survival results and tumor shrinkage with these combinations and indicate favorable tolerability.
We believe that the novel investigational mechanisms of action of Versamune® HPV and the combination of Versamune® HPV and PDS01ADC have resulted in compelling results with potential to successfully disrupt a tumor’s internal defenses, while also generating potent, targeted killer T-cells to attack the tumor. We also believe that data from more than 350 patients, as well as ongoing clinical trials across multiple tumor types and standard treatment regimens, have validated the potential for both platforms and point to potential broad utility.
Forward Looking Statements This communication contains forward-looking statements (including within the meaning of Section 21E of the United States Securities Exchange Act of 1934, as amended, and Section 27A of the United States Securities Act of 1933, as amended) concerning PDS Biotechnology Corporation (the “Company”) and other matters. These statements may discuss goals, intentions and expectations as to future plans, trends, events, results of operations or financial condition, or otherwise, based on current beliefs of the Company’s management, as well as assumptions made by, and information currently available to, management. Forward-looking statements generally include statements that are predictive in nature and depend upon or refer to future events or conditions, and include words such as “may,” “will,” “should,” “would,” “expect,” “anticipate,” “plan,” “likely,” “believe,” “estimate,” “project,” “intend,” “forecast,” “guidance”, “outlook” and other similar expressions among others. Forward-looking statements are based on current beliefs and assumptions that are subject to risks and uncertainties and are not guarantees of future performance. Actual results could differ materially from those contained in any forward-looking statement as a result of various factors, including, without limitation: the Company’s ability to protect its intellectual property rights; the Company’s anticipated capital requirements, including the Company’s anticipated cash runway and the Company’s current expectations regarding its plans for future equity financings; the Company’s dependence on additional financing to fund its operations and complete the development and commercialization of its product candidates, and the risks that raising such additional capital may restrict the Company’s operations or require the Company to relinquish rights to the Company’s technologies or product candidates; the Company’s limited operating history in the Company’s current line of business, which makes it difficult to evaluate the Company’s prospects, the Company’s business plan or the likelihood of the Company’s successful implementation of such business plan; the timing for the Company or its partners to initiate the planned clinical trials for Versamune® HPV, PDS01ADC, and other Versamune® and Infectimune® based product candidates; the future success of such trials; the successful implementation of the Company’s research and development programs and collaborations, including any collaboration studies concerning Versamune® HPV, PDS01ADC and other Versamune® and Infectimune® based product candidates and the Company’s interpretation of the results and findings of such programs and collaborations and whether such results are sufficient to support the future success of the Company’s product candidates; the success, timing and cost of the Company’s ongoing clinical trials and anticipated clinical trials for the Company’s current product candidates, including statements regarding the timing of initiation, pace of enrollment and completion of the trials (including the Company’s ability to fully fund its disclosed clinical trials, which assumes no material changes to the Company’s currently projected expenses), futility analyses, presentations at conferences and data reported in an abstract, and receipt of interim or preliminary results (including, without limitation, any preclinical results or data), which are not necessarily indicative of the final results of the Company’s ongoing clinical trials; any Company statements about its understanding of product candidates mechanisms of action and interpretation of preclinical and early clinical results from its clinical development programs and any collaboration studies; the Company’s ability to continue as a going concern; and other factors, including legislative, regulatory, political and economic developments not within the Company’s control. The foregoing review of important factors that could cause actual events to differ from expectations should not be construed as exhaustive and should be read in conjunction with statements that are included herein and elsewhere, including the other risks, uncertainties, and other factors described under “Risk Factors,” “Management’s Discussion and Analysis of Financial Condition and Results of Operations” and elsewhere in the documents we file with the U.S. Securities and Exchange Commission. The forward-looking statements are made only as of the date of this press release and, except as required by applicable law, the Company undertakes no obligation to revise or update any forward-looking statement, or to make any other forward-looking statements, whether as a result of new information, future events or otherwise.
Versamune® and Infectimune® are registered trademarks of PDS Biotechnology Corporation.
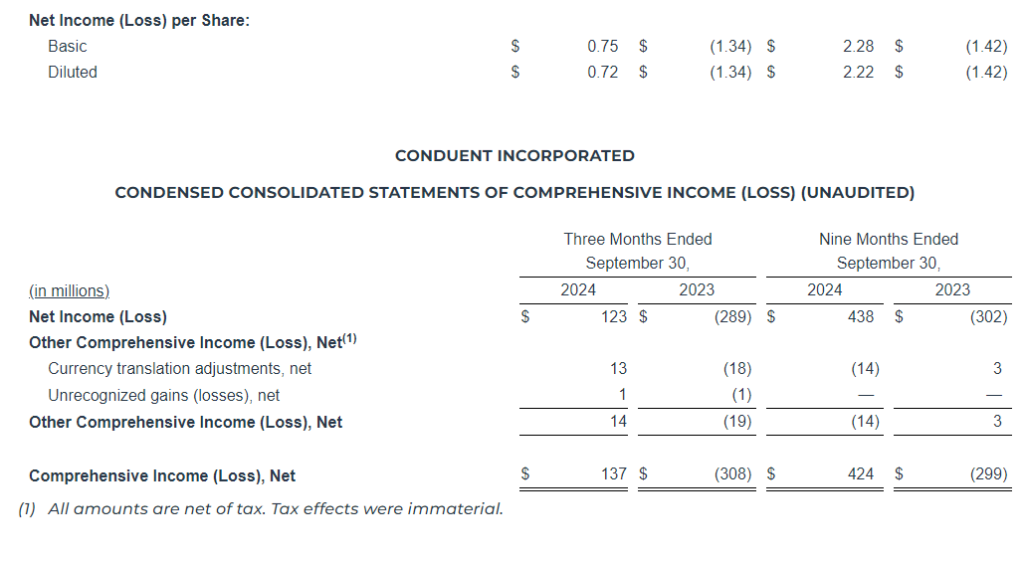
FLORHAM PARK, NJ, November 6, 2024 – Conduent Incorporated (Nasdaq: CNDT), a global technology-led business process solutions and services company, today announced its third quarter 2024 financial results.
Cliff Skelton, Conduent President and Chief Executive Officer stated, “All in all, Q3 was a sequentially improved quarter where we met or exceeded Revenue and EBITDA expectations. Our Commercial segment continued to exhibit enhanced performance helping to offset a sales lag in our Government segment. We added several new leaders to our senior team which, when accompanied by continued sequential momentum, will help us finish the year strong.”
“We described a course of action and a set of expectations early in 2023, and we continue to hit our ‘marks’ along the way remaining exactly in line with that previously committed growth trajectory and sequentially expanding margins. Importantly, while our 2024 program of divestitures is complete with transition activities in place, our portfolio remains broad and we continue to see opportunities to further maximize shareholder return.”
Key Financial Q3 2024 Results
($ in millions, except margin and per share data)
Q3 2024
Q3 2023
Current Quarter Y/Y B/(W)
Revenue
$807
$932
(13.4)%
Adjusted Revenue(1)
$781
$831
(6.0)%
GAAP Net Income (Loss)
$123
$(289)
n/m
Adjusted EBITDA(1)
$32
$60
(46.7)%
Adjusted EBITDA Margin (1)
4.1%
7.2%
(310) bps
GAAP Income (Loss) Before Income Tax
$159
$(313)
n/m
GAAP Diluted EPS
$0.72
$(1.34)
n/m
Adjusted Diluted EPS(1)
$(0.14)
$(0.09)
(55.6)%
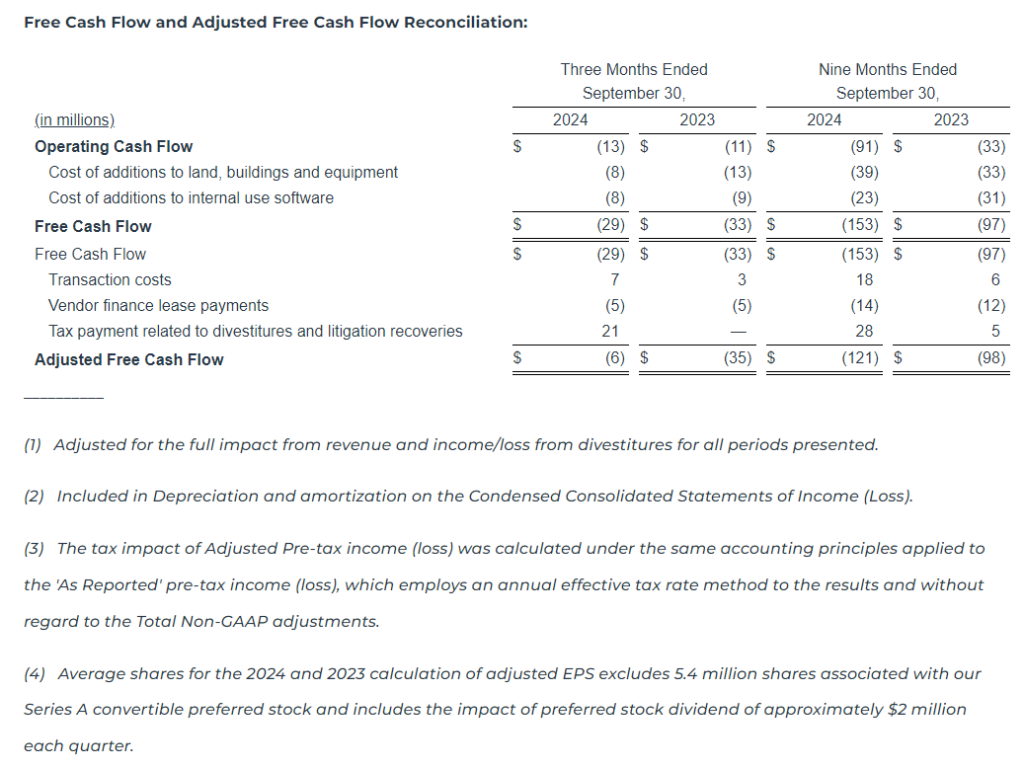
Cash Flow from Operating Activities
$(13)
$(11)
(18.2)%
Adjusted Free Cash Flow(1)
$(6)
$(35)
82.9%
Performance Commentary
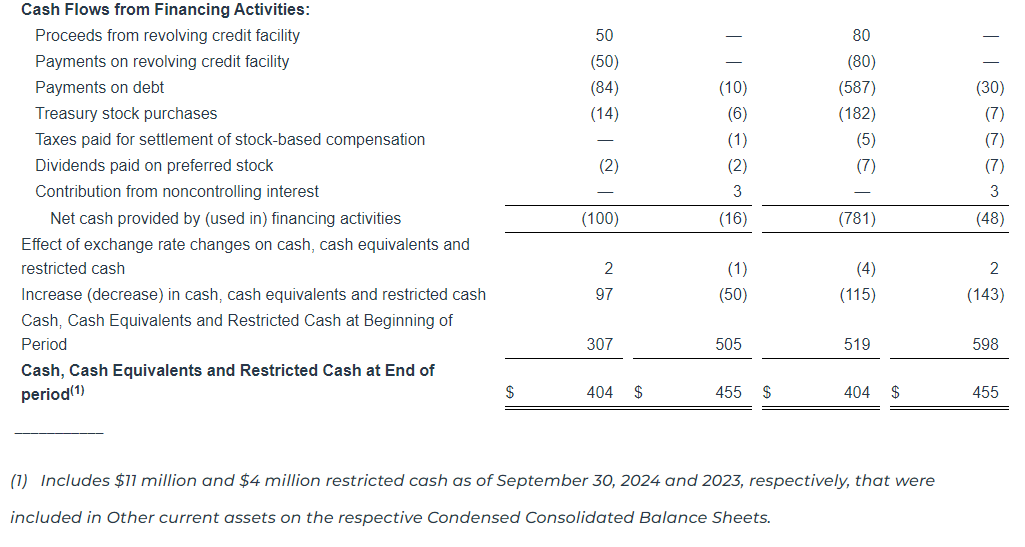
During the third quarter of 2024, the company completed the sale of the Casualty Claims Solutions business, receiving $224 million in cash consideration subject to certain post-closing adjustments.
Also, during the third quarter of 2024, the company used a portion of the proceeds from the divested businesses to voluntarily prepay the entire remaining outstanding balance of $38 million of the Term Loan B and $37 million of the Term Loan A.
Pre-tax income (loss) for the third quarter of 2024 was $159 million versus $(313) million in the prior year period. This increase is primarily driven by the gain on the sale of the Casualty Claims Solutions business and a goodwill impairment in the prior year period.
The third quarter Adjusted EBITDA of $32 million and Adjusted EBITDA Margin of 4.1% exceeded the company’s expectations and was sequentially higher than the prior quarter.
Revenue and Adjusted Revenue for the third quarter of 2024 were also in line with the company’s expectations.
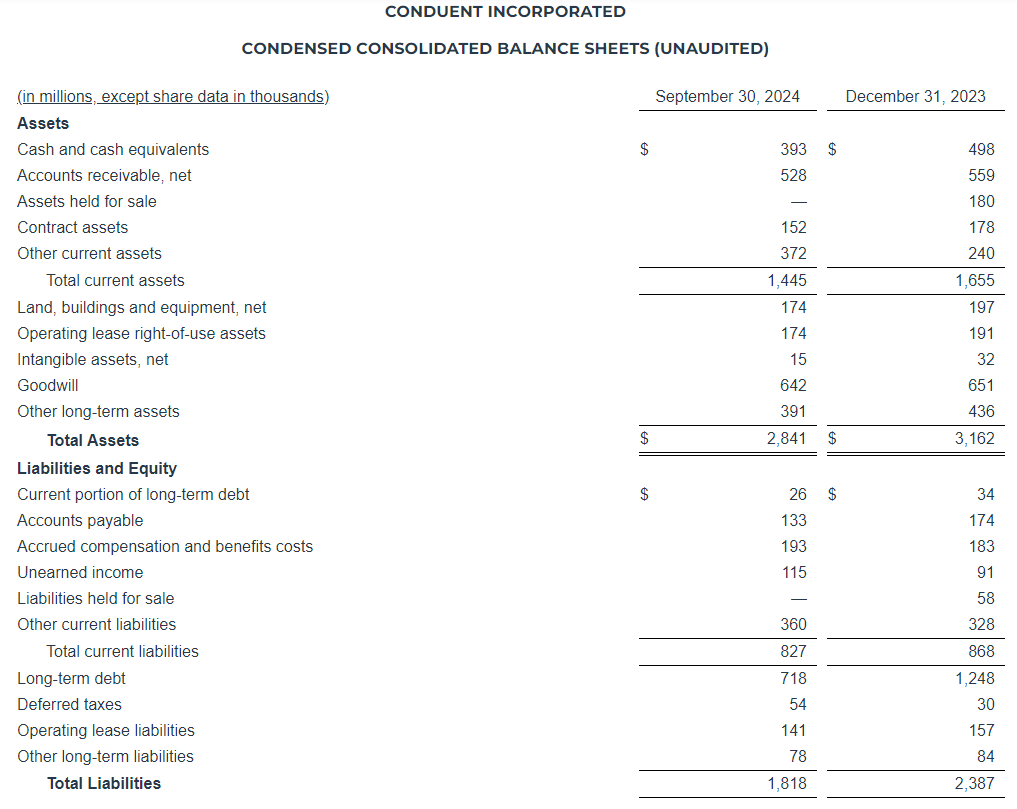
Conduent’s liquidity position remains strong with long-dated debt maturities and a modest net leverage ratio.
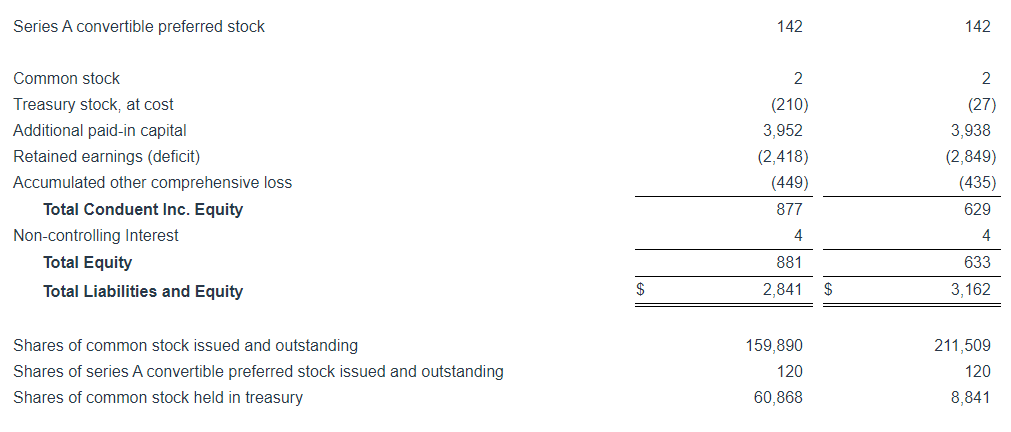
In the third quarter of 2024, the company repurchased approximately 3.9 million shares of its common stock in connection with its previously approved $75 million share repurchase program, which has now been completed.
Additional Q3 2024 Performance Highlights
Conduent achieved several milestones in technology-led solutions, operational excellence and culture, including:
Appointed a new Group President of the Commercial segment and a new President of Government Solutions;
Achieved Leader status across all five categories in the NelsonHall 2024 NEAT Report for Healthcare Payer Operational Transformation;
Named “Best Place to Work for Disability Inclusion” for third consecutive year;
Recognized by Forbes for fourth consecutive year as one of America’s Best Employers for Diversity;
Announced open payments fare collection for Venice and Paris regions allowing transit passengers to pay with contactless credit/debit cards and digital wallets. 22 cities now use Conduent open payments for transit;
Received a contract award from the Wisconsin Department of Children and Families to design, develop and implement a modernized child support system to transform service delivery for children and families across the state; and
Awarded a new three-year contract with a leading global logistics provider for our FastCap® Finance Analytics solution.
FY 2024 Outlook(2,3)
FY 2023 Actuals
FY 2024 Outlook(2,3)
Adj. Revenue(1)
$3,320M
$3,185M – $3,215M
Adj. EBITDA(1) / Adj. EBITDA Margin(1)
$247M / 7.4%
3.75% – 4.0%
(1) Refer to Appendix for definition and complete non-GAAP reconciliations of Adjusted Revenue, Adjusted EBITDA, Adjusted EBITDA Margin, Adjusted Diluted EPS and Adjusted Free Cash Flow. (2) Refer to Appendix for definition. (3) Refer to Appendix for additional information regarding non-GAAP outlook.
Conference Call
Management will present the results during a conference call and webcast on November 6, 2024 at 9:00 a.m. ET.
The call will be available by live audio webcast along with the news release and online presentation slides at https://investor.conduent.com/.
The conference call will also be available by calling 877-407-4019 toll-free. If requested, the conference ID for this call is 13748951.
The international dial-in is 1-201-689-8337. The international conference ID is also 13748951.
A recording of the conference call will be available by calling 1-877-660-6853 three hours after the conference call concludes. The replay ID is 13748951.
The telephone recording will be available until November 20, 2024.
About Conduent
Conduent delivers digital business solutions and services spanning the commercial, government and transportation spectrum – creating valuable outcomes for its clients and the millions of people who count on them. The Company leverages cloud computing, artificial intelligence, machine learning, automation and advanced analytics to deliver mission-critical solutions. Through a dedicated global team of approximately 55,000 associates, process expertise and advanced technologies, Conduent’s solutions and services digitally transform its clients’ operations to enhance customer experiences, improve performance, increase efficiencies and reduce costs. Conduent adds momentum to its clients’ missions in many ways including disbursing approximately $100 billion in government payments annually, enabling 2.3 billion customer service interactions annually, empowering millions of employees through HR services every year and processing nearly 13 million tolling transactions every day. Learn more at www.conduent.com.
Non-GAAP Financial Measures
We have reported our financial results in accordance with accounting principles generally accepted in the U.S. (U.S. GAAP). In addition, we have discussed our financial results using non-GAAP measures. We believe these non-GAAP measures allow investors to better understand the trends in our business and to better understand and compare our results. Accordingly, we believe it is necessary to adjust several reported amounts, determined in accordance with U.S. GAAP, to exclude the effects of certain items as well as their related tax effects. Management believes that these non-GAAP financial measures provide an additional means of analyzing the results of the current period against the corresponding prior period. However, these non-GAAP financial measures should be viewed in addition to, and not as a substitute for, our reported results prepared in accordance with U.S. GAAP. Our non-GAAP financial measures are not meant to be considered in isolation or as a substitute for comparable U.S. GAAP measures and should be read only in conjunction with our Condensed Consolidated Financial Statements prepared in accordance with U.S. GAAP. Our management regularly uses our non-GAAP financial measures internally to understand, manage and evaluate our business and make operating decisions. Providing such non-GAAP financial measures to investors allows for a further level of transparency as to how management reviews and evaluates our business results and trends. These non-GAAP measures are among the primary factors management uses in planning for and forecasting future periods. Compensation of our executives is based in part on the performance of our business based on certain of these non-GAAP measures. Refer to the “Non-GAAP Financial Measures” section attached to this release for a discussion of these non-GAAP measures and their reconciliation to the reported U.S. GAAP measures.
Forward-Looking Statements
This press release, any exhibits or attachments to this release, and other public statements we make may contain “forward-looking statements” as defined in the Private Securities Litigation Reform Act of 1995. The words “anticipate,” “believe,” “estimate,” “expect,” “expectations,” “in front of us,” “plan,” “intend,” “will,” “aim,” “should,” “could,” “forecast,” “target,” “may,” “continue to,” “looking to continue,” “endeavor,” “if,” “growing,” “projected,” “potential,” “likely,” “see,” “ahead,” “further,” “going forward,” “on the horizon,” “as we progress,” “going to,” “path from here forward,” “think,” “path to deliver,” “from here,” and similar expressions (including the negative and plural forms of such words and phrases), as they relate to us, are intended to identify forward-looking statements, but the absence of these words does not mean that a statement is not forward-looking. All statements other than statements of historical fact included in this press release or any attachment to this press release are forward-looking statements, including, but not limited to, statements regarding our financial results, condition and outlook; changes in our operating results; general market and economic conditions; our portfolio rationalization plans; our share repurchases; strength of our sales pipeline and balance sheet; our growth strategy; expectations regarding our trajectory toward top line growth, sequential margin improvement, less capital intensity and improved cash flow conversion; statements regarding portfolio divestitures, such as the sale of our Casualty Claims Solutions business; Conduent’s liquidity position remaining strong; progress that we’re making towards our billion dollars of deployable capital; and our projected financial performance for the full year 2024 and 2025, including all statements made under the section captioned “FY 2024 Outlook” within this release. These statements reflect our current views with respect to future events and are subject to certain risks, uncertainties and assumptions, many of which are outside of our control, that could cause actual results to differ materially from those expected or implied by such forward-looking statements contained in this press release, any exhibits to this press release and other public statements we make.
Important factors and uncertainties that could cause our actual results to differ materially from those in our forward-looking statements include, but are not limited to: risks related to recently completed dispositions including (i) the transfer of our BenefitWallet health savings account, medical savings account, and flexible spending account portfolio, (ii) the sale of our Curbside Management and Public Safety Solutions businesses and (iii) the sale of our Casualty Claims Solutions business, including but not limited to our ability to realize the benefits anticipated from such transactions, unexpected costs, liabilities or delays in connection with such transactions; ; government appropriations and termination rights contained in our government contracts, the competitiveness of the markets in which we operate and the significant transaction costs associated with such transactions; our ability to renew commercial and government contracts, including contracts awarded through competitive bidding processes; our ability to recover capital and other investments in connection with our contracts; our reliance on third-party providers; risk and impact of geopolitical events and increasing geopolitical tensions (such as the wars in Ukraine and the Middle East), macroeconomic conditions, natural disasters and other factors in a particular country or region on our workforce, customers and vendors; our ability to deliver on our contractual obligations properly and on time; changes in interest in outsourced business process services; claims of infringement of third-party intellectual property rights; our ability to estimate the scope of work or the costs of performance in our contracts; the loss of key senior management and our ability to attract and retain necessary technical personnel and qualified subcontractors; our failure to develop new service offerings and protect our intellectual property rights; our ability to modernize our information technology infrastructure and consolidate data centers; expectations relating to environmental, social and governance considerations; utilization of our stock repurchase program; the failure to comply with laws relating to individually identifiable information and personal health information; the failure to comply with laws relating to processing certain financial transactions, including payment card transactions and debit or credit card transactions; breaches of our information systems or security systems or any service interruptions; our ability to comply with data security standards; developments in various contingent liabilities that are not reflected on our balance sheet, including those arising as a result of being involved in a variety of claims, lawsuits, investigations and proceedings; risks related to divestitures and acquisitions; risk and impact of potential goodwill and other asset impairments; our significant indebtedness and the terms of such indebtedness; our failure to obtain or maintain a satisfactory credit rating and financial performance; our ability to obtain adequate pricing for our services and to improve our cost structure; our ability to collect our receivables, including those for unbilled services; a decline in revenues from, or a loss of, or a reduction in business from or failure of significant clients; fluctuations in our non-recurring revenue; increases in the cost of voice and data services or significant interruptions in such services; our ability to receive dividends or other payments from our subsidiaries; and other factors that are set forth in the “Risk Factors” section, the “Legal Proceedings” section, the “Management’s Discussion and Analysis of Financial Condition and Results of Operations” section and other sections in our 2023 Annual Report on Form 10-K, as well as in our Quarterly Reports on Form 10-Q and Current Reports on Form 8-K filed with or furnished to the Securities and Exchange Commission. Any forward-looking statements made by us in this release speak only as of the date on which they are made. We are under no obligation to, and expressly disclaim any obligation to, update or alter our forward-looking statements, whether because of new information, subsequent events or otherwise, except as required by law.
Projected Annual Recurring Revenue (ARR) for contracts signed in the prior 12 months, less the annualized impact of any client losses, contractual volume and price changes, and other known impacts for which the company was notified in that same time period, which could positively or negatively impact results. The metric annualizes the net impact to revenue. Timing of revenue impact varies and may not be realized within the forward 12-month timeframe. The metric is for indicative purposes only. This metric excludes non-recurring revenue signings. This metric is not indicative of any specific 12 month timeframe.
New Business Annual Contract Value (ACV): (New Business TCV / contract term) multiplied by 12.
New Business Total Contract Value (TCV): Estimated total future revenues from contracts signed during the period related to new logo, new service line or expansion with existing customers.
TTM: Trailing twelve months.
PBT: Profit before tax.
Non-GAAP Financial Measures
We have reported our financial results in accordance with accounting principles generally accepted in the U.S. (U.S. GAAP). In addition, we have discussed our financial results using non-GAAP measures.
We believe these non-GAAP measures allow investors to better understand the trends in our business and to better understand and compare our results. Accordingly, we believe it is necessary to adjust several reported amounts, determined in accordance with U.S. GAAP, to exclude the effects of certain items as well as their related tax effects. Management believes that these non-GAAP financial measures provide an additional means of analyzing the results of the current period against the corresponding prior period. However, these non-GAAP financial measures should be viewed in addition to, and not as a substitute for, the company’s reported results prepared in accordance with U.S. GAAP. Our non-GAAP financial measures are not meant to be considered in isolation or as a substitute for comparable U.S. GAAP measures and should be read only in conjunction with our Consolidated Financial Statements prepared in accordance with U.S. GAAP. Our management regularly uses our non-GAAP financial measures internally to understand, manage and evaluate our business and make operating decisions, and providing such non-GAAP financial measures to investors allows for a further level of transparency as to how management reviews and evaluates our business results and trends. These non-GAAP measures are among the primary factors management uses in planning for and forecasting future periods. Compensation of our executives is based in part on the performance of our business based on certain of these non-GAAP measures.
Management cautions that amounts presented in accordance with Conduent’s definition of non-GAAP financial measures may not be comparable to similar measures disclosed by other companies because not all companies calculate non-GAAP measures in the same manner.
A reconciliation of the following non-GAAP financial measures to the most directly comparable financial measures calculated and presented in accordance with U.S. GAAP are provided below.
These reconciliations also include the income tax effects for our non-GAAP performance measures in total, to the extent applicable. The income tax effects are calculated under the same accounting principles as applied to our reported pre-tax performance measures under Accounting Standards Codification 740, which employs an annual effective tax rate method. The noted income tax effect for our non-GAAP performance measures is effectively the difference in income taxes for reported and adjusted pre-tax income calculated under the annual effective tax rate method. The tax effect of the non-GAAP adjustments was calculated based upon evaluation of the statutory tax treatment and the applicable statutory tax rate in the jurisdictions in which such charges were incurred.
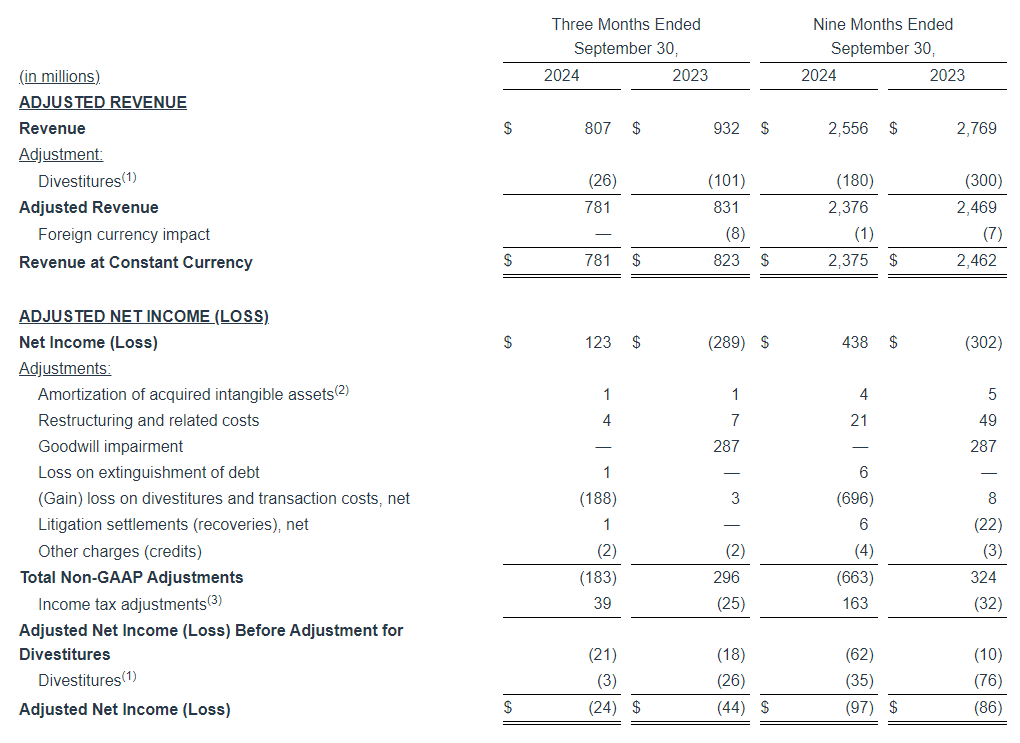
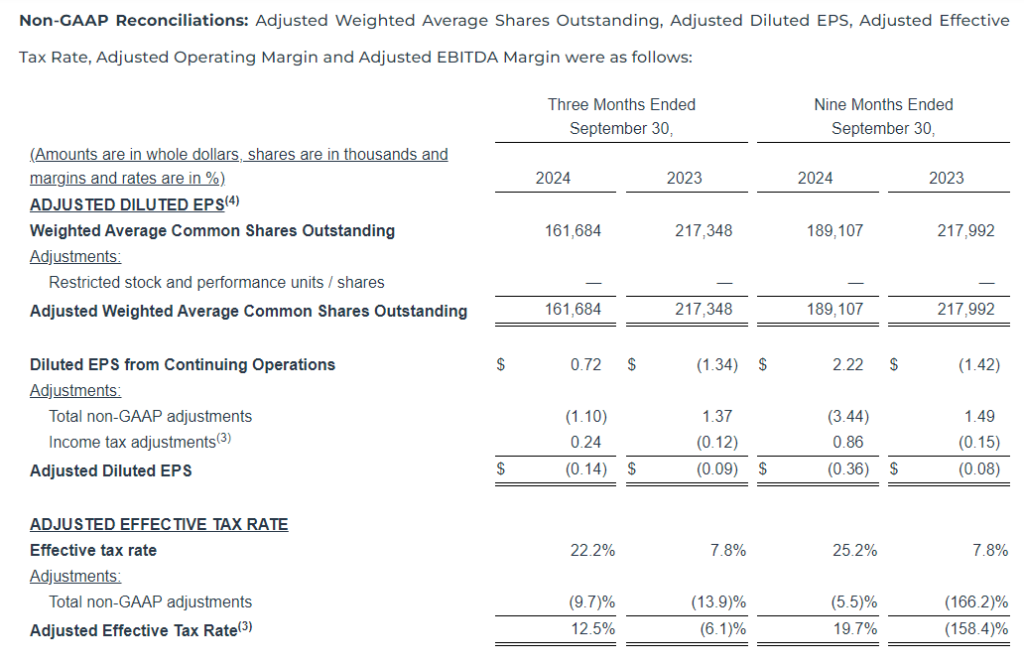
Adjusted Revenue, Adjusted Profit Before Tax, Adjusted Net Income (Loss), Adjusted Diluted Earnings per Share, Adjusted Weighted Average Common Shares Outstanding, and Adjusted Effective Tax Rate
We make adjustments to Net Income (Loss) before Income Taxes for the following items, as applicable, to the particular financial measure, for the purpose of calculating Adjusted Revenue, Adjusted Profit Before Tax, Adjusted Net Income (Loss), Adjusted Diluted Earnings per Share, Adjusted Weighted Average Common Shares Outstanding, and Adjusted Effective Tax Rate:
Amortization of acquired intangible assets. The amortization of acquired intangible assets is driven by acquisition activity, which can vary in size, nature and timing as compared to other companies within our industry and from period to period.
Restructuring and related costs. Restructuring and related costs include restructuring and asset impairment charges as well as costs associated with our strategic transformation program.
Goodwill impairment. This represents goodwill impairment charges related to entering the agreement to transfer the BenefitWallet portfolio.
(Gain) loss on divestitures and transaction costs, net. Represents (gain) loss on divested businesses and transaction costs.
Litigation settlements (recoveries), net represents settlements or recoveries for various matters subject to litigation.
Loss on extinguishment of debt. This represents write-off related debt issuance costs related to prepayments of debt.
Other charges (credits). This includes Other (income) expenses, net on the Condensed Consolidated Statements of Income (loss) and other insignificant (income) expenses and other adjustments.
Divestitures. Revenue and Adjusted EBITDA of divested businesses are excluded.
The company provides adjusted net income and adjusted EPS financial measures to assist our investors in evaluating our ongoing operating performance for the current reporting period and, where provided, over different reporting periods, by adjusting for certain items which may be recurring or non-recurring and which in our view do not necessarily reflect ongoing performance. We also internally use these measures to assess our operating performance, both absolutely and in comparison to other companies, and in evaluating or making selected compensation decisions.
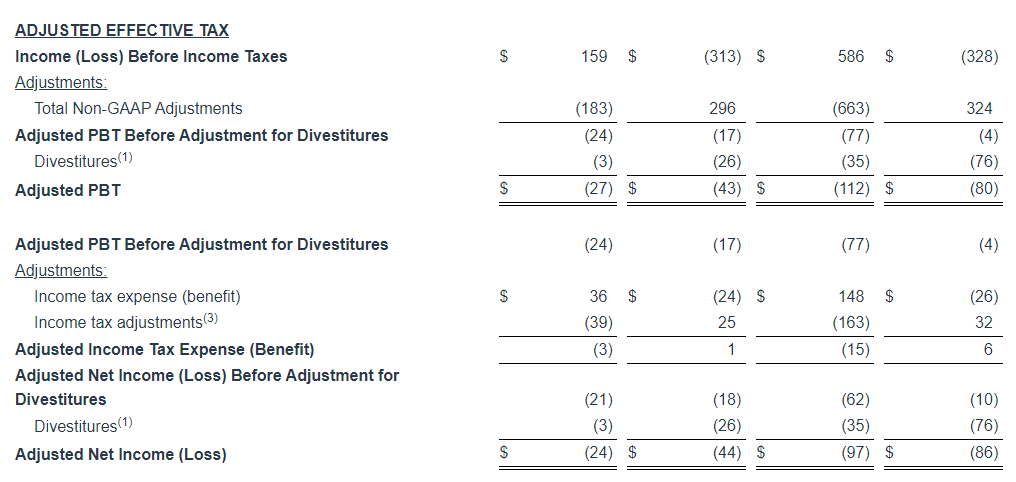
Management believes that the adjusted effective tax rate, provided as supplemental information, facilitates a comparison by investors of our actual effective tax rate with an adjusted effective tax rate which reflects the impact of the items which are excluded in providing adjusted net income and certain other identified items, and may provide added insight into our underlying business results and how effective tax rates impact our ongoing business.
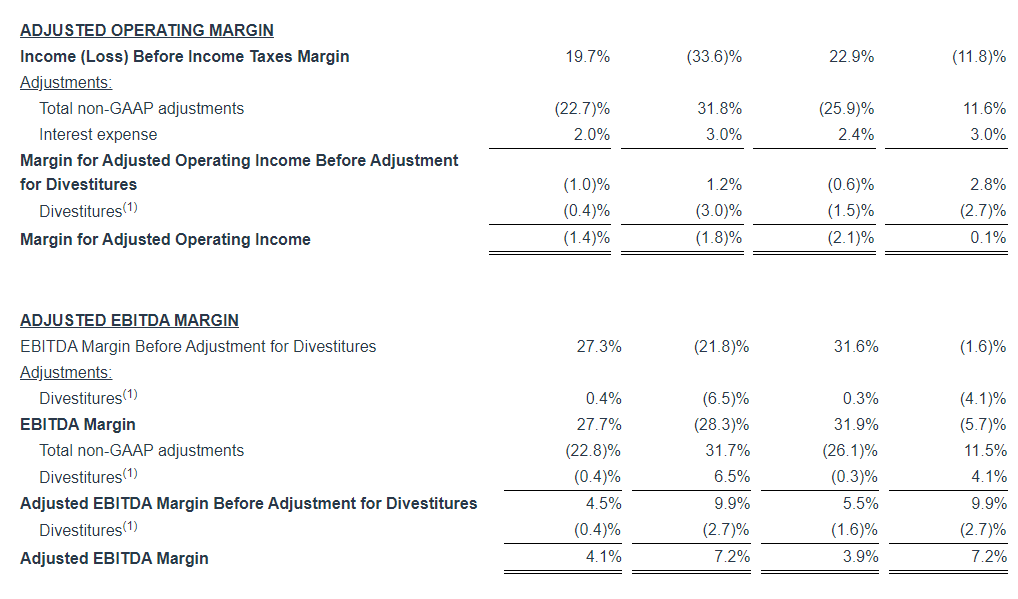
Adjusted Revenue, Adjusted Operating Income and Adjusted Operating Margin
We make adjustments to Costs and Expenses and Operating Margin for the following items, as applicable, for the purpose of calculating Adjusted Revenue, Adjusted Operating Income and Adjusted Operating Margin:
Amortization of acquired intangible assets.
Restructuring and related costs.
Interest expense. Interest expense includes interest on long-term debt and amortization of debt issuance costs.
Goodwill impairment.
Loss on extinguishment of debt.
(Gain) loss on divestitures and transaction costs, net.
Litigation settlements (recoveries), net.
Other charges (credits).
Divestitures.
We provide our investors with adjusted revenue, adjusted operating income and adjusted operating margin information, as supplemental information, because we believe it offers added insight, by itself and for comparability between periods, by adjusting for certain non-cash items as well as certain other identified items which we do not believe are indicative of our ongoing business, and may also provide added insight on trends in our ongoing business.
Adjusted EBITDA and EBITDA Margin
We use Adjusted EBITDA and Adjusted EBITDA Margin as an additional way of assessing certain aspects of our operations that, when viewed with the U.S. GAAP results and the accompanying reconciliations to corresponding U.S. GAAP financial measures, provide a more complete understanding of our on-going business. Adjusted EBITDA represents income (loss) before interest, income taxes, depreciation and amortization and contract inducement amortization adjusted for the following items. Adjusted EBITDA Margin is Adjusted EBITDA divided by revenue or adjusted revenue, as applicable.
Restructuring and related costs.
Goodwill impairment.
Loss on extinguishment of debt.
(Gain) loss on divestitures and transaction costs, net.
Litigation settlements (recoveries), net.
Other charges (credits).
Divestitures.
Adjusted EBITDA is not intended to represent cash flows from operations, operating income (loss) or net income (loss) as defined by U.S. GAAP as indicators of operating performance.
Free Cash Flow
Free Cash Flow is defined as cash flows from operating activities as reported on the condensed consolidated statement of cash flows, less cost of additions to land, buildings and equipment, cost of additions to internal use software, and proceeds from sales of land, buildings and equipment. We use the non-GAAP measure of Free Cash Flow as a criterion of liquidity. We use Free Cash Flow as a measure of liquidity to determine amounts we can reinvest in our core businesses, such as amounts available to make acquisitions and invest in land, buildings and equipment and internal use software, after required payments on debt. In order to provide a meaningful basis for comparison, we are providing information with respect to our Free Cash Flow reconciled to cash flow provided by operating activities, which we believe to be the most directly comparable measure under U.S. GAAP.
Adjusted Free Cash Flow
Adjusted Free Cash Flow is defined as Free Cash Flow from above plus adjustments for litigation insurance recoveries, transaction costs, taxes paid on gains from divestitures and litigation recoveries, proceeds from failed sale-leaseback transactions and certain other identified adjustments. We use Adjusted Free Cash Flow, in addition to Free Cash Flow, to provide supplemental information to our investors concerning our ability to generate cash from our ongoing operating activities; by excluding these items, we believe we provide useful additional information to our investors to help them further understand our ability to generate cash period-over-period as well as added information on comparability to our competitors. Such as with Free Cash Flow information, as so adjusted, it is specifically not intended to provide amounts available for discretionary spending. We have added certain adjustments to account for items which we do not believe reflect our core business or operating performance, and we computed all periods with such adjusted costs.
Revenue at Constant Currency
To better understand trends in our business, we believe that it is helpful to adjust revenue to exclude the impact of changes in the translation of foreign currencies into U.S. Dollars. We refer to this adjusted revenue as “constant currency.” Currency impact is determined as the difference between actual growth rates and constant currency growth rates. This currency impact is calculated by translating the current period activity in local currency using the comparable prior-year period’s currency translation rate.
Non-GAAP Outlook
In providing the Full Year 2024 outlook for Adjusted EBITDA Margin we exclude certain items which are otherwise included in determining the comparable U.S. GAAP financial measure. A description of the adjustments which historically have been applicable in determining Adjusted EBITDA Margin is reflected in the table below. We are providing such outlook only on a non-GAAP basis because the company is unable without unreasonable efforts to predict with reasonable certainty the totality or ultimate outcome or occurrence of these adjustments for the forward-looking period, which can be dependent on future events that may not be reliably predicted. Based on past reported results, where one or more of these items have been applicable, such excluded items could be material, individually or in the aggregate, to reported results. We have provided an outlook for Adjusted Revenue only on a non-GAAP basis using foreign currency translation rates as of current period end due to the inability to, without unreasonable efforts, accurately predict foreign currency impact on revenues. Full Year 2024 Outlook for Adjusted Free Cash Flow is provided as a factor of expected Adjusted EBITDA, and such outlook is only available on a non-GAAP basis for the reasons described above. For the same reason, we are unable to provide a GAAP expected adjusted tax rate, which adjusts for our non-GAAP adjustments.
Non-GAAP Reconciliations: Adjusted Revenue, Revenue at Constant Currency, Adjusted Net Income (Loss), Adjusted Effective Tax, Adjusted Operating Income (Loss) and Adjusted EBITDA were as follows (see footnotes on last page of Non-GAAP reconciliations):
Key Points: – Dow Jones, S&P 500, and Nasdaq post significant gains following Trump’s presidential win. – S&P Regional Banking ETF jumps over 10%, fueled by expectations of favorable financial policies. – Tesla shares climb over 10% in response to anticipated business-friendly conditions.
U.S. stocks soared on Wednesday as investors reacted to Donald Trump’s election victory over Kamala Harris, marking his return to the White House. A pivotal call in Wisconsin by the Associated Press early that morning secured Trump the necessary electoral votes, generating a major market response across sectors. With Trump set to be the 47th president, major indices surged. The Dow Jones Industrial Average spiked more than 1,100 points, or 2.7%, leading the rally. Following closely, the S&P 500 gained about 1.5%, while the tech-centric Nasdaq Composite rose approximately 2%.
The small-cap Russell 2000 posted particularly strong gains, jumping over 4.2% at the open, spurred by a surge in regional banks and financials. Many investors interpret Trump’s return as a sign of pro-business policies that could favor financial and industrial sectors, given his history of lower tax policies and financial deregulation during his previous term. The S&P Regional Banking ETF (KRE) rose more than 10% early Wednesday, underscoring this trend. Analysts believe that smaller regional banks are set to benefit from a more relaxed regulatory environment, making financials one of the day’s top-performing sectors.
Beyond financial stocks, the 10-year Treasury yield climbed to 4.46%, reflecting higher confidence in economic growth under the incoming administration. Rising yields often signal investor optimism, though they also reflect anticipated inflation. The dollar also strengthened against major global currencies, and Bitcoin surged to an all-time high, with investors anticipating a favorable climate for cryptocurrency investments. The gains in both the dollar and Bitcoin underscore how investors are re-evaluating asset allocation based on the potential for significant economic and regulatory shifts in the U.S.
Technology stocks, and particularly Tesla, were other standout winners. Tesla’s stock shot up by more than 10%, propelled by CEO Elon Musk’s open support of Trump and the potential for business-friendly policies. Musk has previously praised Trump’s tax and regulatory agenda, and with renewed market optimism, analysts expect Tesla and other growth-driven tech companies to benefit from potentially eased restrictions. The strong performance across tech stocks highlights broader investor enthusiasm for sectors with substantial growth potential under Trump’s policies.
Meanwhile, uncertainty around Congress control remains, as Republicans have flipped the Senate, while the House remains too close to call. Control of both chambers could substantially influence the type and extent of economic policies Trump can implement. As of now, investors are weighing scenarios around tax reform, stimulus packages, and regulatory adjustments that could impact sectors like energy, infrastructure, and finance.
The presidential election outcome is expected to drive market momentum in the near term, particularly in areas like financial services, infrastructure, and industrials. The anticipated mix of fiscal stimulus, tax policy changes, and deregulation, while not fully certain, reflects investor sentiment in favor of economic expansion under Trump’s leadership. How the markets react in the longer term will depend on the clarity of legislative actions and potential shifts in U.S. trade policy.
NEW YORK, November 6, 2024 /PRNewswire/ — Bit Digital, Inc. (Nasdaq: BTBT) (“Bit Digital” or the “Company”), a global platform for high-performance computing (“HPC”) infrastructure and digital asset production headquartered in New York, announced its unaudited digital asset production, HPC services revenue, and corporate updates for the month of October 2024.
Corporate Highlights for October 2024
The Company had 256 servers actively generating revenue from its initial Bit Digital AI contract, as of October 31, 2024. The Company earned approximately $4.3 million of unaudited revenue from this contract during the month of October 2024.
In October 2024, the Company produced 52.2 BTC, a 1.4% increase compared to the prior month.
The Company’s active hash rate was approximately 2.43 EH/s as of October 31, 2024
Treasury holdings of BTC and ETH were 781.2 and 27,503.4 with a fair market value of approximately $54.8 million and $69.2 million, respectively, on October 31, 2024.
The BTC equivalent1 of our digital asset holdings as of October 31, 2024, was approximately 1,768.6 or approximately $124.2 million.
The Company had cash and cash equivalents of $79.8 million and total liquidity (defined as cash and cash equivalents, USDC, and the fair market value of digital assets) of approximately $203.9 million, as of October 31, 2024.
Proof-of-Stake Highlights
The Company had approximately 21,568 ETH actively staked in native staking protocols as of October 31, 2024.
Bit Digital earned a blended APY of approximately 3.4% on its staked ETH position for the month of October 2024.
The Company earned aggregate staking rewards of approximately 62.2 ETH during October 2024.
Upcoming Events
Roth Technology Equities Conference, New York, NY on November 19-20
NDR with H.C. Wainwright, San Francisco, CA on November 21-22
Noble Capital Markets NobleCon20 Emerging Growth Equity Conference, Boca Raton, FL on December 3-4
Riley Energy Convergence Conference, New York, NY on December 4
About Bit Digital
Bit Digital, Inc. is a global platform for high-performance computing (“HPC”) infrastructure and digital asset production headquartered in New York City. Our bitcoin mining operations are located in the US, Canada, and Iceland. The Company has established a business line, Bit Digital AI, that offers infrastructure services for artificial intelligence applications. For additional information, please contact ir@bit-digital.com or visit our website at www.bit-digital.com.
Investor Notice
Investing in our securities involves a high degree of risk. Before making an investment decision, you should carefully consider the risks, uncertainties and forward-looking statements described under “Risk Factors” in Item 3.D of our most recent Annual Report on Form 20-F for the fiscal year ended December 31, 2023. If any material risk was to occur, our business, financial condition or results of operations would likely suffer. In that event, the value of our securities could decline and you could lose part or all of your investment. The risks and uncertainties we describe are not the only ones facing us. Additional risks not presently known to us or that we currently deem immaterial may also impair our business operations. In addition, our past financial performance may not be a reliable indicator of future performance, and historical trends should not be used to anticipate results in the future. Future changes in the network-wide mining difficulty rate or bitcoin hash rate may also materially affect the future performance of Bit Digital’s production of bitcoin. Actual operating results will vary depending on many factors including network difficulty rate, total hash rate of the network, the operations of our facilities, the status of our miners, and other factors.
Safe Harbor Statement
This press release may contain certain “forward-looking statements” relating to the business of Bit Digital, Inc., and its subsidiary companies. All statements, other than statements of historical fact included herein are “forward-looking statements.” These forward-looking statements are often identified by the use of forward-looking terminology such as “believes,” “expects,” or similar expressions, involving known and unknown risks and uncertainties. Although the Company believes that the expectations reflected in these forward-looking statements are reasonable, they do involve assumptions, risks and uncertainties, and these expectations may prove to be incorrect. Investors should not place undue reliance on these forward-looking statements, which speak only as of the date of this press release. The Company’s actual results could differ materially from those anticipated in these forward-looking statements as a result of a variety of factors, including those discussed in the Company’s periodic reports that are filed with the Securities and Exchange Commission and available on its website at http://www.sec.gov. All forward-looking statements attributable to the Company or persons acting on its behalf are expressly qualified in their entirety by these factors. Other than as required under the securities laws, the Company does not assume a duty to update these forward-looking statements.
Leading workplace solutions provider joins forces with strategic reseller partner to enhance procurement efficiency and deliver a curated customer experience
BOCA RATON, Fla.–(BUSINESS WIRE)–Nov. 6, 2024– The ODP Corporation (NASDAQ:ODP) (“ODP,” or the “Company”), a leading provider of products, services and technology solutions to businesses and consumers, today announced a partnership with a large, growing strategic reseller organization, offering quality office, furniture, print, promotional and facility resource solutions to large multi-site companies. This partnership, worth up to $1.5 billion spanning a 10-year period, will leverage the reseller provider’s expertise in creating custom, results-driven e-commerce solutions and the Company’s extensive fulfillment centers and delivery network.
“This collaboration enables a leader in reseller services to leverage our comprehensive product and service offerings, national distribution and award-winning e-commerce platform to service their customers,” said David Centrella, EVP of The ODP Corporation and President of ODP Business Solutions. “This partnership reflects our commitment to providing solutions that address unique business needs.”
“This partnership underscores ODP’s commitment to providing value-added solutions that will help businesses and vendors thrive in today’s competitive landscape,” said Nisha Brown, VP of Marketing & Product Management at ODP Business Solutions. “We’re excited about the opportunities this brings to our customers and the broader business community.”
To learn more about The ODP Corporation, visit theodpcorp.com.
About The ODP Corporation The ODP Corporation (NASDAQ:ODP) is a leading provider of products and services through an integrated business-to-business (B2B) distribution platform and omnichannel presence, which includes world-class supply chain and distribution operations, dedicated sales professionals, online presence and a network of Office Depot and OfficeMax retail stores. Through its operating companies Office Depot, LLC; ODP Business Solutions, LLC; and Veyer, LLC, The ODP Corporation empowers every business, professional, and consumer to achieve more every day. For more information, visit theodpcorp.com.
This communication may contain forward-looking statements within the meaning of the Private Securities Litigation Reform Act of 1995. These statements or disclosures may discuss goals, intentions and expectations as to future trends, plans, events, results of operations, cash flow or financial condition, or state other information relating to, among other things, The ODP Corporation (“the Company”), based on current beliefs and assumptions made by, and information currently available to, management. Forward-looking statements generally will be accompanied by words such as “anticipate,” “believe,” “plan,” “could,” “estimate,” “expect,” “forecast,” “guidance,” “expectations”, “outlook,” “intend,” “may,” “possible,” “potential,” “predict,” “project,” “propose” “aim” or other similar words, phrases or expressions, or other variations of such words. These forward-looking statements are subject to various risks and uncertainties, many of which are outside of the Company’s control. There can be no assurances that the Company will realize these expectations or that these beliefs will prove correct, and therefore investors and stakeholders should not place undue reliance on such statements.
Investors and shareholders should carefully consider the foregoing factors and the other risks and uncertainties described in the Company’s Annual Reports on Form 10-K, Quarterly Reports on Form 10-Q, and Current Reports on Form 8-K filed with the U.S. Securities and Exchange Commission. The Company does not assume any obligation to update or revise any forward-looking statements.
Third Quarter Revenue of $1.8 Billion with GAAP EPS of $2.04; Adjusted EPS of $0.71
Significant New Business Wins Improving Future Growth Profile
Progress on B2B Pivot; Pursuing Core Opportunities in New Adjacent Industry Segments
Company Repurchased Approximately $295 Million of Shares Year to Date
Company Completes Varis Sale Subsequent to Quarter End
BOCA RATON, Fla.–(BUSINESS WIRE)–Nov. 6, 2024– The ODP Corporation (“ODP,” or the “Company”) (NASDAQ:ODP), a leading provider of products, services, and technology solutions to businesses and consumers, today announced results for the third quarter ended September 28, 2024.
Third Quarter 2024 Summary(1)(2)(3)
Total reported sales of $1.8 billion, down 11% versus the prior year on a reported basis. The decrease in reported sales is largely related to lower sales in its Office Depot Division, primarily due to 53 fewer retail locations in service compared to the previous year and reduced transactions, as well as lower sales in its ODP Business Solutions Division
GAAP operating income of $102 million and net income from continuing operations of $68 million, or $2.04 per diluted share, versus $108 million and $82 million, respectively, or $2.09 per diluted share, in the prior year period
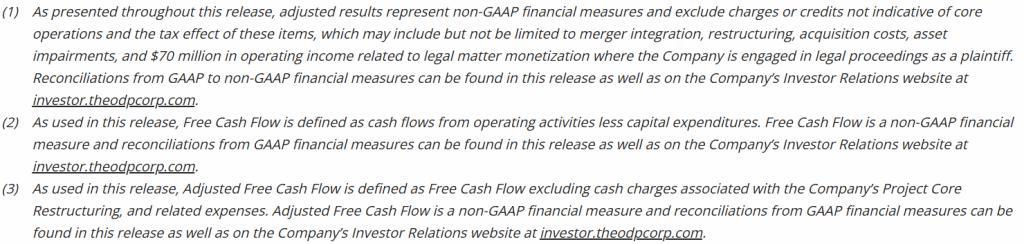
Adjusted operating income of $41 million, compared to $112 million in the third quarter of 2023; adjusted EBITDA of $62 million, compared to $138 million in the third quarter of 2023. Adjusted operating income in the third quarter of 2024 excludes $70 million of income related to legal matter monetization where the Company is engaged in legal proceedings as a plaintiff
Adjusted net income from continuing operations of $24 million, or adjusted diluted earnings per share from continuing operations of $0.71, versus $85 million or $2.17, respectively, in the prior year period. Adjusted net income from continuing operations in the third quarter of 2024 excludes $70 million of income or $51 million of income, net of tax related to legal matter monetization where the Company is engaged in legal proceedings as a plaintiff
Operating cash flow from continuing operations of $81 million and adjusted free cash flow of $68 million, versus $120 million and $102 million, respectively, in the prior year period
Repurchased 3 million shares at a cost of $102 million in the third quarter of 2024; Repurchased a total of approximately $141 million of shares when including purchases made in the third quarter and post quarter through the current date
$728 million of total available liquidity including $192 million in cash and cash equivalents, of which $11 million is presented in Current assets held for sale related to the Varis Division, at quarter end
“Our results in the quarter were below expectations, primarily driven by our retail division, as challenging macroeconomic conditions impacted our performance,” said Gerry Smith, chief executive officer of The ODP Corporation. “Weaker macroeconomic conditions led to more cautious consumer and business spending, impacting demand in our B2C and B2B divisions during the highly competitive back-to-school season. This was further compounded by major hurricanes negatively affecting our customer base and operations in our largest service areas.
“Despite these challenges, we’re making significant progress on our B2B pivot and initiatives to improve top-line trends. We’re leveraging our differentiated core strengths to pivot towards higher growth B2B opportunities, and we are beginning to see promising traction at both our ODP Business Solutions and Veyer Divisions. At Veyer, we continue to attract new third-party relationships, including launching service for one of the world’s largest social media-focused e-commerce platforms, positioning our supply chain business to pursue growth in a new high value industry segment. At Business Solutions, we secured one of the largest multi-year B2B contracts in our history, potentially generating up to $1.5 billion in revenue over a 10-year period. Additionally, we are making progress and actively pursuing opportunities in new, higher growth, adjacent industry segments where our core strengths also resonate. We’re building key distribution relationships in growing industry segments that spotlight our supply chain proficiency, our ability to supply products beyond office supplies, and our commitment to service excellence,” Smith continued.
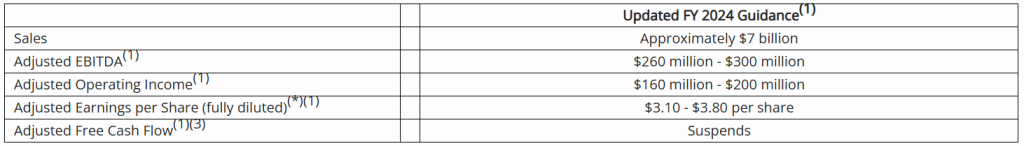
“We are excited about our progress and we’re allocating capital to fast-forward investments in our core business to capture these growth opportunities and generate the highest return for shareholders. Considering these core investments, along with our year-to-date performance against the challenging macroeconomic backdrop, we are amending our guidance for 2024. Additionally, we advanced Project Core and streamlined our operations by completing the sale of Varis, while continuing to assess and refine our retail strategy. While the progress we are making will take time to reflect in our results, we are confident that we’re on the right path, and our team is committed and focused on driving operational excellence to create long-term shareholder value,” Smith concluded.
Consolidated Results
Reported (GAAP) Results Total reported sales for the third quarter of 2024 were $1.8 billion, a decrease of 11% compared with the same period last year, driven primarily by lower sales in both its consumer and business-to-business (B2B) divisions. Lower sales in its consumer division, Office Depot, was primarily due to lower retail and online consumer traffic and transactions, as well as 53 fewer stores in service compared to last year related to planned store closures. Sales at ODP Business Solutions Division were lower compared to last year and generally consistent with the first half of 2024, largely driven by macroeconomic factors causing more cautious spending among business customers and fewer transactions. Meanwhile, Veyer provided strong logistics support for the ODP Business Solutions and Office Depot Divisions, and continued to execute across its growth strategy, delivering supply chain and procurement solutions to new third-party customers and driving increases in external revenue.
The Company reported GAAP operating income of $102 million in the third quarter of 2024, down compared to GAAP operating income of $108 million in the prior year period. Operating results in the third quarter of 2024 included $61 million of credits, primarily due to the Company recognizing $70 million of income in its Condensed Consolidated Statement of Operations related to legal matter monetization where the Company is engaged in legal proceedings as a plaintiff. This was partially offset by $2 million in net merger and restructuring expenses and $7 million non-cash asset impairment related to the operating lease right-of-use (ROU) assets associated with the Company’s retail store locations. Net income from continuing operations was $68 million, or $2.04 per diluted share in the third quarter of 2024, down compared to net income from continuing operations of $82 million, or $2.09 per diluted share in the third quarter of 2023.
Adjusted (non-GAAP) Results(1) Adjusted results for the third quarter of 2024 exclude charges and credits totaling $61 million as described above and the associated tax impacts.
Third quarter 2024 adjusted EBITDA was $62 million compared to $138 million in the prior year period. This included depreciation and amortization of $24 million in the third quarter of 2024 and 2023
Third quarter 2024 adjusted operating income was $41 million, down compared to $112 million in the third quarter of 2023
Third quarter 2024 adjusted net income from continuing operations was $24 million, or $0.71 per diluted share, compared to $85 million, or $2.17 per diluted share, in the third quarter of 2023, a decrease of 67% on a per share basis
Division Results
ODP Business Solutions Division Leading B2B distribution solutions provider serving small, medium and enterprise level companies with an annual trailing-twelve-month revenue of $3.7 billion.
Reported sales were $916 million in the third quarter of 2024, down 8% compared to the same period last year. The decrease in sales was related primarily to weaker macroeconomic conditions, more cautious business spending environment, lower sales conversion, and fewer customers
Total adjacency category sales, including cleaning and breakroom, furniture, technology, and copy and print, were 44% of total ODP Business Solutions’ sales, flat with the prior year
Executing initiatives to convert strong pipeline of potential new business and implementing several initiatives to regain top-line traction. Recent customer wins include signing one of the largest contracts in Company history, potentially generating up to $1.5 billion in revenue over a 10-year period
Making progress on establishing presence in new, adjacent industry segments, where the Company’s core competencies resonate, leveraging its distribution and supply chain proficiency, ability to supply products beyond office supplies, and commitment to service excellence
Operating income was $28 million in the third quarter of 2024, down compared to $56 million in the same period last year on a reported basis. As a percentage of sales, operating income margin was 3%, down 250 basis points compared to the same period last year
Office Depot Division Leading provider of retail consumer and small business products and services distributed via Office Depot and OfficeMax retail locations and an eCommerce presence.
Reported sales were $861 million in the third quarter of 2024, down 15% compared to the prior year on a reported basis. Lower sales were partially driven by 53 fewer retail outlets in service associated with planned store closures, as well as lower demand relative to last year in major product categories, lower average order volume, and lower online sales. The Company closed nine retail stores in the quarter and had 885 stores at quarter end. Sales were down 10% on a comparable store basis
Store and online traffic were lower year over year due to macroeconomic factors causing sluggish consumer activity and demand during the highly competitive back-to-school season
Operating income was $23 million in the third quarter of 2024, compared to operating income of $66 million during the same period last year, driven primarily by the flow through impact from lower sales. As a percentage of sales, operating income was 3%, down 380 basis points compared to the same period last year
Veyer Division Nationwide supply chain, distribution, procurement and global sourcing operation supporting Office Depot and ODP Business Solutions, as well as third-party customers. Veyer’s assets and capabilities include 8 million square feet of infrastructure through a network of distribution centers, cross-docks, and other facilities throughout the United States; a global sourcing presence in Asia; a large private fleet of vehicles; and business next-day delivery to 98.5% of US population.
In the third quarter of 2024, Veyer provided support for its internal customers, ODP Business Solutions and Office Depot, as well as its third-party customers, generating sales of $1.2 billion
Operating income was $9 million in the third quarter of 2024, compared to $10 million in the prior year period driven by the flow through impact of lower sales to internal customers partially offset by the contribution related to services to third-party customers
Launched supply chain services for one of the world’s largest social media-focused e-commerce companies to deliver warehousing and fulfillment services for their online sales
In the third quarter of 2024, sales generated from third-party customers increased by approximately 30% compared to the same period last year, resulting in sales of $14 million. EBITDA of $3 million in the quarter represented a 3% decrease year over year, driven by Veyer’s investment in resources to support the launch of services for new customer additions
Share Repurchases
The Company continued to execute under its previously announced $1 billion share repurchase authorization valid through March 31, 2027. During the third quarter of 2024, the Company repurchased 3 million shares at a cost of $102 million. Since the end of the third quarter of 2024, the Company repurchased additional shares for $38 million.
“We’ve executed on our capital plan throughout the year, both investing in our business and returning approximately $295 million in capital to shareholders through share repurchases thus far in 2024,” said Adam Haggard, senior vice president and interim co-chief financial officer of The ODP Corporation. “As we move forward, we are prioritizing our capital allocation towards investing in the core business to capture high-return B2B growth opportunities that we believe will generate long-term value for shareholders. Considering this focus, while mindful of the ongoing challenging macroeconomic environment and our results year-to-date, we expect to substantially moderate the pace of share repurchases.”
The number of shares to be repurchased under the authorization in the future and the timing of such transactions will depend on a variety of factors, including market conditions, regulatory requirements, and other corporate considerations. The new share repurchase authorization could be suspended or discontinued at any time as determined by the Board of Directors.
Balance Sheet and Cash Flow
As of September 28, 2024, ODP had total available liquidity of approximately $728 million, consisting of $192 million in cash and cash equivalents, including $11 million that is presented in Current assets held for sale related to the Varis Division, and $536 million of available credit under the Fourth Amended Credit Agreement. Total debt was $246 million.
For the third quarter of 2024, cash provided by operating activities of continuing operations was $81 million, which included $10 million in restructuring spend, compared to cash provided by operating activities of continuing operations of $120 million in the third quarter of the prior year, which included $3 million in restructuring spend. The year-over-year change in operating cash flow is related to lower sales and the timing of certain working capital items.
Capital expenditures in the third quarter of 2024 were $22 million versus $20 million in the prior year period, reflecting continued growth investments in the Company’s digital transformation, distribution network, and eCommerce capabilities. Adjusted Free Cash Flow(3) was $68 million in the third quarter of 2024, compared to $102 million in the prior year period.
Progress on Project Core
As the Company previously announced, Project Core is an enterprise-wide cost improvement plan designed to create further efficiencies throughout its business, focused on driving enhanced operating results and shareholder value. The Company continues to make significant progress under Project Core and is in position to realize in-year savings of approximately $50 million and annualized savings of over $100 million when fully implemented. Restructuring and related charges associated with these actions are now estimated to be in the range of $40 million to $50 million, excluding those related to the Varis Division, and are expected to be substantially incurred throughout 2024.
Varis Division Update
Subsequent to the quarter, the Company sold its Varis Division, while retaining a minority interest of 19.9% after the sale. Under the terms of the related agreement, the Company will fund up to $4 million of expenses that may be incurred by Varis following the transaction date until December 31, 2025, and has no further obligations to contribute capital to Varis. The terms of the sale of Varis did not result in a materially different impact than previously estimated on our financial statements.
“We have completed the sale of Varis that aligns with our stated objectives of finalizing our capital commitment to the business, while providing ODP with a continued invested interest in the opportunities ahead,” added Smith.
2024 Guidance
“Our performance to date in 2024 has clearly been below expectations, impacted by deteriorating macroeconomic conditions, a challenging competitive landscape, and severe weather conditions,” said Smith. “As we look at the balance of the year, we are working to reposition our business and are fast-forwarding investments in resources necessary to pursue the new and exciting opportunities in our B2B and supply chain businesses. As we continue to assess our retail operations, we believe that our investments in our B2B pivot will help position ODP to generate value in the very large and growing market segments where our competitive advantage and customer focus resonates,” he added.
The Company is amending its 2024 full-year guidance as follows:
Updated full-year guidance for 2024
The Company’s full year guidance for 2024 includes non-GAAP measures, such as Adjusted EBITDA, Adjusted Operating Income, and Adjusted Earnings per Share (fully diluted). These measures exclude charges or credits not indicative of core operations, which may include but not be limited to restructuring charges, capital expenditures, acquisition-related costs, executive transition costs, asset impairments and other significant items that currently cannot be predicted without unreasonable efforts. The exact amount of these charges or credits are not currently determinable but may be significant. Accordingly, the Company is unable to provide equivalent GAAP measures or reconciliations from GAAP to non-GAAP for these financial measures.
The ODP Corporation will webcast a call with financial analysts and investors on November 6, 2024, at 9:00 am Eastern Time, which will be accessible to the media and the general public. To listen to the conference call via webcast, please visit The ODP Corporation’s Investor Relations website at investor.theodpcorp.com. A replay of the webcast will be available approximately two hours following the event.
About The ODP Corporation
The ODP Corporation (NASDAQ:ODP) is a leading provider of products, services, and technology solutions through an integrated business-to-business (B2B) distribution platform and omni-channel presence, which includes supply chain and distribution operations, dedicated sales professionals, online presence, and a network of Office Depot and OfficeMax retail stores. Through its operating companies ODP Business Solutions, LLC; Office Depot, LLC; and Veyer, LLC, The ODP Corporation empowers every business, professional, and consumer to achieve more every day. For more information, visit theodpcorp.com.
This communication may contain forward-looking statements within the meaning of the Private Securities Litigation Reform Act of 1995. These statements or disclosures may discuss goals, intentions and expectations as to future trends, plans, events, results of operations, cash flow or financial condition, or state other information relating to, among other things, the Company, based on current beliefs and assumptions made by, and information currently available to, management. Forward-looking statements generally will be accompanied by words such as “anticipate,” “believe,” “plan,” “could,” “estimate,” “expect,” “forecast,” “guidance,” “expectations”, “outlook,” “intend,” “may,” “possible,” “potential,” “predict,” “project,” “propose” or other similar words, phrases or expressions, or other variations of such words. These forward-looking statements are subject to various risks and uncertainties, many of which are outside of the Company’s control. There can be no assurances that the Company will realize these expectations or that these beliefs will prove correct, and therefore investors and stakeholders should not place undue reliance on such statements. Factors that could cause actual results to differ materially from those in the forward-looking statements include, among other things, highly competitive office products market and failure to differentiate the Company from other office supply resellers or respond to decline in general office supplies sales or to shifting consumer demands; competitive pressures on the Company’s sales and pricing; the risk that the Company is unable to transform the business into a service-driven, B2B platform or that such a strategy will not result in the benefits anticipated; the risk that the Company will not be able to achieve the expected benefits of its strategic plans, including benefits related to Project Core; the risk that the Company may not be able to realize the anticipated benefits of acquisitions due to unforeseen liabilities, future capital expenditures, expenses, indebtedness and the unanticipated loss of key customers or the inability to achieve expected revenues, synergies, cost savings or financial performance; the risk that the Company is unable to successfully maintain a relevant omni-channel experience for its customers; the risk that the Company is unable to execute the Maximize B2B Restructuring Plan successfully or that such plan will not result in the benefits anticipated; failure to effectively manage the Company’s real estate portfolio; loss of business with government entities, purchasing consortiums, and sole- or limited- source distribution arrangements; failure to attract and retain qualified personnel, including employees in stores, service centers, distribution centers, field and corporate offices and executive management, and the inability to keep supply of skills and resources in balance with customer demand; failure to execute effective advertising efforts and maintain the Company’s reputation and brand at a high level; disruptions in computer systems, including delivery of technology services; breach of information technology systems affecting reputation, business partner and customer relationships and operations and resulting in high costs and lost revenue; unanticipated downturns in business relationships with customers or terms with the suppliers, third-party vendors and business partners; disruption of global sourcing activities, evolving foreign trade policy (including tariffs imposed on certain foreign made goods); exclusive Office Depot branded products are subject to additional product, supply chain and legal risks; product safety and quality concerns of manufacturers’ branded products and services and Office Depot private branded products; covenants in the credit facility; general disruption in the credit markets; incurrence of significant impairment charges; retained responsibility for liabilities of acquired companies; fluctuation in quarterly operating results due to seasonality of the Company’s business; changes in tax laws in jurisdictions where the Company operates; increases in wage and benefit costs and changes in labor regulations; changes in the regulatory environment, legal compliance risks and violations of the U.S. Foreign Corrupt Practices Act and other worldwide anti-bribery laws; volatility in the Company’s common stock price; changes in or the elimination of the payment of cash dividends on Company common stock; macroeconomic conditions such as higher interest rates and future declines in business or consumer spending; increases in fuel and other commodity prices and the cost of material, energy and other production costs, or unexpected costs that cannot be recouped in product pricing; unexpected claims, charges, litigation, dispute resolutions or settlement expenses; catastrophic events, including the impact of weather events on the Company’s business; the discouragement of lawsuits by shareholders against the Company and its directors and officers as a result of the exclusive forum selection of the Court of Chancery, the federal district court for the District of Delaware or other Delaware state courts by the Company as the sole and exclusive forum for such lawsuits; and the impact of the COVID-19 pandemic on the Company’s business. The foregoing list of factors is not exhaustive. Investors and shareholders should carefully consider the foregoing factors and the other risks and uncertainties described in the Company’s Annual Reports on Form 10-K, Quarterly Reports on Form 10-Q, and Current Reports on Form 8-K filed with the U.S. Securities and Exchange Commission. The Company does not assume any obligation to update or revise any forward-looking statements.