Global Economy 2023 – Central Banks Face an Epic Battle Against Inflation Amid Political Obstacles
Where is the global economy heading in 2023?
After all the challenges of last year, it’s a question asked with concern. Just as the economy was dealing with the aftermath of the COVID-19 pandemic, Russia’s invasion of Ukraine added a little more impetus to global inflation.
Significant rises in the cost of vital items such as food and energy created a cost-of-living issue that needs to be addressed by households and businesses. Central banks reacted with a barrage of interest-rate hikes, while a wave of industrial action saw workers in many countries fighting for pay and conditions to keep pace with this more expensive economic era.
Now, as we begin 2023, these conditions are set to continue, and the IMF thinks that a third of the world will experience a recession in the coming months. This article discusses the weakening independence of central banks and the uncertainty and possible high costs the political influence brings.
This article takes a deep dive into the new interference the Federal Reserve and other central bankers are faced with. It was authored by Steve Schifferes, Honorary Research Fellow, City Political Economy Research Centre, City, University of London. Schifferes believes there are two key ways politics may interfere with central bank plans in 2023.
Some of the world’s biggest economies – and their central banks – face a tricky task this year taming inflation via higher interest rates without triggering a recession.
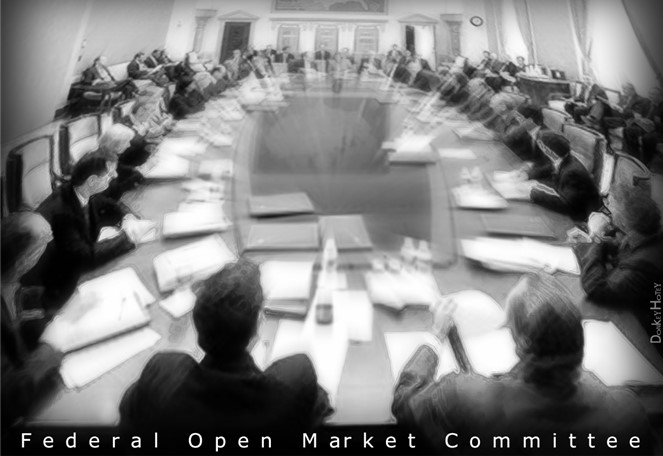
And whether they like it or not, the U.S. Federal Reserve, the Bank of England and other central banks are now being thrust into the center of a political debate that could threaten their independence as well as their ability to act decisively to curb rising prices.
I’ve been following and covering politics and finance for four decades as a reporter and now as an economics research fellow. I believe there are two key ways politics may interfere with central bank plans in 2023.
An Inflationary Challenge
High inflation is perhaps the biggest challenge facing the world economy over the coming year.
Inflation has rapidly accelerated and is now at or near its highest rate in decades in most developed economies like the U.S. and in Europe, causing living standards to stagnate or decline in many countries. This has particularly hurt the poorest people, who suffer a higher rate of inflation than the general population because they spend more of their income on food and energy.
The sharp rise in inflation caught central banks by surprise after two decades of low and stable inflation. They reacted by aggressively raising interest rates in the second half of 2022, with the Fed leading the way. The U.S. central bank lifted rates 4.25 percentage points over a six-month period, and the Bank of England, the European Central Bank, and others followed in its footsteps.
Their strategies seem to be working. Inflation in the U.S. has slowed, while in the U.K. and the eurozone, recent data suggest inflation may have peaked – although it’s still very high, at around 10% – and might start trending down.
But interest rate hikes – which are expected to continue in 2023, albeit at a slower pace – could further cloud the outlook for economic growth, which already looks grim for developed economies.
The Organization for Economic Cooperation and Development predicts that in 2023 both the U.S. and the eurozone will grow by only 0.5%, well below their historic averages, while Europe’s largest economy, Germany, will actually shrink by 0.3%. In the U.K., the Bank of England projects that the economy will continue to shrink until the middle of 2024.
Fiscal Spending and Inflation
That brings us to the first political problem that could upset central bank plans: government spending.
The politics is playing out in different ways. In the U.S., spending has increased substantially, most notably with the $1.2 trillion infrastructure bill signed into law in late 2021 and the $1.7 trillion budget bill passed in December.
This kind of expansionary fiscal policy, which may be in place for years, could undermine attempts by central banks like the Fed to fight inflation. As the central banks seek to reduce inflation by curbing demand, increased government spending has the opposite effect. This could force the Fed and other banks to raise rates even higher than they otherwise would have.
In Europe and the U.K., governments have been forced to spend billions to subsidize the energy bills of consumers and businesses, while the economic slowdown has reduced their tax revenue, leading to soaring government deficits
Nevertheless, in the U.K. the Conservative government has prioritized the fight against inflation, announcing cutbacks to consumer subsidies for energy, plus higher taxes and further cuts in public spending if it wins the next general election, which is expected to take place in 2024. While these actions are deflationary, they are politically unpopular.
The Bank of England is now split on whether or how fast to continue to raise rates.
Central Bank Independence Under Threat
The other political problem is more existential for central banks and makes their task all the more delicate.
For the past 20 years, their independence from government interference and the setting of public inflation targets at around 2% have helped them gain credibility in fighting inflation, which stayed at historic lows for much of the 21st century.
Now both their credibility and independence may be under threat.
Central bankers, especially in Europe, are acutely aware of public concerns about how higher interest rates might stifle growth, in part because their economies have been more severely affected than the U.S. by the Ukraine war. Meanwhile, consumers are being hit by higher mortgage payments, which may tank the housing market.
At the same time, central bank efforts to persuade workers not to ask for higher wages to compensate for inflation, which would help reduce the need for more interest rate hikes, have spectacularly backfired, especially in Britain, where a wave of strikes by public-sector workers shows no sign of abating.
Long-standing political tensions over the role of the European Central Bank have been exacerbated by the election of right-wing governments in several eurozone countries.
Traditionally, under the influence of Germany’s Bundesbank, the European Central Bank has worried about inflation more than other central banks. Under competing political pressures, it has moved more slowly than some other central banks to unwind its policy of low – and even negative – interest rates.
In the States, where Fed Chief Jerome Powell has rejected any attempt to mitigate his focus on inflation, political pressures may grow from both left and right, particularly if Donald Trump becomes the Republican presidential nominee. This ultimately may lead Congress or a new administration to try to change the central bank’s approach, its leadership, and even its mandate.
Uncharted Waters
None of this might be a problem if central bank projections of a sharp fall in inflation by the end of 2023 come to pass. But these projections are based on the belief that energy prices will continue to remain below their peak or even fall further in the coming year.
Just as in 2022, when central banks failed to grasp the inflationary threat early enough, other risks beyond their control, as well as political developments, may derail their hopes. These include an escalation of the war in Ukraine, which could raise energy prices further, more supply chain disruptions from China, and domestic pushes for higher wages.
With the cost-of-living crisis now at the top of the public’s agenda in many developed countries, the setting of interest rates has ceased to be just a technical matter and has instead become highly political. Both governments and central banks are entering uncharted waters in their attempt to curb inflation without stifling growth. If their projections prove overly optimistic, the political as well as the economic costs could be high.
All this means that the outlook for inflation is highly uncertain. And fears of 1970s-style stagflation – high inflation and stagnant economic growth – could become a reality.