The Iran war didn’t just push Brent crude past $100 a barrel — it drew a sharp line through the small-cap market, separating companies that are printing cash from those quietly bleeding out. One month in, that divide just got wider.
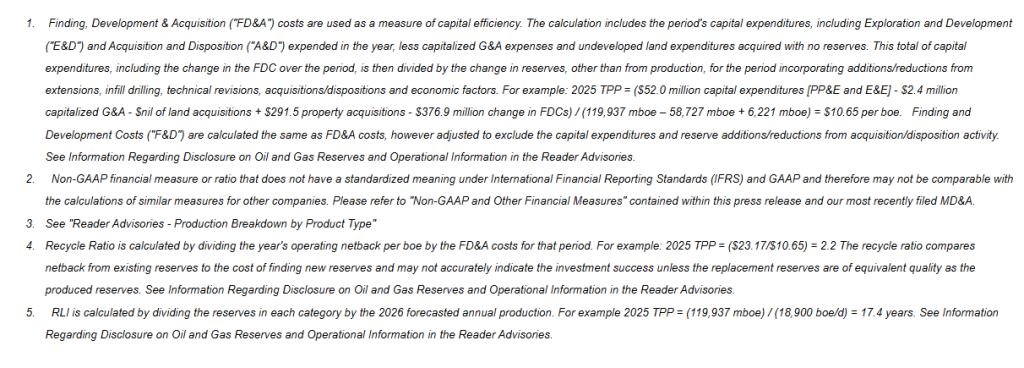
Brent crude surged 2.82% to $111.06 per barrel on Friday after two ultra-large container vessels owned by China Ocean Shipping Company — COSCO, the world’s fourth-largest shipping line by capacity — attempted to transit the Strait of Hormuz and were turned back. The incident carries significant weight: China is an ally of Iran, and Tehran had previously signaled that friendly nations’ ships could pass freely. The fact that even Chinese vessels are being blocked signals that Iran’s chokehold on the waterway remains firmly in place, despite diplomatic noise suggesting otherwise.
Iran controls access to a strait that handles roughly 20% of the world’s daily oil supply. Since the U.S.-Israeli strikes began on February 28, close to 500 million barrels of total liquids have been lost, with approximately 17.8 million barrels per day of oil and fuel flows disrupted, according to Rystad Energy. WTI, meanwhile, climbed to $97.01 on Friday — up from roughly $65 in February. The buffer that kept prices from going completely vertical is now gone. Rystad’s chief oil analyst described the global supply system as having shifted from “buffered to fragile,” with inventories drawn down to a point where there is little room left to absorb further shocks.
President Trump announced a 10-day pause on strikes targeting Iran’s energy infrastructure through April 6, and said talks were progressing — but markets barely reacted. The COSCO incident hit the same day, effectively negating any diplomatic optimism. Iran also reportedly allowed 10 oil tankers to pass through the strait this week as a goodwill gesture, but analysts were quick to caution that isolated shipments do not signal a reopening.
The Winners: Domestic Producers and LNG Players
The clearest beneficiaries are U.S.-based exploration and production companies with no Middle East operational exposure. They’re capturing elevated prices without the liability of stranded tankers, damaged facilities, or rerouting costs eating into the margins of globally integrated operators.
Small- and mid-cap names like Antero Resources (AR), Solaris Energy Infrastructure (SEI), and SM Energy (SM) have all been flagged by analysts as well-positioned to benefit from both higher prices and the scramble among European and Asian buyers to replace Persian Gulf supply. Antero in particular benefits from the LNG export surge — Asian LNG prices have skyrocketed more than 140% since the war began as Qatar halted exports, and U.S. natural gas producers with export exposure are capturing that spread directly. The SPDR S&P Oil & Gas Exploration & Production ETF (XOP) is up roughly 10% since the conflict started, significantly outpacing the broader market.
The Losers: Everyone Paying the Energy Tax
For small-cap companies outside the energy sector, $110 oil is a cost, not a catalyst. Airlines, regional manufacturers, consumer discretionary companies, and logistics-heavy businesses are absorbing higher input costs with limited pricing power and thin margins. Unlike large-caps with robust balance sheets, smaller companies can’t easily hedge energy exposure or wait out a prolonged commodity spike.
The macro backdrop makes it worse. The Russell 2000 entered correction territory this month and the timing is brutal. Approximately 32% of the debt held by Russell 2000 companies is floating-rate, meaning every basis point that rate-cut expectations get pushed back translates directly into higher interest expenses. With the Fed holding rates steady at its March 18 meeting and revising its inflation outlook higher, the one rate cut markets were pricing in for late 2026 is increasingly in doubt. Small-cap firms are facing approximately $368 billion in debt maturing in 2026 alone, much of it originally issued at near-zero rates — now needing to be refinanced at 6.5% to 8%.
Bank of America has noted that small caps with oil exposure but limited refinancing risk may be best positioned in the current environment. That framing is the right lens heading into Q1 earnings. The question isn’t whether oil stays at $110. It’s whether your small-cap holdings are collecting the windfall or paying the price for it — and with the Strait of Hormuz turning away even Chinese vessels, there’s no telling when this resolves.
The Trump administration has agreed to refund $1 billion in offshore wind lease fees to French energy giant TotalEnergies, effectively paying the company to abandon two major U.S. wind projects and redirect that capital into oil, gas, and liquefied natural gas development. The move marks one of the most aggressive — and costly — steps yet in the administration’s campaign to dismantle the offshore wind industry built up under the Biden era.
The Department of Interior announced Monday that TotalEnergies will surrender its leases for planned offshore wind projects off the coasts of North Carolina and New York. In exchange, the company will receive reimbursement up to the full amount it paid to acquire those leases. TotalEnergies has also pledged not to pursue any new offshore wind development in the United States. The refunded capital will be redirected toward the construction of a liquefied natural gas facility in Texas and the expansion of the company’s broader U.S. oil and gas portfolio.
For context, TotalEnergies paid roughly $133,000 for the North Carolina lease and approximately $795,000 for the New York and New Jersey lease — both purchased in 2022 during the height of the Biden administration’s offshore wind push. The Carolina Long Bay project had been designed to generate over one gigawatt of power, enough to supply roughly 300,000 homes. The New York project was even larger, with a planned capacity of three gigawatts capable of powering close to one million homes.
The deal raises immediate questions about the use of public funds. Environmental advocates were quick to characterize it as taxpayer money being spent to eliminate clean energy capacity rather than build it — particularly at a moment when the Iran conflict has sent oil prices surging and renewed global debate about energy security and diversification.
This transaction also comes after the administration’s earlier attempts to halt offshore wind construction were struck down by federal courts. Judges overturned executive orders that had targeted five major East Coast wind projects on national security grounds, allowing construction to continue. The TotalEnergies deal appears to signal a strategic pivot — using financial settlements to achieve what legal orders could not.
The broader energy policy picture is shifting rapidly. Ironically, on the same day this deal was announced, one of the offshore wind farms previously targeted by the administration — Coastal Virginia Offshore Wind — began delivering power to the Virginia grid. The developer, Dominion Energy, confirmed the milestone, underscoring the fact that the offshore wind industry, despite significant political headwinds, continues to advance.
For investors in the small and microcap energy space, the implications cut both ways. Companies with exposure to LNG infrastructure, domestic oil and gas development, and fossil fuel supply chains stand to benefit from the administration’s policy direction and capital reallocation. On the other side, smaller renewable energy developers and wind supply chain companies face an increasingly hostile regulatory and financial environment in the U.S., even as offshore wind capacity expands globally — with China leading the world in new installations.
The $1 billion question is whether this deal represents a one-time settlement or the beginning of a broader pattern of government-funded exits from the U.S. renewable energy sector.
President Trump issued a 60-day waiver of the Jones Act on Wednesday in a bid to cool surging domestic energy prices as the Iran conflict continues to hammer global oil markets. The move, confirmed by White House press secretary Karoline Leavitt, opens U.S. ports to foreign-flagged vessels for the next two months — covering crude oil, refined products like gasoline and diesel, natural gas, coal, fertilizer, and other energy-derived commodities.
The decision comes as Brent crude crossed $109 per barrel Wednesday morning — up more than 7% on the day — while WTI traded above $97. Gas prices at the pump have climbed to a national average of $3.84 per gallon, up sharply from $2.92 just one month ago, according to AAA data. Diesel has already crossed $5 per gallon nationally. The administration is clearly feeling political pressure to act ahead of the midterm cycle, and the Jones Act waiver is the most tangible move it has made so far.
What the Jones Act Actually Does
The Jones Act — formally the Merchant Marine Act of 1920 — requires that any cargo transported between U.S. ports be carried by vessels that are U.S.-built, U.S.-owned, U.S.-flagged, and U.S.-crewed. The law was designed to protect the domestic shipping industry after World War I, but has long been criticized by economists as an inflationary form of protectionism that raises the cost of moving goods within the country. With fewer than 100 Jones Act-compliant vessels in existence, the waiver immediately opens the door to a much larger pool of international tankers to move fuel between domestic ports.
The Practical Impact — And Its Limits
In theory, the waiver should have its biggest effect on refined product shipments from Gulf Coast refinery complexes to the more isolated East Coast — a corridor that has historically been a bottleneck during supply disruptions. Cheaper, more accessible shipping capacity means fuel can theoretically move faster and at lower cost to the regions that need it most.
But experts are already tempering expectations. The core problem isn’t moving fuel — it’s refining it. Most U.S. refineries are configured to process heavier Middle Eastern crude grades, while domestic shale production yields lighter oil. That structural mismatch means the U.S. still cannot fully self-supply even with more flexible shipping rules. The waiver makes domestic logistics more efficient, but it does not solve the underlying supply equation.
The Broader Policy Picture
The Jones Act move is reportedly just one item on a broader White House menu of potential energy interventions being considered, including possible Treasury-led action in energy futures markets and export bans on crude and refined products. Any of those measures — if enacted — would carry significant market implications across the energy sector.
For small and microcap investors, the read-through is layered. Domestic shippers and Jones Act operators could see near-term pricing pressure as foreign competition enters the market. Refiners with Gulf Coast exposure and East Coast distribution capability may benefit from improved logistics economics. And any company with meaningful fuel cost exposure — from regional truckers to agricultural operators to industrial manufacturers — should be watching this space closely as the administration continues to improvise policy responses to a crisis with no clear end date.
For years, the market’s story was simple — go big or go home. Mega-cap tech dominated headlines, attracted institutional capital, and left small and microcap stocks largely in the dust. That story has been changing fast in 2026. The question now is whether a war in the Middle East derails it before it fully plays out— and for investors focused on small cap investing in 2026, the answer may be more encouraging than the headlines suggest..
As of this week, the Russell 2000 is up nearly 9% year-to-date, outpacing both the S&P 500 and Nasdaq 100, which have delivered near-flat performance over the same period. The drivers behind that move are real and structural. But so is the new risk sitting squarely on top of them.
Why the Russell 2000 Is Outperforming in 2026
Small and microcap companies carry a disproportionately high share of floating-rate debt — roughly 40% of Russell 2000 company debt is floating-rate, compared to under 10% for S&P 500 constituents. When the Federal Reserve delivered three rate cuts in late 2025, bringing the target rate to 3.50%–3.75%, the impact on smaller companies was immediate. Borrowing costs dropped, profit margins expanded, and balance sheets that had been under pressure for two years began to breathe again.
Layered on top of that was the One Big Beautiful Bill Act, which brought its most consequential provisions — 100% bonus depreciation and immediate domestic R&D expensing — online on January 1, 2026. These provisions disproportionately benefit the capital-intensive businesses that populate the small and microcap universe. Add a valuation gap that had stretched to near-historic levels, with the Russell 2000 trading below 19 times forward earnings against the S&P 500’s 24 times, and institutional money had every reason to rotate into small caps in 2026.
How Oil Prices Are Affecting Small Cap Stocks Right Now
The U.S.-Israeli strikes on Iran that began February 28 changed the calculus. Oil prices have surged past $100 per barrel for the first time since 2022, with Brent crude briefly trading near $120 before pulling back. Shipping through the Strait of Hormuz dropped 95% in the first week of March, effectively cutting off roughly one-fifth of global oil supply. U.S. gasoline prices have risen more than 17% since the strikes began, and stagflation fears — an economy slowing while prices rise — are back in the conversation.
For small cap investing in 2026, this is not a peripheral concern. The rotation thesis rests on the Fed continuing to ease. If an energy-driven inflation spike freezes the Fed in its tracks, the highly leveraged firms within the Russell 2000 face a double hit of higher borrowing costs and slowing consumer demand. That dynamic already showed up on March 5, when the Russell 2000 dropped 1.9% in a single session — its sharpest single-day decline of the year — as the conflict escalated.
Why the Small Cap Rotation Thesis in 2026 Still Has Legs
There is a meaningful counterargument, and it lives inside the small-cap universe itself. Domestic energy producers, onshoring plays, and infrastructure-adjacent companies are direct beneficiaries of elevated oil prices and supply chain disruption. The small cap industrials and energy names that helped fuel the early-year rotation are not going away — they may actually accelerate as capital seeks shelter in domestic, tangible-earnings businesses over global tech exposure.
The U.S. is a net exporter of energy, which positions it to weather the supply disruption better than Europe and Asia — a dynamic that benefits domestically focused small-cap energy producers more than it hurts them.
What This Means for Small Cap Investing in 2026
The structural case for small cap stocks in 2026 has not fundamentally changed. Lower rates, favorable tax treatment, and compressed valuations relative to large caps all remain intact. What has changed is the risk profile of getting there. A prolonged conflict, sustained triple-digit oil prices, and a Fed forced to pause its easing cycle could extend the timeline — but not reverse the direction.
The companies best positioned in this environment are those with domestic revenue exposure, manageable fixed-rate debt, and real earnings — not the leveraged, speculative names that hitched a ride on the rotation. In microcap investing, that distinction between quality and speculation has rarely mattered more than it does right now.
The great rotation into small cap stocks is still in play. Investors who understand what is driving it — and what the real risks are — are the ones best positioned to capitalize on it in 2026.
Airline stocks moved sharply lower Monday as oil prices surged above $100 per barrel, raising concerns about rising jet fuel costs and pressure on industry profitability.
Shares of major U.S. carriers fell after crude oil briefly climbed above $110 per barrel, the highest level since 2022. The move followed escalating geopolitical tensions in the Middle East that disrupted shipping traffic through the Strait of Hormuz, one of the world’s most critical oil transit routes.
Delta Air Lines, American Airlines, and United Airlines all declined in early trading before trimming some losses. Domestic-focused carriers including Southwest Airlines, JetBlue Airways, and Alaska Air Group also traded lower as investors weighed the financial impact of higher fuel prices.
Fuel represents one of the largest operating expenses for airlines, typically accounting for roughly one-fifth to one-quarter of total costs. When oil prices climb quickly, airlines often face immediate margin pressure, particularly if ticket prices cannot be adjusted quickly enough to offset the increase.
Jet fuel prices have climbed significantly in recent weeks, rising by as much as $1.75 per gallon. At those levels, the largest U.S. airlines could see quarterly fuel expenses increase by roughly $1.5 billion each if elevated prices persist. Across the three largest carriers, the additional costs could approach $5 billion.
Higher fuel costs often translate into higher ticket prices as airlines attempt to protect margins. Carriers may adjust fares, reduce promotional pricing, or alter route capacity in response to sustained increases in fuel expenses.
The current price spike also highlights the industry’s increased exposure to energy market volatility. Many airlines previously used fuel hedging strategies to limit the impact of oil price swings. Over the past decade, however, most carriers have moved away from large-scale hedging programs after experiencing losses during periods of falling oil prices. Southwest Airlines, long known for its fuel hedging approach, ended its program in 2025.
In addition to rising energy costs, airlines are facing operational disruptions tied to the conflict. Thousands of flights have been grounded globally as airlines reroute aircraft away from affected airspace, leaving travelers stranded and adding complexity to airline scheduling.
European airline stocks also declined amid the developments. Lufthansa shares dropped roughly 5%, while International Consolidated Airlines Group, the parent company of British Airways and Aer Lingus, fell about 3%. Air France-KLM also moved lower during the session.
The latest selloff adds to a difficult year for airline equities. Shares of Delta, American, and United are down roughly 20% to 30% year to date. Domestic carriers such as JetBlue, Southwest, and Alaska Air have also experienced steep declines in recent weeks.
For investors, the move underscores how closely airline performance remains tied to global energy markets. Even with steady travel demand, sudden spikes in oil prices can quickly reshape the profitability outlook for carriers.
If crude oil remains elevated, airlines may continue adjusting pricing strategies and operating plans as they navigate the industry’s most volatile cost variable.
Global oil markets have entered a new period of volatility as geopolitical tensions in the Middle East push crude prices sharply higher. Brent crude surged past $100 per barrel on Monday, briefly nearing $120 before easing, as disruptions to tanker traffic through the Strait of Hormuz threaten one of the world’s most critical energy supply routes.
The price spike follows escalating military conflict involving Iran, the United States, and Israel. The Strait of Hormuz — a narrow maritime corridor that typically carries about one-fifth of global oil shipments — has effectively halted most tanker traffic amid security threats and heightened military activity. With oil unable to move freely from the region, supply constraints are rapidly tightening global markets.
Producers across the Middle East are already responding to the bottleneck. Saudi Arabia has begun cutting production as storage facilities fill up due to limited export capacity. Neighboring producers including the United Arab Emirates, Kuwait, and Iraq have taken similar steps, reducing output as crude inventories accumulate while export routes remain restricted.
Analysts warn the supply impact could intensify if the disruption continues. JPMorgan estimates Middle Eastern production shut-ins could exceed four million barrels per day within weeks if the closure persists. The region accounts for roughly one-third of global oil output, making any sustained disruption highly significant for energy markets.
While producers attempt to redirect shipments through alternative routes, options remain limited. Saudi Arabia has increased shipments through pipelines to its Red Sea port of Yanbu, but the infrastructure cannot fully replace volumes normally transported through Hormuz.
The resulting supply uncertainty has sent shockwaves across energy markets. Diesel prices have surged alongside crude, with European gasoil futures climbing above $170 per barrel. Several governments are already weighing intervention measures. China has reportedly instructed major refiners to suspend gasoline and diesel exports, while South Korea is reviewing whether to implement an oil price cap for the first time in three decades.
Consumers are beginning to feel the impact. In the United States, gasoline prices have climbed nearly $0.50 per gallon in just one week, reaching a national average of roughly $3.47 per gallon, according to AAA. Analysts estimate prices could approach $4 per gallon within the next month if crude oil remains elevated.
The relationship between crude and retail fuel costs is direct. Industry estimates suggest every $10 increase in oil prices typically adds about $0.25 per gallon at the pump. With crude rising more than $20 in recent days, the upward pressure on gasoline prices is already visible.
Diesel costs are climbing even faster, with national averages approaching $4.66 per gallon. Because diesel powers the majority of freight transportation in the U.S., higher fuel prices could ripple through the broader economy by increasing the cost of moving goods. That dynamic often translates into higher prices for groceries, clothing, and construction materials.
Economists are also warning that the surge in energy prices could complicate the broader economic outlook. Rising fuel costs combined with slowing growth indicators have revived concerns about stagflation — a scenario where inflation accelerates even as economic activity weakens.
For now, markets remain focused on the duration of the Strait of Hormuz disruption. The longer shipping remains constrained, the more global inventories may tighten, potentially forcing prices higher until demand adjusts or supply routes reopen.
InPlay Oil is a junior oil and gas exploration and production company with operations in Alberta focused on light oil production. The company operates long-lived, low-decline properties with drilling development and enhanced oil recovery potential as well as undeveloped lands with exploration possibilities. The common shares of InPlay trade on the Toronto Stock Exchange under the symbol IPO and the OTCQX Exchange under the symbol IPOOF.
Mark Reichman, Managing Director, Equity Research Analyst, Natural Resources, Noble Capital Markets, Inc.
Hans Baldau, Associate Analyst, Noble Capital Markets, Inc.
Refer to the full report for the price target, fundamental analysis, and rating.
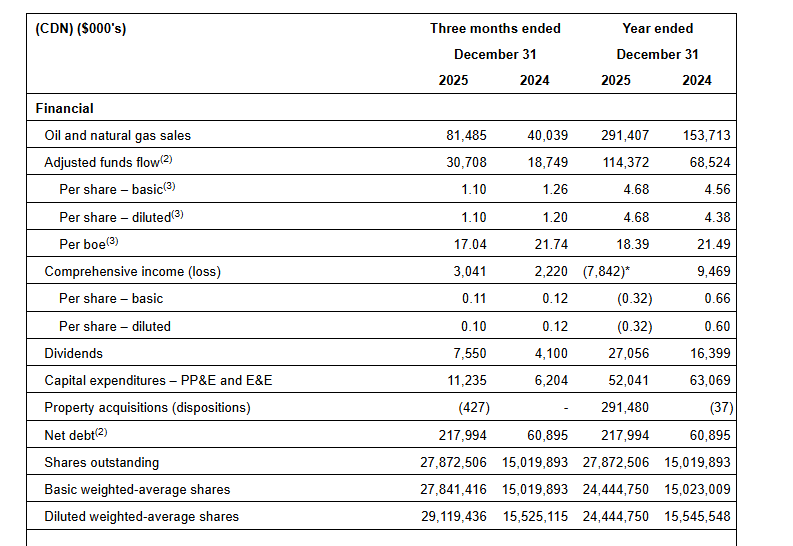
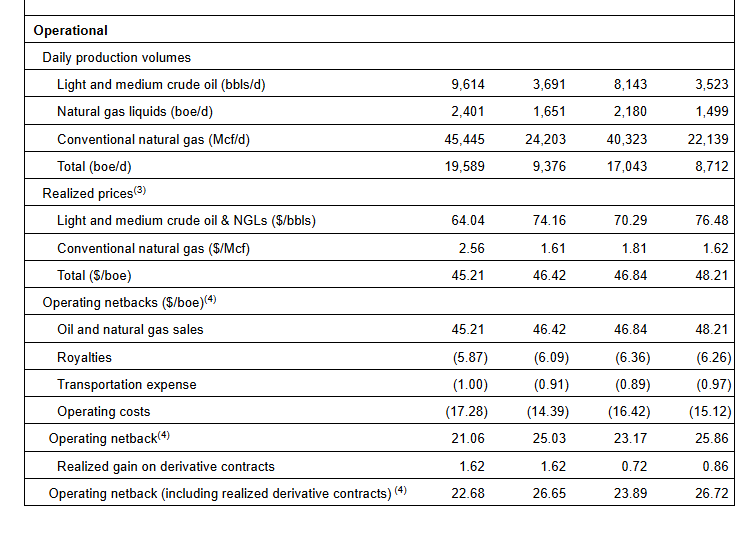
2025 financial results. InPlay Oil reported full-year 2025 adjusted funds flow (AFF) of C$114.4 million, or C$4.68 per share, above our estimate of C$112.9 million, or C$4.58 per share. Revenue for the year totaled C$291.4 million, ahead of our C$290.6 million forecast, as stronger Q4 production of 19,589 boe/d exceeded our estimate of 19,419 boe/d, in addition to stronger than expected AECO pricing. Full-year production averaged 17,043 boe/d, slightly above our 17,000 boe/d estimate.
Updated 2026 estimates. In the first quarter of 2026, we expect now revenues of C$79.9 million, AFF of C$27.4 million, and AFF per share of C$0.98, compared to prior estimates of C$79.0 million, C$26.6 million, and C$0.95, respectively. For the full-year 2026, we now estimate revenues of C$340.1 million, AFF of C$126.7 million, and AFF per share of C$4.53, up from C$340.1 million, C$125.2 million, and C$4.45. We are maintaining our production estimate of 18,605 boe/d in the first quarter and 18,900 boe/d for the year. These estimates are reflective of slightly higher commodity pricing.
Equity Research is available at no cost to Registered users of Channelchek. Not a Member? Click ‘Join’ to join the Channelchek Community. There is no cost to register, and we never collect credit card information.
This Company Sponsored Research is provided by Noble Capital Markets, Inc., a FINRA and S.E.C. registered broker-dealer (B/D).
*Analyst certification and important disclosures included in the full report. NOTE: investment decisions should not be based upon the content of this research summary. Proper due diligence is required before making any investment decision.
U.S. equities slid sharply Thursday as geopolitical tensions in the Middle East reignited volatility across global markets. A renewed surge in crude oil prices, combined with uncertainty surrounding the expanding conflict involving Iran, pushed investors toward risk-off positioning and weighed heavily on major indices.
The Dow Jones Industrial Average fell more than 800 points, dropping roughly 1.8% in afternoon trading. The S&P 500 declined about 0.8%, while the Nasdaq Composite slipped approximately 0.6%, reflecting broad selling pressure across sectors as investors reassessed geopolitical and inflation risks.
At the center of the market’s concern is the escalating confrontation between the U.S.-Israel coalition and Iran. The conflict has now entered its sixth day, with reports indicating continued military strikes across the region. U.S. officials said more than 2,000 targets have been hit, while the White House indicated American forces are moving toward what it described as “complete and total control of Iranian airspace.”
For markets, the immediate concern is energy supply.
Iran is the fourth-largest producer in OPEC, and disruptions to its production capacity or shipping routes through the Strait of Hormuz could ripple through global oil markets. Even the perception of supply disruption has been enough to drive crude prices higher.
West Texas Intermediate crude futures rose toward $79 per barrel, while Brent crude climbed above $84, marking a renewed rally in energy prices after a brief pullback earlier this week.
Higher oil prices often feed directly into inflation expectations — a dynamic that has quickly caught the attention of investors already watching the Federal Reserve’s next policy moves. Rising energy costs can push transportation, manufacturing, and consumer prices higher, potentially complicating the Fed’s interest rate outlook if inflation proves sticky.
The ripple effects were visible across other asset classes Thursday.
Despite its reputation as a safe-haven asset, gold fell more than 1%, pressured by a stronger U.S. dollar. When the dollar strengthens, commodities priced in dollars become more expensive for international buyers, often weighing on prices.
Other precious metals followed suit. Silver, platinum, and palladium also declined, reflecting a broader commodities pullback outside of oil.
Meanwhile, Treasury markets also saw movement, with 10-year yields rising as bond prices fell. Higher yields can add another layer of pressure to equities by increasing borrowing costs and reducing the relative attractiveness of stocks compared with fixed income.
Energy costs are already filtering into the real economy.
According to AAA data, the national average gasoline price climbed to $3.25 per gallon, up $0.27 from a week ago. Diesel prices have risen even more sharply, jumping $0.41 to $4.16 per gallon, their highest level since 2023. Diesel plays a critical role in shipping, trucking, and industrial activity, meaning sustained increases could amplify inflation across supply chains.
Looking ahead, markets may remain sensitive to both geopolitical headlines and incoming economic data.
Friday’s U.S. monthly jobs report is expected to provide the next major signal about the health of the labor market and whether economic momentum remains strong despite mounting global uncertainty.
Investors will also watch corporate earnings releases after the closing bell Thursday from Costco and Marvell Technology, which could provide additional insight into consumer demand and technology spending trends.
For now, however, the primary driver of market sentiment remains geopolitical risk — and the unpredictable path of oil prices that often accompanies it.
CALGARY, AB, March 5, 2026 /CNW/ – InPlay Oil Corp. (TSX: IPO) (OTCQX: IPOOF) (“InPlay” or the “Company”) is pleased to announce its financial and operating results for the three and twelve months ended December 31, 2025, along with the results of its independent oil and gas reserves evaluation effective December 31, 2025 (the “Reserve Report”) prepared by GLJ Ltd. (“GLJ”). InPlay’s audited annual financial statements and notes, and Management’s Discussion and Analysis (“MD&A”) for the year ended December 31, 2025 will be available at “www.sedarplus.ca” and the Company’s website at “www.inplayoil.com“. An updated corporate presentation will be available on our website in due course.
Message to Shareholders:
InPlay’s 2025 fiscal year marked a truly transformational chapter in the Company’s history, highlighted by the successful completion of the highly accretive April 2025 acquisition of Pembina assets in our core focus area. This strategic transaction significantly strengthened our already robust drilling inventory, expanded our operational scale, increased our ability to generate meaningful free adjusted funds flow (“FAFF”)(4) and enhanced the long-term sustainability and depth of our asset base.
InPlay’s long-term strategy is anchored in disciplined capital allocation, driving sustainable organic growth while pursuing strategic, accretive acquisitions; an approach supported by the Company’s proven track record of execution. InPlay has never been better positioned to advance this two-pronged growth strategy. The Company’s foundation was further strengthened in 2025 with the addition of Delek Group Ltd. (“Delek”) as a strategically aligned 32.7% shareholder. Delek has a strong history of value creation in the international energy markets with significant investments in the North Sea (Ithaca Energy plc) and the Mediterranean (NewMed Energy). Delek identified Canada as a stable and attractive jurisdiction with compelling return potential, positioning InPlay as a natural extension of its global energy investment strategy. Delek’s investment enhances InPlay’s financial strength and strategic flexibility, providing access to additional capital and alternative funding sources to support the Company’s growth strategy. Delek played a pivotal role in introducing InPlay to the Israeli capital markets and supporting the successful completion of the Company’s oversubscribed senior unsecured bond offering in February 2026. The offering was completed at an attractive cost of capital of 6.23%, further strengthening InPlay’s balance sheet and liquidity profile. InPlay looks forward to working closely with Delek to execute its long-term strategy of building a sustainable, growth-oriented Canadian oil and gas company focused on delivering top tier returns to shareholders.
During 2025, InPlay remained focused on operational execution, disciplined capital allocation and prioritizing FAFF while continuing to return capital to shareholders and pay down debt. Adjusted Funds Flow(2) (“AFF”) increased by 67% in 2025, delivering FAFF of $62 million. These results were achieved despite a 14% decline in WTI pricing, demonstrating the resilience and capital efficient nature of our light oil asset base. FAFF yield at year end was 18% (one of the highest in our peer group), dividends paid to shareholders were $27.1 million and debt repayment of $36 million post-acquisition close on April 7, 2025. The Company capitalized on its operational excellence to generate strong capital efficiencies during our 2025 capital program. Our team delivered some of the strongest-performing Cardium wells in 2025 with payouts averaging approximately seven months, underscoring the quality of our inventory and technical execution capabilities. This strong operational performance enabled us to increase production guidance over the course of the year while simultaneously reducing capital expenditures.
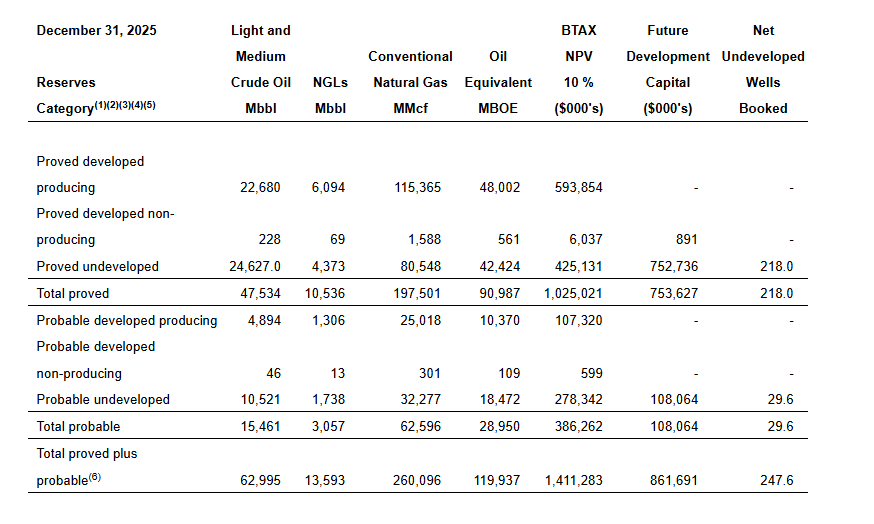
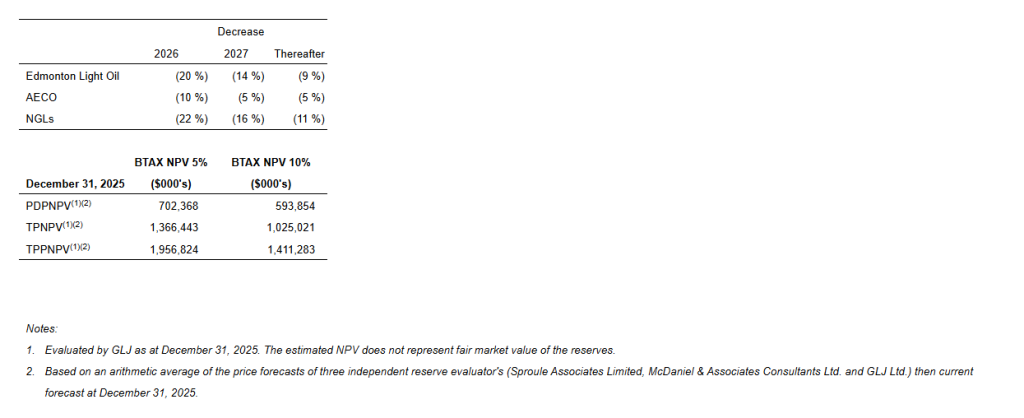
The Company’s exceptional 2025 reserve results reflect both the impact of the acquisition and strong operating results achieved during the year. Proved Developed Producing (“PDP”) reserves increased 179%, while a long reserve life index continues to underpin a low decline, high FAFF generating asset base. Despite a material year-over-year decrease in the benchmark Edmonton light oil price used in the Reserve Report (20% in 2026, 14% in 2027, 9% thereafter), the Company increased its Total Proved (“TP”) and Total Proved plus Probable (“TPP”) net asset value to $30.16/share and $44.02/share respectively, underscoring the significant intrinsic value embedded in our assets relative to current market levels.
Looking forward, InPlay is exceptionally well positioned to continue to execute key operational priorities, disciplined capital allocation and maximizing FAFF while continuing to return capital to shareholders. As announced on February 24, 2026, InPlay’s Board of Directors approved a 2026 capital budget of $66 – $74 million to drill 12 – 14 net horizontal Cardium wells. This program is forecast to result in annual average production of 18,600 – 19,200 boe/d(1) (60% – 62% light crude oil and NGLs), an 11% increase over 2025, resulting in a FAFF yield(4) of 11% – 15% (expected to be top tier amongst peers). The capital program is designed to be flexible and responsibly manage the pace of development, maintain operational and financial strength while remaining focused on delivering return of capital to shareholders.
2025 Financial and Operating Highlights:
Closed a transformational acquisition of Cardium-focused light oil assets in Pembina at highly accretive acquisition metrics (+45% AFF/share(3), +65% FAFF/share(3)), improving the Company’s sustainability through a lower decline rate, strong reserve life index and increased tier one drilling locations.
Achieved average annual production of 17,043 boe/d(1) (61% light crude oil and NGLs), a 96% increase from 2024.
Improved light oil production to 8,143 bbl/d, a 131% increase from 2024 and a 160% increase Q4 2025 over Q4 2024. Light crude oil weighting improved 20% from 2024.
Realized strong operating income of $144.1 million, a 75% increase from 2024, which resulted in an operating income profit margin(4) of 49%.
Generated AFF(2) of $114.4 million ($4.68 per weighted average basic share(3)), a 67% increase from 2024 despite a 14% decrease in WTI prices. Fourth quarter AFF totaled $30.7 million ($1.10 per weighted average basic share(3)), a 64% increase from 2024 even as WTI prices declined 16%. Fourth quarter AFF also increased 15% over Q3 2025.
Delivered FAFF of $62 million and distributed $27.1 million in dividends, equating to a 18% FAFF yield(4) and 8.7% dividend yield relative to year-end market capitalization. Since November 2022, total dividends distributed amounted to $69.7 million ($3.69 per share, including dividends declared to date in 2026).
Invested $52 million in development capital which was $1 million below the lower end of our May post-acquisition 2025 capital budget of $53 – $60 million and 17% less than 2024. Due to capital efficiencies, disciplined spending, and well outperformance, capital was 35% lower than our original capital forecast of $80 million on announcement on February 2025 to achieve production guidance.
Repaid $35 million of net debt from closing of the Pembina acquisition on April 7, 2025.
2025 Reserves Highlights(1):
InPlay’s capital efficient 2025 drilling program and accretive Pembina asset acquisition resulted in strong reserve results for 2025:
PDP reserves of 48,002 mboe (60% light and medium crude oil & NGLs), 179% increase from 2024.
TP reserves of 90,987 mboe (64% light and medium crude oil & NGLs), 107% increase from 2024.
TPP reserves of 119,937 mboe (64% light and medium crude oil & NGLs), 104% increase from 2024.
Achieved NPV BT10 reserve values(1) and Net Asset Value (“NAV”) per share of:
PDP: $594 million; $14.69/share
TP: $1,025 million; $30.16/share
TPP: $1,411 million; $44.02/share
Reserves life index (“RLI”)(2) of:
PDP: 7.0 years
TP: 13.2 years
TPP: 17.4 years
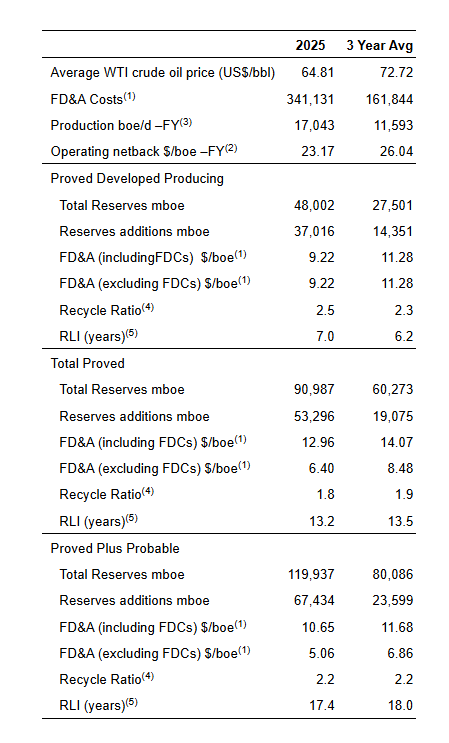
Delivered Finding, Development and Acquisition (“FD&A”) costs (including changes in future development costs) and recycle ratios(3) of:
PDP: $9.22/boe; 2.5x
TP: $12.96/boe; 1.8x
TPP: $10.65/boe; 2.2x
Replaced reserves(4) by:
PDP: 595%
TP: 857%
TPP: 1,084%
2025 development capital program (excluding acquisitions) added new light oil weighted production at a capital efficiency of $21,333 per boe/d
2026 Subsequent Event:
In February, InPlay closed an oversubscribed offering of senior unsecured bonds for total gross proceeds of C$242 million maturing on December 15, 2030 at an attractive interest rate of 6.23%. This bond is expected to reduce our cost of capital while diversifying the Company’s financing sources. Following the bond issuance, InPlay repaid and retired its term loan. The Company is now positioned with $190 million of available capacity on its fully undrawn revolving credit facility. Additionally, InPlay successfully mitigated exposure to fluctuations in the CAD/NIS exchange rate associated with the NIS-denominated senior unsecured bonds through the execution of foreign exchange hedging arrangements that fully cover all projected cash outflows, including principal repayments, over the next four years.
Financial and Operating Results:
2025 Financial & Operations Overview:
Our 2025 results are highlighted by our accretive acquisition of Pembina assets in April 2025, disciplined capital allocation and delivery of strong returns to shareholders. The acquisition was financed with an increase to our credit facilities, issuance of common shares and an oversubscribed $33.8 million bought deal equity financing.
We executed our capital program under budget, generated meaningful adjusted funds flow, returned $27.1 million to shareholders and paid down $35 million of net debt from closing of the Pembina acquisition on April 7, 2025. Production averaged 17,043 boe/d(1) (61% light crude oil & NGLs) in 2025 and 19,589 boe/d (61% light crude oil & NGLs) in the fourth quarter of 2025.
InPlay’s capital program for 2025 consisted of $52 million of exploration and development capital. Efficient operational execution in 2025 led to capital expenditures coming in $1 million below the low end of our May post-acquisition budget of $53 – $60 million and approximately 17% less than 2024 when production averaged 8,712 boe/d. The Company drilled, completed and brought on production ten (8.2 net) extended reach horizontal (“ERH”) Cardium wells during the year and completed a significant operated gas plant expansion and other facility projects. InPlay also spent $4.2 million on the successful abandonment of 31 wellbores, 90 pipelines and the reclamation of 32 well sites.
InPlay generated AFF of $114.4 million ($4.68 per basic share) during 2025 a 67% increase from 2024. These results were achieved despite a 14% decline in WTI pricing and lower than forecasted natural gas prices. Approximately $62 million in FAFF was generated resulting in a FAFF yield of 18%, evidencing our strong ability to generate meaningful FAFF.
Low crude oil prices during the year impacted the Company’s financial results with WTI decreasing 14% compared to 2024. This resulted in a 16% decrease from 2024 to our realized oil sales price, which was partially offset by realized hedging gains in the later part of the year. Significantly lower natural gas prices also impacted financial results offset with meaningful hedging gains realized throughout the year.
Operations Update:
In 2025, InPlay had one of our strongest drilling campaigns in the Company’s history. In the fourth quarter of 2025, InPlay continued its operational momentum by bringing on production five (5.0 net) operated wells. On average, the five wells delivered initial production (“IP”) rates of 429 boe/d (72% light crude oil and NGLs) per well over their first 90 days of production, approximately 66% above internal forecasts. The Company’s 2025 drilling program for the second half of 2025 continues to generate substantial returns for the Company through strong IP rates.
InPlay’s capital program for 2026 is underway with two (2.0 net) ERH wells being drilled to date which have recently come on production and are in the early cleanup stage. InPlay has also started drilling operations on a three (3.0 net) ERH well-pad which is expected to come on-line at the end of March. Approximately 7 – 9 net horizontal wells are planned for the remainder of the year, with most of the capital spend and production coming on-line from these wells in the second half of 2026.
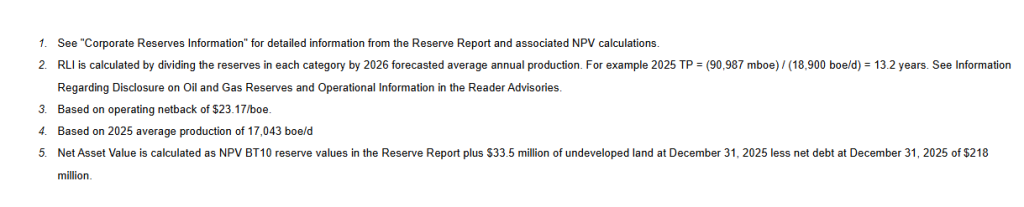
Corporate Reserves Information:
The following summarizes certain information contained in the Reserve Report. The Reserve Report was prepared in accordance with the definitions, standards and procedures contained in the COGE Handbook and National Instrument 51-101 Standards of Disclosure for Oil and Gas Activities (“NI 51-101”). Additional reserve information as required under NI 51-101 will be included in the Company’s Annual Information Form (“AIF”) which will be filed on SEDAR+ by the end of March 2026.
Net Present Values of Reserves:
InPlay achieved strong before tax estimated net present values (“NPV”) of future net revenues associated with our 2025 year-end reserves discounted at 10% (“NPV BT10”), although impacted by weaker future commodity prices in comparison to December 31, 2024 (refer to table below). The Company achieved NPV BT10 reserve values of $594 million (PDP), $1,025 million (TP) and $1,411 million (TPP) based on the three independent reserve evaluator average pricing, cost forecast and foreign exchange rates as at December 31, 2025 used in the Reserve Report. Commodity price decreases in the 2025 year-end reserve report compared to 2024 were as follows:
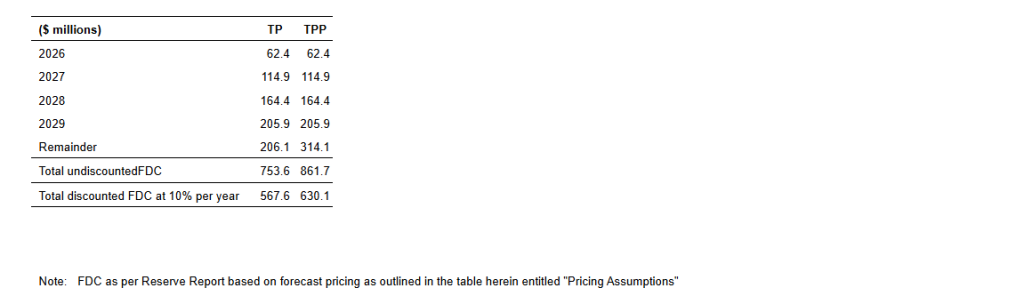
Future Development Costs (“FDCs”):
The following FDCs are included in the 2025 Reserve Report:
The $862 million of total FDC in the Total Proved and Probable Reserve Report generates approximately $710 million in future net present value discounted at 10%.
Performance Measures:
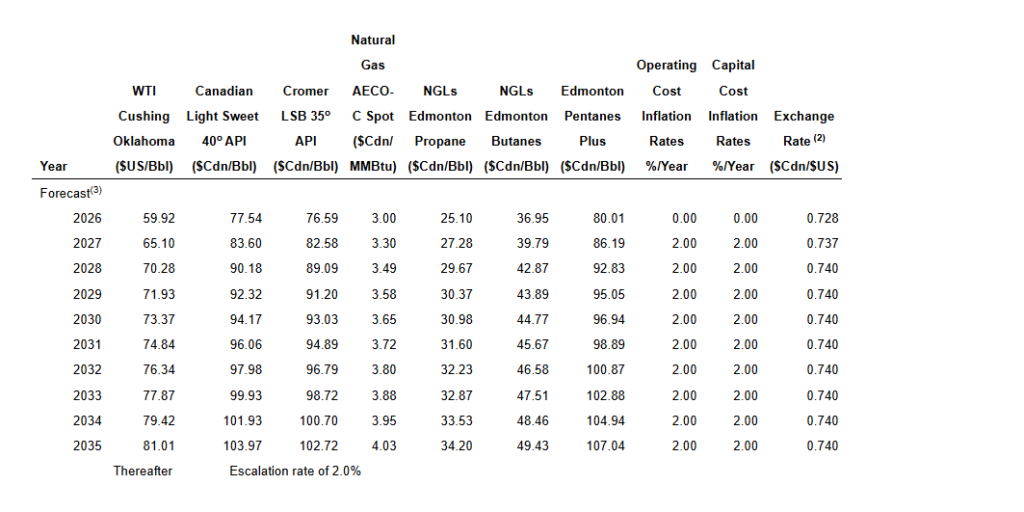
Pricing Assumptions:
The following tables set forth the benchmark reference prices, as at December 31, 2025, reflected in the Reserve Report. These price and cost assumptions were an arithmetic average of the price forecasts of three independent reserve evaluator’s (Sproule, McDaniel & Associates Consultants Ltd. and GLJ Ltd.) then current forecast and GLJ’s foreign exchange rate forecast at the effective date of the Reserve Report.
SUMMARY OF PRICING AND INFLATION RATE ASSUMPTIONS (1) as of December 31, 2025 FORECAST PRICES AND COSTS
For further information please contact:
Doug Bartole President and Chief Executive Officer InPlay Oil Corp. Telephone: (587) 955-0632
Kevin Leonard Vice President Corporate & Business Development InPlay Oil Corp. Telephone: (587) 955-0635
Mark Reichman, Managing Director, Equity Research Analyst, Natural Resources, Noble Capital Markets, Inc.
Hans Baldau, Associate Analyst, Noble Capital Markets, Inc.
Refer to the full report for the price target, fundamental analysis, and rating.
Canadian government steps up with financial support. First Phosphate received conditional approval for up to C$16.7 million in non-repayable funding through Natural Resources Canada under the Global Partnerships Initiative. The contribution will fund the assessment of technical and engineering parameters, including processing circuits and equipment, needed to validate the company’s ability to produce battery-grade phosphate concentrate aligned with its definitive offtake agreement. The funding supports study activities through 2028. First Phosphate received US$523,017 under a long-term phosphate concentrate offtake agreement, reinforcing commercial validation and establishing initial cash flow tied to downstream demand.
Phosphate added to Canada’s critical minerals list. The Canadian federal government amended the 2025 budget to include phosphate as a critical mineral essential for clean technology. This designation makes First Phosphate eligible for the 30% Critical Mineral Exploration Tax Credit (CMETC) and the 30% Clean Technology Manufacturing Investment Tax Credit (CTM). The CMETC enhances the company’s ability to raise exploration capital, while the CTM offers the potential to materially reduce downstream capital intensity for the planned phosphoric acid and LFP cathode active material facilities.
Equity Research is available at no cost to Registered users of Channelchek. Not a Member? Click ‘Join’ to join the Channelchek Community. There is no cost to register, and we never collect credit card information.
This Research is provided by Noble Capital Markets, Inc., a FINRA and S.E.C. registered broker-dealer (B/D).
*Analyst certification and important disclosures included in the full report. NOTE: investment decisions should not be based upon the content of this research summary. Proper due diligence is required before making any investment decision.
Oil markets have swung sharply higher since the outbreak of war between the United States and Iran, with traders rapidly repricing geopolitical risk into crude benchmarks. U.S. crude rose more than 5% Monday after surging as much as 12% intraday, while Brent climbed above $77 per barrel before easing from session highs. The moves reflect mounting concern that the conflict could trigger sustained supply disruptions in one of the world’s most strategically vital energy corridors.
At the center of the market’s anxiety is the Strait of Hormuz, the narrow waterway linking the Persian Gulf to global markets. Shipping analysts report that tanker traffic through the Strait has effectively stalled as operators reassess security risks. In 2025, more than 14 million barrels per day—roughly one-third of the world’s seaborne crude exports—passed through this chokepoint. A prolonged disruption would have immediate consequences for refiners and importers across Asia, Europe, and North America.
Iran itself produces approximately 3.3 million barrels per day, ranking as OPEC’s fourth-largest oil producer. Beyond its own output, however, its geographic position gives it indirect leverage over exports from Saudi Arabia, Iraq, Kuwait, and the United Arab Emirates. The conflict introduces overlapping supply risks: potential declines in Iranian production due to instability or infrastructure damage, and constraints on maritime transit that could temporarily restrict exports from multiple Gulf producers. Even the perception of restricted flows has been enough to trigger aggressive buying in crude futures and energy-linked equities.
Major banks have begun outlining upside price scenarios if the disruption persists. Some analysts suggest Brent could approach $100 per barrel under an extended supply squeeze, while more severe regional escalation could drive prices materially higher. For now, markets are oscillating between risk premium expansion and cautious optimism that diplomatic channels could reopen. President Donald Trump stated that U.S. combat operations will continue until objectives are met, while also indicating openness to talks. Iranian officials have publicly rejected negotiations, adding to uncertainty over the conflict’s trajectory.
The implications extend well beyond the energy sector. A sustained rally in crude would complicate global inflation dynamics at a time when central banks have been attempting to stabilize price pressures. Higher oil prices feed directly into transportation, manufacturing, and consumer goods costs, potentially delaying interest rate normalization. Equity markets, particularly rate-sensitive and consumer-facing sectors, could experience renewed volatility if energy-driven inflation reaccelerates.
For small- and mid-cap companies, the effects are uneven. Domestic exploration and production firms may benefit from improved pricing and stronger cash flow if elevated crude levels persist. Oilfield services providers could also see renewed capital spending from producers seeking to capitalize on higher margins. Conversely, airlines, logistics operators, chemicals manufacturers, and other fuel-intensive businesses face margin compression if input costs rise faster than pricing power allows. Emerging market equities in energy-importing nations may also encounter currency and trade balance pressures.
The broader theme resurfacing in 2026 is the fragility embedded in global supply chains. While U.S. shale growth and diversified sourcing have added resilience over the past decade, the Strait of Hormuz remains irreplaceable in the near term. Even with strategic petroleum reserves and spare capacity assumptions, a chokepoint freeze underscores how quickly geopolitical flashpoints can ripple through commodity markets and financial assets.
Oil is once again functioning as a real-time geopolitical barometer. Until tanker traffic resumes at scale or a clearer diplomatic path emerges, volatility is likely to remain elevated. Investors across asset classes will be watching crude not only as an energy benchmark, but as a signal of broader macroeconomic risk.
CALGARY, AB, Feb. 26, 2026 /CNW/ – InPlay Oil Corp. (TSX: IPO) (OTCQX: IPOOF) (“InPlay” or the “Company”) is pleased to confirm that its Board of Directors has declared a monthly cash dividend of $0.09 per common share payable on March 31, 2026, to shareholders of record at the close of business on March 16, 2026. The monthly cash dividend is expected to be designated as an “eligible dividend” for Canadian federal and provincial income tax purposes.
About InPlay Oil Corp. InPlay is a junior oil and gas exploration and production company with operations in Alberta focused on light oil production. The company operates long-lived, low-decline properties with drilling development and enhanced oil recovery potential as well as undeveloped lands with exploration possibilities. The common shares of InPlay trade on the Toronto Stock Exchange under the symbol IPO and the OTCQX Exchange under the symbol IPOOF.
SOURCE InPlay Oil Corp.
For further information please contact:
Doug Bartole, President and Chief Executive Officer, InPlay Oil Corp.
HOUSTON, Feb. 27, 2026 /PRNewswire/ — Summit Midstream Corporation (NYSE: SMC) (“Summit”, “SMC” or the “Company”) announced today that it will report operating and financial results for the fourth quarter of 2025 on Monday, March 16, 2026, after the close of trading on the New York Stock Exchange.
Fourth Quarter 2025 Earnings Call Information
SMC will host a conference call at 10:00 a.m. Eastern on March 17, 2026, to discuss its quarterly operating and financial results. The call can be accessed via teleconference at the following link: Q4 2025 Summit Midstream Corporation Earnings Conference Call (https://register-conf.media-server.com/register/BI12ac80a058874aaa998fdc335346beed). Once registration is completed, participants will receive a dial-in number along with a personalized PIN to access the call. While not required, it is recommended that participants join 10 minutes prior to the event start. The conference call, live webcast and archive of the call can be accessed through the Investors section of SMC’s website at www.summitmidstream.com.
About Summit Midstream Corporation
SMC is a value-driven corporation focused on developing, owning and operating midstream energy infrastructure assets that are strategically located in the core producing areas of unconventional resource basins, primarily shale formations, in the continental United States. SMC provides natural gas, crude oil and produced water gathering, processing and transportation services pursuant to primarily long-term, fee-based agreements with customers and counterparties in five unconventional resource basins: (i) the Williston Basin, which includes the Bakken and Three Forks shale formations in North Dakota; (ii) the Denver-Julesburg Basin, which includes the Niobrara and Codell shale formations in Colorado and Wyoming; (iii) the Fort Worth Basin, which includes the Barnett Shale formation in Texas; (iv) the Arkoma Basin, which includes the Woodford and Caney shale formations in Oklahoma; and (v) the Piceance Basin, which includes the Mesaverde formation as well as the Mancos and Niobrara shale formations in Colorado. SMC has an equity method investment in Double E Pipeline, LLC, which provides interstate natural gas transportation service from multiple receipt points in the Delaware Basin to various delivery points in and around the Waha Hub in Texas. SMC is headquartered in Houston, Texas.
Forward-Looking Statements
This press release includes certain statements concerning expectations for the future that are forward-looking within the meaning of the federal securities laws. Forward-looking statements include, without limitation, any statement that may project, indicate or imply future results, events, performance or achievements and may contain the words “expect,” “intend,” “plan,” “anticipate,” “estimate,” “believe,” “will be,” “will continue,” “will likely result,” and similar expressions, or future conditional verbs such as “may,” “will,” “should,” “would” and “could.” In addition, any statement concerning future financial performance (including future revenues, earnings or growth rates), ongoing business strategies and possible actions taken by SMC or its subsidiaries are also forward-looking statements. Forward-looking statements also contain known and unknown risks and uncertainties (many of which are difficult to predict and beyond management’s control) that may cause SMC’s actual results in future periods to differ materially from anticipated or projected results. An extensive list of specific material risks and uncertainties affecting SMC is contained in its 2024 Annual Report on Form 10-K filed with the Securities and Exchange Commission (the “SEC”) on March 11, 2025, as amended and updated from time to time. Any forward-looking statements in this press release are made as of the date of this press release and SMC undertakes no obligation to update or revise any forward-looking statements to reflect new information or events.


")


")