Lower Global Demand for Oil Could Mean Weaker Dollars


Image Credit: airpix (Flickr)


Add This to the List of Inflation Drivers

There are more than enough arguments suggesting that for the remainder of 2021, we will experience above-trend inflation. Tight labor markets, money supply growth, over stimulus, higher fuel prices, shortages, increased consumer demand, etc., pick one, or pick them all, most concede that this year will play out with price increases. Whether an inflationary trend continues deeper into the decade or even an upward price spiral is not knowable but worth watching and even hedging against. Based on some of the actions taken by world leaders, including those in Washington, higher long-term U.S. price growth and a weakening dollar may be unavoidable. Some of the actions that may drive prices higher are related to the future of energy; let’s explore.

Energy Policy

In a White House press briefing dated April 22, 2021, related to greenhouse gases, an announcement was made that read:

The United States has set a goal to reach 100 percent carbon
pollution-free electricity by 2035,
which can be achieved through multiple cost-effective pathways, each
resulting in meaningful emissions reductions in this decade. That means
good-paying jobs deploying carbon pollution-free electricity generating
resources, transmission, and energy storage and leveraging the carbon pollution-free
energy potential of power plants retrofitted with carbon capture and existing
nuclear, while ensuring those facilities meet robust and rigorous standards for
worker, public, environmental safety and environmental justice.”

Most of us were raised to care about the health of our planet and what we leave for the next generation; I certainly was. So, we can understand, even appreciate,  why important actions that take a long time to implement are made in advance of any projected “disaster.” Channelchek serves its readers by covering markets and economics, so reviewing one of the economic implications of reducing the demand for petroleum products serves our readership. The above announcement throws up at least two more red flags in the inflation department to consider.

Stay up to date. Follow us:


Inflation Drivers

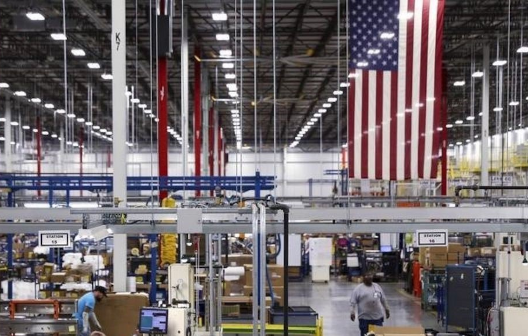
The first red flag for American’s finances is easy to understand. The U.S. produced 91% of the oil it used in 2016 and was energy self-sufficient; America was actually able to export its excess local production by 2020. For the first time the U.S. managed to take complete control of its energy destiny. The decision has now been made to unwind what took so long to achieve and instead build solar panels, mine for minerals to create battery systems, and cover land to collect sunlight. This is paving the way for exciting investment opportunities, but in the short and medium-term, may lead to higher all-around costs. The White House announcement eludes to high-priced labor, the cost of electricity and everything that we consume that uses electricity in the manufacturing process will cost more to make. This higher cost of production will get passed to the buyers. Everything has a cost, one of the costs of this transition would be increased prices.

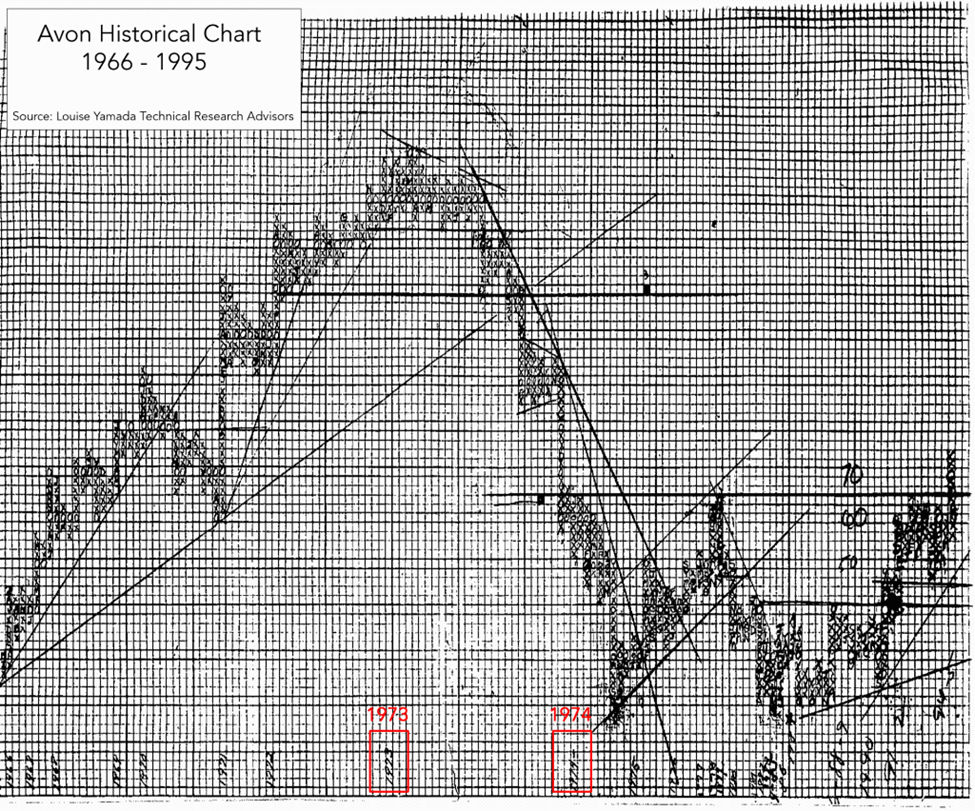
The second red flag is a bit more involved and begins in the 1970s. The ‘70s followed decades of the most comfortable and prosperous growth period in the countries history. However, the post-war (WWII) boom stopped abruptly when that decade began. It was a surprise and a shock to most.  Young adults who only knew growth and prosperity were suddenly asked to tighten their belts, put schools on austerity, and become two-income households for the first time.  A root cause was the country had halted backing dollars with gold (gold standard). The lack of backing caused a lack of confidence which helped drive prices up

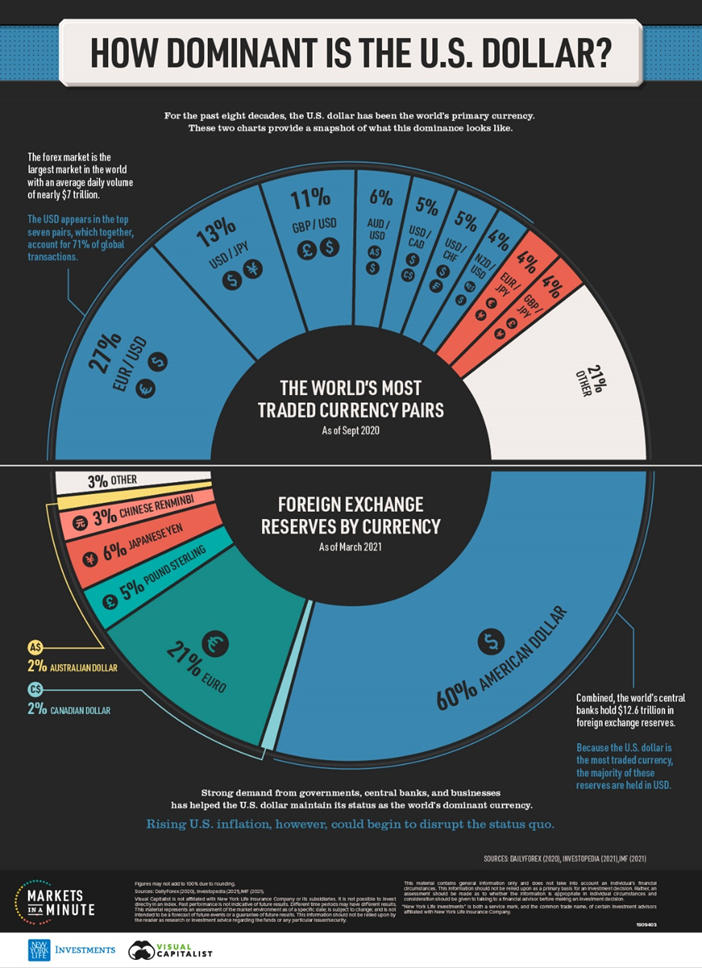
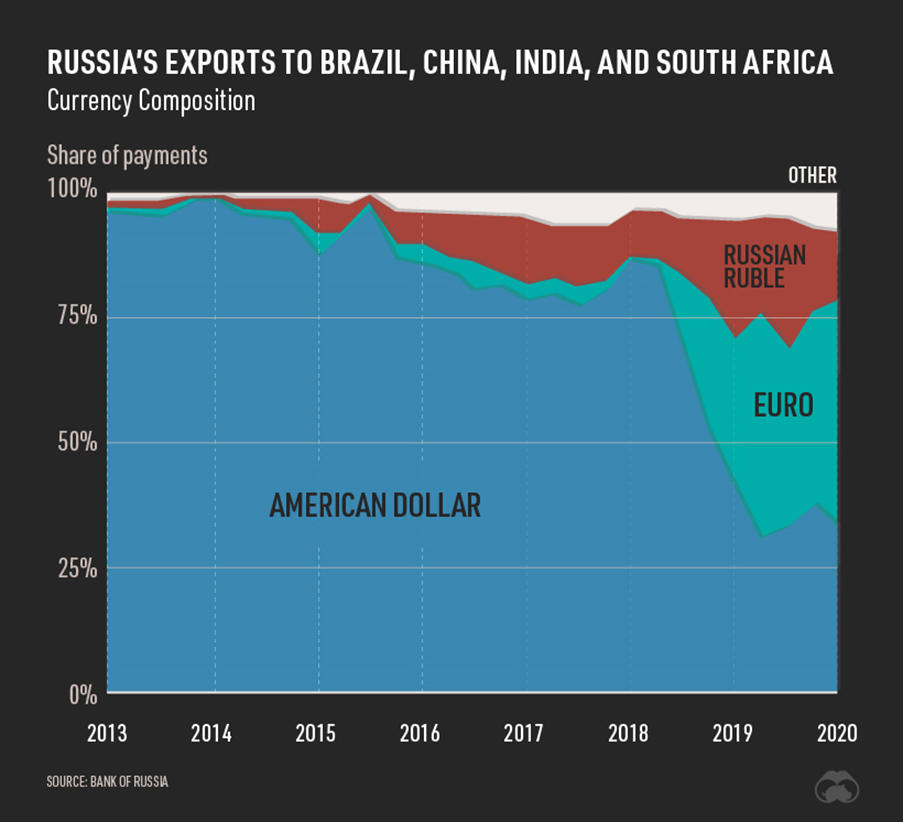
The dollar was eventually shored up as it essentially found a new commodity to back it, this commodity was oil. The U.S. and Saudi Arabia reached a deal to price the sale of crude oil throughout the globe in U.S. dollars. Whether a U.S. company is involved in the transaction, or even Saudi Arabia, the standard currency around the world is and has been U.S. dollars. The name given to this is petrodollars. The world has been on this petrodollar system for 50 years, and it has had the effect of creating worldwide demand for the U.S. currency. It can be said with certainty that among the reasons the U.S. enjoys the high of a living standard it does is because our dollar is strong. It is strong because of faith in our economy and because petroleum can’t be bought around the globe without U.S. dollars. This produces a demand, unlike any other currency experiences.

The plan outlined by the White House above has the U.S. electricity generating ability free of carbon emissions by 2035. The plan in the U.S. and Europe for electric vehicles are just as aggressive. What is likely to happen to the value of U.S. dollars these countries successfully free themselves from requiring oil? Even if it’s only a small percentage of current output? Simply put, The U.S. dollar will become less in demand, not as important; it won’t be as strongly backed any longer. This would put downward pressure on its value. As U.S. dollars go down, they won’t buy as much – dollar-based costs for almost everything imported could rise.

Take-Away

If countries around the globe are successful in rebuilding energy systems, there will be lucrative investment opportunities that massive change brings. There will also be many hurdles as there are costs to everything. One of those costs could be a declining dollar. A strong dollar has helped Americans afford their above-average living standards; the challenge could become retaining those standards in the face of change, and minimizing inflation.

Paul Hoffman

Managing Editor, Channelchek


Suggested Reading:



Alternative Vehicle Fuel Types


What Makes a Country a Tax Haven?


Copper Facing an Onslaught of Demand


The Limits of Government Economic Tinkering

Sources:

White House Fact Sheet

Paying for Infrastructure Spending


Image credit: Jazz Guy (Flickr)


The Gas Tax’s History Shows How Hard it is to Fund Infrastructure Spending


As the Biden administration and Republicans negotiate a possible infrastructure spending package, how to pay for it has been a key sticking point.

President Joe Biden and Democrats in Congress want to raise taxes on the rich, while some Republicans have been pushing for an increase in the gas tax – which would be the first in 28 years. A bipartisan group of senators recently crafted a compromise bill that would pay for just under US$1 trillion in spending on rail, roads and bridges over five years in part by indexing the gas tax to inflation. Democrats call this regressive because it would raise taxes on working Americans.

As the director of energy studies at the University of Florida’s Public Utility Research Center, I’ve studied both taxes on energy and how the government spends money on infrastructure.

Throughout the gas tax’s controversial history, leaders have frequently called upon this revenue source when serious infrastructure investment is needed.

The First 40 Years

This resilient levy is a major source of U.S. funding for roads and transit today. It originated during the Great Depression as a “temporary” penny-per-gallon gasoline tax. At the time, a gallon cost about 18 cents, or about $2.90 in 2021 dollars.

As he signed the Revenue Act of 1932 into law, President Herbert Hoover lauded “the willingness of our people to accept this added burden in these times in order impregnably to establish the credit of the federal government.”


The original gas tax, an emergency measure intended to bolster the budget and fund national defense spending, not to meet transportation needs, was slated to expire in 1933. Instead, persistent budget deficits throughout the New Deal and World War II kept it in force throughout Franklin D. Roosevelt’s administration over the objections of the oil, automotive and travel industries. It became a permanent 1.5-cent levy in 1941.

Multiple efforts to do away with the gas tax ever since have failed.

For example, Congress again scheduled the tax’s repeal in 1951 when it increased it to 2 cents as a source of revenue related to the Korean War. Instead, lawmakers agreed to keep the tax on the books to help pay for one of President Dwight D. Eisenhower’s top priorities, the national interstate highway system.

In 1956 the levy rose once more, to 3 cents, when Americans were paying about 30 cents for a gallon of gas. At the same time, the government established the Highway Trust Fund to use the gas tax revenue to pay for building and maintaining the new interstates.

The tax rose to 4 cents per gallon in 1959 and froze at that level for more than two decades.

Running on Empty

Gas tax revenue stopped keeping up with the expenses it was supposed to cover in the early 1970s following a severe bout of inflation and OPEC’s oil embargo. U.S. gas prices soared from about 36 cents per gallon in 1972 to $1.31 in 1981.

Responding to what members of both major political parties saw as a transportation infrastructure crisis, Congress more than doubled the tax to 9 cents per gallon as part of the Surface Transportation Assistance Act of 1982. The same law split the Highway Trust Fund and its revenue stream into two parts: The first 8 cents would finance roadwork while the other penny would finance mass transit projects.

This hike may have struck drivers as a sharp increase, but public spending on transportation infrastructure would continue to fall as a percentage of all outlays.

In 1984, Congress increased spending on highways by funneling proceeds from fines and other penalties that businesses pay for safety violations, such as failing to label hazardous materials or forcing drivers to work too many hours in a row.

Congress boosted the tax twice more in the 1990s but primarily to reduce the then-ballooning federal deficit. Only half of a 5-cent increase in 1990 went to highways and transit, while a 4.3-cent lift three years later went entirely to lowering the deficit.

By 1997, the government had redirected all gas tax revenue reserved for deficit reduction to the Highway Trust Fund, where it still flows today.

Along the way, other federal fuel taxes arose, including a 24.4-cent-per-gallon diesel tax and taxes on methanol and compressed natural gas. And state fuel taxes, which in most cases began before the federal gas tax, range from as low as 8.95 cents per gallon in Alaska to as high as 57.6 cents per gallon in Pennsylvania.


Indonesia Energy (INDO) Virtual Road Show – Thursday, June 24 @ 1pm EDT

Join Indonesia Energy President Frank Ingriselli for this exclusive corporate presentation, followed by a Q & A session moderated by Michael Heim, Noble’s senior research analyst, featuring questions taken from the audience. Registration is free and open to all investors, at any level.

Register Now  |  View All Upcoming Road Shows

 

Making Do

Since 1993, when the federal gas tax was first parked at 18.4 cents, inflation and rising construction costs have eroded its effectiveness as a transportation-related revenue source. In addition, U.S. vehicles have grown more fuel-efficient overall – which means Americans use less fuel for every mile they drive.

As a result, highway and transit spending has significantly outpaced the revenue collected from the gas tax and other sources. Since 2008, the government has transferred over $80 billion to the fund that it had to take from other sources.

But it’s still not enough. The American Society of Civil Engineers, which gives U.S. infrastructure a C-minus, is calling on the government and private sector to increase spending on roads and bridges by at least $2.5 trillion within a decade.

While it’s true the gas tax may be regressive because lower-income people pay the same rate as those who earn higher incomes, there are still advantages to this tax.

For one thing, it follows the “user pays” principle of providing government services. Under this principle, the people using the roads are held responsible for paying for their upkeep. As the number of motorists using electric vehicles increases, however, this may become less true over time.

Further, it would also create an incentive to at least marginally decrease the use of fossil fuels, accomplishing another goal of the administration.

Finally, the government could always subsidize the tax for the poor, perhaps through annual lump-sum payments, making it less regressive.

Clearly, U.S. infrastructure is in dire need of upgrading and investment. At the end of the day, Americans will pay for it one way or another – whether in taxes or through costs of unsafe and inadequate infrastructure, including in lost lives. How the government pays for investment may matter less than that it finally does it.


This article was republished with permission from The Conversation, a news site dedicated to sharing ideas from
academic experts. It was originally written in French by
Theodore J. Kury, Director of Energy Studies, University of Florida.


Suggested Reading:

Is Zero Trust Architecture Enough?

Who Benefits from the America Jobs Plan?


The Future of Electric Cars

Your Personal Data is the Currency of the Digital Age


Stay up to date. Follow us:


Stay up to date. Follow us:

How Rising Rates Could Make Brokers Like Robinhood More Profitable


No-Cost Brokers Like Robinhood May be the Big Winners with Rising Rates


Robinhood’s IPO is expected to happen in July. The timing would seem to be ideal. Much of the mishaps
with meme stock’s
orders have been forgotten or forgiven, and business growth which far outpaced its envious rivals in 2020, widened the gap even further in 2021. The company is hitting on all cylinders and likely to close during a period when money has been readily flowing into new public deals. As if Robinhood’s timing didn’t already have the “perfect storm” ingredients to do well, yesterday’s Fed announcement on interest rate policy could cause their going public to fetch even more.


Robinhood and Interest Rates

As we’ve learned, online “low-touch” brokerage firms don’t need to charge per transaction to make money. Taken directly from the Robinhood blog, this is how they earn the bulk of their income: Rebates from market makers and trading venues – Robinhood Gold, Stock loan – Income generated from cash – Cash
Management.
The last three they mention; Stock loan, income from cash balances, and cash management, are likely to rise when rates increase. The current low rate environment, although it may be ideal for attracting customers to trade, hasn’t been ideal to maximize revenue on those accounts. Should rates rise sooner rather than later, particularly if it occurs with a steeper yield curve, and nothing else changes, businesses like Robinhood, Schwab (SCHW), Interactive Brokers (IBKR), and others will experience wider margins and can collect from their business customers higher rates.

Stock Loan Stock loan, or securities lending is the practice of using stocks (or bonds) that accounts are long as a means for other customers to short securities to make good delivery on their sale. Behind the scenes, the broker executing the transaction locates a long position and, with the right agreements in place, “borrows” the securities. The broker lending the securities earns an interest rate that will rise as rates rise. This bodes well for Robinhood and other brokers that do a large number of stock loan transactions.

Cash Balances It’s easy to understand how brokers make money on your cash balances. Robinhood’s website explains it like this: “Robinhood Securities generates income on uninvested cash that isn’t swept to the Cash Management network of program banks, primarily by depositing this cash in interest-bearing bank accounts.” With rates near zero, the next move by the Fed could double earnings on short-term deposits.  As cost-free balances begin to earn more with no extra effort, revenue from this important source will immediately make an impact.

Cash Management The debit card held by many Robinhood customers is part of the companies Cash Management service. This is also a source of  revenue that may benefit if fees rise as rates rise. Mastercard® International Incorporated receives an interchange fee that is passed directly to Robinhood Financial.  According to their website, Robinhood Securities and Robinhood Financial also receive fees from banks for sweeping funds to them.


Outcome of the June FOMC Meeting

In an outcome that suggests higher U.S. interest rates sooner than originally planned from the Fed, its “dot plot chart” showed 11 of 18 officials expect at least two rate hikes in 2023. In March, only seven expected one hike. Seven officials now see the first hike next year, up from four in March. This is a dramatic change in expectations from those that set interest rate policy.

Just as importantly, Chairman Powell announced the Fed held its first discussion about slowing down its bond purchases. In addition to targeting  0-.25% overnight rates, the Fed has been buying $80 billion of Treasurys and $40 billion of mortgage-backed securities each month. Slower bond purchases will allow rates beyond overnight maturity to move up as they’ll need to find other (non-Fed) owners.


Take-Away

Robinhood filed for a confidential IPO in March. The securities broker has not made the details of the offering public yet. It has raised $5.6 billion from private investors and was reportedly valued at $40 billion at its funding round in February. The potential for brokerage firms that earn a large part of their income on cash balances, securities lending, and other interest-rate-sensitive businesses are likely beneficiaries of any upward movement in rates over the coming years. As rates have been very low, a small change could have a large impact.

 In April Coinbase (COIN) went public and its value shot to $86 billion. This summer Robinhood, with the advantage of a swelling account base, money readily flowing into large and small public offerings, the ability to offer part of the IPO to customers, and a positive interest rate backdrop, could generate a very strong result.


Suggested Reading:

Class Action Suit Against Robinhood

Bill Ackman’s Most Unusual SPAC Deal


Can Brokers Level the Playing Field for Individual Investors?

Has Robinhood, the Online Brokerage Disruptor, Been Disrupted?


Sources:

https://blog.robinhood.com/

https://robinhood.com/us/en/support/articles/how-robinhood-makes-money/

https://www.federalreserve.gov/newsevents/pressreleases/monetary20210616a.htm

https://www.cmcmarkets.com/en-gb/news-and-analysis/will-the-robinhood-ipo-attract-investors

https://apnews.com/article/coinbase-stock-ipo-price-c3b802074ce4349b5bccf9ba43022800


Stay up to date. Follow us:


Stay up to date. Follow us:

The Benefits of DeFi


Decentralized Finance, Is It The Future?


For the last couple of years, DeFi has been the hottest topic in both FinTech and crypto, with many investors and developers believing it to be the future of finance. But what exactly is DeFi, and what makes it so significant?


What is DeFi?

DeFi, or “decentralized finance,” is a term used to describe any financial tool that eliminates the need for a centralized body. This means that there are no middlemen, third parties, or intermediaries involved. While this might not sound like much, the ability to cut out centralized bodies from traditional financial instruments such as loans and bonds has never happened before in economic history. DeFi allows people to trade, lend, borrow and manage their money in a way that provides complete independence. With DeFi, no institutions or organizations handle or control your money, meaning that ownership always stays with you, creating a more unrestricted financial experience.

DeFi technology is extremely new, having existed for less than ten years. The first DeFi projects to gain recognition were MakerDAO and Bancor, both released in 2017, they offered a lending platform that functioned without any centralized bodies whatsoever.


No More Third Parties

This is all made possible through blockchain technology. Blockchains allow people to manage their money securely without placing trust in any particular body or institution. Instead of putting your faith in a bank, credit card processor (like VISA), or payment gateway (like PayPal or Western Union), you can rely solely on the blockchain. This is a much safer option, as the code used to create most blockchains is open-source, which means anybody can view it. If anything were malicious or unsafe in the code, it would more than likely get picked up by the programming community. 

When you use third parties, you have to place your trust in that entity’s integrity, but even the most well-known financial companies have experienced issues. There is no centralized economic body that hasn’t had to deal with some scandal in the past. But that problem is negated by Decentralized Finance.


Smart contracts play a massive role in DeFi. A smart contract is a computer-generated contract that executes upon being added to the blockchain. Smart contracts allow people to transfer value to one another under certain conditions, agreed upon by the parties involved, which are then enforced by the blockchain (rather than by a centralized body like a bank or broker).


Why Should You Care About DeFi?

Despite it being such a simple idea (engaging with finance without third parties), it has never entirely existed before. This is the first time in history where people can access traditional financial instruments (such as loans, bonds, and trading capabilities) without needing an intermediary, making DeFi perhaps the most revolutionary financial technology to happen in the last century.

Here are the primary benefits it offers:


Financial Control

When using DeFi services, you keep control of your money. Instead of handing your money over to an organization that you do not trust, you deal with the blockchain: an open, fully automated, and transparent network. When working with a centralized body, you have to place a great deal of faith in them, hoping they will take care of your money and that they have your best interests at heart. But with DeFi, you do not have to rely on faith because you have full knowledge of the inner workings of the blockchain and smart contracts you are using.

Non-Invasive

DeFi services are naturally less invasive than centralized financial tools (or “CeFi”). For instance, if you were to take out a traditional CeFi loan, you would likely have to provide the centralized body with proof of identity, bank statements and possibly even undergo a background or credit check. Not only would you hand your money to them as collateral, but you would also hand over extremely sensitive data. 

However, if you were to take out a DeFi loan, you would not have to do any of this. With DeFi, nobody needs to see sensitive documents like this because no centralized body could assess or evaluate them. Everything happens via automation, so there is no requirement to pry. This makes DeFi a much more accessible and comfortable experience. Many people (rightfully) feel uncomfortable about handing over personal information to a corporation like a bank or lending provider.


Fairness

Considering how DeFi allows people to exchange and handle money without an intermediary, it is significantly fairer. It means that fees are lower, as there is no third party to profit from people’s financial activity. It also gives more people access to financial instruments. Many people worldwide cannot engage with CeFi because they do not have official documentation or because institutions choose to ignore them. For instance, there are approximately 2 billion unbanked people, meaning they cannot access traditional CeFi services. These financial services are extremely useful for modern living, and the fact that so many people have been locked out from engaging in them is deeply unfair, however with DeFi, this all changes. DeFi allows more people to gain financial stability and take control of their lives. 

DeFi is a game-changing technology in both crypto and FinTech, as it allows for the creation of projects and ecosystems that run without any third parties. They let people engage with traditional financial tools without relying on institutions and intermediaries, giving people more freedom and control over their economic lives. They also offer unbanked access to loans, bonds, and trading capabilities, providing them with life-changing financial instruments that many people often take for granted. Not only does DeFi have the potential to improve people’s lives for the better, but it has the potential to change the way contemporary finance is run as a whole. For the first time, centralized financial bodies are becoming obsolete, affecting the economic landscape in unimaginable ways. 


This article is republished with permission from the Vertex Markets Knowledge Center. Vertex uses AI to make B2B introductions providing a business networking site free from guesswork as to where the more valuable interactions are found.


What Companies are Involved in Spaceflight?

The Value of “FinTok” “Finfluencers”


Repurposing Powerplants for Crypto Mining

Making Sense of NFTs


Stay up to date. Follow us:


Stay up to date. Follow us:

Trimmed PCE Inflation vs the PCE Deflator


The PCE Deflator and the Trimmed PCE Inflation Rate Tell Different Stories


Covering April prices, the Bureau of Economic Analysis (BEA) released another widely followed core inflation measure on Friday. Many found it extra concerning. The reason the PCE Deflator received increased attention is that it’s generally the more stable measure and known as the one the Fed prefers (over CPI). It indicated price growth well above the Fed targeted 2% pace. A third inflation measure was also released Friday. Each month the Dallas Fed adjusts the PCE numbers to report this other inflation measure. This additional report rarely receives any investor attention. But, it is worth visiting in that it allows assumptions about what is happening below the economic surface, including consumers’ reaction to prices.

Background

The Fed has said it views a 2% annual increase in inflation as consistent with its mandates of stable prices and maximum employment.  The report on April CPI earlier this month indicated a pace, (for the month) well in excess of the target. One month is not a trend, and April certainly has its share of “one-off” issues, including basing growth from April 2020, which printed negative 0.8% with the lockdowns.  On Friday, the market couldn’t take much comfort in the PCE Deflator which also could indicate the Fed may have overshot in stimulating the economy. This one April number is not as easy to explain away in that it’s a broader gauge that is less volatile, and generally runs below the CPI average.


PCE Price Deflator

The PCEPI is the Federal Reserve Bank’s favored inflation gauge to help them direct policy. This is according to their own guidance. The reason given is that it is a broader gauge of prices than the basket of goods found in CPI.


The graph above shows the PCEPI charted against CPI-U for the past 20 years. It’s clear that CPI (red) is much more volatile, and in any given month may change dramatically which is not always the beginning of a change in price growth. By comparison, the numbers based on PCE include a broader base of goods. It also will report net of food and energy, because these often experience large shifts for reasons unrelated to economic price pressures (weather, war, politics, etc.).


The FOMC carefully considered both indexes when evaluating which metric to target and concluded that PCE inflation is the better measure. – Federal Reserve Bank, St. Louis


On Friday (May 28), PCEPI showed an annualized rate of inflation of 7.5%, and 8.3% ex-food and energy. This is a spike of the less volatile inflation measure and offers little consolation to those concerned with the higher interest rates that inflation promotes.


The Trimmed Mean PCE Inflation Rate

From the BEA data, the Dallas Federal Reserve Bank is responsible for calculating a monthly set of numbers. Their analysis, The Trimmed Mean PCE Inflation Rate, is an alternative measure of core inflation using PCE.

The Dallas Fed segments off the different goods and services based on price rise and looks at how much they have risen or fallen, then it calculates the actual consumption of those products. So the Fed weights the data based on consumption. One reason for this is it shows that substitutions limit the level of higher prices actually paid by households. If, for example, the price of oranges rise by 6%, while apple prices remain the same, if half the consumers substitute apples for oranges, the experienced household inflation would be overstated if not accounting for the reduced purchases of oranges and increased purchase of zero inflation apples. 


The above Trimmed Mean PCE chart covers the same 20 year period as the top chart. We can see by this alternative measure that inflation is not impacting households in a way that should concern policymakers. In fact, the April numbers shown below indicate a six-month annualized inflation of 1.8%, compared with the PCE Deflator at 4.3%.  These are seemingly two different stories.


 Source: Federal Reserve Bank, Dallas


Which is Correct?

Giving more weight to one or the other inflation measures would have led to rather different assessments of appropriate policy. The Fed prefers PCEPI over CPI-U for the same reason the S&P 500 is preferred by investors over the Dow 30 as a gauge of stock market movement. An index limited to 30 industrial stocks is not as inclusive as the index that includes 500 of the highest capitalized public companies. When comparing the PCEPI and its derivative Trimmed PCE Inflation, they both need to be viewed knowing what they demonstrate. The actual experienced cost of living change is best reflected in the Dallas Fed number (Trimmed), while economic price pressure is best reflected in the BEA number (PCEPI).

Take-Away

Perception, and expectations of future perception, drive stock prices more than the accuracy and precision of any measure of economic health. One thing for equity investors to keep an eye on, is if the bond market begins to lose faith in tame inflation or the Fed’s ability to keep an even keel, the expectations of equity investors will lean toward lightening up positions. If the bond market doesn’t react by selling off (higher rates), then higher prices of some products should do no more than cause sector rotation within the markets to companies benefiting – not unlike buying apples when you think oranges are priced too high.


Suggested Reading:

Is Inflation Going to Hurt Stocks?

Real Estate Risks to the Stock Market Who Benefits from The Americas Jobs Plan?


Who Benefits from The Americas Jobs Plan?

Most Watched Channelchek C-Suite Interviews of 2020


Sources:

https://www.dallasfed.org/research/pce

https://www.stlouisfed.org/publications/regional-economist/july-2013/cpi-vs-pce-inflation–choosing-a-standard-measure

https://www.dallasfed.org/research/pce

https://www.dallasfed.org/research/economics/2019/0528.aspx


Stay up to date. Follow us:


Stay up to date. Follow us:

Higher Vaccinated States Have Experienced Less Foot Traffic


image credit: OnTheRoxxBand


Are Vaccinated People Spending Differently than those not Vaccinated?


With over 20% of the U.S. now having received Covid shots (through April 2021), some interesting statistics have been collected on consumer behavior. There is a slow return to pre-Covid era consumer behavior; this suggests industries impacted most by the quarantines still have much more potential. It also reveals that despite the expectations that the vaccine would encourage many people to be out among others for live music, gym workouts, dining, etc., those that are more likely to be out in crowds are those that have not been vaccinated. This reaction has been as hard to predict as everything else over the past year.


Vaccinated Behavior vs. Unvaccinated

According to an April survey by Cardify, the most likely consumers to be out at gyms, restaurants, salons, and entertainment venues are those that have not been vaccinated and don’t plan on getting one. As an explanation as to why those that have received immunities aren’t as likely to be out, Derrick Fung, CEO of Cardify said, vaccinated consumers are “proceeding with cautious optimism.” The vaccinated are slow to behave as they did pre-Covid and are now less comfortable being around large crowds of people.

The Cardify survey data is confirmed by other research conducted by Earnest Research (ER). ER looked at consumer spending and foot traffic across the most and least vaccinated states, along with how well newly acquired customers during COVID have been retained across retailers.

The second report comes to the same conclusion. The vaccine rollouts have not been the big driver of spending outside the home that was expected. Digging deeper to see what is happening, it’s clear the least vaccinated states have experienced the most spending compared to the pre-Covid era. And, states having the most vaccinated have not performed.

For example, Georgia has had the slowest vaccine rollout with just 16% of its population having been “jabbed,” yet the state continues to be an outperformer in total consumer spending and traffic. Massachusetts is the most vaccinated state, with more than 25% of its population having received the precaution, and it is struggling to increase in-person commerce.


Source: earnestresearch.com


Spending

As demonstrated in the chart above, Massachusetts, with its above-average vaccination rate, has seen its year-on-year spending sitting well below a year earlier. The highest performer Georgia tops the rate of the data points even when Massachusetts is removed from the 25% or greater category. The measure of performance of states with less than 25% inoculated with Georgia removed is still much closer to year-ago traffic than the high vaccine state of Massachusetts. One explanation for the data running counter to what one may have expected is the states with the most in-person traffic are those that had fewer restrictions over the past year. Their citizenry has less re-adaption anxiety and is not uncomfortable mixing with strangers.

Curiously, the states with higher vaccination rates outperformed in the middle of 2020, a lead that narrowed at the end of the year before January’s stimulus-driven uptick and February’s post-stimulus drop. Early March saw an acceleration across all states but without any clear signs of outperformance in the most vaccinated states.


Take-Away

Vaccines are not the main economic driver. When it comes to people leaving the perceived protection of their homes to enjoy a show, have their haircut, or enjoy a prepared meal out. What they have become accustomed to may be more telling. For investors, it shows that there is much more potential for increased retail sales for the Covid-recovery stocks such as airlines, restaurants, and gyms. At no place in either the Cardify survey or the Earnest Research report was there a suggestion that the more cautious vaccinated populations would not eventually change over time.


Suggested Reading:

Is Inflation Going to Hurt Stocks?

Long Term Retirement Money and Fledgling Companies


Is it Smart to Avoid Brokers that Sell Order Flow?

Are Meme Stocks Improving Flawed Markets?


Sources:

https://www.earnestresearch.com/insights/

https://www.cardify.ai/


Stay up to date. Follow us:


Stay up to date. Follow us:

Inflation’s Impact on Stocks, Four Scenarios


image credit: Paul Boudreau (Flickr) - Inverted from Original


Four Inflation Growth Possibilities and their Impact on Stocks


One data point does not make a trend. Yet, after the Bureau of Labor Statistics (BLS) posted a 0.08% increase of the most-watched inflation measure (CPI-U), debates exploded over whether we’re in a dangerous upward trend. If you listen close, they’re not two-sided debates. In my own discussions and observations, I count four positions on the important state-of-inflation question.


Implications of Each Position

Each position has a different implication. There are some that expect the Fed will backtrack significantly on their “low rates for years” language and quickly take the proverbial punch bowl away. These are the voices saying the Fed will notch up rates soon. Another contingent that also argues rates are going up suggests the Fed now has little control. They agree that rates are rising, but they think it will be market-driven and completely outside of intended monetary policy. Then there are those who believe rates will stay down in much the same way we have experienced low rates for the past 12 months – no change.  A fourth voice in the debate believes inflation levels will not stay too high, but the Fed would quickly change course if they do.  

 All four of these have different ramifications for the stock market. Should rates rise or be pushed up, money would be pulled out of the equity markets and reallocated to the more predictable returns of fixed income securities. The next inflation data release is scheduled for June 13; this will either begin to confirm or disprove a trend. Equity market investors should keep an eye on which of the four scenarios are unfolding.  Here’s why: In two of the four different scenarios rates rise, however, each is nuanced and could have different effects on stocks. Another two distinct scenarios are where rates stay near current levels, they could also lead to different paths for equity markets.  


Low Inflation Contained – Scenario #1

Let’s start with the scenario, of low inflation. Those supporting this forecast see modest price growth as deeply ingrained in economic activity, they believe sharper increases simply won’t happen. They don’t foresee overheating even with the promised 0.00-0.25%  interest rates for the next three years. Those embracing this scenario take reassurance that the CPI release that prompted the debate, was clouded by base effects and supply bottlenecks, both of which could be a short-term occurrence.


Base Effect:

The impact of an increase in the price level (i.e. previous year’s inflation) over the corresponding rise in price levels in the current year.  If the inflation rate was low in the same period last year, then even a small increase in the price index will produce a high rate of inflation in the current year.


The supporters of this idea expect “business as usual.” And as we have learned, “usual” means we’ve had cheap money and low rates with no problem – inflation isn’t a concern, the results will continue to be a strong stock market that will march upward. This is the most bullish scenario for stocks (and bond prices).


Fed Will Fall Behind – Scenario #2

 Let’s look at the other extreme inserted here as scenario two. These folks view the Fed as having an overly dovish bias that will ignore the warning signs until it’s too late. Reeling inflation in, after it takes hold, is more difficult than maintaining stability by staying ahead of it. They are very concerned the Fed is already behind. Under this scenario the Fed loses control, long-term bond yields soar as bond investors require compensation (yields) above the expected level of purchasing-power erosion.  The Fed has been able to keep control over short-term rates, but they can lose the ability to impact the longer maturities out on the yield curve. In fact, keeping the short end anchored near zero could spook bond buyers even more.


Dovish:

The Fed’s tone of Fed monetary policy and position toward inflation is dovish if it leans more toward inflation is not a problem so economic growth is a higher priority. When the Fed is dovish, they are likely to keep rates low.

The opposite is when the Fed is looking to subdue growth to maintain an inflation target, it is called hawkish.


Under this second scenario, stocks react by selling off in many sectors. This is because borrowing costs of businesses rise, importers will have to pay more for their goods, costs they may not be able to fully pass on to customers, dividend-paying stocks will take a hit as competition intensifies with coupon levels paid on bonds. Any poor performance from equities could drive even more money out and into bonds and insured deposits. 


Fed too Slow on the Draw – Scenario #3

 In a third scenario, there are those who expect the Fed to respond to a climb in inflation pressures, but not in time. These Fed-watchers, pundits, and everyday investors see the central bank as more committed to their forward guidance on rates than to their other pledge to act if core prices stay above their 2% target. My former colleague, ex-Federal Reserve Bank of New York President, Bill Dudley, put himself firmly in that group. In a recent Bloomberg interview, he suggested that the Fed would start chasing inflation’s tail after it ran away and that we would then need much higher nominal rates to get real rates to the levels that would cool growth and inflation pressures. His experienced projection is that policy rates could top 4%.


BLS CPI Data Release Dates

June 2021 Jul. 13, 2021 08:30 AM
July 2021 Aug. 11, 2021 08:30 AM
August 2021 Sep. 14, 2021 08:30 AM
September 2021 Oct. 13, 2021 08:30 AM
October 2021 Nov. 10, 2021 08:30 AM
November 2021 Dec. 10, 2021 08:30 AM


This scenario would likely cause an erratic stock market. Some days traders and other participants may take solace over the Fed’s occasional calming words and then markets could spike up on other days as it gets spooked by numbers suggesting economic overheating was ignored. This push and pull create opportunities for traders that do better with volatility, most investors prefer clearly trending markets.


The Fed’s Got This – Scenario #4

Janet Yellen, who also has some insight into what goes on behind closed doors at FOMC meetings, hasn’t gone against the official stance, which says that the mega-stimulus meant to encourage full employment won’t push inflation past 2% for any sustained period.  She has however noted that if the stimulus is overdone, the Fed can simply start the ball rolling on a gradual climb in rates to preempt a serious overshoot.

This may sound like the first scenario, but in that scenario, the policy action was too late. This last scenario suggests the Fed can and will change if it needs to and everything will turn out fine.

Confidence and trust are important for investors. Should this trust be established and maintained, even in the face of rising inflation and rates, markets will be orderly as investors won’t expect a return to the inflation of the ’70s. Perhaps investors would experience equity indices growing along the more historical trend line.


Take-Away

Anyone who says they know the market is going to have an inevitable outcome may not be worth listening to. Professional money managers form scenario analysis and try to handicap the certainty of each outcome when allocating risk positions. Investors at all levels should view what the possibilities are and observe to see which are unfolding, shifting allocations in response.

We have had a very transparent Fed under Bernanke, Yellen, and the current Chair Powell. It has, in my observation, done everything that has been promised as it relates to conducting policy.  One tool the Fed has used consistently since 2009 is the incredible power of their telling the market exactly what their plans are. Promising the markets, they will keep rates very low through next year has acted to keep bond investors from betting against the Fed’s word. Those who have bet against the Fed over the past ten-plus years have probably had bad outcomes. One question that may never be answered is: if the Fed does need to act to raise short-term rates in advance of next year, and they do act, will they lose the power of their promise?

I enjoy hearing from readers; feel free to comment directly to my email by clicking on my name below.


Paul Hoffman

Managing Editor, Channelchek


Suggested Reading

The Sustainability of Growing Margin Debt

Is Inflation Going to Hurt Stocks?


Should Stock Market Investors Worry About Inflation?

Money Supply is Like Caffeine for Stocks


Sources:

https://www.bls.gov/news.release/pdf/cpi.pdf

https://www.fincash.com/l/basics/base-effect

https://www.bloomberg.com/news/videos/2021-04-12/dudley-says-fed-will-be-much-slower-to-tighten-video

https://www.wsj.com/articles/yellen-says-interest-rates-may-have-to-rise-to-keep-economy-from-overheating-11620151101#:~:text=Yellen%20told%20The%20Wall%20Street,the%20coming%20months%20will%20subside


Stay up to date. Follow us:


Stay up to date. Follow us:

Inflations Impact on Stocks Four Scenarios


image credit: Paul Boudreau (Flickr) - Inverted from Original


Four Inflation Growth Possibilities and their Impact on Stocks


One data point does not make a trend. Yet, after the Bureau of Labor Statistics (BLS) posted a 0.08% increase of the most-watched inflation measure (CPI-U), debates exploded over whether we’re in a dangerous upward trend. If you listen close, they’re not two-sided debates. In my own discussions and observations, I count four positions on the important state-of-inflation question.


Implications of Each Position

Each position has a different implication. There are some that expect the Fed will backtrack significantly on their “low rates for years” language and quickly take the proverbial punch bowl away. These are the voices saying the Fed will notch up rates soon. Another contingent that also argues rates are going up suggests the Fed now has little control. They agree that rates are rising, but they think it will be market-driven and completely outside of intended monetary policy. Then there are those who believe rates will stay down in much the same way we have experienced low rates for the past 12 months – no change.  A fourth voice in the debate believes inflation levels will not stay too high, but the Fed would quickly change course if they do.  

 All four of these have different ramifications for the stock market. Should rates rise or be pushed up, money would be pulled out of the equity markets and reallocated to the more predictable returns of fixed income securities. The next inflation data release is scheduled for June 13; this will either begin to confirm or disprove a trend. Equity market investors should keep an eye on which of the four scenarios are unfolding.  Here’s why: In two of the four different scenarios rates rise, however, each is nuanced and could have different effects on stocks. Another two distinct scenarios are where rates stay near current levels, they could also lead to different paths for equity markets.  


Low Inflation Contained – Scenario #1

Let’s start with the scenario, of low inflation. Those supporting this forecast see modest price growth as deeply ingrained in economic activity, they believe sharper increases simply won’t happen. They don’t foresee overheating even with the promised 0.00-0.25%  interest rates for the next three years. Those embracing this scenario take reassurance that the CPI release that prompted the debate, was clouded by base effects and supply bottlenecks, both of which could be a short-term occurrence.


Base Effect:

The impact of an increase in the price level (i.e. previous year’s inflation) over the corresponding rise in price levels in the current year.  If the inflation rate was low in the same period last year, then even a small increase in the price index will produce a high rate of inflation in the current year.


The supporters of this idea expect “business as usual.” And as we have learned, “usual” means we’ve had cheap money and low rates with no problem – inflation isn’t a concern, the results will continue to be a strong stock market that will march upward. This is the most bullish scenario for stocks (and bond prices).


Fed Will Fall Behind – Scenario #2

 Let’s look at the other extreme inserted here as scenario two. These folks view the Fed as having an overly dovish bias that will ignore the warning signs until it’s too late. Reeling inflation in, after it takes hold, is more difficult than maintaining stability by staying ahead of it. They are very concerned the Fed is already behind. Under this scenario the Fed loses control, long-term bond yields soar as bond investors require compensation (yields) above the expected level of purchasing-power erosion.  The Fed has been able to keep control over short-term rates, but they can lose the ability to impact the longer maturities out on the yield curve. In fact, keeping the short end anchored near zero could spook bond buyers even more.


Dovish:

The Fed’s tone of Fed monetary policy and position toward inflation is dovish if it leans more toward inflation is not a problem so economic growth is a higher priority. When the Fed is dovish, they are likely to keep rates low.

The opposite is when the Fed is looking to subdue growth to maintain an inflation target, it is called hawkish.


Under this second scenario, stocks react by selling off in many sectors. This is because borrowing costs of businesses rise, importers will have to pay more for their goods, costs they may not be able to fully pass on to customers, dividend-paying stocks will take a hit as competition intensifies with coupon levels paid on bonds. Any poor performance from equities could drive even more money out and into bonds and insured deposits. 


Fed too Slow on the Draw – Scenario #3

 In a third scenario, there are those who expect the Fed to respond to a climb in inflation pressures, but not in time. These Fed-watchers, pundits, and everyday investors see the central bank as more committed to their forward guidance on rates than to their other pledge to act if core prices stay above their 2% target. My former colleague, ex-Federal Reserve Bank of New York President, Bill Dudley, put himself firmly in that group. In a recent Bloomberg interview, he suggested that the Fed would start chasing inflation’s tail after it ran away and that we would then need much higher nominal rates to get real rates to the levels that would cool growth and inflation pressures. His experienced projection is that policy rates could top 4%.


BLS CPI Data Release Dates

June 2021 Jul. 13, 2021 08:30 AM
July 2021 Aug. 11, 2021 08:30 AM
August 2021 Sep. 14, 2021 08:30 AM
September 2021 Oct. 13, 2021 08:30 AM
October 2021 Nov. 10, 2021 08:30 AM
November 2021 Dec. 10, 2021 08:30 AM


This scenario would likely cause an erratic stock market. Some days traders and other participants may take solace over the Fed’s occasional calming words and then markets could spike up on other days as it gets spooked by numbers suggesting economic overheating was ignored. This push and pull create opportunities for traders that do better with volatility, most investors prefer clearly trending markets.


The Fed’s Got This – Scenario #4

Janet Yellen, who also has some insight into what goes on behind closed doors at FOMC meetings, hasn’t gone against the official stance, which says that the mega-stimulus meant to encourage full employment won’t push inflation past 2% for any sustained period.  She has however noted that if the stimulus is overdone, the Fed can simply start the ball rolling on a gradual climb in rates to preempt a serious overshoot.

This may sound like the first scenario, but in that scenario, the policy action was too late. This last scenario suggests the Fed can and will change if it needs to and everything will turn out fine.

Confidence and trust are important for investors. Should this trust be established and maintained, even in the face of rising inflation and rates, markets will be orderly as investors won’t expect a return to the inflation of the ’70s. Perhaps investors would experience equity indices growing along the more historical trend line.


Take-Away

Anyone who says they know the market is going to have an inevitable outcome may not be worth listening to. Professional money managers form scenario analysis and try to handicap the certainty of each outcome when allocating risk positions. Investors at all levels should view what the possibilities are and observe to see which are unfolding, shifting allocations in response.

We have had a very transparent Fed under Bernanke, Yellen, and the current Chair Powell. It has, in my observation, done everything that has been promised as it relates to conducting policy.  One tool the Fed has used consistently since 2009 is the incredible power of their telling the market exactly what their plans are. Promising the markets, they will keep rates very low through next year has acted to keep bond investors from betting against the Fed’s word. Those who have bet against the Fed over the past ten-plus years have probably had bad outcomes. One question that may never be answered is: if the Fed does need to act to raise short-term rates in advance of next year, and they do act, will they lose the power of their promise?

I enjoy hearing from readers; feel free to comment directly to my email by clicking on my name below.


Paul Hoffman

Managing Editor, Channelchek


Suggested Reading

The Sustainability of Growing Margin Debt

Is Inflation Going to Hurt Stocks?


Should Stock Market Investors Worry About Inflation?

Money Supply is Like Caffeine for Stocks


Sources:

https://www.bls.gov/news.release/pdf/cpi.pdf

https://www.fincash.com/l/basics/base-effect

https://www.bloomberg.com/news/videos/2021-04-12/dudley-says-fed-will-be-much-slower-to-tighten-video

https://www.wsj.com/articles/yellen-says-interest-rates-may-have-to-rise-to-keep-economy-from-overheating-11620151101#:~:text=Yellen%20told%20The%20Wall%20Street,the%20coming%20months%20will%20subside


Stay up to date. Follow us:


Stay up to date. Follow us:

The Sustainability of Growing Margin Debt


image credit: Mikhail Nilov (Pexels)


Margin Debt Increases are Eye-Popping


Stock market margin debt jumped by $25 billion in April and $48.5 billion since the beginning of the year based on FINRA statistics. The level reached a historic high of $847 billion from $552.5 billion a year ago. This 53% increase in a year is growth well above average. The unsustainability of this pace, and the idea that margin rates charged by brokers will rise as interest rates do, add an overlooked element of risk in today’s stock market.

The seeming precariousness of the level of leverage measures only two types of accounts, this includes brokerage accounts and advisory customers that are overseen by FINRA. It excludes unreported borrowing by professionals and others that have used debt for investments in the financial markets.


The below graph shows weekly data on the growth of margin debt reported by FINRA. The current pace is faster than at any point found on the FINRA website. The market, as measured by the S&P 500, is following the same path of growth (see second chart). Although correlation is not proof of cause; experience has shown that as the market rises, people will borrow to compound their returns. Further, as the value of the accounts that serve as collateral then rise, they are capable of leveraging up even more.


The snowball effect of the increases in both the S&P performance and the borrowing that is in part fueling the market increases could continue until something disrupts the chain reaction.


Possible Disruptors to Margin and Market Growth

This disruption could come in the form of an increase in interest rates. This would cause brokers to raise their broker’s call rate.  Investors would then have to weigh their expected return versus the cost of the borrowing. The cost of borrowed funds to the expected return equation would not be as favorable even if their market view has not changed. This could cause some investors to retreat from their aggressive position. It wouldn’t take much at these levels to create a chain reaction of selling to reduce borrowed capital.

Another potential disruptor could be a few bad days in a row for the market. Again this impacts expected return versus the cost of (borrowed) money. The chart above suggests just how large the profits are that many investors are sitting on. A few days of market decline can signal ti investors that it’s time to book some of those profits. This further weakness could trigger enough margin calls where investors either sell positions and pay off the interest, or cough up additional cash. The margin calls could create a march downward as the same forces that brought it up, act in reverse to tear it down.


Other Borrowing

In a previous article, Channelchek reported that 2.5 million homes or 4.9% of homeowners’ mortgages are in forbearance. The hurdle to pause payment on a federal agency-backed mortgage is quite low. It’s suspected that some of this money that will be owed later has been finding its way into the market. In reality, this is borrowed money, and the payments are (under current stipulations) required to resume by mid-year 2021. This could curtail the flow of these borrowed funds, not accounted for by FINRA, from entering the market. The reduced inflows and possible outflows would reduce investment growth and the upward pressure on prices.

In another Channelchek article, we described how family offices are not overseen by regulatory authorities like FINRA, any borrowing from money managers is not accounted for in much the same way hedge fund borrowing is not regulated or overseen. The leverage from these investment groups is not known. Earlier this year, there was an instance when the firm Archegos Capital Management suffered losses large enough to impact markets and earnings of some of their large banking relationships. The amount of risk and, therefore, the potential impact on the market to trade-off from this category is not known.


Take-Away

The strength of the market comes from many places. The amount of cash in the system undoubtedly has driven prices up. The low return on interest rate investment alternatives is another which pushed money into higher-risk investments, and then there is the availability of borrowed money. The use of borrowed money is at historic highs.

Borrowed money has a cost. That cost is measured against the expected return. If the expectations change or the cost of money increases, the market could sink to find a new balance from which to try to build again. Just as sure as markets go up and down, this will occur to some degree. Why a selloff may be triggered is debt-funded investing. When a larger selloff may be triggered, is unknown.


Suggested Reading:

Is Inflation Going to Hurt Stocks?

The Limits of Government Economic Tinkering (June 2020)


A Look at Real Estate Risks to the Stock Market

Understanding Family Offices


Sources:

https://www.finra.org/investors/learn-to-invest/advanced-investing/margin-statistics

https://www.federalreserve.gov/publications/files/financial-stability-report-20210506.pdf


Stay up to date. Follow us:


Stay up to date. Follow us:

Which Generation Holds the Most Power?


Which Generation Holds the Most Power?


The overall differences in age groups or generations result from each being shaped or encultured by their own shared experiences, memories, and surroundings (technical, political, financial, etc.).

The Visual Capitalist has created what they call the Generational Power Index (GPI) with the aim of accurately breaking down the ingredients of generational power at present. The index measures three categories, Economic Power, Political Power, and Cultural Power.   All three categories are then combined to form the overall comparison. Shared below are sections of their GPI
Report
on Cultural Power.

The Channelchek Content Team are fans of the work created by the Visual Capitalist so, when it is of interest to our followers, we are grateful that they let us share some of it with you.


The visual below shows the age ranges used and their overall economic score


The following graphic breaks down the components and the ranking


Behind the visuals


Earnings represent the median weekly earnings of full-time workers in the U.S. Among the four, earnings was the most evenly distributed. Gen Z had the lowest median weekly earnings ($614), while Gen X had the highest ($1,103).


Net Worth was led by Boomers. This variable is each generation’s share of overall U.S. wealth. As it turns out, Boomers hold 53% of all wealth in the country—more than all other generations combined.


Billionaire Wealth was dominated by Boomers, and the Silent Gen. Visual Capitalist calculated this variable by starting with the top 1,000 billionaires globally, then filtering for Americans only.


Business Leaders is based on two underlying measures, the generational share of both S&P 500 CEOs and small business owners. This allowed capturing data from two sides of the business spectrum to see who holds power there.


In Parting

They say a picture is worth 1000 words. We hope these 350 words, along with two pictures, provides you a better understanding of where power currently resides. This is the first GPI Report, and they promise annual updates. Watching the transfer of wealth and power through the years will be interesting.

Is Inflation Going to Hurt Stocks?


image credit: Brett Rogers (Pexel)


Some Color on Prices and the Market’s Fixation on Inflation


Stock market investors as a whole tend to rotate their worries and fixations. At times they place heightened importance on economic releases such as unemployment, consumer confidence, exchange rates, or inflation, at other times the focus is on other factors that will impact the economy and stock prices. We’ve recently seen these other factors include Covid19 vaccine availability, natural resource scarcity, and interest rates.

The current fixation is inflation. Is this worry appropriate under the current circumstances? We’ll explore this with an eye toward where further price increases may come from.


Demand-Pull Inflation

The market’s current fixation is on inflation – more specifically it’s on something called demand-pull inflation. Equity investors have become nervous that the money that continues to be created in trillion-dollar increments will pull prices upward as the increased ability or desire to spend remains in place. Demand-pull, which in the most simple terms means increased availability of money (wage increases, stimulus checks, higher employment levels) can spark inflation causing demand. The primary concerns that many view are at work now are money supply expansion, the growing economy, inflation expectations, government spending, and asset price increases.

Outside of the demand-pull theory, there are also supply-driven shortages caused by shutdowns and uneven demand that have driven up prices on lumber, paint, electronics, cars, and more. These are viewed as more temporary.


Causes of Demand-Pull Inflation

Money Supply Expansion- If there is an excess of money created and in circulation, prices of goods and services are bid up as demand for those goods and services increases. The same effect is created if interest rates are low and credit is easy; in these cases, more people have the ability to purchase a limited amount of goods.

The chart below shows the growth of M2, a money supply measure that includes cash, bank deposits, and other “cash-like” instruments such as money market accounts. The chart covers the period from February 2006 through February 2021. There is a very steep spike in the supply of M2 beginning in March of last year. The chart is not current as the Federal Reserve discontinued reporting this popular data series.


Growing Economy-  An economy where jobs are being created and confidence is escalating feeds on itself as more people have a higher income to spend. This creates demand for products and services and the ability for businesses to increase prices. Workers may also review the price tag they put on their own labor as demand for employees grows. The employer then decides if the increased wage costs are passed along to the customers. In a growing economy, it’s much easier to pass along the increased cost of employees, which adds to consumer prices.

The chart below is of quarterly GDP and demonstrates just how remarkably strong the economic growth has been.


Inflation Expectations- Last month there was a dramatic increase in the price of used cars (10%), lumber prices have been climbing as well. Overall the consumer price index (CPI) has been surprised the markets by being even higher than expected. Seeing reported inflation tick up along with the increased money supply and economic growth causes consumers to buy sooner rather than later. This increases demand and of course, this demand pulls prices up.

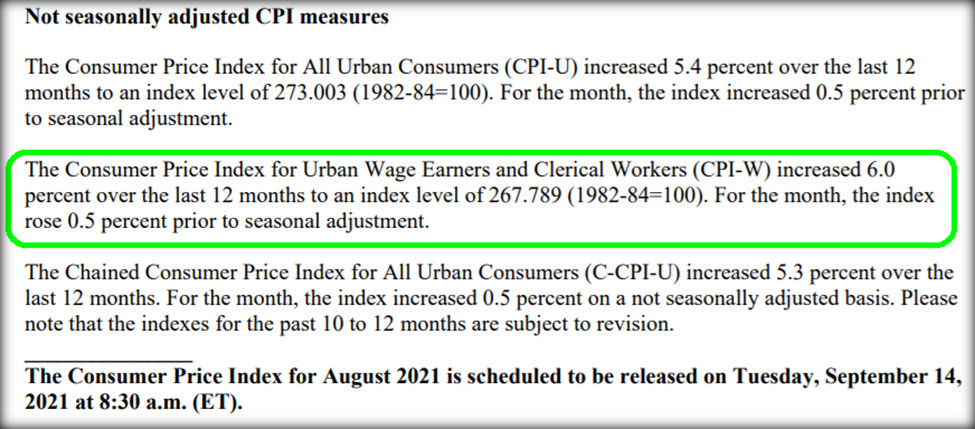
The excerpt below is from the Bureau of Labor Statistics (BLS) released in mid-May. It highlights that the increase in used car prices for April 2021 is the highest ever recorded.


Government Spending- Increased spending increases demand for both raw materials and products. For example, if there are government-led infrastructure projects that require copper and steel, the cost for these may increase, this would then increase the cost of manufacturing homes, cars, and electronics that use the same raw materials. When those costs are passed along, it contributes to consumer inflation.

Similarly, a tax cut places more money in the hands of consumers; this also has a demand-pull impact on prices.

The chart below is of government expenditures. The peak period is Q2 2020, the dip and turnaround were Q4 2020. The trend appears to be continuing upward; recent announcements and proposals out of Washington suggest that it will accelerate sharply.


Asset Inflation- The changes that households are going through to make remote working easier and more productive is a good example of demand-pull inflation. With the new need for workspace at home, prices of larger homes have increased faster than smaller homes. In the case of furniture and electronics, they are also experiencing supply shortages which creates an almost frenzy-like behavior from consumers. 

Below is a chart of median home prices over the past 10 years. Prices began accelerating in March of 2020 and appear to have tapered recently.


Take-Away

The behavior of the stock market, despite the inflation worries, has been remarkably strong. Most of the concern is that inflation would cause interest rates to rise, higher rates on bonds would give investors an alternative, and at the same time, higher interest rates paid would cut into company earnings.  The bond market, which is impacted more directly by inflation, has not been panicking. Financial markets, although nervous and maybe even keeping one finger on the “sell” trigger may be taking the Fed at its word. Fed Chairman Powell has said, “An episode of one-time price increases as the economy reopens, is not likely to lead to persistently higher year-over-year inflation into the future.”

Whether this is true remains to be seen. The official stance is in line with what one would expect out of the nation’s central bank chair. If Powell in any way indicates concern over price increases, demand-pull would increase as inflation expectations would take firmer root in people’s minds, increased demand and higher prices would then become self-fulfilling.


Paul Hoffman

Managing Editor, Channelchek


Suggested Reading:

A Look at Real Estate Risks to the Stock Market

The Limits of Government Economic Tinkering (June 2020)


Long Term Retirement Money and Fledgling Companies

$1.9 Trillion in Terms We Can Better Relate To


Sources:

www.bls.gov

https://fred.stlouisfed.org/


Stay up to date. Follow us:


Stay up to date. Follow us:

Pros and Cons of FDA Funded in Part by Companies


image credit: Alan Kotov (flickr.com)


Pros and Cons of FDA Partly Funded by the Companies it Oversees


The Food and Drug Administration has moved from an entirely taxpayer-funded entity to one increasingly funded by user fees paid by manufacturers that are being regulated. Today, close to 45% of its budget comes from these user fees that companies pay when they apply for approval of a medical device or drug.


Positive and Negative Impact

As a pharmacist and medication and dietary supplement safety researcher, I understand the vital role that the FDA plays in ensuring the safety of medications and medical devices.

But I, along with many others, now wonder: Was this move a clever win-win for the manufacturers and the public, or did it place patient safety second to corporate profitability? It is critical that the U.S. public understand the positive and negative ramifications so the nation can strike the right balance.

Americans in the early 20th century were outraged when they found out that manufacturers used poor-quality methods for producing food and medication, and used unsafe, ineffective, and undisclosed addictive ingredients in medications. The resulting Food, Drug, and Cosmetic Act of 1938 gave the taxpayer-funded Food and Drug Administration new authority to protect the U.S. consumer.

One of the FDA’s most shining successes occurred in the late 1950s when the agency refused to approve thalidomide. By 1960, 46 countries allowed pregnant women to use thalidomide to treat morning sickness, but the FDA refused on the grounds that the studies were insufficient to demonstrate safety. Debilitating birth defects resulting from thalidomide arose in Europe and elsewhere in 1961. President John F. Kennedy heralded the FDA in 1962 for its stance. An FDA driven by the data – and not corporate pressure – prevented a major tragedy.


How AIDS Changed How the FDA is Funded

The FDA continued its work fully funded by U.S. taxpayers for many years until this model was upended by a new infectious disease. The first U.S. case of HIV-induced AIDS occurred in 1981. It was rapidly spreading, with devastating complications like blindness, dementia, severe respiratory diseases, and rare cancers. Well-known sports stars and celebrities died of AIDS-related complications. AIDS activists were incensed about long delays in getting experimental HIV drugs studied and approved by the FDA.

In 1992, in response to intense pressure, Congress passed the Prescription Drug User Fee Act. It was signed into law by President George H.W. Bush.

With the act, the FDA moved from a fully taxpayer-funded entity to one funded through tax dollars and new prescription drug user fees. Manufacturers pay these fees when submitting applications to the FDA for drug review and annual user fees based on the number of approved drugs they have on the market. However, it is a complex formula with waivers, refunds and exemptions based on the category of drugs being approved and the total number of drugs in manufacturers’ portfolios.

Over time, other user fees for generic, over-the-counter, biosimilar, animal, and animal generic drugs, as well as for medical devices, were created. As time passed, the FDA’s funding has increasingly come from the industries that it regulates. Of the FDA’s total US$5.9 billion budget, 45% comes from user fees, but 65% of the funding for human drug regulatory activities are derived from user fees. These user fee programs must be reauthorized every five years by Congress, and the current agreement remains in effect through September 2022.


Have User Fees Worked?

The FDA and the drug or device manufacturers negotiate the user fees. They also negotiate performance measures that the FDA has to meet to collect them and proposed changes in FDA processes. Performance measures include things such as how quickly the FDA responds to meeting requests, how quickly it generates correspondence, and how long it takes from submission of a new drug application until the FDA approves or refuses to approve a drug or product.

Because of the additional funding generated by user fees and performance measures that the FDA has to meet, the FDA is quicker and more willing to discuss what it wants to see in an application with manufacturers. It also offers clearer guidance for manufacturers. In 1987, it took 29 months from the time a new drug application was filed by the manufacturer for the FDA to decide whether to approve a medication in the U.S. In 2014, it only took 13 months and by 2018, it was down to 10 months.

Changes in more recent years have also increased the number of standard new drug applications approved the first time around by the FDA from 38% in 2005 to 61% in 2018. In diseases where there are not many medication options for patients, the FDA has a priority review process, where 89% of new drug applications were approved the first time around and the approvals were completed in eight months in 2018. All this occurred while the number of new drug applications have been increasing over time.

Most recently, the COVID-19 pandemic has seen the FDA provide emergency use authorization for potential treatments in a matter of weeks, not months. The infrastructure and capacity to review the available information so rapidly is due in large part to the funding from user fees.


While the number and speed of drug approvals have been increasing over time, so have the number of drugs that end up having serious safety issues coming to light after FDA approval. In one assessment, investigators looked at the number of newly approved medications that were subsequently removed from the market or had to include a new black box warning over 16 years from the year of approval. These black box warnings are the highest level of safety alert that the FDA can employ, warning users that a very serious adverse event could occur.

Before the user fee act was approved, 21% of medications were removed or had new black box warnings as compared to 27% afterward.

Some potential reasons that more adverse effects are coming to light after drug approval include senior FDA officials overturning scientist recommendations, a lower burden of proof for medication approval, and more clinical data in new drug applications coming from foreign clinical trial sites that require additional time to assess in an environment where regulators are rushing to meet tight deadlines.


Lack of Money Limits FDA

User fees are a viable way to shift some of the financial burden to manufacturers who stand to make money from the approval and sale of drugs in the lucrative U.S. market. Successes have occurred and provided U.S. citizens with medication more quickly than before.

However, without careful consideration of what is being negotiated, the FDA can become weak and ineffective, unable to protect its citizens from the next thalidomide. There are some signs that the pendulum may be swinging too far in the direction of the manufacturers. Additionally, while drug approval functions at the FDA are well funded, the FDA is insufficiently funded to protect consumers from other issues such as counterfeit drugs and dietary supplements because they cannot collect user fees to do so. In my view, these functions need to be identified and require additional taxpayer funding.


This article was republished
with permission from 
The
Conversation
,
 a news site dedicated to sharing ideas from academic
experts.  Written by ,
C. Michael White  Distinguished Professor and Head of the
Department of Pharmacy Practice, University of Connecticut.


Suggested Content:

PDS Biotechnology Corporation – C-Suite Interview (Video)

Ayala Pharmaceuticals Virtual Roadshow Replay (Video)


STEM Holdings – C-Suite Interview (Video)

Medicine Man Technologies – C-Suite Interview (Video)


Stay up to date. Follow us:


Stay up to date. Follow us:

Are Tips for Tweets Taxable?


image credit: Esther Vargas (flickr.com)


Tweets, Tips, and Taxes

It isn’t news at this point that Twitter instituted what they’re calling a “Tip Jar.”  This was announced on Twitter’s Blog on May 6, by Esther Crawford. Ms. Crawford wrote, “You drive the conversation on Twitter, and we want to make it easier for you to support each other beyond Follows, Retweets, and Likes. Today, we’re introducing Tip Jar – a new way for people to send and receive tips.” 

About the
Feature

This new tipping feature has been rolled out in English to a test group to start. It invites users to enable a tipping method (Spaces, Bandcamp, Cash App, Patreon, PayPal, or Venmo). This opens the door for those that have a reason or desire to financially support a Twitter account owner to do so if that owner has invited payment by opening a “tip jar” the method of payment is already orchestrated by Twitter.

Shortly after launching this feature, there were a few bugs to work out regarding privacy and disclosure of the tipper’s information. That has been adjusted this is why companies choose slow rollouts and only invite some customers to test new features or products.

How Tippees May
Be Taxed

One possible impact Twitter users should understand is; if the account owners are opening this window with the expectation of getting paid for “driving the conversation,” this money may be subject to income taxation? If it is, it has the potential to alter users’ tax brackets, perhaps reduce or disallow any new stimulus payment, impact Social Security, break employers rules on outside work, child support, and a long list of others.

My primary interest is, under what circumstances could this be a taxable event. I reached out and asked Thomas W. Aldous Jr., JD, of Fennemore Law. Mr. Aldous practices Trust and Estate law and holds a   Master of Laws (in taxation) from NYU. My question was simple “Are payments over a certain amount to the new Twitter Tip jar taxable?” Like most everything involving the IRS and relevant laws, the answer was not simple.

The Tipping Point

Mr. Aldous response to Channelchek is worth every taxpayer understanding. He explained:

“Amounts you receive for services are taxable. It does not matter whether you are self-employed or if you are an employee.

Amounts received as a gift are not income.

The motivation of the person giving money must be considered. Yet, if someone looking objectively at the circumstances can see that a “gift” is not really a gift, it does not matter what the parties claim. Per the US Supreme Court, a judge or jury can use ‘informed
experience with human affairs’
to determine what is or is not actually a gift.

For example, Friend and Businessman are friends. Friend occasionally gives Businessman the names of persons who might be interested in Businessman’s products. Friend’s referrals benefit Businessman’s business. After a while, Businessman tells Friend that he wants to give Friend a new car as a gift. Friend does not want or need another car. He initially rejects the car, but with Businessman’s insistence Friend eventually accepts the car. Businessman deducts the gift as a business expense. Friend believes the car is a gift. In this situation, informed experience with human affairs indicates that Businessman’s gift to Friend was actually compensation for the referrals. The car is income to Friend.

Tips may look like gifts. They are given voluntarily for a service rendered. They are over and above an obligation. However, in practice, tips are often customary and expected. Per the IRS regulations, tips are taxable income.

If L tips his barber X dollars each time he gets a haircut, L’s barber would include the tip in his income. If L gives his barber an additional Y dollars for the barber’s birthday (on top of L’s regular tip), that should be treated as a gift and not taxable income.

Twitter uses the term “Tip Jar”. With a payment through the Twitter Tip Jar, one should start with the assumption that any amounts received are taxable. There is no hard and fast rule, but if someone is requesting and receiving tips on Twitter to support their efforts, most likely any tips that person receives will be taxable income. Unless there is some type of charitable purpose, saying “this Tip Jar is for gifts only” is probably not going to turn “tips” into “gifts.”

Take-Away

We don’t live in a vacuum; everything has consequences. The internet and social media have created brand new sets of circumstances we never had to consider before. In the case of Twitter’s add-on feature, an innocent acceptance of payments from those who appreciate what you provide may alter your income in ways that have unintended consequences.

I now wish I had followed up my question with Thomas Aldous, I’d have asked, “if I receive tips from those that appreciate the value of my tweets, might I take write-offs on the cost of my computer and office space?”

Paul Hoffman

Managing Editor, Channelchek


Suggested Reading:

The Russell Index Reconstitution, What to Know

A Look at Real Estate Risks to the Stock Market


TAXES – Do You Pay More Than Your Fair Share?

Long Term Retirement Money and Fledgling Companies


Stay up to date. Follow us:


Sources:

https://blog.twitter.com/en_us/topics/product/2021/introducing-tip-jar.html


Special Thanks and appreciation to Thomas
Aldous
of Fennemore Law.