Patrick McCann, CFA, Research Analyst, Noble Capital Markets, Inc.
Michael Kupinski, Director of Research, Equity Research Analyst, Digital, Media & Technology , Noble Capital Markets, Inc.
Refer to the full report for the price target, fundamental analysis, and rating.
Q4 results. SKYX reported revenue of $24.9M versus our $26.5M estimate, reflecting a modest miss tied to the delayed rollout of the SKYFAN & Turbo Heater and disruption from its new AI-driven e-commerce platform. Adj. EBITDA loss of $2.7M was worse than our expectation of a loss of $0.4M.
Near-term catalysts. The SKYFAN & Turbo Heater has launched across major retailers, and we expect broader distribution and SKU expansion to support growth through 2026. The new AI-driven platform should improve conversion across the company’s owned websites following near-term disruption.
Equity Research is available at no cost to Registered users of Channelchek. Not a Member? Click ‘Join’ to join the Channelchek Community. There is no cost to register, and we never collect credit card information.
This Company Sponsored Research is provided by Noble Capital Markets, Inc., a FINRA and S.E.C. registered broker-dealer (B/D).
*Analyst certification and important disclosures included in the full report. NOTE: investment decisions should not be based upon the content of this research summary. Proper due diligence is required before making any investment decision.
German consumer goods giant Henkel AG is writing one of the largest checks in prestige hair care history, agreeing to acquire OLAPLEX Holdings (NASDAQ: OLPX) for approximately $1.4 billion in a cash deal that values shares at $2.06 apiece — a 55% premium over where the stock closed on March 25.
For small and microcap investors, this transaction is a textbook case study in what a strategic acquirer will pay for a brand with durable IP, a loyal professional channel, and a story of operational recovery.
From Lab Disruptor to Acquisition Target
OLAPLEX launched in 2014 with a singular innovation: Complete Bond Technology, a chemistry-driven approach to repairing hair bonds during and after chemical services. The product found its home in salons first, building a credibility-driven distribution model that competitors struggled to replicate.
Private equity firm Advent International backed the company and took it public, helping scale it from a single-product disruptor into a multi-SKU hair health platform. But OLAPLEX’s post-IPO journey has been rocky. The stock, which once traded well above $20, has languished amid slowing consumer demand, intense competition in the prestige hair segment, and a multi-year transformation program the company undertook to reset its cost structure, marketing engine, and go-to-market model.
That turnaround, while painful for shareholders who held on too long, appears to have made the company an attractive acquisition for Henkel, which recognized the rebuilt infrastructure and brand credibility as assets worth paying a premium for.
What Henkel Gets
Henkel is acquiring more than a brand — it is acquiring distribution leverage. OLAPLEX has established direct-to-consumer channels and specialty retail presence across North America that complement Henkel’s broader international footprint. The deal gives Henkel immediate access to the professional stylist and salon community, a channel both companies serve but through different product lines.
For Henkel, the acquisition represents an accelerated path into the premium science-led hair care category without years of organic brand-building. The company gains OLAPLEX’s product innovation pipeline and its recognition among consumers across demographics and hair types.
The Private Equity Exit
Advent International, which controlled a majority of OLAPLEX’s voting stock, approved the transaction by written consent — effectively sealing the deal without requiring a broader shareholder vote. Advent will fully exit its position at closing, bookending an investment that helped build a globally recognized brand even if the public market returns disappointed many retail investors.
J.P. Morgan Securities is advising OLAPLEX on the transaction, which is expected to close in the second half of 2026, pending regulatory approval.
What This Signals for the Market
The OLAPLEX deal underscores a persistent theme in the consumer sector: global strategics are still willing to pay substantial premiums for brands with defensible science-based positioning and professional channel relationships, even when the public market has long since moved on. For small and microcap investors tracking M&A, OLPX is a reminder that a beaten-down stock with genuine brand equity is not always a broken business — sometimes it is just a business waiting for the right buyer.
Michael Kupinski, Director of Research, Equity Research Analyst, Digital, Media & Technology , Noble Capital Markets, Inc.
Jacob Mutchler, Research Associate, Noble Capital Markets, Inc.
Refer to the full report for the price target, fundamental analysis, and rating.
Highlights from a fireside chat. This report highlights a fireside chat with Adolfo Villagomez, CEO, who discussed the company’s four pillar initiative to transform the company into a more efficient, growth focused company.
Improving the company’s cost structure. Management has implemented a comprehensive review of the organization’s operations with the goal of reducing redundancies and improving productivity. The company is targeting approximately $50 million in run-rate cost savings across fiscal years 2026 and 2027, achieved through initiatives such as workforce streamlining, supply chain optimization, procurement improvements, and the reduction of organizational layers.
Equity Research is available at no cost to Registered users of Channelchek. Not a Member? Click ‘Join’ to join the Channelchek Community. There is no cost to register, and we never collect credit card information.
This Company Sponsored Research is provided by Noble Capital Markets, Inc., a FINRA and S.E.C. registered broker-dealer (B/D).
*Analyst certification and important disclosures included in the full report. NOTE: investment decisions should not be based upon the content of this research summary. Proper due diligence is required before making any investment decision.
Michael Kupinski, Director of Research, Equity Research Analyst, Digital, Media & Technology , Noble Capital Markets, Inc.
Jacob Mutchler, Research Associate, Noble Capital Markets, Inc.
Refer to the full report for the price target, fundamental analysis, and rating.
Q4 results in line with expectations. Revenue of $25.1M and adj. EBITDA loss of $1.3 million was better than our expectations of $23.0 million and a loss estimate of $1.77 million, respectively. The quarter was supported by deferred revenue recognition and strong sequential revenue improvement.
ARK franchise momentum remains strong, with ASA surpassing 4M units sold and continued engagement across ASA, ASE, and ARK Mobile, reinforcing long-term durability. There appears to be a robust multi-year content pipeline which provides visibility, though updated timing shifts a portion of expected revenue and adj. EBITDA from 2026 into 2027.
Equity Research is available at no cost to Registered users of Channelchek. Not a Member? Click ‘Join’ to join the Channelchek Community. There is no cost to register, and we never collect credit card information.
This Company Sponsored Research is provided by Noble Capital Markets, Inc., a FINRA and S.E.C. registered broker-dealer (B/D).
*Analyst certification and important disclosures included in the full report. NOTE: investment decisions should not be based upon the content of this research summary. Proper due diligence is required before making any investment decision.
Patrick McCann, CFA, Research Analyst, Noble Capital Markets, Inc.
Michael Kupinski, Director of Research, Equity Research Analyst, Digital, Media & Technology , Noble Capital Markets, Inc.
Refer to the full report for the price target, fundamental analysis, and rating.
Take Private Proposal. Perfect Corp. received a preliminary, non-binding proposal from a consortium led by CEO Alice H. Chang and CyberLink to take the company private at $1.95 per share. The transaction would be funded through rollover equity, company cash, and potential debt. The board intends to form a special committee to evaluate the proposal, and there is no assurance that a transaction will be completed.
Ownership structure supports a high likelihood of completion. The consortium controls approximately 53.4% of shares and 81.2% of voting power. In our view, this significantly increases the likelihood of a transaction, subject to special committee approval.
Equity Research is available at no cost to Registered users of Channelchek. Not a Member? Click ‘Join’ to join the Channelchek Community. There is no cost to register, and we never collect credit card information.
This Company Sponsored Research is provided by Noble Capital Markets, Inc., a FINRA and S.E.C. registered broker-dealer (B/D).
*Analyst certification and important disclosures included in the full report. NOTE: investment decisions should not be based upon the content of this research summary. Proper due diligence is required before making any investment decision.
Joe Gomes, CFA, Managing Director, Equity Research Analyst, Generalist , Noble Capital Markets, Inc.
Refer to the full report for the price target, fundamental analysis, and rating.
Overview. Fourth quarter and full year 2025 results came in-line with management’s January 12, 2026 pre-announcement, with fourth quarter revenue of $207 million and full year revenue of $806 million. Notably, all brands demonstrated a sequential improvement in comparable sales during the quarter. Fourth quarter consolidated comparable sales declined approximately 1.8%, representing about 4 points of sequential improvement from the third quarter. And this momentum has continued in the new year.
4Q25 Results. For the fourth quarter, total GAAP revenue was approximately $207 million compared to $222 million in the prior year quarter. Adjusted EBITDA was $28.1 million compared to $31 million in the prior year quarter, a decrease of 9.5%. ONE Group reported a net loss, before preferred stock dividends, of $6.4 million compared to net income of $1.6 million in 4Q24.
Equity Research is available at no cost to Registered users of Channelchek. Not a Member? Click ‘Join’ to join the Channelchek Community. There is no cost to register, and we never collect credit card information.
This Company Sponsored Research is provided by Noble Capital Markets, Inc., a FINRA and S.E.C. registered broker-dealer (B/D).
*Analyst certification and important disclosures included in the full report. NOTE: investment decisions should not be based upon the content of this research summary. Proper due diligence is required before making any investment decision.
Strategic Portfolio Optimization Creating Long-Term Value
Cost Management Drives Restaurant Margin Improvement in Fourth Quarter
Full Year 2026 Financial Targets Introduced
DENVER–(BUSINESS WIRE)– The ONE Group Hospitality, Inc. (“The ONE Group” or the “Company”) (Nasdaq: STKS) today reported its financial results for the fourth quarter and full year ended December 28, 2025.
Effective January 1, 2025, the Company adopted a new fiscal calendar structure using four 13-week quarters, with a 53rd week added when necessary. The 2025 fiscal year ran from January 1, 2025, to December 28, 2025.
This fiscal calendar change created timing differences that impacted quarterly comparisons: the fourth quarter of 2025 had 91 days versus 92 days in the fourth quarter of 2024. Additionally, the New Year’s Eve holiday shifted from fiscal 2025 to fiscal 2026. The exclusion of New Year’s Eve in the current year impacted total GAAP revenues by approximately 2.5%, representing 37% of the total GAAP revenue decline for the quarter.
Highlights for the fourth quarter 2025 compared to the same quarter in 2024 are as follows:
Total GAAP revenues decreased 6.7% to $207 million from $222 million;
Consolidated comparable sales*decreased 1.8%;
GAAP net loss attributable to The ONE Group Hospitality, Inc. increased to $6 million from a net income of $2 million primarily related to a non-cash loss on impairment of $7 million related to the Grill optimization strategy;
Restaurant Operating Profit**increased by 10 basis points to 19.5% of owned restaurant net revenue, excluding Grill Concepts restaurants closed or to be closed, from 19.4%; and,
Adjusted EBITDA*** attributable to The ONE Group Hospitality, Inc. decreased to $28 million from $31 million, with approximately $3 million of the decrease attributable to the New Year’s Eve holiday shift from fiscal 2025 to fiscal 2026.
Highlights for the full year 2025 compared to the full year 2024 are as follows:
Total GAAP revenues increased 19.7% to $806 million from $673 million;
Consolidated comparable sales*decreased 3.7%;
GAAP net loss attributable to The ONE Group Hospitality, Inc. increased to $92 million from a net loss of $17 million due primarily to an increase in the income tax expenses of $69 million, primarily related to the establishment of a non-cash tax valuation allowance, and non-cash lease termination and exits costs of $7 million coupled with a non-cash impairment of $11 million related to the Grill optimization strategy;
Adjusted Operating Income**** increased 15.2% to $38 million from $33 million; and,
Adjusted EBITDA*** attributable to The ONE Group Hospitality, Inc. increased 16.3% to $89 million, excluding approximately $4 million attributable to two days in fiscal year 2025 versus fiscal year 2024, from $76 million.
“Guests continue to choose our differentiated Vibe Dining concepts when they want memorable experiences. In the fourth quarter, consolidated comparable sales improved by four percentage points sequentially from the third quarter, with every brand contributing. So far in the first quarter, we are delivering positive consolidated comparable sales. These results confirm that our strategy is working, even in a challenging consumer environment,” said Emanuel “Manny” Hilario, President and CEO of The ONE Group.
“Our disciplined cost management initiatives continue to drive results. In the fourth quarter, we expanded our restaurant operating margins, even while facing sales deleveraging. Looking ahead, our operational foundation remains strong, supported by beef supply and pricing secured through September 2026 and significant cost synergies from the Benihana acquisition that we believe we have yet to fully capture,” Hilario continued.
“In 2025, we took decisive action to optimize our portfolio and position the company for sustained long-term growth. We closed six underperforming Grill locations and identified up to five additional units for conversion to our higher-performing Benihana or STK formats through 2026. Our first RA Sushi to STK conversion in Scottsdale, Arizona has exceeded expectations, operating at a run rate of approximately $7 million in annualized sales on an approximate $1 million capital investment. This validates the strength of this repositioning strategy. Additionally, we advanced our asset-light growth strategy by securing development rights for ten Benihana and Benihana Express locations in the San Francisco Bay Area, representing the largest franchise agreement in our Company’s history. We have also secured a commitment for an additional franchised Benihana location and a licensed Benihana Express location in the Florida Keys,” Hilario concluded.
Strategic Portfolio Optimization
Grill Concepts Rationalization:
Closed six underperforming Grill locations in 2025 and one in 2026;
Identified up to five additional Grill units for conversion to Benihana or STK formats through 2026;
Conversion economics: approximately $1.0 to $1.5 million per conversion with a one-year payback; and
Expected outcome: 100% profitable Grill portfolio with enhanced margins.
Capital Efficiency Focus:
Prioritizing asset-light and conversion-driven growth;
Targeting new company-owned openings averaging $1.5 million or less in build-out costs;
Significant reduction in discretionary capital expenditures to strengthen balance sheet; and
Advancing existing pipeline of approximately 12 signed leases with limited new signings.
2025 Restaurant Development
Restaurant
Location
Opening Date
Owned Benihana
San Mateo, California
March 2025
Owned STK
Topanga, California
April 2025
Owned STK (relocation)
Los Angeles, California
May 2025
Franchised Benihana Express
Miami, Florida
June 2025
Owned STK (RA Sushi conversion)
Scottsdale, Arizona
October 2025
Sports Arena Benihana
UBS Arena in Elmont, New York
December 2025
Owned STK
Oak Brook, Illinois
December 2025
2026 Restaurant Development and Pipeline
Quarter-to-date Activity:
January 2026: Opened Company-owned Kona Grill in San Antonio, Texas (relocation)
February 2026: Converted franchised Benihana to owned in Monterey, California
Currently Under Construction (4 locations):
Owned STK in Phoenix, Arizona
Owned STK in New York, New York (relocation of an existing STK restaurant)
Owned Benihana in San Jose, California
Owned Benihana in Seattle, Washington
Asset-Light Expansion Highlights:
Ten-restaurant franchise development agreement for Benihana/Benihana Express in Greater San Francisco Bay Area, California
Accelerates West Coast expansion while maintaining capital discipline
Two-restaurant commitment for a franchised Benihana and a licensed Benihana Express in the Florida Keys
Partnership with experienced operator ensures quality execution
Liquidity
As of December 28, 2025, the Company held $24 million in cash and short-term credit card receivables and had $27 million available under our revolving credit facility, or a total of $51 million in short term liquidity. Under the current conditions, the Company’s credit facility does not have any financial covenants.
2026 Financial Targets
The Company is introducing the following financial targets, reflecting the benefits of portfolio optimization, operational improvements, and continued Benihana integration synergies.
Financial Results and Other Select DataUS$s in millions
Q1 2026 GuidanceMarch 29, 2026
2026 GuidanceDecember 27, 2026
Total GAAP revenues
$217 to $221
$840 to $855
Consolidated comparable sales
0% to 1%
1% to 3%
Managed, license and franchise fee revenues
$3.5 to $4.0
$14 to $15
Total owned operating expenses as a percentage of owned restaurant net revenue
82% to 83%
82% to 83%
Consolidated total G&A, excluding stock-based compensation
$13 to $14
Approx. $53
Consolidated Adjusted EBITDA(1)
$28 to $29
$100 to $110
Consolidated restaurant pre-opening expenses
$1 to $2
$5 to $6
Consolidated effective income tax rate
Approx. 10%
Consolidated total capital expenditures, net of allowances received by landlords
$38 to $42
Consolidated number of new system-wide venues
6 to 10 new venues
Note: As of January 1, 2025, we began reporting financial information on a fiscal quarter basis using four 13-week quarters with the addition of a 53rd week when necessary. Our fourth quarter of 2025 had 91 days. For 2026, our fiscal calendar began on December 29, 2025 and ends on December 27, 2026.
(1) We have not reconciled guidance for Consolidated Adjusted EBITDA to the corresponding GAAP financial measure because we do not provide guidance for the various reconciling items. We are unable to provide guidance for these reconciling items because we cannot determine their probable significance, as certain items are outside of our control and cannot be reasonably predicted since these items could vary significantly from period to period. Accordingly, reconciliations to the corresponding GAAP financial measure are not available without unreasonable effort.
Conference Call and Webcast
Emanuel “Manny” Hilario, President and Chief Executive Officer, and Nicole Thaung, Chief Financial Officer, will host a conference call and webcast today at 8:30 AM Eastern Time.
The conference call can be accessed live over the phone by dialing 412-542-4186. A replay will be available after the call and can be accessed by dialing 412-317-6671; the passcode is 10206228. The replay will be available until Friday, March 27, 2026.
The webcast can be accessed from the Investor Relations tab of The ONE Group’s website at www.togrp.com under “News / Events.”
About The ONE Group
The ONE Group Hospitality, Inc. (Nasdaq: STKS) is an international restaurant company that develops and operates upscale and polished casual, high-energy restaurants and lounges and provides hospitality management services for hotels, casinos and other high-end venues both in the U.S. and internationally. The ONE Group is recognized as one of “America’s Greatest Companies” (Newsweek, 2025), and Benihana is honored as one of ”America’s Best Brands for Value” (Forbes, 2025). The ONE Group’s focus is to be the global leader in Vibe Dining, and its primary restaurant brands and operations are:
STK, a modern twist on the American steakhouse concept with restaurants in major metropolitan cities in the U.S., Europe and the Middle East, featuring premium steaks, seafood and specialty cocktails in an energetic upscale atmosphere.
Benihana, an interactive dining destination with highly skilled chefs preparing food right in front of guests and served in an energetic atmosphere alongside fresh sushi and innovative cocktails. The Company franchises Benihanas in the U.S., Caribbean, Central America, and South America.
Samurai, an interactive dining experience located in sunny Miami, FL, provides a distinctive dining experience where skilled personal chefs masterfully perform the ancient art of teppanyaki right before your eyes.
Kona Grill, a polished casual, bar-centric Grill concept with restaurants in the U.S., featuring American favorites, award-winning sushi, and specialty cocktails in an upscale casual atmosphere.
Salt Water Social is your gateway to the seven seas, featuring an array of signature and unique fresh seafood items, complemented by the highest quality beef dishes and elegant, delicious cocktails.
Benihana Express, a small footprint casual concept showcasing the best of Benihana but without teppanyaki tables or bar.
RA Sushi, a Japanese cuisine concept that offers a fun-filled, bar-forward, upbeat, and vibrant dining atmosphere with restaurants in the U.S. anchored by creative sushi, inventive drinks, and outstanding service.
ONE Hospitality, The ONE Group’s food and beverage hospitality services business develops, manages and operates premier restaurants and turnkey food and beverage services within high-end hotels and casinos currently operating venues in the U.S. and Europe.
Additional information about The ONE Group can be found at www.togrp.com.
Non-GAAP Definitions
We have evolved our definition of non-GAAP financial measures starting in Q4 2025. We use certain non-GAAP measures in analyzing operating performance and believe that the presentation of these measures provides investors and analysts with information that is beneficial to gaining an understanding of the Company’s financial results. Non-GAAP disclosures should not be viewed as a substitute for financial results determined in accordance with GAAP.
We exclude items management does not consider in the evaluation of its ongoing core operating performance from Adjusted EBITDA. Starting in Q4 2025, the Adjusted EBITDA attributable to closed Grill Concepts restaurants is excluded from Adjusted EBITDA. Reconciliations of these non-GAAP measures are included under “Reconciliation of Non-GAAP Measures” in this press release.
*Comparable sales represent total U.S. food and beverage sales at owned and managed units, a non-GAAP financial measure, opened for at least a full 24-months. This measure includes total revenue from our owned and managed locations. The Company monitors sales growth at its established restaurant base in addition to growth that results from restaurant acquisitions and new restaurant openings. Refer to the reconciliation of GAAP revenue to total food and beverage sales at owned and managed units in this press release.
**We define Adjusted EBITDA as net income (loss) before interest expense, provision for income taxes, depreciation and amortization, stock-based compensation, transition and integration expenses, loss on impairment of non-current assets, lease termination and exit expenses, transaction and exit costs, loss on early debt extinguishment, non-cash rent and the Adjusted EBITDA attributable to the closed Grill Concepts restaurants. Adjusted EBITDA has been presented in this press release and is a supplemental measure of financial performance that is not required by, or presented in accordance with, GAAP. Refer to the reconciliation of Net income (loss) to Adjusted EBITDA in this press release.
*** We define Restaurant Operating Profit as owned restaurant net revenue minus owned restaurant cost of sales and owned restaurant operating expenses. Restaurant Operating Profit has been presented in this press release and is a supplemental measure of financial performance that is not required by, or presented in accordance with, GAAP. Refer to the reconciliation of operating income to Restaurant Operating Profit in this press release.
**** We define Adjusted Operating Income as operating income (loss) before transition and integration expenses, loss on impairment of non-current assets, lease termination and exit expenses and transaction and exit costs. Not all the aforementioned items defining Adjusted Operating Income occur in each reporting period but have been included in our definitions of terms based on our historical activity. Adjusted Operating Income has been presented in this press release and is a supplemental measure of financial performance that is not required by, or presented in accordance with, GAAP. Refer to the reconciliation of operating income to Adjusted Operating Income in this press release.
Cautionary Statement on Forward-Looking Statements
This press release includes “forward-looking statements” within the meaning of the “safe harbor” provisions of the United States Private Securities Litigation Reform Act of 1995, including with respect to 2025 results, the impact of the Benihana Inc. acquisition, portfolio optimization, restaurant openings and 2026 financial targets. Forward-looking statements may be identified by the use of words such as “target,” “intend,” “anticipate,” “believe,” “expect,” “estimate,” “plan,” “outlook,” and “project” and other similar expressions that predict or indicate future events or trends or that are not statements of historical matters. A number of factors could cause actual results or outcomes to differ materially from those indicated by such forward-looking statements, including but not limited to: (1) our ability to integrate the new or acquired restaurants into our operations without disruptions to operations; (2) our ability to capture anticipated synergies; (3) our ability to open new restaurants and food and beverage locations in current and additional markets, grow and manage growth profitably, maintain relationships with suppliers and obtain adequate supply of products and retain employees; (4) factors beyond our control that affect the number and timing of new restaurant openings, including weather conditions and factors under the control of landlords, contractors and regulatory and/or licensing authorities; (5) our ability to successfully improve performance and cost, realize the benefits of our marketing efforts and achieve improved results as we focus on developing new management and license deals; (6) changes in applicable laws or regulations; (7) the possibility that The ONE Group may be adversely affected by other economic, business, and/or competitive factors, including economic downturns; (8) the impact of actual and potential changes in immigration policies, including potential labor shortages; (9) the potential impact of the imposition of tariffs, including increases in food prices and inflation and any resulting negative impacts on the macro-economic environment; (10) risks related to our development and franchise partners; (11) risks related to geopolitical events; and (12) other risks and uncertainties indicated from time to time in our filings with the Securities and Exchange Commission, including our Annual Report on Form 10-K filed for the year ended December 31, 2024 and Quarterly Reports on Form 10-Q.
Investors are referred to the most recent reports filed with the Securities and Exchange Commission by The ONE Group Hospitality, Inc. Investors are cautioned not to place undue reliance upon any forward-looking statements, which speak only as of the date made, and we undertake no obligation to update or revise the forward-looking statements, whether as a result of new information, future events or otherwise.
DENVER–(BUSINESS WIRE)– The ONE Group Hospitality, Inc. (“The ONE Group” or the “Company”) (Nasdaq: STKS) today announced that Emanuel “Manny” Hilario, President and Chief Executive Officer, and Nicole Thaung, Chief Financial Officer, will host a conference call and webcast to discuss fourth quarter and fiscal year 2025 financial results on Friday, March 13, 2026, at 8:30 AM ET. A press release containing the fourth quarter and fiscal year 2025 financial results will be issued before market open that same morning.
The conference call can be accessed live over the phone by dialing 412-542-4186. A replay will be available after the call and can be accessed by dialing 412-317-6671; the passcode is 10206228. The replay will be available until Friday, March 27, 2026.
The webcast can be accessed from the Investor Relations tab of The ONE Group’s website at http://www.togrp.com/ under “News / Events”.
About The ONE Group
The ONE Group Hospitality, Inc. (Nasdaq: STKS) is an international restaurant company that develops and operates upscale and polished casual, high-energy restaurants and lounges and provides hospitality management services for hotels, casinos and other high-end venues both in the U.S. and internationally. The ONE Group is recognized as one of “America’s Greatest Companies” (NEWSWEEK, 2025) and Benihana honored as Forbes Best Brands for Value . The ONE Group’s focus is to be the global leader in Vibe Dining, and its primary restaurant brands and operations are:
STK, a modern twist on the American steakhouse concept with restaurants in major metropolitan cities in the U.S., Europe and the Middle East, featuring premium steaks, seafood and specialty cocktails in an energetic upscale atmosphere.
Benihana, an interactive dining destination with highly skilled chefs preparing food right in front of guests and served in an energetic atmosphere alongside fresh sushi and innovative cocktails. The Company franchises Benihanas in the U.S., Caribbean, Central America, and South America.
Samurai, an interactive dining experience located in sunny Miami, FL, provides a distinctive dining experience where skilled personal chefs masterfully perform the ancient art of teppanyaki right before your eyes.
Kona Grill, a polished casual, bar-centric grill concept with restaurants in the U.S., featuring American favorites, award-winning sushi, and specialty cocktails in an upscale casual atmosphere.
Salt Water Social is your gateway to the seven seas, featuring an array of signature and unique fresh seafood items, complemented by the highest quality beef dishes and elegant, delicious cocktails.
Benihana Express, a small footprint casual concept showcasing the best of Benihana but without teppanyaki tables or bar.
RA Sushi, a Japanese cuisine concept that offers a fun-filled, bar-forward, upbeat, and vibrant dining atmosphere with restaurants in the U.S. anchored by creative sushi, inventive drinks, and outstanding service.
ONE Hospitality, The ONE Group’s food and beverage hospitality services business develops, manages and operates premier restaurants and turnkey food and beverage services within high-end hotels and casinos currently operating venues in the U.S. and Europe.
Additional information about The ONE Group can be found at www.togrp.com.
ACCO Brands Corporation is one of the world’s largest designers, marketers and manufacturers of branded academic, consumer and business products. Our widely recognized brands include AT-A-GLANCE®, Esselte®, Five Star®, GBC®, Kensington®, Leitz®, Mead®, PowerA®, Quartet®, Rapid®, Rexel®, Swingline®, Tilibra®, and many others. Our products are sold in more than 100 countries around the world. More information about ACCO Brands, the Home of Great Brands Built by Great People, can be found at www.accobrands.com.
Joe Gomes, CFA, Managing Director, Equity Research Analyst, Generalist , Noble Capital Markets, Inc.
Refer to the full report for the price target, fundamental analysis, and rating.
Overview. Despite continued demand challenges globally and tariff-related disruptions in the U.S., ACCO maintained or grew its market position in most categories, demonstrating the resilience and strength of the brand portfolio. ACCO delivered sales and adjusted EPS in-line with management’s outlook.
4Q25 Results. Net sales were $428.8 million, down 4.3% y-o-y, reflecting soft global demand for certain products, partially offset by growth in gaming accessories. We were at $435 million. Comp sales were down 7.8%. Adjusted EBITDA totaled $68.6 million, or a 16% margin, compared to $73.6 million and 16.4%, respectively, in 4Q24. ACCO reported adjusted EPS of $0.38, flat with the $0.39 reported in 4Q24. We were at $0.38.
Equity Research is available at no cost to Registered users of Channelchek. Not a Member? Click ‘Join’ to join the Channelchek Community. There is no cost to register, and we never collect credit card information.
This Company Sponsored Research is provided by Noble Capital Markets, Inc., a FINRA and S.E.C. registered broker-dealer (B/D).
*Analyst certification and important disclosures included in the full report. NOTE: investment decisions should not be based upon the content of this research summary. Proper due diligence is required before making any investment decision.
Cintas Corporation (Nasdaq: CTAS) announced an agreement to acquire UniFirst Corporation (NYSE: UNF) in a transaction valued at approximately $5.5 billion, marking one of the largest consolidations in the North American uniform and workplace services industry.
The deal brings together two family-founded companies with long histories serving businesses with uniform rental programs, facility services, and workplace safety products. For investors, the transaction highlights a broader trend toward scale and operational efficiency in a fragmented but highly competitive service sector.
Under the terms of the agreement, UniFirst shareholders will receive $155 in cash and 0.7720 shares of Cintas stock for each share held. Based on Cintas’ closing price of $200.77 on March 9, 2026, the consideration represents a combined value of $310 per share for UniFirst. The transaction carries an implied enterprise value of roughly $5.5 billion.
Once combined, the companies will serve approximately 1.5 million business customers across North America, providing uniforms, facility services products, and safety programs to a wide range of industries.
The uniform rental and facility services market has grown increasingly competitive as companies seek larger service footprints and more efficient logistics networks. The combination of Cintas and UniFirst is expected to expand route density, improve processing capacity, and enhance supply chain efficiency.
Cintas management said integrating UniFirst’s service infrastructure and route networks could strengthen the company’s ability to compete with both traditional uniform service providers and alternative procurement models, including direct-purchase programs and hybrid service models.
Operational integration also extends to technology investments, including systems that support route management, inventory tracking, and service delivery optimization.
For investors, these types of scale-driven efficiencies are often central to consolidation strategies in service-heavy industries where route density and logistics can significantly influence operating margins.
Cintas expects to generate approximately $375 million in operating cost synergies within four years following the closing of the transaction. These savings are projected to come from material sourcing efficiencies, production and service cost improvements, and reductions in selling, general, and administrative expenses.
The company also expects the transaction to become accretive to earnings per share by the end of the second full fiscal year after closing.
At closing, Cintas anticipates maintaining a net leverage ratio of roughly 1.5x debt to EBITDA, reflecting a balance between acquisition financing and balance sheet flexibility.
The cash portion of the purchase price will be funded through a combination of cash on hand, committed credit lines, and other financing sources. Morgan Stanley Senior Funding, KeyBank, and Wells Fargo have provided fully committed bridge financing for the transaction.
The boards of directors of both companies have unanimously approved the transaction. Entities affiliated with the Croatti family—founders of UniFirst—control roughly two-thirds of the company’s voting power and have entered into a voting support agreement in favor of the deal.
Members of the Croatti family also plan to retain an ownership position in the combined company, aligning them with the long-term performance of the merged entity.
The transaction is expected to close in the second half of 2026, subject to regulatory approvals and approval from UniFirst shareholders.
Cintas recently reported preliminary fiscal third-quarter revenue of $2.84 billion for the period ending February 28, 2026, representing an 8.9% year-over-year increase and 8.2% organic growth.
UniFirst is scheduled to report its fiscal second-quarter 2026 results on April 1.
If completed as expected, the acquisition would further solidify Cintas’ position as one of the largest providers of uniform rental and facility services in North America, while continuing a broader trend of consolidation across business services sectors where scale, logistics, and customer relationships play critical roles.
Michael Kupinski, Director of Research, Equity Research Analyst, Digital, Media & Technology , Noble Capital Markets, Inc.
Jacob Mutchler, Research Associate, Noble Capital Markets, Inc.
Refer to the full report for the price target, fundamental analysis, and rating.
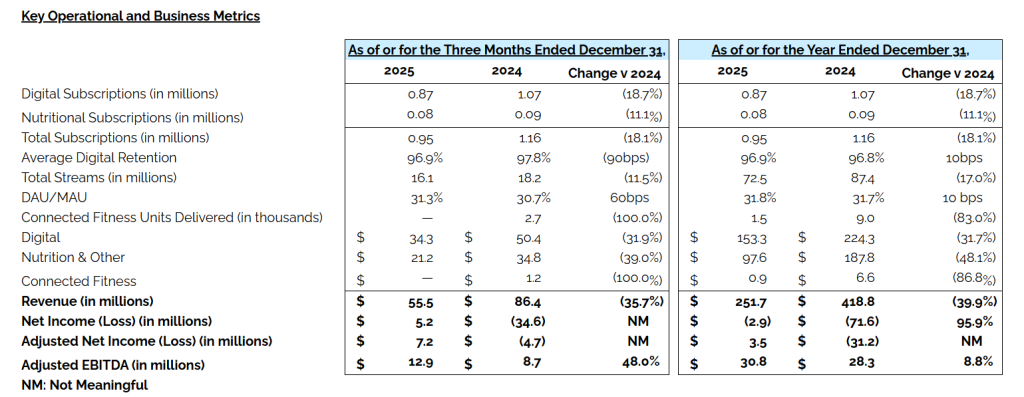
Q4 results exceeded expectations. Q4 revenue of $55.5 million and adjusted EBITDA of $12.9 million, surpassed our estimates of $53.0 million and $5.0 million, respectively. Although revenue declined 7.3% sequentially and 35.7% year over year due to the continued wind-down of the legacy MLM model, operating income reached $8.2 million, marking the second consecutive profitable quarter and a $41.1 million year-over-year improvement.
Lean cost structure continues to drive strong operating leverage and profitability. Consolidated gross margin expanded 400 basis points year over year to 74.5%, supported by improved operational efficiency and lower digital amortization costs. Total operating expenses declined 64.6% year over year to $33.2 million as restructuring initiatives and the elimination of MLM-related costs materially reduced SG&A. As a result, the company generated $5.2 million in net income and its ninth consecutive quarter of positive adjusted EBITDA.
Equity Research is available at no cost to Registered users of Channelchek. Not a Member? Click ‘Join’ to join the Channelchek Community. There is no cost to register, and we never collect credit card information.
This Company Sponsored Research is provided by Noble Capital Markets, Inc., a FINRA and S.E.C. registered broker-dealer (B/D).
*Analyst certification and important disclosures included in the full report. NOTE: investment decisions should not be based upon the content of this research summary. Proper due diligence is required before making any investment decision.
Net Income Reported for Second Consecutive Quarter Net Income and Adjusted EBITDA Better Than Guidance Revenues Above Mid-Point of Guidance Ninth Consecutive Quarter of Positive Adjusted EBITDA Full Year Operating Income Reported for First Time Since Going Public in 2021 Positive Free Cash Flow For the Full Year
EL SEGUNDO, Calif.–(BUSINESS WIRE)– The Beachbody Company, Inc. (NASDAQ: BODi) (“BODi” or the “Company”), a leading fitness and nutrition company, today announced financial results for its fourth quarter ended December 31, 2025.
“Over the past two years, we have taken bold steps to completely transform our company and our 4th quarter results are indicative of our successful efforts,” said Carl Daikleler, co-founder and BODi’s Chief Executive Officer. “Looking ahead, our strengthened financial position along with our innovation pipeline, launching in early 2026, will leverage the brand equity we have built in P90X, Insanity, and Shakeology across new channels and price points which fundamentally broadens our addressable market while maintaining the operational discipline that delivered this turnaround.”
“This was the second consecutive quarter of net income and the ninth consecutive quarter of positive adjusted EBITDA. In addition, the company generated positive free cash flow for the year and our cash position is strong with over $39 million of cash on the balance sheet,” said Mark Goldston, BODi’s Executive Chairman. “We’ve built the operational framework and financial flexibility to capitalize on a massive market opportunity that represents the next phase of our growth strategy.”
Fourth Quarter 2025 Results
Total revenue was $55.5 million compared to $86.4 million in the prior year period.
Digital revenue was $34.3 million compared to $50.4 million in the prior year period and digital subscriptions totaled 0.87 million in the fourth quarter.
Nutrition and Other revenue was $21.2 million compared to $34.8 million in the prior year period and nutritional subscriptions totaled 0.08 million in the fourth quarter.
Connected Fitness revenue was $0.0 million compared to $1.2 million in the prior year period as we ceased the sale of bike inventory in the first quarter of 2025.
Gross margin was 74.5% compared to 70.5% in the prior year period.
Total operating expenses were $33.2 million compared to $93.8 million in the prior year period, which included a $20.0 million impairment of goodwill.
Operating income improved by $41.1 million to $8.2 million, the Company’s second consecutive quarter of operating income, compared to an operating loss of $32.9 million in the prior year period. The current period included a $2.2 million benefit from the reversal of a bonus accrual that was recorded in the third quarter and the Company did not record a bonus accrual in the current period.
Net income was $5.2 million compared to a net loss of $34.6 million in the prior year period, which included a $20.0 million impairment of goodwill.
Adjusted EBITDA 1 was $12.9 million compared to $8.7 million in the prior year period.
Adjusted net income (loss) 1 was income of $7.2 million compared to a loss of $4.7 million in the prior year period.
Full Year 2025 Results
Total revenue was $251.7 million compared to $418.8 million in the prior year.
Digital revenue was $153.3 million compared to $224.3 million in the prior year.
Nutrition and Other revenue was $97.6 million compared to $187.8 million in the prior year.
Connected Fitness revenue was $0.9 million compared to $6.6 million in the prior year as we ceased the sale of bike inventory in the first quarter of 2025.
Gross margin was 73.0% compared to 68.6% in the prior year period.
Total operating expenses were $178.3 million compared to $353.6 million in the prior year, which included a $20.0 million impairment of goodwill.
Operating income increased by $71.7 million to $5.5 million, the Company’s first full year operating income since going public, compared to an operating loss of $66.2 million in the prior year.
Net loss was $2.9 million compared to a net loss of $71.6 million in the prior year, which included a $20.0 million impairment of goodwill.
Adjusted EBITDA 1 was $30.8 million compared to $28.3 million in the prior year.
Adjusted net income 1 was $3.5 million, the Company’s first full year adjusted net income since going public, compared to a loss of $31.2 million in the prior year.
Cash provided by operating activities for the year ended December 31, 2025 was $21.8 million compared to cash provided by operating activities of $2.6 million in the prior year, and cash used in investing activities was $4.4 million compared to cash provided by investing activities of $1.1 million in the prior year. Free cash flow 1 was $17.4 million compared to $(2.0) million in the prior year.
1Definitions of (1) Adjusted EBITDA, (2) adjusted net income (loss), (3) free cash flow and (4) net cash position, and reconciliations to the comparable GAAP metrics, are at the end of this release.
Key Operational and Business Metrics
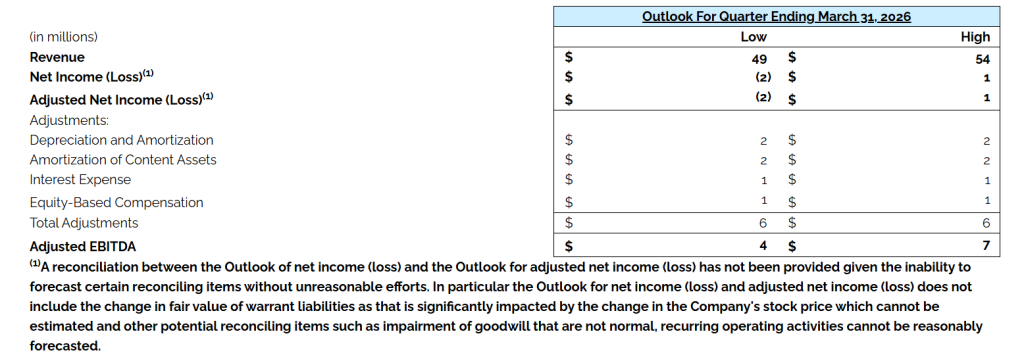
Outlookfor The First Quarter of 2026
Conference Call and Webcast Information
BODi will host a conference call at 5:00pm ET on Tuesday, March 10, 2026, to discuss its financial results and matters other than past results, such as guidance. To participate in the live call, please dial (833) 470-1428 (U.S. & Canada) and provide the conference identification number: 871093. The conference call will also be available to interested parties through a live webcast at https://investors.thebeachbodycompany.com/.
A replay of the call will be available until March 17, 2026, by dialing (866) 813-9403 (U.S. & Canada). The replay passcode is 989620.
After the conference call, a webcast replay will remain available on the investor relations section of the Company’s website for one year.
About BODi and The Beachbody Company, Inc.
BODi, formerly known as Beachbody, has been a pioneer in structured, step-by-step home fitness and nutrition programs for nearly three decades with iconic products such as P90X, Insanity, and 21-Day Fix, plus the original premium superfood nutrition supplement, Shakeology. Since its inception, BODi has helped more than 30 million people reach life-changing results. Today, BODi continues to evolve with a simple mission: help people achieve their goals and lead healthier, more fulfilling lives, especially busy, time-strapped people who want to fit healthy habits into everyday life with proven solutions. The BODi community empowers millions of people to stay motivated and accountable, supporting healthy weight management, improved metabolic function, increased mental, and physical well-being, better sleep, as well as evidence-based habits that enhance health span and longevity. For more information, please visit TheBeachBodyCompany.com.
Safe Harbor Statement
This press release of The Beachbody Company, Inc. (“we,” “us,” “our,” and similar terms) contains “forward-looking” statements within the meaning of Section 27A of the Securities Act of 1933, as amended, and Section 21E of the Securities Exchange Act of 1934, as amended, which are statements other than statements of historical facts and statements in future tense. These statements include but are not limited to, statements regarding our future performance and our market opportunity, including expected financial results for the first quarter, our business strategy, our plans, and our objectives and future operations.
Forward-looking statements are based upon various estimates and assumptions, as well as information known to us as of the date hereof, and are subject to risks and uncertainties. Accordingly, actual results could differ materially due to a variety of factors, including: our ability to effectively compete in the fitness and nutrition industries; our ability to successfully acquire and integrate new operations; our reliance on a few key products; market conditions and global and economic factors beyond our control; intense competition and competitive pressures from other companies worldwide in the industries in which we operate; and litigation and the ability to adequately protect our intellectual property rights. You can identify these statements by the use of terminology such as “believe”, “plans”, “expect”, “will”, “should,” “could”, “estimate”, “anticipate” or similar forward-looking terms. You should not rely on these forward-looking statements as they involve risks and uncertainties that may cause actual results to vary materially from the forward-looking statements. For more information regarding the risks and uncertainties that could cause actual results to differ materially from those expressed or implied in these forward-looking statements, as well as risks relating to our business in general, we refer you to the “Risk Factors” section of our Securities and Exchange Commission (SEC) filings, including those risks and uncertainties included in the Form 10-K filed with the SEC on March 10, 2026 and any subsequent Quarterly Reports on Form 10-Q or Current Reports on Form 8-K, which are available on the Investor Relations page of our website at https://investors.thebeachbodycompany.com and on the SEC website at www.sec.gov.
All forward-looking statements contained herein are based on information available to us as of the date hereof and you should not rely upon forward-looking statements as predictions of future events. The events and circumstances reflected in the forward-looking statements may not be achieved or occur. Although we believe that the expectations reflected in the forward-looking statements are reasonable, we cannot guarantee future results, performance, or achievements. We undertake no obligation to update any of these forward-looking statements for any reason after the date of this press release or to conform these statements to actual results or revised expectations, except as required by law. Undue reliance should not be placed on forward-looking statements.
Airline stocks moved sharply lower Monday as oil prices surged above $100 per barrel, raising concerns about rising jet fuel costs and pressure on industry profitability.
Shares of major U.S. carriers fell after crude oil briefly climbed above $110 per barrel, the highest level since 2022. The move followed escalating geopolitical tensions in the Middle East that disrupted shipping traffic through the Strait of Hormuz, one of the world’s most critical oil transit routes.
Delta Air Lines, American Airlines, and United Airlines all declined in early trading before trimming some losses. Domestic-focused carriers including Southwest Airlines, JetBlue Airways, and Alaska Air Group also traded lower as investors weighed the financial impact of higher fuel prices.
Fuel represents one of the largest operating expenses for airlines, typically accounting for roughly one-fifth to one-quarter of total costs. When oil prices climb quickly, airlines often face immediate margin pressure, particularly if ticket prices cannot be adjusted quickly enough to offset the increase.
Jet fuel prices have climbed significantly in recent weeks, rising by as much as $1.75 per gallon. At those levels, the largest U.S. airlines could see quarterly fuel expenses increase by roughly $1.5 billion each if elevated prices persist. Across the three largest carriers, the additional costs could approach $5 billion.
Higher fuel costs often translate into higher ticket prices as airlines attempt to protect margins. Carriers may adjust fares, reduce promotional pricing, or alter route capacity in response to sustained increases in fuel expenses.
The current price spike also highlights the industry’s increased exposure to energy market volatility. Many airlines previously used fuel hedging strategies to limit the impact of oil price swings. Over the past decade, however, most carriers have moved away from large-scale hedging programs after experiencing losses during periods of falling oil prices. Southwest Airlines, long known for its fuel hedging approach, ended its program in 2025.
In addition to rising energy costs, airlines are facing operational disruptions tied to the conflict. Thousands of flights have been grounded globally as airlines reroute aircraft away from affected airspace, leaving travelers stranded and adding complexity to airline scheduling.
European airline stocks also declined amid the developments. Lufthansa shares dropped roughly 5%, while International Consolidated Airlines Group, the parent company of British Airways and Aer Lingus, fell about 3%. Air France-KLM also moved lower during the session.
The latest selloff adds to a difficult year for airline equities. Shares of Delta, American, and United are down roughly 20% to 30% year to date. Domestic carriers such as JetBlue, Southwest, and Alaska Air have also experienced steep declines in recent weeks.
For investors, the move underscores how closely airline performance remains tied to global energy markets. Even with steady travel demand, sudden spikes in oil prices can quickly reshape the profitability outlook for carriers.
If crude oil remains elevated, airlines may continue adjusting pricing strategies and operating plans as they navigate the industry’s most volatile cost variable.