TROY, Mich., April 27, 2023 /PRNewswire/ — Kelly, a leading specialty talent solutions provider, will release its first-quarter earnings before the market opens on Thursday, May 11, 2023. In conjunction with its first-quarter earnings release, Kelly will publish a financial presentation on the Investor Relations page of its public website and will host a conference call at 9 a.m. ET.
The call may be accessed in one of the following ways:
Via the Telephone (877) 692-8955 (toll-free) or (234) 720-6979 (caller-paid) Enter access code 5728672 After the prompt, please enter ”#”
A recording of the conference call will be available after 2:30 p.m. ET on May 11, 2023, at (866) 207-1041 (toll-free) and (402) 970-0847 (caller-paid). The access code is 4789007#. The recording will also be available at kellyservices.com during this period.
About Kelly
Kelly Services, Inc. (Nasdaq: KELYA, KELYB) connects talented people to companies in need of their skills in areas including Science, Engineering, Education, Office, Contact Center, Light Industrial, and more. We’re always thinking about what’s next in the evolving world of work, and we help people ditch the script on old ways of thinking and embrace the value of all workstyles in the workplace. We directly employ more than 300,000 people around the world, and we connect thousands more with work through our global network of talent suppliers and partners in our outsourcing and consulting practice. Revenue in 2022 was $5.0 billion. Visit kellyservices.com and let us help with what’s next for you.
CoreCivic is a diversified, government-solutions company with the scale and experience needed to solve tough government challenges in flexible, cost-effective ways. We provide a broad range of solutions to government partners that serve the public good through high-quality corrections and detention management, a network of residential and non-residential alternatives to incarceration to help address America’s recidivism crisis, and government real estate solutions. We are the nation’s largest owner of partnership correctional, detention and residential reentry facilities, and believe we are the largest private owner of real estate used by government agencies in the United States. We have been a flexible and dependable partner for government for nearly 40 years. Our employees are driven by a deep sense of service, high standards of professionalism and a responsibility to help government better the public good. Learn more at www.corecivic.com.
Joe Gomes, Managing Director, Equity Research Analyst, Generalist , Noble Capital Markets, Inc.
Joshua Zoepfel, Research Associate, Noble Capital Markets, Inc.
Refer to the full report for the price target, fundamental analysis, and rating.
Contract Loss. Yesterday, CoreCivic announced the State of Oklahoma will not renew the lease agreement for the company-owned, 2,400-bed North Fork Correctional Facility (NFCF) upon the lease expiration on June 30, 2023. According to the release, the State was facing staffing challenges at the NFCF that limited the facility’s utilization and were exacerbated by the difficult employment market since the beginning of the COVID-19 pandemic. The lease generated $12.2 million of revenue in 2022.
Competitive Pressure. CoreCivic also noted that since commencing the lease of the NFCF in 2016, other privately owned correctional capacity became available to the state of Oklahoma and impacted the competitive landscape for renewal of the Company’s lease agreement. We would note The GEO Group just announced a new lease contract with Oklahoma for its previously idle Great Plains facility. Great Plains is about 50 miles from Oklahoma City compared to about 130 miles for NFCF, which may make staffing less of an issue.
Equity Research is available at no cost to Registered users of Channelchek. Not a Member? Click ‘Join’ to join the Channelchek Community. There is no cost to register, and we never collect credit card information.
This Company Sponsored Research is provided by Noble Capital Markets, Inc., a FINRA and S.E.C. registered broker-dealer (B/D).
*Analyst certification and important disclosures included in the full report. NOTE: investment decisions should not be based upon the content of this research summary. Proper due diligence is required before making any investment decision.
BRENTWOOD, Tenn., April 25, 2023 (GLOBE NEWSWIRE) — CoreCivic, Inc. (NYSE: CXW) (CoreCivic or the Company) announced today it received notice from the Oklahoma Department of Corrections (ODC) of its intent to terminate the lease agreement for the company-owned, 2,400-bed North Fork Correctional Facility (NFCF) upon the lease expiration on June 30, 2023.
The ODC was facing the impact of staffing challenges at the NFCF that limited the facility’s utilization and were exacerbated by the difficult employment market since the beginning of the COVID-19 pandemic. The Company was also aware that since commencing the lease of the NFCF in 2016, other privately owned correctional capacity became available to the state of Oklahoma and impacted the competitive landscape for renewal of the Company’s lease agreement. Rental revenue generated from the ODC at the NFCF for year ended December 31, 2022, was $12.2 million and is reported in the CoreCivic Properties business segment.
The Company is also actively renegotiating the terms of its contract with the state of Oklahoma at the company owned-and-operated 1,670-bed Davis Correctional Facility, which is also set to expire on June 30, 2023. The terms for a contract extension were being negotiated along with the lease agreement for the NFCF, and the Company will only renew the contract or enter into a similar lease agreement with the state of Oklahoma if the arrangement produces a satisfactory return on a stand-alone basis. The Company can provide no assurance that it will be successful in entering into an agreement with the state of Oklahoma for the continued use of the Davis Correctional Facility.
About CoreCivic
CoreCivic is a diversified, government-solutions company with the scale and experience needed to solve tough government challenges in flexible, cost-effective ways. CoreCivic provides a broad range of solutions to government partners that serve the public good through high-quality corrections and detention management, a network of residential and non-residential alternatives to incarceration to help address America’s recidivism crisis, and government real estate solutions. CoreCivic is the nation’s largest owner of partnership correctional, detention and residential reentry facilities, and one of the largest prison operators in the United States. CoreCivic has been a flexible and dependable partner for government for 40 years. CoreCivic’s employees are driven by a deep sense of service, high standards of professionalism and a responsibility to help government better the public good. Learn more at www.corecivic.com.
Forward-Looking Statements
This press release contains statements as to CoreCivic’s beliefs and expectations of the outcome of future events that are “forward-looking” statements within the meaning of Section 21E of the Securities Exchange Act of 1934, as amended, and the Private Securities Litigation Reform Act of 1995, as amended. These forward-looking statements are subject to risks and uncertainties that could cause actual results to differ materially from the statements made. These include, but are not limited to, the impact on the Company’s financial guidance resulting from the non-renewal of the lease agreement for the North Fork Correctional Facility and the probability of, and potential returns on, the renewal of the contract to manage or lease the Company’s Davis Correctional Facility. The Company expects to update its financial guidance in connection with is quarterly earnings announcement currently scheduled for May 3, 2023.
CoreCivic takes no responsibility for updating the information contained in this press release following the date hereof to reflect events or circumstances occurring after the date hereof or the occurrence of unanticipated events or for any changes or modifications made to this press release or the information contained herein by any third-parties, including, but not limited to, any wire or internet services.
BRENTWOOD, Tenn., April 20, 2023 (GLOBE NEWSWIRE) — CoreCivic, Inc. (NYSE: CXW) (the Company) announced today that it will release its 2023 first quarter financial results after the market closes on Wednesday, May 3, 2023. A live broadcast of CoreCivic’s conference call will begin at 10:00 a.m. central time (11:00 a.m. eastern time) on Thursday, May 4, 2023.
To participate via telephone and join the call live, please register in advance here https://register.vevent.com/register/BI6394fffe952b47d497a2735e53d08f32. Upon registration, telephone participants will receive a confirmation email detailing how to join the conference call, including the dial-in number and a unique passcode.
Participants may access the audio-only webcast of the conference call from the Company’s website at www.corecivic.com under the “Events & Presentations” section of the “Investors” page. A replay of the webcast will be available for seven days.
About CoreCivic
CoreCivic is a diversified, government-solutions company with the scale and experience needed to solve tough government challenges in flexible, cost-effective ways. We provide a broad range of solutions to government partners that serve the public good through high-quality corrections and detention management, a network of residential and non-residential alternatives to incarceration to help address America’s recidivism crisis, and government real estate solutions. We are the nation’s largest owner of partnership correctional, detention and residential reentry facilities, and believe we are the largest private owner of real estate used by government agencies in the United States. We have been a flexible and dependable partner for government for 40 years. Our employees are driven by a deep sense of service, high standards of professionalism and a responsibility to help government better the public good. Learn more at www.corecivic.com.
Company Has Launched New ‘Lived Experience’ Reentry Programs in Past Year
BRENTWOOD, Tenn., April 17, 2023 (GLOBE NEWSWIRE) — CoreCivic, Inc. (NYSE: CXW) (the Company) today released its 2022 Environmental, Social and Governance (ESG) report. The Company’s fifth annual report illustrates CoreCivic’s longstanding commitment to operating safely, ethically and transparently while making a positive impact on the communities it serves together with government partners.
“CoreCivic’s durability over the last 40 years reveals our character, and that shows in our progress toward our ESG goals,” said Damon Hininger, president and CEO, CoreCivic. “I’m proud of the way our first-class staff have continually innovated over the years, and especially in 2022, to serve our government partners dependably, compassionately and with excellence.”
The 2022 report details CoreCivic’s commitments and progress toward goals in safe and secure operations; reentry services; innovative solutions delivery; health services; talent attraction; diversity, equity and inclusion (DE&I); and more.
The Company’s approach to reentry services has grown to include several new programs and others in the pipeline that involve residents learning from the “lived experience” of others who have been incarcerated. CoreCivic staff and leaders are rising to meet the threat posed by dangerous contraband such as opioids. The Company has invested in mental health resources to help keep residents safe and delivered human rights training to 97 percent of continuing employees. By diversifying its supply chain, CoreCivic has created more opportunities than ever for women-and minority-owned businesses to partner with the Company. Wages were also increased for nearly all facility staff not already covered by the wage determination process in federal contracts.
CoreCivic also realigned its internal structure in 2022, combining real estate operations with community corrections operations and naming Executive Vice President Lucibeth Mayberry as Chief Innovation Officer.
Mayberry’s team is already making positive impacts on the wellbeing of residents and staff. For example, thanks to the innovation team, CoreCivic offered alternative housing options for staff to combat the national housing shortage in the U.S. The team helped create a normalization process for easing residents out of a correctional environment by transitioning to more home-like surroundings. And it launched a collaboration with government partners to provide free tablets to residents to promote easier contact with family and loved ones, an essential component of successful reentry.
GI Jobs has recognized CoreCivic as a Military Friendly Employer for the 12th consecutive year, conferring Gold Status on the Company. CoreCivic also received a 30 percent year-over-year increase in employment applications. And it connected more than 600 community volunteers with facility residents and staff to help facilitate successful reentry through partnerships like the Frederick Douglass Project for Justice, the Maverick City Music Initiative and second chance hiring firm Cornbread Hustle.
The Company also advocated for recidivism-reducing policies in nine states, including a successful South Carolina state tax credit for hiring formerly incarcerated individuals. Since launching this public policy initiative in 2017, CoreCivic has sent 2,883 letters to federal and state officials in support of 113 reentry-friendly bills with 20 pieces of legislation signed into law.
“There’s a lot to be proud of in the work CoreCivic did in 2022 and over the last 40 years,” Hininger said. “We’ve succeeded, and expect to keep succeeding, because we’re willing to learn from each other, from our residents, and from the agencies, groups, and institutions who serve as our partners.”
About CoreCivic CoreCivic is a diversified, government-solutions company with the scale and experience needed to solve tough government challenges in flexible, cost-effective ways. We provide a broad range of solutions to government partners that serve the public good through high-quality corrections and detention management, a network of residential and non-residential alternatives to incarceration to help address America’s recidivism crisis, and government real estate solutions. We are the nation’s largest owner of partnership correctional, detention and residential reentry facilities, and believe we are the largest private owner of real estate used by U.S. government agencies. We have been a flexible and dependable partner for government for more than 40 years. Our employees are driven by a deep sense of service, high standards or professionalism and a responsibility to help government better the public good. Learn more at www.corecivic.com.
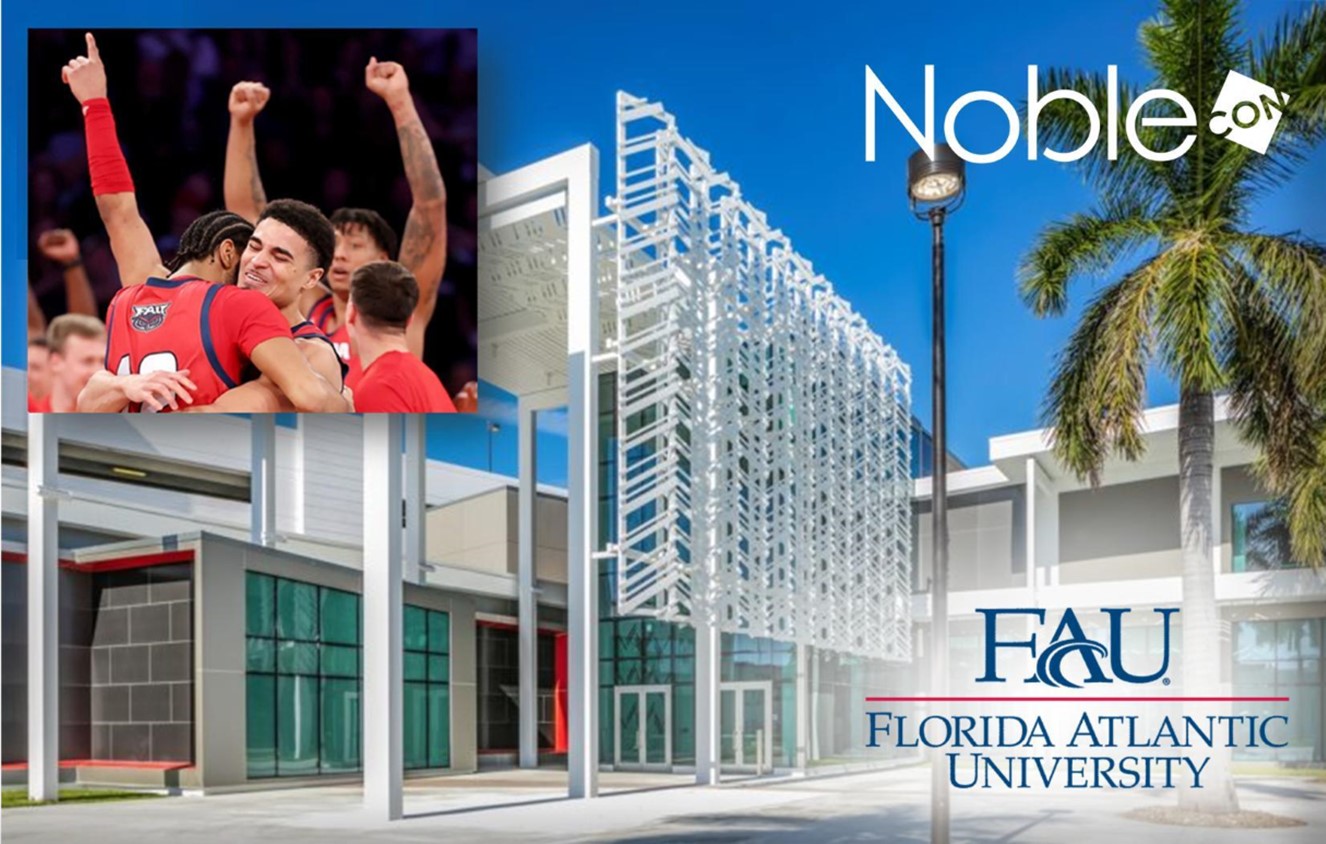
Pictured: The FAU Owls celebrating their trip to the Final Four | The College of Business, Executive Education at Florida Atlantic University
When Noble Capital Markets (Noble) released the December dates for its 19th Annual Investor Conference to be held at Florida Atlantic University, many had the question, “FAU, who?” Well, that’s all changed, big time. The unlikely trek of the FAU Owls to the NCAA men’s basketball Final Four has just about everyone talking. NBA icon Magic Johnson tweeted “When the 64 teams were announced, nobody could have picked Florida Atlantic to go to the Final Four. I think this has been the most unbelievable NCAA Tournament I’ve ever seen.” Former Miami Heat star Dwayne Wade told ESPN, “No one believed in them… they’re playing with so much toughness, so much focus, so much confidence.” Even their heartbreaking loss to San Diego State, by one point at the buzzer, has not stopped the accolades. And the team remains proud of their accomplishments on and off the court. FAU guard Nick Boyd told reporters, “I’m happy for our team. I mean, we put FAU on the map. That’s most important to me.”
While that map of awareness certainly has been broadened by the Owls Final Four run, FAU is far from unknown, at least in Florida. Since opening its doors in 1964, enrollment has steadily grown, now with more than 30,000 undergraduate and graduate students (and more that 184,000 alumni) across six campuses, with its main campus in the heart of Boca Raton, FL. FAU has nationally ranked programs in business, engineering, computer science, nursing, and online education. It is ranked as a top university by U.S. News and World Report. It’s number one in Florida for ethnic diversity. FAU is home to the FAU Stiles-Nicholson Brain Institute on the Jupiter campus, a hub of neuroscience activity. And, it has partnered with the world renowned Max Planck Florida Institute for Neuroscience on the FAU High School – Jupiter Campus, the FAU Max Planck Honors Program, the Integrative Biology-Neuroscience program, and the International Max Planck Research School for Synapses & Circuits to offer high school, undergraduate and graduate students transformational experiences not found anywhere else in the world.
The accomplishments of Florida Atlantic are nothing new to Noble. They have worked with the university for more than a decade and were instrumental in the development of the Equity Research Analyst program. Noble has employed several FAU graduates and sponsored enrolled students through intern programs. It was always the goal of Noble to hold its annual investor conference at FAU, but until recently it was logistically impossible. That’s where the College of Business, Executive Education, newly christened, 52,000 square foot complex comes in. It propels NobleCon to the most technically superior conference experience on the circuit. “World Class” is an understatement, particularly when compared to traditional hotel-based conferences. Each presentation room is equipped with multi-screen viewing options, complete soundproofing, full recording, and worldwide webcasting capabilities, even memory foam seating. Add to that the university’s centralized South Florida location is right next to the Boca Raton Airport and less than a mile from Interstate 95. The complex’s 800 (free) covered parking spots complete the picture.
The presentation rooms at the College of Business, Executive Education at Florida Atlantic University
Because of Channelchek’s affiliation with Noble, we’ll be updating guests on all developments leading up to NobleCon19, December 3-5, including keynotes, participating companies, sponsors, and entertainment. Anyone who is registered for Channelchek can attend. So, while there may be many more questions to be answered about NobleCon, we don’t think that “FAU, who?” will be one of them. The Owls have established a new definition for FAU: Fantastic, Awesome, Unbelievable. Congratulations on your remarkable run!
STAMFORD, Conn.–(BUSINESS WIRE)– Information Services Group (ISG) (Nasdaq: III), a leading global technology research and advisory firm, said today it will release its first-quarter financial results on Monday, May 8, 2023, at approximately 4:15 p.m., U.S. Eastern Time.
The firm will host a conference call with investors and industry analysts at 9 a.m., U.S. Eastern Time, the following day, Tuesday, May 9. Dial-in details are as follows:
The dial-in number for U.S. participants is +1 833-470-1428.
International participants should call +1 404-975-4839.
The security code to access the call is 417295.
Participants are requested to dial in at least five minutes before the scheduled start time.
A recording of the conference call will be accessible on ISG’s website (www.isg-one.com) for approximately four weeks following the call.
About ISG
ISG (Information Services Group) (Nasdaq: III) is a leading global technology research and advisory firm. A trusted business partner to more than 900 clients, including more than 75 of the world’s top 100 enterprises, ISG is committed to helping corporations, public sector organizations, and service and technology providers achieve operational excellence and faster growth. The firm specializes in digital transformation services, including automation, cloud and data analytics; sourcing advisory; managed governance and risk services; network carrier services; strategy and operations design; change management; market intelligence and technology research and analysis. Founded in 2006, and based in Stamford, Conn., ISG employs more than 1,600 digital-ready professionals operating in more than 20 countries—a global team known for its innovative thinking, market influence, deep industry and technology expertise, and world-class research and analytical capabilities based on the industry’s most comprehensive marketplace data. For more information, visit www.isg-one.com.
Kelly (Nasdaq: KELYA, KELYB) connects talented people to companies in need of their skills in areas including Science, Engineering, Education, Office, Contact Center, Light Industrial, and more. We’re always thinking about what’s next in the evolving world of work, and we help people ditch the script on old ways of thinking and embrace the value of all workstyles in the workplace. We directly employ nearly 350,000 people around the world and connect thousands more with work through our global network of talent suppliers and partners in our outsourcing and consulting practice. Revenue in 2021 was $4.9 billion. Visit kellyservices.com and let us help with what’s next for you.
Joe Gomes, Managing Director – Generalist Analyst, Noble Capital Markets, Inc.
Joshua Zoepfel, Research Associate, Noble Capital Markets, Inc.
Refer to the full report for the price target, fundamental analysis, and rating.
Expanded Product Offering. Yesterday,Kelly became the first staffing provider to deploy digital workers in addition to human workers. The Company announced the launch of Kelly Fusion Digital Workers, the first product in the Kelly Fusion suite of solutions that automate routine tasks and allow employees to focus on more meaningful work. Offered as a managed service solution, Kelly Fusion is expected to generate incrementally higher gross profit rates than the traditional staffing services business. Notably, Kelly already has already secured its first client win.
Kelly Fusion. Kelly Fusion Digital Workers are powered by the latest automation software and custom-built for Kelly clients to complete repetitive tasks. They can reliably manage data entry tasks and new-hire processes such as background screenings and onboarding procedures. Kelly Fusion Digital Workers ensure work is completed efficiently, increase compliance, reduce risk, save money, eliminate mundane work, and improve the overall employee experience.
Equity Research is available at no cost to Registered users of Channelchek. Not a Member? Click ‘Join’ to join the Channelchek Community. There is no cost to register, and we never collect credit card information.
This Company Sponsored Research is provided by Noble Capital Markets, Inc., a FINRA and S.E.C. registered broker-dealer (B/D).
*Analyst certification and important disclosures included in the full report. NOTE: investment decisions should not be based upon the content of this research summary. Proper due diligence is required before making any investment decision.
Noble Capital Markets Annual Investor Conference – NobleCon – to be held at Florida Atlantic University December 3-5
Boca Raton, FL, March 1, 2023 (GLOBE NEWSWIRE) — In a joint statement, Noble Capital Markets, Inc. (“Noble”) and Florida Atlantic University announced today that NobleCon19 – Noble’s 19th Annual Small Cap Investor Conference – will be held at the University’s College of Business Executive Education facility, Dec. 3-5, 2023, in Boca Raton, Florida. The 52,000 square foot, state-of-the-art facility was opened August 2020.
Noble has worked with the University for over a decade and was instrumental in the development of their Financial Analyst Program, and Noble’s Intern Program has generated great assets with graduates from the University. “We are extremely proud of our long-standing relationship with Florida Atlantic University,” said Nico Pronk, Noble’s President & CEO. “This new collaboration certainly elevates it to a whole new level.”
Vegar Wiik, Executive Director of the College of Business, Executive Education agrees, stating “Our vision for the College and this magnificent structure is to effectively integrate our curriculum with established businesses. Daniel Gropper, dean of FAU’s College of Business, said the financial industry is an important, integral part of the economy. “I can’t think of a better way to expose our students to the importance of emerging growth companies than to have 100 plus executive teams in the halls of our campus,” he said.
The entire College of Business Executive Education facility will transform into NobleCon19. Each presentation room will accommodate investors, in tiered seating with personal monitors. High-definition cameras, full-room microphones (to capture audience questions), three large screens, and full webcasting capabilities will offer the most technologically advanced conference environment on the circuit. Attendees will also experience similarly equipped rooms for panel presentations, private breakouts, and meetings, and in large gathering spaces, both indoors and out, as well as 800 free covered parking spaces. Florida Atlantic University is centrally located in Boca Raton, off I-95, only minutes from the Boca Raton Airport, and less than half an hour from Fort Lauderdale International Airport. Privaira, located at Boca Raton Airport is the official private air charter company for NobleCon19. A wide range of hotel accommodations are available within a five-mile radius, from economy to the ultra-luxurious “The Boca Raton.” Noble will be working with several properties to offer NobleCon19 attendees discounted rates.
The format of NobleCon will include company presentations followed by fire-side chats with Noble analysts, and select one-on-one meetings for qualified investors only, as well as several industry panel presentations. On the networking side, Noble is planning for informative keynote speakers and live entertainment, in an effort expand the business day in a more casual, conversational environment. All company presentations and panel discussions will be digitally streamed and made available exclusively on www.channelchek.com – Noble’s proprietary investment community portal.
Who should attend? Public companies from any business sector with market capitalizations of below $3-4 billion. Private companies planning a capital raise, considering becoming public, or an M&A event. NobleCon19 will suit every level of investor; high net worth individuals, family offices, self-directed investors, private equity, RIAs, financial advisors, equity analysts, and institutional investors. www.NobleCon19.com
About Florida Atlantic University
Florida Atlantic University, established in 1961, officially opened its doors in 1964 as the fifth public university in Florida. Today, the University serves more than 30,000 undergraduate and graduate students across six campuses located along the southeast Florida coast. In recent years, the University has doubled its research expenditures and outpaced its peers in student achievement rates. Through the coexistence of access and excellence, FAU embodies an innovative model where traditional achievement gaps vanish. FAU is designated a Hispanic-serving institution, ranked as a top public university by U.S. News & World Report and a High Research Activity institution by the Carnegie Foundation for the Advancement of Teaching. For more information, visit www.fau.edu.
About Noble Capital Markets
Noble Capital Markets, Inc. was incorporated in 1984 as a full-service SEC / FINRA registered broker-dealer, dedicated exclusively to serving underfollowed emerging growth companies through investment banking, wealth management, trading & execution, and equity research activities. Over the past 39 years, Noble has raised billions of dollars for companies and published more than 45,000 equity research reports. www.noblecapitalmarkets.comcontact@noblecapitalmarkets.com
The GEO Group, Inc. (NYSE: GEO) is a leading diversified government service provider, specializing in design, financing, development, and support services for secure facilities, processing centers, and community reentry centers in the United States, Australia, South Africa, and the United Kingdom. GEO’s diversified services include enhanced in-custody rehabilitation and post-release support through the award-winning GEO Continuum of Care®, secure transportation, electronic monitoring, community-based programs, and correctional health and mental health care. GEO’s worldwide operations include the ownership and/or delivery of support services for 103 facilities totaling approximately 83,000 beds, including idle facilities and projects under development, with a workforce of up to approximately 18,000 employees.
Joe Gomes, Managing Director – Generalist Analyst, Noble Capital Markets, Inc.
Joshua Zoepfel, Research Associate, Noble Capital Markets, Inc.
Refer to the full report for the price target, fundamental analysis, and rating.
NYC NDRS. On Tuesday, we hosted GEO CEO Jose Gordo and CFO Brian Evans for a series of investor meetings in New York City. Questions at the well attended meetings focused on the Intensive Supervision Appearance Program (ISAP) and the core ICE detention numbers.
ISAP. Yes, overall numbers for the program are down from the December highs but GEO’s guidance takes the trends into account and even at the low end of guidance, the Company will generate the second best ever annual adjusted EBITDA number. While the number of enrollees in the SmartLink program has declined 12.5% from the year-end program highs, as a percentage of the overall ISAP enrollees, the SmartLink program now represents 88.4%, up from 78.7% at year-end.
Equity Research is available at no cost to Registered users of Channelchek. Not a Member? Click ‘Join’ to join the Channelchek Community. There is no cost to register, and we never collect credit card information.
This Company Sponsored Research is provided by Noble Capital Markets, Inc., a FINRA and S.E.C. registered broker-dealer (B/D).
*Analyst certification and important disclosures included in the full report. NOTE: investment decisions should not be based upon the content of this research summary. Proper due diligence is required before making any investment decision.
TROY, Mich., March 16, 2023 /PRNewswire/ — Kelly (Nasdaq: KELYA, KELYB), a leading specialty talent solutions provider, today announced it will participate in the Sidoti Virtual Investor Conference on Thursday, March 23, 2023.
Peter Quigley, president and CEO, Olivier Thirot, executive vice president and chief financial officer, and James Polehna, chief investor relations officer and corporate secretary, will participate in virtual one-on-one meetings. A copy of Kelly’s investor presentation is also available at kellyservices.com.
About Kelly®
Kelly Services, Inc. (Nasdaq: KELYA, KELYB) connects talented people to companies in need of their skills in areas including Science, Engineering, Education, Office, Contact Center, Light Industrial, and more. We’re always thinking about what’s next in the evolving world of work, and we help people ditch the script on old ways of thinking and embrace the value of all workstyles in the workplace. We directly employ more than 300,000 people around the world, and we connect thousands more with work through our global network of talent suppliers and partners in our outsourcing and consulting practice. Revenue in 2022 was $5.0 billion. Visit kellyservices.com and let us help with what’s next for you.
Will Adam Aron CEO of AMC Win the Long Awaited Battle?
Management of AMC Entertainment Holdings ($AMC) is holding the long-awaited special meeting at noon Eastern time, Tuesday, March 14. At this meeting, shareholders will vote the peculiar $APE shares that were paid out as a dividend to shareholders. The dividend shares that were announced with the message “Today we Pounce” from the CEO Adam Aron created quite a stir – they seemed to have been designed to root out fraudulent shares and challenge any naked shorts of the AMC common shares.
The shareholders’ opportunity is a decision of whether or not to increase the firm’s stock authorization and convert AMC Preferred Equity Units (ticker: APE) into AMC common shares ($AMC). It will also vote on a 10-for-1 reverse stock split that would only take place if the APE measure passes.
AMC management won an endorsement from the proxy firm Institutional Shareholder Services (ISS) for the reverse stock split and preferred stock conversion. Institutional Shareholder Services is a market intelligence and influence proxy voting firm, its endorsement increases the odds of management having their wish.
If approved, it would represent an important career win for AMC’s Aron, who has become a superhero of sorts to the meme stock investors that helped the firm through the pandemic. He has shown himself to be able to stay one step ahead of those that would profit if AMC stock falters. Some stockholders supporting the measure take this as a fight between weak and strong and good and evil where prevailing is the only option.
In 2020 AMC Theatres lost $4.6 billion in sales due to Covid-related lockdowns and low attendance. Some powerful investors had shorted shares, many small investors grouped together and purchased the stock in droves, this created unexpected problems for the institutional short sellers that had large trades betting against AMC’s survival.
These investors caused the stock price to increase which allowed AMC to raise cash and survive and thrive.
The APE units, which represent one hundredth of a preferred share, have the same voting power of common shares.
Not all AMC shareholders are as supportive. Some are suing the company, arguing the APE sales decimated the voting power of common shareholders who might oppose increasing the firm’s share authorization.
Aron said during the fourth-quarter earnings call that if the vote falls short, the company could be forced to sell more APE shares at lower prices than a combined AMC share. On the same call he credited selling stock with helping the firm survive the lockdowns.
“We wouldn’t be blocked from raising capital, but we’d be raising capital on much less attractive terms,” Aron said. “It would cost more dilution to the stock that is entirely 100% preventable if a majority of our shareholders vote yes.”
The SVB Loss Demonstrates A Risk Investors Should Pay Attention To
Individual investors and even some institutional money managers are reminded of a helpful truth from the Silicon Valley Bank (SVB) balance sheet problem. The reminder of the investment risk stands in conflict with what many top firms have been recommending to investors. So it should be revisited because, unlike banks, individuals and wealth managers tend to have a wider variety of places to look for return.
Bank balance sheet management is tricky. I say this with some credibility. In August of 2008, I accepted a role as the Treasurer of a mid-sized bank just two weeks before Freddie Mac and Fannie Mae were placed into conservatorship, and three weeks before Lehman filed for bankruptcy. I was responsible for quickly finding solutions for a big potential balance sheet problem. It was a problem similar to SVB’s. Depositors at the bank were taking money out at a faster pace than bank investments, including loans cashflows, could cover. Money that had not been committed to loans were invested in low-risk investment-grade fixed-income securities. It was nerve-racking, at one point, I calculated if any two of the largest ten customers withdrew all of their funds, the bank would not have the ability to cover the withdrawal. The pain that SVB is faced with is not dissimilar.
SVB is a bank that serves many fledgling companies during a period when capital and investment in start-ups have weakened from the days of easier money just a couple of years ago. Banks make money by borrowing short from customers (demand deposits, checking, and CDs) and then lend long, presumably at a higher rate. Here they make the spread that a typical upward-sloping yield curve provides. The main risk is in maturity. What happens if your longer-term loans were made at Fed Funds plus 2.50% two years ago when average deposit costs were 0.20%, since today Fed Funds are 4.50%? Your loans are paying the bank less than the bank’s cost to fund them with short deposits. This is a risk that all banks manage – balance sheet risk.
As deposits ran off at SVB because of business conditions in Silicon Valley, the bank turned to its investment portfolio to fund withdrawals. Securities in a US bank portfolio, when purchased, are designated at the custodian, by the Treasurer, either “Trading” which in this department of the bank is rare, “Available for Sale,” which provides the treasury department the ability to sell if need be, but also requires the assets to be priced at market (this impacts the banks valuation), or “Hold to Maturity” where the fixed income securities appear on the balance sheet at cost.
If the securities are designated at purchase “Hold to Maturity” and the bank finds itself needing to sell any “Hold to Maturity” security, all securities marked “Hold to Maturity” become what regulators call tainted. The entire portfolio also becomes designated “Available for Sale.” This decision could dramatically reduce the bank’s book value in cases when interest rates have risen and bond values have dropped.
In the case of SVB, its securities portfolio, designed to earn more than deposits, was marked “Available for Sale.” When they sold, the market values were in such a lower position, from just a year earlier, that they recognized a dramatic loss. A $1.8 billion dollar loss which prompted its shares to lose more than half their market price.
Self-Directed Investors and Money Managers Should Note
The SVB explanation above, wernt a long way to remind that bonds, including US Treasury Notes have prices that rise and fall. They are different than equities, but price risk is real, and the $1.8 billion loss SVB recognized is front page proof. But since the beginning of the year many top-tier investment firms have recommended investors increase these fixed income investments and capture the new higher yields. Some even suggested ETFs in mortgaged-backed securities (MBS) or emerging markets (EM).
Goldman Asset Management is just one of the respected firms that have loudly suggested fixed income investments (CNBC, February 7, 2023)
Bond prices fall as rates rise. The Chair of the Federal Reserve, the same person that had orchestrated near zero rates, has clearly stated that the Fed will continue orchestrating higher rates. So while the stock market has been unattractive over the past 14 months, so have bonds. The difference, of course, is that bond math is absolute. As rates rise, the present value of any fixed-income security is calculated by the future value of future cash flow – this more or less determines the bonds price movement. For example, if an investor buys a bond that yields 3%, and later rates go to 6% for the same maturity, the present value is about halved. This is a plausible scenario currently, with inflation near 6%.
Stock indexes have taken a beating over the past 14 months, just like bonds. The difference is rising rates sink all bonds. It doesn’t sink all stocks.
So while the S&P 500 is down 17% since January 1, 2022, and the Russell 2000 small-cap index is down 20%, one doesn’t even have to get out of the A’s to find AT&T (T) is up 4.15% in the same period, and Canadian Company Alvopetro (ALVOF) is up 43.6%). You won’t find this type of disparity in performance or direction on the fixed-income side. US Treasuries were down 10.5% for the period.
So from one perspective, stock selection may provide potential upside, whereas rising rates could mathematically sink all bond portfolio holdings.
Take Away
Silicon Valley Bank is in a unique situation as its customer base is not very diversified. The challenges they face may be similar to other banks, but this does not appear indicative of the whole sector based on recent stress tests. Banks are restricted in what they can invest in, with rates having risen, and promised to rise more, fixed-income holdings are at a loss in many portfolios, SVB’s need to raise cash caused them to recognize what was already a market loss.
Investors, however, can take a lesson from the loss the bank took. While I have seen articles this year suggesting capitalizing on higher interest rates, the ten-year US Treasury Note is well below its historical average (40-yr. avg.+5.17% vs 3.73% today). And rates are not even returning a real rate of return relative to current and expected inflation. This would indicate a period of likely market losses on bond holdings put on today.
A Stock, or portfolio of stocks, of course, may also present losses, but the odds that any particular stock, or even an index, would seem less certain than bonds.