A bipartisan bill that would allow cannabis businesses access to banking services could see action in the Senate within the next six weeks, according to lawmakers.
The Secure and Fair Enforcement (SAFE) Banking Act has been a priority for advocates seeking to bring the marijuana industry into the financial mainstream. Currently, most banks will not work with cannabis companies due to federal prohibition.
Senate Banking Committee Chairman Sherrod Brown (D-OH) said he has discussed plans to move the bill forward soon with Majority Leader Chuck Schumer (D-NY). Schumer has also signaled marijuana banking reform is a priority issue requiring bipartisan cooperation.
“We want to get SAFE Banking. We want to do all that in the next six weeks,” Brown told reporters this week. The bill currently has 42 cosponsors split between Republicans and Democrats.
The SAFE Banking Act would protect financial institutions from federal penalties for working with state-legal marijuana businesses. Supporters say it would provide critical access to essential banking services that cannabis companies currently lack.
Take a moment to learn about Schwazze, a leading vertically integrated cannabis holding company with a portfolio spanning cultivation, manufacturing, dispensary operations and a nutrient line.
However, some Senate Democrats want to amend Section 10 of the bill, believing it could undermine banking regulations. Republicans have resisted those changes, and it’s unclear if a compromise can be reached.
The lead GOP cosponsor, Senator Steve Daines (R-MT), believes the votes are already lined up to pass the current version of SAFE Banking if brought to the floor.
The bill’s progress has major implications for small cannabis businesses that have struggled without proper banking access. Industry leaders say the measure is urgently needed and could determine whether many companies survive or not.
Proper banking would help small marijuana firms process transactions, obtain financing, pay taxes, and gain legitimacy. This could level the playing field against larger cannabis corporations.
While the path forward contains hurdles, the increasing bipartisan momentum behind marijuana banking reform suggests historic progress could be on the horizon for the growing industry after years of being denied equal services.
Intercontinental Exchange (ICE), the financial markets data and infrastructure company, has finalized its $11.9 billion acquisition of Black Knight, a leading provider of mortgage software, data and analytics solutions.
The deal expands ICE’s growing footprint in mortgage technology services. Black Knight strengthens ICE’s capabilities spanning mortgage origination, servicing, and secondary market activities.
ICE, with a market valuation of $63 billion, has been actively acquiring assets to build out its mortgage tech segment. Previous deals include Ellie Mae, Simplifile and MERS. Black Knight, currently valued at around $10 billion, offers software and data services used by mortgage lenders, servicers, and real estate industry participants.
The combination aims to improve automation and digitization across the mortgage process through ICE’s financial resources and Black Knight’s housing domain expertise.
Black Knight shareholders could elect to receive the deal consideration in cash or ICE stock, subject to proration procedures. Preliminary results indicate strong demand for the stock option.
To secure regulatory clearances, ICE agreed to divest Black Knight’s Optimal Blue and Empower mortgage origination system businesses to Constellation Software Inc. “Our team is ready to apply our proven playbook to help improve the homeownership experience for millions of families,” said ICE CEO Jeffrey Sprecher.
The deal expands ICE’s information services and market infrastructure footprint into the massive U.S. housing market, while providing Black Knight greater scale and distribution capabilities.
Take a moment to learn about Information Services Group, a leading technology research and advisory firm that specializes in digital transformation services, including automation, cloud and data analytics, and market intelligence.
Saudi Arabia and Russia have extended their joint oil production cuts by 1.3 million barrels per day until the year’s end. This move caused oil prices to spike, with benchmark Brent crude exceeding $90 per barrel, a level unseen since November.
While this decision may lead to higher inflation and fuel costs, it also strains Saudi Arabia’s relations with the U.S., as President Biden had previously warned of “consequences” for Saudi-Russian cooperation due to Russia’s Ukraine conflict involvement.
Saudi Arabia plans to monitor market conditions closely and take further action if needed, aligning with OPEC+ efforts to stabilize oil markets. Russia will continue its daily 300,000-barrel cut.
Brent crude had traded between $75 and $85 per barrel since November before these announcements.
No immediate U.S. reaction, but past criticism of OPEC, Saudi Arabia, and Russia by U.S. lawmakers persists. Analysts predict these cuts may create global oil imbalances and push prices above $90 per barrel if there isn’t a significant economic downturn.
U.S. gasoline prices average $3.81 per gallon, slightly below the 2012 Labor Day high of $3.83, but the impact remains uncertain. Higher gasoline prices can raise transportation costs and contribute to inflation.
Take a moment to learn about InPlay Oil, a junior oil and gas exploration and production company with operations in Alberta focused on light oil production.
Saudi Arabia’s production cut, initiated in July, aligns with other OPEC+ countries extending cuts into the following year, yet previous cuts failed to significantly raise oil prices due to weak demand and tighter monetary policies. International travel’s revival is expected to boost oil demand.
Saudi Arabia aims to boost oil prices to fund its Vision 2030 initiative, diversifying its economy and creating jobs, including the $500 billion Neom city project. Balancing these goals, Saudi Arabia must manage its U.S. relationship, complicated by past tensions over Jamal Khashoggi’s killing. Recent negotiations include nuclear cooperation, raising nonproliferation concerns.
Higher oil prices from these cuts also aid Russia in funding the Ukraine conflict, as Western sanctions reduce Moscow’s revenues, leading to discounted oil sales.
These dynamics add complexity to the global geopolitical landscape surrounding oil production.
China and Japan are actively defending their currencies against the rising US dollar, sparking inflation concerns. Both the yen and yuan have depreciated significantly due to market expectations of prolonged higher interest rates by the US Federal Reserve.
In response, China’s central bank is providing robust guidance through its daily yuan reference rate to prevent excessive weakening. Japan has issued a stern warning against rapid yen depreciation, signaling readiness for intervention.
Despite these efforts, doubts linger about their effectiveness, especially if the Federal Reserve maintains a hawkish stance or China’s economic recovery remains sluggish. The strong US dollar also affects European currencies, with the euro and pound hitting their lowest levels since June, raising concerns of quicker rate cuts by eurozone and UK central banks to counter rising borrowing costs. Investors globally watch closely as central banks and the Federal Reserve navigate these currency dynamics, with potential implications for inflation and future monetary policies.
Pennsylvania instrumentation company AMETEK (NYSE: AME) is expanding its testing and measurement capabilities with the acquisition of United Electronic Industries.
Massachusetts-based UEI is a leader in data acquisition and control solutions for aerospace, defense, energy and semiconductor sectors. Its products enable customers to build robust systems for simulation, monitoring and automated testing.
AMETEK CEO David Zapico expressed excitement about bringing UEI’s innovative solutions into the company’s Power Systems and Instruments division. He said the $35 million deal broadens AMETEK’s presence in attractive markets that complement existing strengths.
UEI will join AMETEK’s Electronic Instruments Group, known for analytical, calibration and display instruments. The acquisition aligns with AMETEK’s growth strategy of targeting niche segments and making strategic buys.
Headquartered near Philadelphia, AMETEK has annual sales over $6 billion globally. The 90-year-old firm focuses on cash flow and capital deployment to drive double-digit earnings growth.
Take a moment to learn about Kratos Defense & Security Solutions, a company that specializes in satellite communications, missile defense, and hypersonic systems.
Western Midstream Partners, LP (NYSE: WES) is set to expand its footprint in the Powder River Basin through the acquisition of Meritage Midstream Services II, LLC (Meritage). This all-cash transaction comes with a price tag of $885 million and is expected to close in the fourth quarter of 2023, subject to regulatory approvals.
Meritage, headquartered in Denver, Colorado, operates a substantial natural gas gathering and processing business in Wyoming’s Powder River Basin. The acquisition will significantly increase WES’s natural gas processing capacity, taking it to 440 MMcf/d. Additionally, it will diversify WES’s customer base with long-term contracts and acreage dedications from reputable counterparties.
The Powder River Basin has attracted considerable investment due to its multi-stacked pay horizon potential, making it an appealing prospect for energy companies. As part of this acquisition, WES aims to enhance its position in the basin and pursue additional acreage dedications and business development opportunities.
Upon completing the transaction, WES anticipates recommending a Base Distribution increase of $0.0125 per unit, providing a potential boost for its investors.
This strategic move represents a significant step for WES in expanding its presence in a region with promising energy prospects.
Shareholders of Digital World Acquisition (DWAC), the investment partner of former President Donald Trump’s media venture, have granted an extension to the company’s merger deadline. This extension allows the special purpose acquisition company (SPAC) more time to complete its long-pending merger with Truth Social, a social network with pro-Trump leanings.
The extension comes after a concerted effort to secure shareholder approval, arriving just three days before the liquidation deadline of Truth Social on September 8. A failure to secure shareholder approval would have compelled the SPAC to dissolve, resulting in the return of $300 million to shareholders, depriving Trump Media & Technology Group of the funds associated with the deal.
However, the merger still faces challenges, including meeting closing conditions and resolving issues raised by the Securities and Exchange Commission (SEC). In July, the SEC alleged that Digital World had misled investors in its official merger documents. Correcting these inaccuracies and resubmitting the filings is necessary before the merger process can proceed. Additionally, required quarterly financial statements covering operations in the first half of 2023 have not been filed with the SEC.
Digital World Acquisition had initially anticipated a year for the merger process when it went public in September 2021 but has encountered several hurdles necessitating deadline extensions, including a previous one in September 2022.
Following the news of the extension, Digital World’s shares experienced a rise to over $18 before settling at $16.80 per share at 11 a.m. The stock had reached its peak at approximately $175 per share in 2021.
Explore other SPAC Mergers via SPACtrac reports from Noble Capital Markets
SoftBank Group’s Arm is gearing up for its highly-anticipated initial public offering (IPO), with ambitions to secure a valuation exceeding $52 billion. In an announcement made on Tuesday, the renowned chip designer unveiled plans to issue 95.5 million American depository shares, priced between $47 and $51 each, with a target of raising up to $4.87 billion at the upper end of this range.
While this valuation marks a decline from the $64 billion that SoftBank paid last month to acquire the remaining 25% stake in Arm from its $100 billion Vision Fund, it still surpasses the abandoned $40 billion sale of Arm to Nvidia Corp, which fell through last year due to opposition from antitrust regulators.
Arm, headquartered in Cambridge, England, holds a dominant position in the global technology landscape, powering over 99% of the world’s smartphones. Its innovative designs are also integral to a wide array of devices, spanning from tablets and laptops to servers and automobiles. Notably, Arm maintains a substantial presence in the United States.
Expected to be the largest IPO in the United States this year, Arm’s public offering carries significant weight as a litmus test for an IPO market grappling with challenges such as rising interest rates and geopolitical tensions stemming from the Ukraine conflict.
Despite these obstacles, investors are likely to welcome Arm’s IPO with open arms. The company boasts profitability and a remarkable history of technological innovation. Furthermore, Arm’s designs play a pivotal role in advancing emerging technologies like artificial intelligence and the metaverse.
For SoftBank, this IPO represents a major triumph. The Japanese conglomerate has been under pressure to enhance its investment returns, and while the sale of Arm would have been a monumental windfall, the IPO is a noteworthy achievement in its own right.
The success of Arm’s IPO hinges on several key factors:
1. IPO Market Conditions: The strength of the overall IPO market will play a vital role in determining Arm’s success.
2. Investor Appetite for Tech Stocks: As a technology company, Arm’s fate will be closely tied to investor sentiment towards tech stocks.
3. Valuation of Arm: The company’s valuation must be attractive to prospective investors.
4. Demand for Arm’s Shares: The level of demand for Arm’s shares will significantly impact the outcome.
If Arm’s IPO prevails, it could usher in a new era for the IPO market, potentially inspiring other startups to pursue public offerings. This success story would also bolster SoftBank’s financial standing and burnish its reputation as a savvy investor. Moreover, the technology industry would reap the rewards of heightened visibility and liquidity associated with Arm’s shares.
However, should Arm’s IPO falter, it could stymie the company’s growth prospects due to a lack of capital infusion. SoftBank would bear the financial brunt, and its reputation as an investor might suffer. Additionally, the technology sector would miss out on the potential benefits of Arm’s IPO.
In conclusion, Arm’s IPO is a watershed moment poised to leave an indelible mark on the company, SoftBank, and the technology sector at large. Its success will pivot on a complex interplay of factors, but if it prospers, it promises significant advantages for all stakeholders involved.
The Timken Company (NYSE: TKR), a global leader in engineered bearings and industrial motion products, has announced its acquisition of Des-Case Corp., a Nashville-based manufacturer specializing in filtration products for industrial lubricants. Founded in 1983, Des-Case serves various industrial sectors, and it is expected to generate approximately $40 million in revenue in 2023.
Des-Case is recognized for its innovative filtration solutions that complement Timken’s automatic lubrication systems. This acquisition opens up opportunities for synergy, such as cross-selling and international expansion. Des-Case’s product range includes breathers, filter elements, condition monitoring, lubrication storage, and filter systems, all of which play a crucial role in improving equipment reliability, reducing downtime, and extending the lifespan of customer systems.
Des-Case employs around 120 individuals and operates manufacturing facilities in both Tennessee and the Netherlands. The acquisition was funded through a combination of cash reserves and Timken’s existing revolving credit facility.
Timken, with over a century of experience and innovation, designs and manufactures engineered bearings and industrial motion products. In 2022, the company achieved $4.5 billion in sales and has a global workforce of more than 19,000 employees across 46 countries. Timken has received recognition as one of America’s Most Responsible Companies, World’s Most Ethical Companies, America’s Most Innovative Companies, and America’s Best Large Employers by various prestigious organizations.
A Broad-Based Recovery in Shares of Internet & Digital Media Stocks
Despite macroeconomic headwinds that include higher interest rates, a regional banking crisis, elevated inflation and a war in Europe, the S&P 500 powered higher for the third quarter in a row. The S&P 500 Index continued its streak of steady increases, with an 8% increase in the Index in 2Q 2023, which followed a 7% increase in 1Q 2023 and a 7% increase in 4Q 2022. The broad index is up a healthy 24% since the end of the third quarter of 2022. The S&P 500 bottomed on October 12, 2022, and is up 26% from that date through mid-July.
The S&P 500’s performance was driven primarily by its largest constituents. As a market weighted index, the largest stocks have an outsized impact on its performance, and that was certainly the case in 2Q. Eight of the largest stocks in the S&P 500 Index were up in 2Q 2023 by 2x-3x or more than the Index’s 8% gain. Stocks that powered the Index higher included Nvidia (NVDA, +52%), Meta Platforms (a.k.a Facebook, +META, +35%), Netflix (NFLX, +28%), Amazon (AMZN, +26%), Tesla (TSLA, +26%), Microsoft (MSFT, +18%), Apple (AAPL, +18%) and Google (GOOGL, +15%).
Noble’s Internet and Digital Media Indices, which are also market cap weighted, also powered higher thanks to the biggest constituents in their respective Indices. Each of these Indices posted double digital percent increases, with only the exception being Noble’s Video Gaming Index (+5%), which slightly underperformed the broader market/S&P Index. For the second quarter in a row, the best performing index was Noble’s Social Media Index, which increased by 34% in 2Q 2023, followed by Noble’s Ad Tech Index (+24%), MarTech Index (+18%), Digital Media Index (+16%), and Video Gaming Index (+5%).
STOCK MARKET PERFORMANCE: INTERNET AND DIGITAL MEDIA
Meta Powers the Social Media Index Higher
We attribute the strength of the Social Media Index to its largest constituent, Meta Platforms, whoseshares increased by 35% in the second quarter. We noted last quarter that Meta appeared to be returning to its roots and focusing on profitability, rather than its nascent and riskier web3 initiatives. That return to its core strengths has been greatly rewarded by investors. Shares of Meta were up 225% from its 52-week low of $88.09 per share in early November through the end of June. Shares are up another 8% since the start of the third quarter with the launch of Threads, Meta’s answer to Twitter. Over 100 million people signed up for Threads within the first five days of its rollout. Meta has not yet begun to monetize this opportunity, but it will clearly add to its growth in coming quarters.
Ad Tech Stocks Embark on a Broad-Based Recovery Following a Difficult 2022
Noble’s AdTech Index increased by 24% in 2Q 2023, and this performance was very broad based, with 15 of the 24 stocks in the sector up, and a dozen of the stocks up by double digits. Ad Tech stocks that performed best during the quarter include Applovin (APP, +63%), Magnite (MGNI, +47%), Tremor International (TRMR, +37%), Pubmatic (PUBM, +32%), Double Verify (DV, +29%), The Trade Desk (+27%), and Integral Ad Science (IAS, +26%). Ad Tech stocks were the worst performing sector in our universe in 2022, with the index down 63% for the year in 2022. The strong performance in 2Q 2023 in many respects reflects a bounce back off multi-year lows for several stocks. Year-to-date, one standout in particular is Integral Ad Science, whose shares were up 104% in the first half of 2023. The company continues to expand its product suite, scale its social media offerings (i.e., for TikTok) and is well positioned to continue to benefit from the shift from linear TV to connected TV (CTV). The company is benefiting from new partnerships with YouTube and Netflix and shares likely benefited during the quarter from anticipation of the company’s mid-June analyst day presentation.
Noble’s MarTech Index was up 18%, with performance within the group also broad based. Thirteen of the 20 stocks in the Index were up in the quarter. MarTech stocks that performed best during the quarter include Cardlytics (CDLX, +86%), Shopify (SHOP, +35%), Live Ramp (RAMP, +30%), Adobe (ADBE, +27%), and Hubspot (NUBS, +24%). MarTech stocks were victims of their own success: the group traded at double digit revenue multiples in 2021, but the sector’s revenue multiples were more than halved in 2022. The group currently trades at 5.3x 2023E revenues, up from 4.1x 2023E revenues at the end of the first quarter, and 3.5x 2023E revenues at the start of the year.
Finally, the Digital Media Index was up 16% in 2Q 2023, and here again, the performance was broad based with 8 of the 12 stocks in the Index posting gains. Digital Media stocks that performed best during the quarter include Fubo TV (FUBO, +72%), Travelzoo (TZOO, +31%), Netflix (NFLX, +28%), Interactive Corp (IAC, +22%), and Spotify (SPOT, +20%). Year-to-date, the two best performing Digital Media stocks are Spotfiy (+103% YTD), which has shifted its priority to running a profitable company and took additional steps in 2Q to achieve it, for instance, by consolidating and streamlining several of its podcast company acquisitions from recent years. The second best performing Digital Media stock through the first half of the year was Travelzoo (TZOO), whose shares were up 77% in the first half of the year. The company continues to benefit from pent up demand that helped a surge in travel as the pandemic ebbed. Lodging and domestic travel demand rebounded first, but Travelzoo appears to be benefiting from cruises and international travel, where pent up demand took longer to recover.
2Q 2023 M&A – Global Deal Market Fell by 36% Year-Over-Year
According to Dealogic, global M&A fell by 36% to $733 billion in 1Q 2023 compared to $1.14 trillion in 2Q 2022, with high interest rates and a stand-off over the U.S. debt ceiling cited as reasons for caution in the M&A market. Uncertainty is the biggest issue impacting M&A. However, 2Q 2023 global M&A levels represent a 22% increase from 1Q 2023 global M&A of $601 billion in the first quarter of 2023.
In the U.S., M&A deal values decreased by 30% to $318 billion, while Europe and Asia Pacific volumes decreased by 49% and 24% respectively. Private equity buyouts have been particularly challenged with year-to-date values down 59% to $197 billion in the first half of the year, following a 56% decrease in 2Q 2023 vs. the year-ago period. It is difficult to tell how much the regional banking crisis in the U.S. played a role in these declines, but to the extent that regional banks play a role in middle market M&A, there is less credit available in the middle market, which has impacted valuations.
2Q 2023 Internet and Digital Media M&A – A Mixed Bag
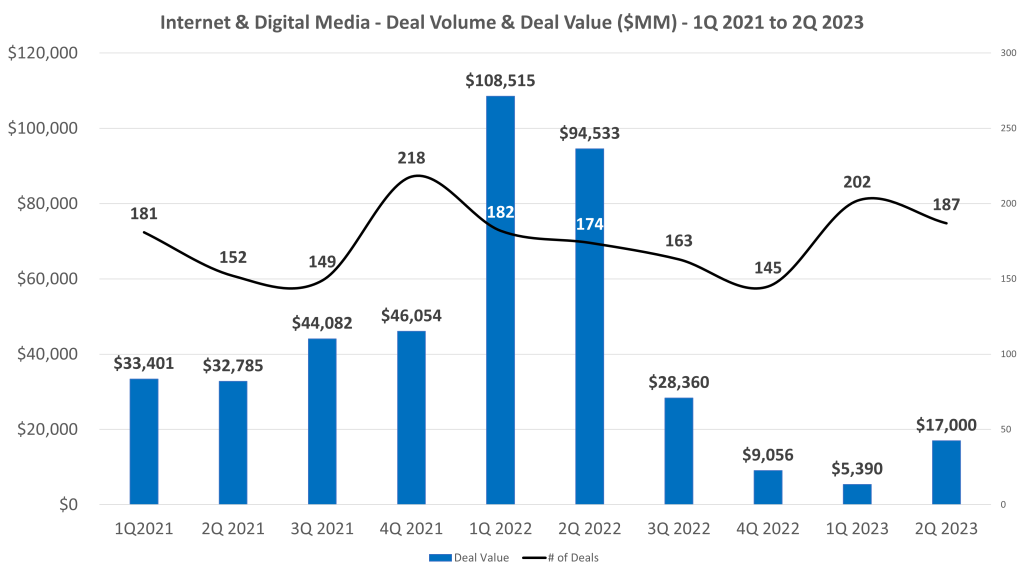
Based on Noble’s analysis, deal making in the second quarter of 2023 in the Internet and Digital Media sectors slowed, but was surprisingly weaker on a year-over-year basis than on a quarter-over-quarter basis. The total number of deals we tracked in the Internet and Digital Media space actually increased to by 3% to 187 deals in 2Q 2023 compared to 181 deals in 2Q 2022. On a sequential basis, the total number of deals decreased by 7% compared to 202 deals in the first quarter of 2023.
The biggest change was in the second quarter’s M&A deal value, where the total dollar value of deals fell by 82% to $17.0 billion of announced deals in 2Q 2023 compared to $95.5 billion in announced deals in 2Q 2022. While total deal value of announced deals decreased significantly year-over-year, on a sequential basis, deal value increased by 82% from $8.4 billion in deal value in 1Q 2023 to $17 billion in 2Q 2023.
From a deal volume perspective, the most active sectors we tracked were Digital Content (53 deals), MarTech (52 deals) and Agency & Analytics (40 deals). From a dollar value perspective, Digital Content led the way with $13.4 billion in transactions, followed by MarTech ($1.25 billion), Information Services ($1.23 billion) and eCommerce ($800 million). It was a very slow quarter for Ad Tech deals, where we tracked just 9 transactions for a total of $248 million.
Video Gaming Deals Drive the Largest Transactions in 2Q 2023
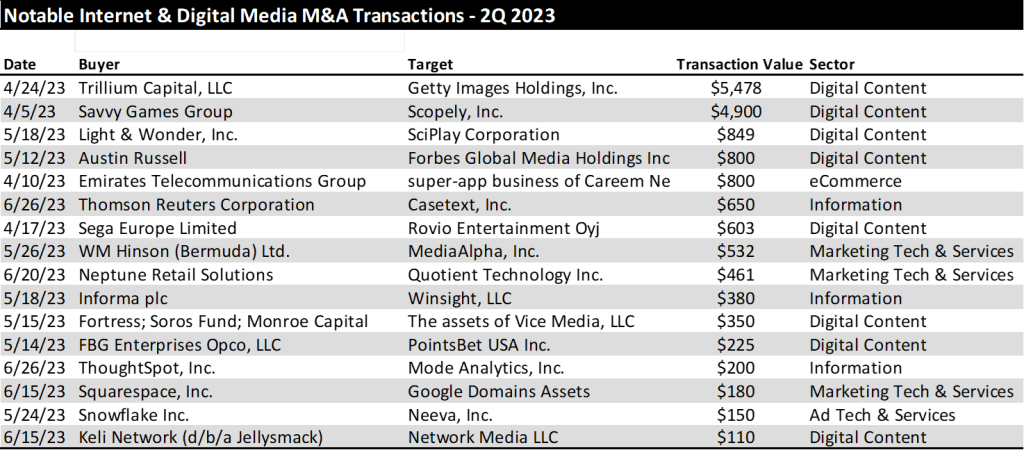
It is notable that we tracked 16 transactions that were greater than $100 million in dollar value during the quarter and half of those transactions were in the Digital Content sector. In fact, the four largest transactions in the quarter were digital content transactions, with two of these deals being in the video gaming sector: Savvy Games Group’s $4.9 billion acquisition of Scopely, and Light & Wonder’s (previously known as Scientific Games Corp) $849 million announcement that it would acquire SciPlay Corporation. The largest deals in the quarter by dollar value are shown below.
TRADITIONAL MEDIA COMMENTARY
The following is an excerpt from a recent note by Noble’s Media Equity Research Analyst Michael Kupinski
The Recession Is Here
The economy grew post pandemic through the first quarter of 2023, reflecting a rebounding economy, fueled by government spending. But, economic activity is slowing, taking pressure off of inflation. Nonetheless, the Fed seems intent on pushing interest rates higher, likely through the balance of this year. Most economists anticipate that the Fed will raise interest rates by 25 basis points two times in the second half of this year. Not only will the interest rate increases be a headwind for the economy, but government spending, a key driver to the economy this year, is likely to wane. Recent economic forecasts anticipate GDP to contract over the next few quarters, a classic definition of an economic recession. The Conference Board of Economic Forecasts anticipates that the US economy will contract -1.2% in 3Q 2023, -1.9% in 4Q 2023, and -1.1% in 1Q 2024.
This does not paint a favorable picture for advertising in the very near term. Advertising is highly correlated to personal disposable income, particularly discretionary income. If consumers have discretionary income, companies advertise in anticipation of consumer spending. Disposable income has declined over the past 18 months. Not surprisingly, economically sensitive national advertising has been down nearly 4 quarters and at high double digit rates. Given the significant declines, as much as 25% in each quarter for the past year, national advertising trends should moderate, given that the comps get easier. Even with an economic downturn becoming more visible, it is possible that national advertising declines may moderate.
National advertisers tend to spend when there is light toward the end of an economic recession, when consumer personal disposable income shows signs that it will improve and consumers have the propensity to spend. In our view, that light at the end of the tunnel is still pretty dim given the economic forecast that anticipates a decline in GDP through 1Q 2024. While the visibility of an improvement in national advertising seems to have improved as we enter an economic downturn, especially given the easing comps and the benefit from political advertising (expected to begin in 3Q 2023), we think that it is too early to be optimistic. We believe that the length and severity of an economic downturn is not yet visible.
STOCK MARKET PERFORMANCE: TRADITIONAL MEDIA
What does this mean for the stock market and for media stocks? The recent increases in Fed Funds rates had little effect on the general stock market as measured by the S&P 500 Index. Unfortunately, late cycle and economically sensitive media companies declined or under-performed the stock market. In spite of Fed Fund rate increases over the past year, the S&P 500 Index increased 18% in the last 12 months. The anticipation of an economic recession, however, weighed on media stocks.
The stock performance of the various media sectors generally under-performed the market. The exception to the poor performance were the Internet and Digital Media stocks, which had a broad-based recovery. Is it possible that early cycle media stocks will outperform the general market in the near term? In our view, yes, but, this may mean that the general market may decline as media stocks decline less. Historically, it has been the case to buy media stocks in the midst of a recession as media stocks strongly outperform the general market in an economic recovery. But given the likely disappointment in revenue in the coming quarters, it is likely that media stocks will be volatile as investors weigh the near-term revenue and earnings disappointments to the prospect of a revenue rebound in an improved economic scenario. This would suggest that if one were to try to time the stocks, investors may want to wait a quarter or two and buy on the improved momentum. This may mean that one might miss the large gains. For long-term investors, we believe that we are nearer to the bottom and that the downside appears relatively limited and valuations appear compelling. But, given the anticipated volatility in the near term, media investors should look for opportunistic purchases and accumulate positions in their favorite media names.
Traditional media stocks largely underperformed the general market over the LTM, the Radio sector was the hardest hit. The Noble Radio Index decreased 38% over the latest twelve months, compared with the general market increasing 18%, as measured by the S&P 500 over the same period. The Television Index was down 15% and the Publishing index outperformed the general market, increasing 28% over the last year. Notably, there were company stock performance disparities within each sector. Given the indices are market cap weighted, larger market capitalized companies skewed the indices’ performance.
The traditional media industry is still finding its footing in the difficult economic environment, given the indices performance in Q2. While the Newspaper and Radio indices performed better in Q2 than Q1, the TV Index did not. The S&P 500, increased 8% over the last quarter and outperformed all but one traditional media sector. The Newspaper Index, which increased 9% over the same period narrowly outperformed the general market. The TV Index was the hardest hit traditional media sector and decreased -11%. While the Radio index underperformed the market in Q2, it improved upon a difficult Q1 and increased 3%.
Broadcast Television
Are ad trends really improving?
The TV Index underperformed the general market in the second quarter. While none of the stocks in the TV Index increased in the second quarter, many performed better than the market cap weighted return of -11%. Fox Corporation (FOXA; was flat at 0%), E.W Scripps (SSP; down 33%), Nexstar (NXST; down 4%) and Gray Television (GTN; down 10%) were among the best performing stocks in the hard-hit TV index. The stocks hit the hardest in Q2 were Sinclair Broadcast Group (SBGI; down 20%) and Entravision (EVC; down 27%). Given the recent turmoil in TV stock performances we view the depressed prices as a potential opportunity given the prospect of an advertising recovery over the next few quarters.
While there have been some recent reports indicating that television advertising is improving, possibly related to increased political advertising and auto advertising in the third quarter, we remain skeptical that the improvement is sustainable given the weakening economy. Nonetheless, the TV stocks appear cheap.
From a valuation perspective, Paramount (PARA) trades well above industry peers such as Entravision (EVC) and E.W Scripps (SSP), which trade at multiples well below the industry high. While E.W Scripps had modest year over year revenue decline, we believe it will benefit from favorable retransmission renewal revenue and improved margins on said revenue. Given the SSP shares low float, the shares tend to underperform when industry is out of favor and overperform when the industry is back in favor. As for Entravision, we view the company’s digital transformation positively, given the shares are trading at a modest 3.9 times Enterprise Value to our 2024 Adj. EBITDA estimate we believe there is limited downside risk. In our view, the EVC shares and SSP shares both offer a favorable risk reward relationship and are poised to benefit from an advertising recovery.
Broadcast Radio
While the Radio Index underperformed the S&P 500 in Q2, it was an improvement from a difficult Q1. Notably, there were a few strong performances in the market cap weighted index. Beasley Broadcast Group (BBGI, up 24%) , Cumulus Media (CMLS, up 11%) and Townsquare (TSQ, up 49%) all strongly outperformed the S&P 500 in Q2. The largest stocks in the group did not perform well in the quarter skewing the index lower, Audacy (AUD, up 3%) and iHeart Media (IHRT; down 7%). The second quarter stock performances were a mixed bag and largely did not reflect the first quarter operating results. Most companies had modest revenue growth. The larger Radio companies that rely more on national advertising had the greatest declines of YoY revenue. With CMLS being the exception, the larger Radio companies underperformed relative to Radio companies with a stronger digital and highly localized presence.
Some Radio companies have strong digital businesses and highly localized footprints, which provides some shelter from weakness in national advertising. Those companies include Townsquare, Beasley Broadcast Group, Salem Media (SALM; down 12%) and Saga Communications (SGA, down 4%). While the shares of Saga Communications (SGA) were down 4%, the performance did not reflect its favorable first quarter operating results. Importantly, Saga grew revenues a modest 1.3% and had an above average Q1 EBITDA margin of 9.6%. Saga has a highly localized footprint, as approximately 90% of revenues come from local sources. Furthermore, the company has been placing more importance on growing a profitable digital business in recent years. While Saga’s Digital business is early in its development, management is focused on growing digital revenues from 7.5% of total revenue in Q1 to 20% of total revenue over the next couple years. Additionally, the company is likely to maintain a strong cash position given the economic uncertainty.
Townsquare Media (TSQ), Salem Media (SALM), Beasley Broadcast (BBGI) and Saga Communications (SGA) have all diversified their revenue streams, and while not immune to the economic headwinds, their digital businesses and local footprints should offer some ballast to the more sensitive radio business.
We believe that radio advertising pacings likely will be problematic in the second half given the economic headwinds. Unlike Television, the industry does not benefit as much from political advertising. We expect that advertising pacings likely will be lower in Q3 than the Q2 results. It is likely that many radio companies, especially those with higher debt leverage, will implement cost cutting measures. With many of the radio companies already relatively lean from the Pandemic, it is likely that such measures will be difficult.
Publishing
The Publishing industry is no exception to the advertising weakness that is impacting the broader media landscape. Revenues are likely to continue to decline, despite an already weak performance in the first quarter of the year. Revenue were predominantly negative in 1Q23. The advertising challenges are hitting the traditional print side of the publishing business hardest. For example, Lee Enterprises (LEE) reported a 10% decline in print advertising revenue in 1Q23, while digital advertising grew a modest 2%. The company’s adj. EBITDA generation fell 15% compared with a more moderate 2% drop in total company revenues.
Not surprisingly, the dampened industry revenue resulted in lower industry cash flow generation with EBITDA margins averaging in the 10% range. Yet despite the constraints on cash flow generation on Lee and the other Publishers, we believe the companies have the ability to cut costs to help offset the pressure on cash flow generation. In particular, companies could cut costs in their print manufacturing and distribution operations, reducing overhead in the same business segments where revenues are expected to lag. Publishing companies have a playbook on cutting legacy print costs and have the ability to maintain cash flow. However, cost cuts can take time to go into full effect, which could result in poor cash flow performance over the next quarter or so.
In spite of the nearer term economic headwinds impacting the operating performance of the industry, we believe that the industry is near an inflection point towards revenue growth. This dynamic is related to the degree of the recovery in its digital media businesses, a key driver to the industry’s overall revenue performance. While there are secular challenges to the industry’s print business, digital revenues account for an increasing portion of total revenues. For companies like Lee Enterprises, digital accounts for over 38% of total revenues in the most recent quarter. In our view, publishing companies will be a player in the advertising recovery as economic prospects improve.
Furthermore, we believe that stock valuations are compelling. The New York Times (NYT) trades well above the levels of the rest of its peers. In comparison, Lee and Gannett appear to be compelling. However, both Lee and Gannett are highly levered. Yet, in our view, Lee’s debt profile has several favorable characteristics, such as a fixed 9% annual rate, no fixed principal payments, no performance covenants and a 25-year maturity. LEE shares trade near 5.3 times enterprise value to our 2024 adj. EBITDA forecast, and with a favorable digital transformation of the business well underway, LEE shares could close the valuation gap with some of its higher trading peers.
This newsletter was prepared and provided by Noble Capital Markets, Inc. For any questions and/or requests regarding this news letter, please contact Chris Ensley
DISCLAIMER
All statements or opinions contained herein that include the words “ we”,“ or “ are solely the responsibility of NOBLE Capital Markets, Inc and do not necessarily reflect statements or opinions expressed by any person or party affiliated with companies mentioned in this report Any opinions expressed herein are subject to change without notice All information provided herein is based on public and non public information believed to be accurate and reliable, but is not necessarily complete and cannot be guaranteed No judgment is hereby expressed or should be implied as to the suitability of any security described herein for any specific investor or any specific investment portfolio The decision to undertake any investment regarding the security mentioned herein should be made by each reader of this publication based on their own appraisal of the implications and risks of such decision This publication is intended for information purposes only and shall not constitute an offer to buy/ sell or the solicitation of an offer to buy/sell any security mentioned in this report, nor shall there be any sale of the security herein in any state or domicile in which said offer, solicitation or sale would be unlawful prior to registration or qualification under the securities laws of any such state or domicile This publication and all information, comments, statements or opinions contained or expressed herein are applicable only as of the date of this publication and subject to change without prior notice Past performance is not indicative of future results.
Please refer to the above PDF for a complete list of disclaimers pertaining to this newsletter
A Focus on Profitability Drives A Strong Start to the Year
Last quarter we wrote that the S&P 500 increased for the first time since the fourth quarter of 2021 and that we were beginning to see signs of life in Noble’s Internet and Digital Media Indices as well. Those signs of life continued to bear fruit throughout the first quarter, as every one of Noble’s Internet and Digital Media Indices not only finished the quarter up, but significantly outperformed the S&P 500. The best performing index was Noble’s Social Media Index, which increased by 70% in the first quarter of 2023, followed by Noble’s eSports & iGaming Index (+32%), Ad Tech Index (+31%), MarTech Index (+30%), and Digital Media Index (+18%).
Noble’s Indices are market cap weighted, and we attribute the strength of the Social Media Index to its largest constituent, Meta Platforms (META; a.k.a. Facebook) whose shares increased by 76% in the first quarter. We attribute this increase to management’s 4Q 2022 earnings call when they spent most of their time talking about “efficiency”, which investors interpreted to mean that Meta was newly focused on profitability. After a relatively disastrous 3Q 2022 earnings call, after which shares fell by 25%, the company demonstrated on its 4Q 2022 earnings call that it clearly had
gotten the message: investors were not enamored about the company’s plans in October 2022 to spend billions of dollars to develop its Metaverse initiatives. Rather, on its fourth quarter call, management focused on driving its short form video initiative Reels (i.e., becoming more TikTok like), reducing its headcount by reducing layers of management, lowering its operating expenses and reducing its capital expenditures. Investors applauded this newfound focus on profitability and shares rebounded from a low of $88.90 per share in early November to $211.94 at the March quarter-end.
Noble’s eSports and iGaming Index increased by 32% as 9 of the 16 stocks in the index posted gains, the two largest market cap weighted stocks. Shares of the largest stock in the index, Flutter Entertainment (FLTR) increased by 31%) while shares of the second largest stock in the index, DraftKings (DKNG) increased by 70%. Flutter’s improvement is likely due to an improved inflection point in the company’s U.S. operations which include its FanDuel operations. DraftKings also beat revenue and EBITDA expectations in 4Q 2022 and appears to be proving out its path to profitability. In both cases, investors are rewarding companies who are accelerating their path to profitability.
The next best performing index was Noble’s Ad Tech Index which increased by 31% during 1Q 2023. Fourteen of the 23 stocks in the index were up in the first quarter. Standouts during the quarter were Integral Ad Science (IAS; +62%) and Perion Networks (PERI; +56%). Integral Ad Science exceeded expectations in its fourth quarter results and guided to better-than-expected results in 1Q 2023. The company continues to expand its product suite, scale its social media offerings (i.e., for TikTok) and is well positioned to continue to benefit from the shift from linear TV to connected TV (CTV). Perion shares continued their winning streak: Perion was the only ad tech stock whose shares were up in 2022. Perion’s 56% increase in 1Q 2023 reflected beat on both revenues (by 2%) and EBITDA (by 10%) as well as improved guidance for 1Q 2023. Perion’s profitability increased significantly in 2022, with EBITDA nearly doubling (+90%) from $70 million in 2021 to $132 million in 2022.
Noble’s MarTech Index increased by 30% with 14 of the 22 stocks in the index posting increases in 1Q 2023. The best performing stocks were Qualtrics (XM; +70%) Sprinklr (CXM; +59%), Salesforce (CRM; +51%), Hubspot (HUBS; +48%) and Yext (YEXT; +47%). Qualtrics agreed to be acquired for $12.5 billion by Silver Lake and the Canadian Pension Plan Investment Board, which came at a 73% premium to its 30-day volume weighted stock price. Sprinklr beat revenue expectations and significantly beat EBITDA expectations (doubling the Street expectations) and guided to a current year forecast that focuses more on efficiency and profitability. MarTech stocks have been victims of their own success. Two years ago at this time the sector was trading at 11.3x forward revenue estimates, and a year ago the group was trading at 6.5x forward revenues. Today the group trades at 4.1x forward revenues and investors appear to be wading back into the sector.
Finally, Noble’s Digital Media Index, while lagging that of its digital peers posted an 18% increase and significantly outperformed the S&P 500 (+7%) with a broad based recovery in which 9 of the sector’s 11 stocks increase during 1Q 2023. The best performing stock was Spotify (SPOT; +69%), whose revenues fell short of expectations by less than 1%, significantly beat consensus Street EBITDA expectations by $58M and more importantly pivoted towards demonstrating operating leverage. Spotify, which posted an EBITDA loss of nearly $500 million 2022 is expected to generate $650 million in EBITDA in 2024, according Street estimates. A deteriorating ad market 2022 combined with higher interest rates likely prompted the company to shift its priorities to running a profitable company and doing it more quickly. The second best performing stock was Travelzoo (TZOO; +36%), as the company’s 4Q 2022 revenues and EBITDA increased by 31% and 328%, respectively. Notably, Travelzoo’s EBITDA came in 58% higher than Street consensus. The company appears to be benefiting from pent up demand for travel and management highlighted the opportunity for margin expansion in the coming quarters.
Sluggish M&A Market Carries Over into 2023
Last quarter we remarked that M&A deals in the Internet and Digital Media sector had held up well through the first three quarters of 2022 despite economic headwinds. However, the number of deals slowed in 4Q 2022 (by 17%) and total deal value fell dramatically (by 70%). The slowdown carried over into 1Q 2023. According to Dealogic, Global M&A fell by 48% to $575 billion in 1Q 2023 compared to $1.1 trillion in 1Q 2022. Global M&A dollar values fell to their lowest level in a decade. In the U.S., deal values fell by 44% to $283 billion from $176 billion in 1Q 2022.
The M&A market had weathered stock price declines, Fed rate hikes, elevated inflation, and geopolitical conflict in 2022. In 1Q 2023, to this “recession that never comes” economic environment we added increased volatility and uncertainty caused by banking failures. One of the biggest impediments to deals is debt financing. Private equity firms have had to write larger check in lieu of a robust debt financing market. Banks have been less willing to provide financing because some have had to hold loans on their balance sheet or take losses when selling debt to investors while smaller regional banks have seen deposits flee to larger banks, especially those considered too big to fail.
Finally, increased antitrust scrutiny likely has played a role in the M&A deal slowdown. Lengthy merger reviews resulted in three public transactions being blocked by regulators: Standard General’s acquisition of Tegna; JetBlue’s acquisition of Spirit Airlines, and Intercontinental Exchange’s acquisition of Black Knight, Inc.
1Q 2023 Internet and Digital Media M&A: A Dearth of Large Deals
Based on Noble’s analysis, deal making in the first quarter of 2023 in the Internet and Digital Media sectors actually increased by 11% compared to 1Q 2022. The total number of deals we tracked in the Internet and Digital Media space increased to 202 deals in 1Q 2023 compared to 182 deals in 1Q 2022. On a sequential basis, the total number of deals increased by 39% compared to 145 deals in 4Q 2022. The only explanation we can provide for this is that with the expectation that an economic slowdown was pending, many companies likely made the decision to sell in mid-2022, with the deals being announced in 1Q 2023.
The biggest change was in the first quarter’s M&A deal value, where the total dollar value of deals fell by 95% to $5.4 billion of announced deals in 1Q 2023 compared to $108.5 billion in announced deals in 1Q 2022. On a sequential basis, deal value fell by 40% from $9.1 billion in deal value in 4Q 2022.
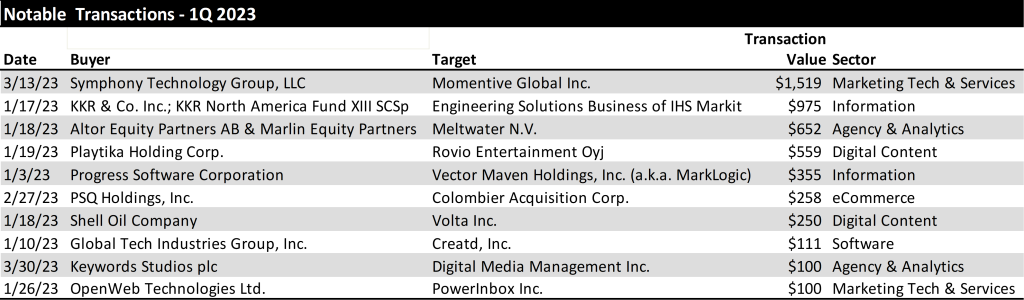
From a deal volume perspective, the most active sectors we tracked were Digital Content (59 deals), Agency & Analytics (51 deals), and MarTech (39), followed by Information Services (17 deals), Ad Tech (11 deals) and eCommerce sectors (10 deals). From a dollar value perspective, MarTech led the way with $1.6 billion in transactions, followed by Information Services ($1.4 billion), Digital Content ($922 million) and Agency and Analytics ($875 million). The largest deals in the quarter by dollar value are shown below.
Notably, there were no mega deals ($10B+) in the first quarter of 2023, compared to the first quarter of 2022 when Microsoft agreed to by Activision Blizzard for $68 billion and Take-Two Interactive agreed to acquire Zynga for $12 billion. Once the Fed stops hiking rates and visibility into operating trends returns, we may begin to see an environment in which mega deals will be contemplated again.
TRADITIONAL MEDIA COMMENTARY
The following is an excerpt from a recent note by Noble’s Media Equity Research Analyst Michael Kupinski
The NAB Show Stopper
Media investors are unpacking all of information from last week’s National Association of Broadcasters (NAB) convention. There is a lot to digest given that there were over 1,400 exhibits, and 140 new exhibitors this year. Because of the overwhelming number of exhibitors, many that go to Vegas for this annual convention do not go to the convention floor. It is a shame. There is a lot to see and learn. Noble’s Media & Entertainment Analyst Michael Kupinski walked the convention floor, which covers 4.6 million square feet of exhibit halls and meeting rooms. He stopped by booths and taped presentations to explain the new technologies, the plan for implementation of new services, and the prospect for revenue monetization. One important demonstration focused on the new broadcast standard, ATSC 3.0, the hope for a bright future for the television industry. This new standard should allow the industry to become more contemporary in terms of how its audience consumes video and information. In addition, it offers the ability for the industry to participate in new revenue streams, including datacasting, which may become bigger than Retransmission revenue in the future.
In addition to touring the floor, he participated in NAB panel discussions and hosted meetings with media management teams in a fireside chat format to discuss current business trends, the new technologies (including Artificial Intelligence (AI)) and the new broadcast standard. In addition, these C-suite management teams provided their key takeaways from the NAB convention and offered why they participated in the conference this year. These discussions will be available for free to Channelchek users on Channelchek.com on April 27th as a virtual conference. In this upcoming Channelchek Takeaway Series on the NAB Show, Michael offers his key takeaways, including the current advertising outlook, his take on the monetization of the new technologies and what media investors should do now given the current economic and advertising environment. Free registration to this informative event is available here.
This report highlights the performance of the media sectors over the past 12 months and past quarter. Overall, media stocks struggled in the past year, but there has been some improved quarterly performance, particularly in Digital Media and Broadcast Television, discussed later. All media stocks are struggling to offset losses over the course of the past year with trailing 12 months stocks down in the range of 5% on the low end to as high as down 68%.
In the first quarter, stock performance was mixed. The best performers in the traditional media sectors were Broadcast Television stocks, up nearly 10% versus the general market which increased 7% in the comparable period. However, the individual TV stock performance reflected a different story, explained later in this report. The worse performer for the quarter were the radio stocks, driven by a Wall Street downgrade of one of the leading radio broadcasters. We believe that stock performance will be a roller coaster for at least another quarter or two as the weight of the Fed rate increases begin to adversely affect the economy.
While national advertising has remained weak, we believe that local advertising is now beginning to moderate as well. The local advertising weakness appears to be in the smaller markets as well as the larger markets. This is somewhat different than the most recent economic cycles whereby the smaller markets were somewhat resilient. It seems that the smaller markets are feeling the adverse affects from inflation, rising employment costs and tightening bank credit. In our view, the disappointing advertising outlook likely will cause second quarter revenue estimates to come down, creating a difficult environment for media stocks.
Broadcast Television
Weak Current Revenue Trends
TV stocks outperformed the general market in the first quarter. This market cap weighted index masked the performance of many poor performing stocks in the quarter. Sinclair Broadcasting (up 10%), Entravision (up a strong 26%), and Fox (up 12%) were the best performing stocks and favorably influenced the TV index in the quarter. But, there were many poor performing stocks including E.W. Scripps (down 29%), Gray Television (down 22%) and Tegna (down 20%). We believe that there was heightened interest in Entravision given its favorable Q1 results which was fueled by its fast growing digital advertising business. Entravision’s Q4 revenue performance was among the best in the industry. While Entravision was among the best revenue performer, its margins are below that of its peer group EBITDA Margins. This is due to the accounting treatment of its digital revenues given that it is an agency business.. The poorer performing stocks are among the higher debt levered in the industry. The underperformance reflects concern of a slowing economy and investors flight to quality in the sector.
We do not believe that we are out of the woods with the TV stocks and the market is expected to be volatile. The advertising environment appears to be deteriorating given weakening economic conditions. There are bright spots which include some improvement in the Auto category. Dealerships appear to be stepping up advertising given higher inventory levels. In addition, broadcasters appear optimistic about political advertising, which could begin in the third quarter 2023. There is a planned Republican presidential candidate debate schedule in August. There is some promise that candidates will advertise in advance of that debate and into the fourth quarter given the early primary season. We do not believe that political and auto will be enough to offset the weakness in national and Local advertising. In our view, Q2 and full year 2023 estimates are likely to come down. Furthermore, we believe that broadcasters will be shy about predicting political advertising even into 2024 given the past disappointments in management forecasts in the last political cycle.
Broadcast Radio
All Out of Love
Radio stocks had another tough quarter, down 17% versus a 7% gain for the general market. Notably, there was a wide variance in the individual stock performance, with the largest stocks in the group having the worst performance in the quarter, including Audacy (AUD down 40%), Cumulus Media (CMLS down 41%) and iHeart Media (IHRT down 36%). The first quarter stock performance did not appear to reflect the fourth quarter results, during which revenues were relatively okay, with some exceptions. Some of the larger radio companies which have a large percentage of national advertising, underperformed relative to the more diversified radio companies, especially those with a strong digital segment presence. Margins for the industry remain relatively healthy.
The weakness in the Radio stocks was fueled in the quarter from a downgrade to Underperform on the shares of iHeart by a Wall Street firm. Many radio stocks were down in sympathy. The analyst attributed the downgrade to the current macro environment and its heavy floating rate debt burden. The company is not expected to generate enough free cash flow to de-lever its balance sheet. We believe the downgrade as well as the excessive debt profile of Audacy, another industry leader which likely will need to restructure, sent all radio stocks tumbling. Some stocks performed better than others. While Cumulus Media’s debt profile is not as levered as iHeart or Audacy, the shares were caught in the net of a weak advertising outlook. Cumulus is among the most sensitive to national advertising, which currently continues to be weak.
Some of our favorite stocks which are diversified and have developing digital businesses performed better. Those stocks included Townsquare Media (TSQ, up 10%), and Salem Media (SALM, up 4%). Notably, while the shares of Beasley Broadcasting (BBGI) were down 10%, the shares performed better than the 17% decline for the industry in the quarter. Importantly, Beasley recently provided favorable updated Q1 guidance for the first quarter. Q1 revenues are expected to increase 1% to 2.5% and EBITDA growth is expected to be in the range of 40% to 50%, significantly better than our estimates. Furthermore, management provided a sanguine outlook for 2023 and 2024. Digital revenue is expected to reach 20% to 30% of total revenue with a goal of reaching 40% in 2024. By comparison, digital revenue was 17% of total revenue in the fourth quarter 2022. Furthermore, the company is sitting on roughly $35 million in cash. It has opportunistically repurchased $10 million of its bonds at a significant discount. We believe that it is likely to maintain a strong cash position given the economic uncertainty.
Townsquare Media (TSQ), Salem Media (SALM) and Beasley Broadcast (BBGI) are all diversifying their revenue streams. While these companies are not immune to the economic headwinds, we believe theirdigital businesses should offer some ballast to its more sensitive Radio business. In the case of Salem, 30% of its revenues are relatively stable with block programming.
Publishing
After a period of moderating revenue trends, publishers reported a weakened advertising environment. Revenue trends deteriorated with print advertising taking a nose dive. This trend was illustrative in the results from Lee Enterprises. After a fiscal fourth quarter flat revenue performance, the company reported a 8.5% decline in its fiscal first quarter. The Q1 revenue performance reflected an 18.5% decrease in print advertising, an acceleration in the rate of the 11% decline in the previous quarter.
The surprisingly weak quarter hit the company’s adj. EBITDA margins. Traditionally, Lee maintained some of the best margins in the industry., but the company fell in ranking to among the lowest in the sector. Importantly, in spite of the revenue weakness, the company maintained its previous adj. EBITDA guidance of $94 million to $100 million for F2023. To achieve its cash flow target in light of the soft revenue outlook, Lee implemented a round of expense cuts to bolster cash flow. Cost reductions are expected to result in $40 million of savings in FY 23, and $60 million in annualized savings going forward. While the company’s print business declined more than expected , the company’s digital businesses remains favorably robust. In addition, its digital business is turning toward contributing margins; another step in the company’s digital evolution.
This newsletter was prepared and provided by Noble Capital Markets, Inc. For any questions and/or requests regarding this news letter, please contact Chris Ensley
DISCLAIMER
All statements or opinions contained herein that include the words “ we”,“ or “ are solely the responsibility of NOBLE Capital Markets, Inc and do not necessarily reflect statements or opinions expressed by any person or party affiliated with companies mentioned in this report Any opinions expressed herein are subject to change without notice All information provided herein is based on public and non public information believed to be accurate and reliable, but is not necessarily complete and cannot be guaranteed No judgment is hereby expressed or should be implied as to the suitability of any security described herein for any specific investor or any specific investment portfolio The decision to undertake any investment regarding the security mentioned herein should be made by each reader of this publication based on their own appraisal of the implications and risks of such decision This publication is intended for information purposes only and shall not constitute an offer to buy/ sell or the solicitation of an offer to buy/sell any security mentioned in this report, nor shall there be any sale of the security herein in any state or domicile in which said offer, solicitation or sale would be unlawful prior to registration or qualification under the securities laws of any such state or domicile This publication and all information, comments, statements or opinions contained or expressed herein are applicable only as of the date of this publication and subject to change without prior notice Past performance is not indicative of future results.
Please refer to the above PDF for a complete list of disclaimers pertaining to this newsletter