Endeavour Silver (EXK)(EDR:CA) – Turning the Corner

Friday, November 06, 2020

Endeavour Silver (EXK)(EDR:CA)

Turning the Corner

As of April 24, 2020, Noble Capital Markets research on Endeavour Silver is published under ticker symbols (EXK and EDR:CA). The price target is in USD and based on ticker symbol EXK. Research reports dated prior to April 24, 2020 may not follow these guidelines and could account for a variance in the price target.

Endeavour Silver Corp is a precious metal mining company. The company is primarily engaged in silver mining and owns three high-grade, underground, silver-gold mines in Mexico. Its other business activities include acquisition, exploration, development, extraction, processing, refining and reclamation. The company is organized into four operating mining segments, Guanacevi, Bolanitos, El Cubo, and El Compas, which are located in Mexico as well as Exploration and Corporate segments. Its Exploration segment consists of projects in the exploration and evaluation phases in Mexico and Chile.

Mark Reichman, Senior Research Analyst of Natural Resources, Noble Capital Markets, Inc.

Refer to the full report for the price target, fundamental analysis, and rating.

    Third quarter results. Endeavour reported third quarter net income of $451 thousand, or $0.00 per share, compared to a loss of $6.8 million, or ($0.05) per share during the prior year period. We had projected net income of $3.5 million, or $0.02 per share. Adjusted EBITDA were $11.4 million compared to $1.8 million during the prior year period and our estimate of $12.4 million. The variance to our estimate was due, in part, to higher costs including general and administration expense, royalties, and higher depreciation, depletion and amortization. Cash flow from operations increased to $15.6 million compared to $(5.3) million during the prior year period.

    Updating estimates.  To reflect third quarter results, we are lowering our 2020 EPS estimate to a loss of $(0.10) per share from a loss of $(0.08) per share. Our 2021 EPS estimate remains $0.16 and EBITDA moved up to $70.8 million from $70.1 million due to updated expense estimates, including non-cash depreciation …


This research is provided by Noble Capital Markets, Inc., a FINRA and S.E.C. registered broker-dealer (B/D).

*Analyst certification and important disclosures included in the full report. NOTE: investment decisions should not be based upon the content of this research summary.  Proper due diligence is required before making any investment decision. 

Genco Shipping & Trading Limited (GNK) – Turning More Favorable – Introducing 2021 EBITDA Estimate

Friday, November 06, 2020

Genco Shipping & Trading Limited (GNK)

Turning More Favorable – Introducing 2021 EBITDA Estimate

Genco Shipping & Trading Limited, incorporated on September 27, 2004, transports iron ore, coal, grain, steel products and other drybulk cargoes along shipping routes through the ownership and operation of drybulk carrier vessels. The Company is engaged in the ocean transportation of drybulk cargoes around the world through the ownership and operation of drybulk carrier vessels. As of December 31, 2016, its fleet consisted of 61 drybulk carriers, including 13 Capesize, six Panamax, four Ultramax, 21 Supramax, two Handymax and 15 Handysize drybulk carriers, with an aggregate carrying capacity of approximately 4,735,000 deadweight tons (dwt). Of the vessels in its fleet, 15 are on spot market-related time charters, and 27 are on fixed-rate time charter contracts. As of December 31, 2016, additionally, 19 of the vessels in its fleet were operating in vessel pools.

Poe Fratt, Senior Research Analyst, Noble Capital Markets, Inc.

Refer to the full report for the price target, fundamental analysis, and rating.

    Adjusted 3Q2020 EBITDA of $23.3 million was up sharply versus 2Q2020. Slightly below our estimate of $24.4 million due to TCE rates of $11.5k/day, or ~$280 below our estimate. In contrast to 2Q2020, 3Q2020 operating results benefitted from the recovery in the dry bulk market that started in June. TCE rates almost doubled from $6.7k/day and more than offset higher costs.

    Maintaining 2020 EBITDA estimate of $73.7 million and introducing 2021 EBITDA estimate of $129.5 million as higher TCE rate assumptions offset a smaller fleet.  Forward cover is lighter but TCE rates are higher with 57% of available 4Q2020 days booked at $13.0k/day, up from 3Q2020 cover of 62% of days booked at $11.6k/day. Firmer market fundamentals kicked in late 2Q2020, and 4Q2020 EBITDA should be …


This research is provided by Noble Capital Markets, Inc., a FINRA and S.E.C. registered broker-dealer (B/D).

*Analyst certification and important disclosures included in the full report. NOTE: investment decisions should not be based upon the content of this research summary.  Proper due diligence is required before making any investment decision. 

CoreCivic (CXW) – Reports Solid Third Quarter

Thursday, November 05, 2020

CoreCivic (CXW)

Reports Solid Third Quarter

CoreCivic is a diversified government solutions company with the scale and experience needed to solve tough government challenges in flexible, cost-effective ways. We provide a broad range of solutions to government partners that serve the public good through corrections and detention management, a growing network of residential reentry centers to help address America’s recidivism crisis, and government real estate solutions. We are a publicly traded real estate investment trust and the nation’s largest owner of partnership correctional, detention and residential reentry facilities. We also believe we are the largest private owner of real estate used by U.S. government agencies. The Company has been a flexible and dependable partner for government for more than 35 years. Our employees are driven by a deep sense of service, high standards of professionalism and a responsibility to help government better the public good.

Joe Gomes, Senior Research Analyst, Noble Capital Markets, Inc.

Refer to the full report for the price target, fundamental analysis, and rating.

    3Q Results. Revenue of $468.3 million, down 7.9% year-over-year, but nearly flat sequentially. Diluted EPS of $0.22 and adjusted EPS of $0.28, compared to $0.41 and $0.47 last year. Normalized FFO was $0.52 per share and AFFO was $0.49 per share versus $0.70 and $0.70, respectively, last year. Adjusted EBITDA of $94.6 million. We had forecast revenue of $462 million, EPS of $0.22, NFFO of $0.49, AFFO of $0.52, and adjusted EBITDA of $90.2 million.

    Segment Results.  Safety revenue came in at $420 million versus $458 million a year ago. Compensated occupancy rates fell to 72.1% from 83.4% a year ago, although revenue per compensated man day improved to $87.39 from $81.93. Segment operating income was $100.7 million. Community revenue declined to $24.1 million from $30.8 million. Occupancy was 54.6% versus 76.3%, while segment operating income …


This Company Sponsored Research is provided by Noble Capital Markets, Inc., a FINRA and S.E.C. registered broker-dealer (B/D).

*Analyst certification and important disclosures included in the full report. NOTE: investment decisions should not be based upon the content of this research summary.  Proper due diligence is required before making any investment decision. 

Will Solar Panels Continue to Be Subsidized for Households and Businesses?


The Solar Panel Investment Tax Credit Rebate Debate


The solar panel tax incentive has been helping homeowners save on electricity costs. The federal government provides the solar tax credit that allows homeowners and businesses to offset 26 percent of the cost of their solar panel systems. Some states provide additional tax credits. Low-cost solar financing options are available in many states and municipalities — utilities may also provide cash rebates or low-cost financing options that can reduce operating costs by 10 to 20 percent. In exchange, the home or business owner will receive a large reduction in their electric bills, an enhanced property value.  The federal investment tax credit (ITC) was reduced to 26% in 2020 from the initial level of 30%.  It is scheduled to decrease to 22% in 2021 and then goes away completely in 2022. With solar costs falling rapidly, a debate has begun over whether the federal ITC should be extended or allowed to sunset out.

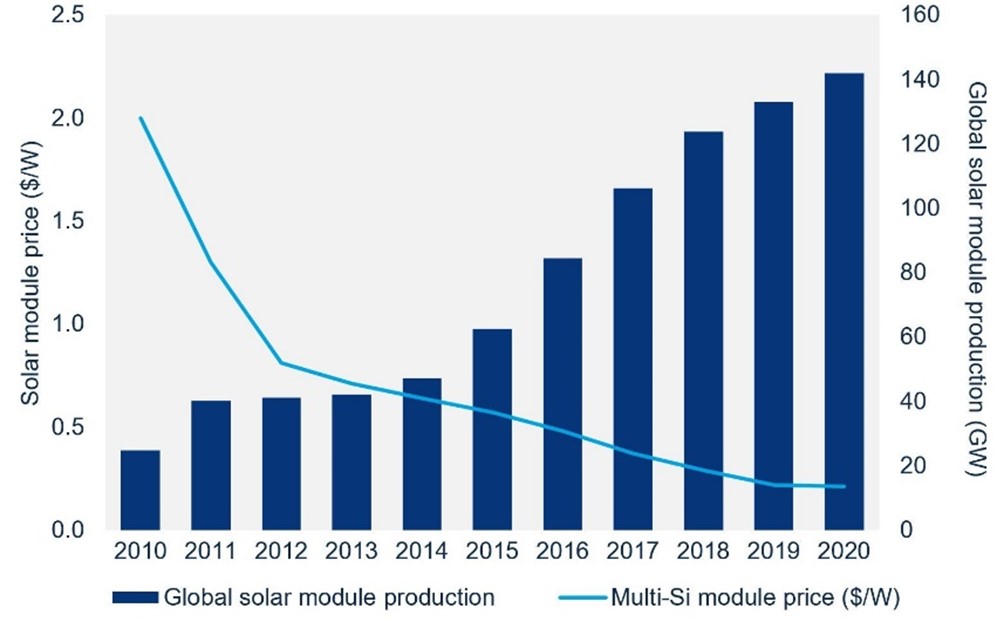
Solar costs are falling

According to the National Renewable Energy Laboratory, the installed price for residential solar systems is less than half of what it was ten years ago. Costs have decreased as production increases, and companies benefit from larger economies of scale. Residential solar systems generally cost $15,000 to $30,000 before incentives and, depending on the size of the system, $10,000 to $25,000 after applying the ITC.   Solar panels require very little maintenance and can be expected to save $2,000-$3,000 per year in electric costs.

Solar energy cost vs. Efficiency over 10-years


Investment returns are attractive but not without subsidies.

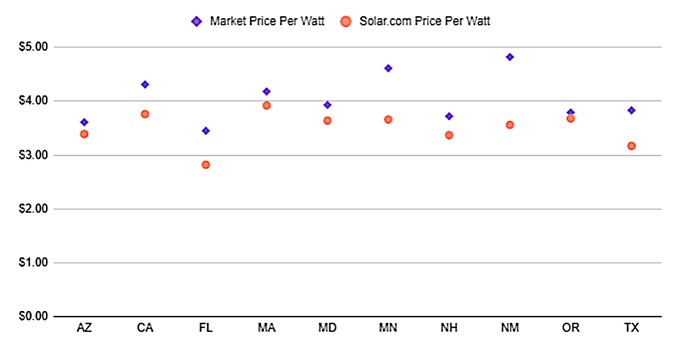
Solar energy systems can be expected to return 1.5 to 2.0 times the investment over the 25-year life of the system depending on the location. An investment in a residential solar system will generally provide a payback return of 10-15 years with subsidies. Such a return may not seem attractive compared to other investments, but it is worth noting that many systems are lasting longer than 25 years, thus providing a residual value. The figure below shows the relative cost savings over market prices in the ten largest solar markets.

A Comparison of the cost of electricity per kilowatt-hour by state (Market vs. Solar)


Conclusion

There are many reasons home, or business owners may want to consider adding solar panels. Solar panels are environmentally friendly, add to the home or business’s value, and provide a backup system to the local electric grid.  The return on investment is reasonable if subsidized. Absent subsidies, the investment is harder to justify for financial reasons. Costs may decrease if a 2018 tax on Chinese solar products is removed. Costs may also continue to drop as the industry continues to grow. Large-scale solar and wind farms no longer need subsidization to compete with fossil fuel power generation as costs have decreased with increased economies of scale. The same may be true for small-scale solar panels if tax credits are extended.


Suggested Reading:

Cobalt and Rare Earth Metals from the Ocean Floor Eyed to Meet Growing Battery Demand

Expect Today’s Nuclear Technologies to Provide an Important Role in the Future of Energy

This Is What Could Slam the Brakes on EV Growth

Enjoy Premium Channelchek Content at No Cost

Each event in our popular Virtual Road Shows Series has a maximum capacity of 100 online investors. To take part, listen to and perhaps get your questions answered, see which virtual investor meeting intrigues you here.


Sources:

https://www.energysage.com/solar/cost-benefit/solar-incentives-and-rebates/#:~:text=The%20federal%20government%20provides%20a,solar%20costs%20from%20their%20taxes, energysage, July 15, 2020

https://www.seia.org/initiatives/what-rebates-and-incentives-are-available-solar-energy, SEIA Solar Energy Industries Association

https://www.thesimpledollar.com/save-money/solar-cost-comparison-state-by-state/, Andy Bowen, the simpledollar, May 24, 2018

https://www.solar.com/learn/solar-panel-cost/

https://www.greentechmedia.com/articles/read/solar-pv-has-become-cheaper-and-better-in-the-2010s-now-what

Release – U.S. Gold Corp. (USAU) – Provides a PFS Update and Surface Sample Results

U.S. Gold Corp. Provides a PFS Update and Surface Sample Results up to 11.9 g/t Gold at the CK Gold Project in Wyoming


Pre-Feasibility Study (PFS) and additional technical studies well underway

ELKO, Nev., Nov. 5, 2020 /PRNewswire/ — U.S. Gold Corp. (NASDAQ: USAU) (the “Company”), a gold exploration and development company, is pleased to provide an update on the Pre-Feasibility Study (PFS) in progress at the CK Gold Project, located just outside of Cheyenne, Wyoming. Field activities have been ongoing since August, 2020.

Surface Sample Results

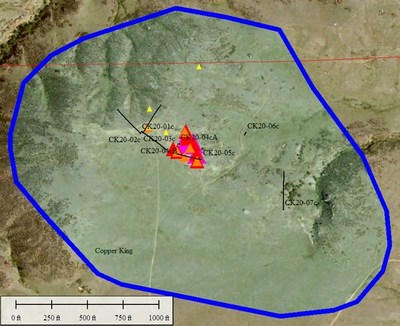
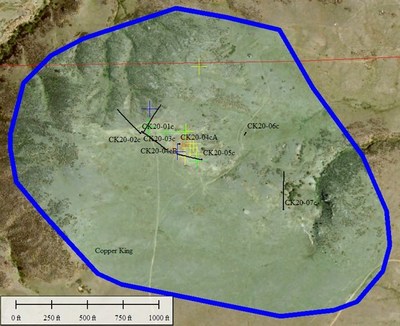
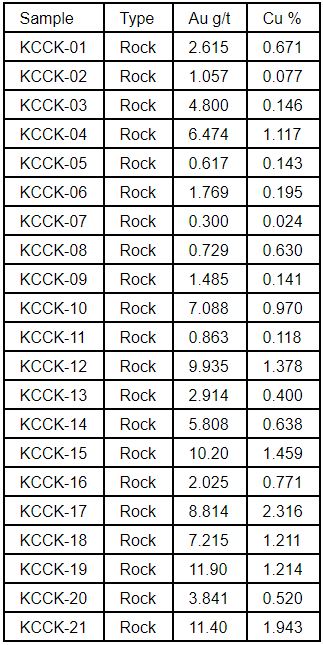
The attached maps show gold and copper values from a series of 21 surface samples taken at the start of current field season activities. Values shown are plotted on an image along with the outline of the open pit mine limit derived from the Preliminary Economic Assessment completed in 2017 by Mine Development Associates. See the news release dated January 11, 2017 for additional information. The Company anticipates that following drilling in 2017, 2018 and the current 2020 drill program, there will be an updated block model and new pit limit as part of the final PFS report, expected in the first half of 2021. In the attached maps the following symbols relate to the gold and copper grades encountered:

Figure 1: CK Gold Project – Gold in rock

Gold: > 0.3 g/t yellow triangles, > 1 g/t orange triangles, > 3.0 g/t red triangles, > 10.0 g/t magenta triangle

Figure 2: CK Gold Project – Copper in rock

Copper: 0.5 % yellow crosses, > 1.0% orange crosses, > 2.0% red crosses

Table 1. CK Gold Project Rock Samples

Surface samples taken at the CK Gold Project represent samples of interest that may have originated from either surface outcrop, surface erosional float or dump material discarded from an old 80 ft shaft, lateral development or adits into the near surface portion of the resource. The grades of the samples, while encouraging and indicative of values that might be encountered in the deposit, do not necessarily reflect any significant change to the overall resource grade as reported in the Preliminary Economic Assessment completed in 2017 by Mine Development Associates. See the news release dated January 11, 2017 for additional information.

Pre-Feasibility and Project Study Progress

The following bullet points outline progress to date

  • August initiated PFS Study for the CK Gold Project with associated consultants
  • August 5th commenced complete re-log of historic drill core with oversight from highly experience consulting geologists
  • September 5th kick-off meeting with diamond drill crew at project site
  • October 2nd completed last of seven diamond core drill holes totaling 4,651 ft (1,418 m) to gather metallurgical samples from representative areas of the known resource
  • October 3rd initiated the first of five planned geotechnical and hydrological diamond core holes to be completed in early November. Approximately 4,800 ft planned
  • October 15th R/C drill rig on site to commence drilling on 6 well/monitoring holes for site water characterization and up to 10 exploratory holes aimed at infill drilling to convert inferred resource to measured/indicated category, as well as expand limits of known resources. Drilling will continue into November dependent on weather and progress and we anticipate a total footage of 12,000 ft before we demobilize for winter
  • Contracted hydrological consultants to characterize local groundwater hydrology, open pit hydrology and surface hydro-geochemistry. Also, to establish project baseline for the natural hydrological conditions. Falling head and packer testing is ongoing during the drilling program
  • Contracted geotechnical consultants to establish open pit stability and design parameters. Specific geotechnical logging, point load testing and lab sample selection is ongoing during the drilling program
  • Contracted local environmental and permitting specialist to assist with environmental baseline program design and capture, permit application preparation. This includes the deployment of a monitoring station and assessment of drainages for any potential wetland impact
  • Monitoring the delivery, chain of custody and QA/QC for assay values at the laboratory, prioritizing metallurgical samples to allow metallurgical work to commence later in the year as soon as representative composites can be identified once assay results are in

In commenting on the sample values received and the progress to date, George Bee, President of U.S. Gold Corp. stated, “We are grateful for the collaboration that we have had from all our consultants and drill contractors. They are doing an outstanding, safe and responsible job. We also thank our local hosts, including the respective Wyoming agencies who have been very helpful to date and the local ranch owner who holds grazing rights on our mineral leases.” Mr. Bee went on to say; “It is very encouraging to see the good grade samples from outcrops on surface that support our thesis about the project. We are also going well beyond the minimal PFS requirements and capturing baseline data to put the company into a position to rapidly advance the project once we have the PFS results in hand.”

COVID-19 Policy

U.S. Gold Corp. recognizes the heightened health risks associated with the current pandemic. At this stage of the CK Gold Project development, focusing largely on the gathering of information from the field, our personnel, contractors and consultants do not need to come into close contact with others apart from work within individual pods such as the drill crew and core logging personnel. Much of our work is conducted outdoors and physically separated. Meetings are conducted from remote locations using available video conferencing software. When it is necessary for individuals to meet or visit facilities, health guidelines are followed to avoid and minimize the risk of spreading the COVID-19 virus. We take the health and safety all those associated with our activities very seriously. If necessary we will suspend activities and observe quarantine regimens until any health uncertainty passes.

Note on Qualified Person

QP Review: This statement has been reviewed by Kevin Francis, P Geo, RM, Principle of Mineral Resource Management LLC who has inspected the data furnished in this announcement and has knowledge of the activities outlined in the CK Gold Project update. Acting within the scope of his expertise, Mr. Francis as a Qualified Person, has reviewed the information provided and finds it to be accurate and reflecting facts.

About U.S. Gold Corp.

U.S. Gold Corp. is a publicly traded, U.S. focused gold exploration and development company. U.S. Gold Corp. has a portfolio of exploration properties. Copper King, now the CK Gold Project, is located in Southeast Wyoming and has a Preliminary Economic Assessment (PEA) technical report, which was completed by Mine Development Associates. Keystone and Maggie Creek are exploration properties on the Cortez and Carlin Trends in Nevada. The Challis Gold Project is located in Idaho. For more information about U.S. Gold Corp., please visit www.usgoldcorp.gold

Safe Harbor


Certain statements in this press release are forward-looking within the meaning of the Private Securities Litigation Reform Act of 1995. These statements may be identified by the use of forward-looking words such as “anticipate,” “believe,” “forecast,” “estimated,” and “intend,” among others. These forward-looking statements are based on U.S. Gold Corp.’s current expectations, and actual results could differ materially from such statements. There are a number of factors that could cause actual events to differ materially from those indicated by such forward-looking statements. These factors include, but are not limited to, risks arising from: the prevailing market conditions for metal prices and mining industry cost inputs, environmental and regulatory risks, risks faced by junior companies generally engaged in exploration activities, whether U.S. Gold Corp. will be able to raise sufficient capital to implement future exploration programs, COVID-19 uncertainties, and other factors described in the Company’s most recent Annual Report on Form 10-K, Quarterly Reports on Form 10-Q, and Current Reports on Form 8-K filed with the Securities and Exchange Commission, which can be reviewed at www.sec.gov. The Company has based these forward-looking statements on its current expectations and assumptions about future events. While management considers these expectations and assumptions to be reasonable, they are inherently subject to significant business, economic, competitive, regulatory, and other risks, contingencies, and uncertainties, most of which are difficult to predict and many of which are beyond the Company’s control. The Company makes no representation or warranty that the information contained herein is complete and accurate and we have no duty to correct or update any information contained herein.

For additional information, please contact:

U.S. Gold Corp. Investor Relations: +1 800 557 4550
[email protected]
www.usgoldcorp.gold

SOURCE U.S. Gold Corp.

Tribune Publishing Company (TPCO) – Raising Estimates And Our Price Target

Thursday, November 05, 2020

Tribune Publishing Company (TPCO)

Raising Estimates And Our Price Target

Tribune Publishing Co is a print and online media company that publishes various newspapers and websites. It creates and distribute content across its media portfolio, offering integrated marketing, media, and business services to consumers and advertisers, including digital solutions and advertising opportunities. The company manages its business as two distinct segments, M and X. Segment M is comprised of the company’s media groups excluding their digital revenues and related digital expenses, except digital subscription revenues when bundled with a print subscription. Segment X includes the company’s digital revenues and related digital expenses from local Tribune websites, third party websites, mobile applications, digital only subscriptions, Tribune Content Agency and BestReviews.

Michael Kupinski, Director of Research, Noble Capital Markets, Inc.

Refer to the full report for the price target, fundamental analysis, and rating.

    Beats Q3 expectations. The company beats our cash flow (as measured by Adjusted EBITDA) estimate, $27.2 million versus our estimate of $15.7 million on in line revenues of $188.6 million.

    Strong expense reductions.  The pandemic highlighted the ability of the company to have a flexible, home-based workforce, which eliminated the need for expensive office space. For instance, over 1/2 of the company’s papers no longer have office based newsrooms, a significant savings. We believe that there are additional costs to cut …


This Company Sponsored Research is provided by Noble Capital Markets, Inc., a FINRA and S.E.C. registered broker-dealer (B/D).

*Analyst certification and important disclosures included in the full report. NOTE: investment decisions should not be based upon the content of this research summary.  Proper due diligence is required before making any investment decision. 

Lineage Cell Therapeutics (LCTX) – Q3 2020 Earnings OpRegen Data Update at AAO

Thursday, November 05, 2020

Lineage Cell Therapeutics (LCTX)

Q3 2020 Earnings: OpRegen Data Update at AAO

Lineage Cell Therapeutics, Inc. (NYSE American: LCTX) is a clinical-stage biotechnology company developing novel cell therapies for unmet medical needs. Lineage’s programs are based on its robust proprietary cell-based therapy platform and associated in-house development and manufacturing capabilities. With this platform Lineage develops and manufactures specialized, terminally differentiated human cells from its pluripotent and progenitor cell starting materials. These differentiated cells are developed to either replace or support cells that are dysfunctional or absent due to degenerative disease or traumatic injury or administered as a means of helping the body mount an effective immune response to cancer. Lineage’s clinical programs are in markets with billion dollar opportunities and include three allogeneic (“off-the-shelf”) product candidates: (i) OpRegen®, a retinal pigment epithelium transplant therapy in Phase 1/2a development for the treatment of dry age-related macular degeneration, a leading cause of blindness in the developed world; (ii) OPC1, an oligodendrocyte progenitor cell therapy in Phase 1/2a development for the treatment of acute spinal cord injuries; and (iii) VAC, an allogeneic dendritic cell therapy platform for immuno-oncology and infectious disease, currently in clinical development for the treatment of non-small cell lung cancer and in preclinical development for additional cancers and as a vaccine against infectious diseases, including SARS-CoV-2, the virus which causes COVID-19. For more information, please visit www.lineagecell.com or follow the Company on Twitter @LineageCell.

Ahu Demir, Ph. D., Biotechnology Research Analyst, Noble Capital Markets, Inc.

Refer to the full report for the price target, fundamental analysis, and rating.

    Nearest term catalyst: OpRegen data update at AAO. Lineage reported third quarter financial results On November 4, 2020. The company achieved multiple milestones and made progress on its three clinical programs. We believe the nearest term value generating catalyst for the company is the OpRegen program. The company will present updated interim results from the ongoing Phase 1/2a study of OpRegen at the 2020 American Academy of Ophthalmology Annual Meeting (AAO 2020) on November 15 and 17, 2020.

    The company intends to step into oncology indications.  In addition to OpRegen, the company disclosed preliminary data from VAC2 in collaboration with Cancer Research UK (CR UK). Lineage will reacquire VAC2 to further develop the asset in the clinic and plans to initiate a Phase 1/2 clinical trial assessing VAC2 in non-small cell lung cancer or other indications in 2021 …


This Company Sponsored Research is provided by Noble Capital Markets, Inc., a FINRA and S.E.C. registered broker-dealer (B/D).

*Analyst certification and important disclosures included in the full report. NOTE: investment decisions should not be based upon the content of this research summary.  Proper due diligence is required before making any investment decision. 

Great Lakes Dredge & Dock (GLDD) – Another Good Quarter – Execution Remains Solid

Thursday, November 05, 2020

Great Lakes Dredge & Dock (GLDD)

Another Good Quarter – Execution Remains Solid

Great Lakes Dredge & Dock Corp is a provider of dredging services in the United States. The company only’s operating segments is Dredging. Dredging involves the enhancement or preservation of navigability of waterways or the protection of shorelines through the removal or replenishment of soil, sand or rock. Its projects portfolio includes Coastal Restoration, Coastal Protection, Port expansion, and others.

Poe Fratt, Senior Research Analyst, Noble Capital Markets, Inc.

Refer to the full report for the price target, fundamental analysis, and rating.

    3Q2020 operating results were in line expectations including loss of hire benefit. Total revenue of $175.8 million was close to our estimate of $176.5 million and profitability was in line with expectations. Adjusted EBITDA of $32.2 million was in line with expectations of $32.1 million due to a loss of hire benefit of $1.7 million, and EBITDA margin of 18.3% was in line with expectations of 18.2%.

    Moving 2020 EBITDA estimate to $155.2 million.  Positive dredging market outlook intact, but costs moving slightly higher. Introducing 2021 EBITDA estimate of $150.4 million. Bar is high after strong outperformance this year …


This Company Sponsored Research is provided by Noble Capital Markets, Inc., a FINRA and S.E.C. registered broker-dealer (B/D).

*Analyst certification and important disclosures included in the full report. NOTE: investment decisions should not be based upon the content of this research summary.  Proper due diligence is required before making any investment decision. 

Energy Fuels (UUUU)(EFR:CA) – Moving from Concept to Reality

Thursday, November 05, 2020

Energy Fuels (UUUU)(EFR:CA)

Moving from Concept to Reality

As of April 24, 2020, Noble Capital Markets research on Energy Fuels is published under ticker symbols (UUUU and EFR:CA). The price target is in USD and based on ticker symbol UUUU. Research reports dated prior to April 24, 2020 may not follow these guidelines and could account for a variance in the price target.

Energy Fuels is the largest uranium producer in the U.S. and holds more production capacity and uranium resources than any other U.S. producer. The Company also produces vanadium. Headquartered in Colorado, Energy Fuels holds three of America’s key uranium production centers: the White Mesa Mill in Utah, the Nichols Ranch ISR Facility in Wyoming, and the Alta Mesa ISR Facility in Texas. The producing White Mesa Mill is the only conventional uranium mill in the U.S. and has a licensed capacity of 8 million pounds of U3O8 per year. Nichols Ranch is in production and has a licensed capacity of 2 million pounds of U3O8 per year. Alta Mesa is currently on standby. Energy Fuels also owns several licensed and developed uranium and vanadium mines on standby and other projects in development.

Mark Reichman, Senior Research Analyst of Natural Resources, Noble Capital Markets, Inc.

Refer to the full report for the price target, fundamental analysis, and rating.

    Expanding the product portfolio. Energy Fuels announced its rare earth strategy in April 2020 with the goal of making minor modifications to its operations to enable the processing of uranium and rare earth ores at its White Mesa Mill. Ores would be sourced from third parties, either through ore purchase, tolling, or other arrangements. Energy Fuels would produce concentrates while also recovering uranium from the ore.

    Successful pilot production.  The company announced production of rare earth element (REE) concentrate on a pilot scale at its White Mesa Mill. The concentrate was produced at the mill from one tonne of monazite sands from a North American source. The rare earth elements found in the concentrate include Cerium, Lanthanum, and high value magnet metals Neodymium and Praseodymium (NdPr) oxide which is …


This Company Sponsored Research is provided by Noble Capital Markets, Inc., a FINRA and S.E.C. registered broker-dealer (B/D).

*Analyst certification and important disclosures included in the full report. NOTE: investment decisions should not be based upon the content of this research summary.  Proper due diligence is required before making any investment decision. 

Aurania Resources (AUIAF)(ARU:CA) – Aurania Provides Update on Drilling Program Closes Equity Financing

Thursday, November 05, 2020

Aurania Resources (AUIAF)(ARU:CA)

Aurania Provides Update on Drilling Program; Closes Equity Financing

As of April 24, 2020, Noble Capital Markets research on Aurania Resources is published under ticker symbols (AUIAF and ARU:CA). The price target is in USD and based on ticker symbol AUIAF. Research reports dated prior to April 24, 2020 may not follow these guidelines and could account for a variance in the price target.

Aurania Resources Ltd. is a Canada-based junior mining exploration company engaged in the identification, evaluation, acquisition, and exploration of mineral property interests, with a focus on precious metals and copper. Its flagship asset, The Lost Cities-Cutucu Project, is in southeastern Ecuador in the Province of Morona-Santiago. The company also has several minor projects in Switzerland.

Mark Reichman, Senior Research Analyst of Natural Resources, Noble Capital Markets, Inc.

Refer to the full report for the price target, fundamental analysis, and rating.

    Drilling program at Tsenken. Drilling commenced on the Tsenken N2 copper-silver target in September using a portable rig to test both porphyry copper targets as well as sedimentary-hosted copper-silver deposits. While results have not yet been received, three bore holes (1-3) were drilled and assays were sent to the laboratory. The rig was moved to test the Tsenken N3 target with three drill holes (4-6) planned. Hole 4 was completed and Hole 5 is in progress. The company intends to conduct an MMT survey shortly which will provide magnetic, resistivity and conductivity information and should take about 3-4 weeks to complete. Other targets at Tsenken include N1, N4, and B.

    Iron-Oxide Copper-Gold system.  While management initially contemplated Tsenken N2 as a porphyry target, drilling intersected a mineral alteration zone typical of an iron oxide copper-gold system (IOCG). Management would like to better define the large mineral zone so that they can identify the core of the system where copper and gold is likely to be concentrated …


This Company Sponsored Research is provided by Noble Capital Markets, Inc., a FINRA and S.E.C. registered broker-dealer (B/D).

*Analyst certification and important disclosures included in the full report. NOTE: investment decisions should not be based upon the content of this research summary.  Proper due diligence is required before making any investment decision. 

Release – CoreCivic (CXW) – CoreCivic Reports Third Quarter 2020 Financial Results

CoreCivic Reports Third Quarter 2020 Financial Results


BRENTWOOD, Tenn., Nov. 04, 2020 — CoreCivic, Inc. (NYSE: CXW) (the Company) announced today its financial results for the third quarter of 2020.

Financial Highlights – Third Quarter 2020

  • Total revenue of $468.3 million
    • CoreCivic Safety revenue of $420.0 million
    • CoreCivic Community revenue of $24.1 million
    • CoreCivic Properties revenue of $24.1 million
  • Net income attributable to common stockholders of $26.7 million
  • Diluted EPS of $0.22
  • Adjusted diluted EPS of $0.28
  • Normalized FFO per diluted share of $0.52
  • Adjusted EBITDA of $94.6 million
  • Repaid $102.2 million in total debt, net of the change in cash

Damon T. Hininger, CoreCivic’s President and Chief Executive Officer, said, “Our business and our dedicated professionals continue to perform admirably through the COVID-19 pandemic, working diligently to provide essential services while attentively implementing and adhering to protocols designed to protect each other and those in our care. We remain a critical solution to our government partners who are also facing pandemic-related challenges. Our cash flow generation remains strong, and we are executing on our revised capital allocation strategy of prioritizing our substantial free cash flow to reduce debt. In the third quarter alone we repaid over $100 million in long-term debt, net of the change in cash, increasing our financial flexibility. We are committed to using our free cash flow in a manner that serves the long-term best interest of our shareholders, our business, our government partners, and the people and communities we together serve, and we are pleased with our progress. Finally, we continue to evaluate the potential sale of certain non-core real estate assets in our Properties segment, and are optimistic with the interest expressed to date. Generating net proceeds from these asset sales should enable us to accelerate our revised capital allocation strategy.

“In continuation of an initiative we began three years ago, we’re also pleased to have announced last month our support for a slate of new policies, including the restoration of Pell Grants for incarcerated individuals, the restoration of voting rights for the formerly incarcerated, and licensure reform to make it easier for the formerly incarcerated to find and keep jobs. With the legislative progress that’s been made, we believe now is the time to step up – not slow down – our commitment to programs and policies that reduce recidivism,” added Hininger.

Third Quarter 2020 Financial Results Compared With Third Quarter 2019

Net income attributable to common stockholders generated in the third quarter of 2020 totaled $26.7 million, or $0.22 per diluted share, compared with $49.0 million, or $0.41 per diluted share, in the third quarter of 2019. Adjusted for special items, net income in the third quarter of 2020 was $34.1 million, or $0.28 per diluted share (Adjusted Diluted EPS), compared with adjusted net income in the third quarter of 2019 of $55.9 million, or $0.47 per diluted share. Special items in the third quarter of 2020 included $4.7 million in expenses associated with changes in our corporate tax structure, $2.8 million in expenses associated with COVID-19, $0.8 million of asset impairments, $0.6 million in contingent consideration for acquisition of businesses, and a $1.6 million gain on the sale of real estate assets, net of taxes. Special items in the third quarter of 2019 included $6.8 million in start-up expenses and $0.1 million of expenses associated with mergers and acquisitions (M&A).

Funds From Operations (FFO) was $53.4 million, or $0.44 per diluted share, in the third quarter of 2020, compared to $76.3 million, or $0.64 per diluted share, in the third quarter of 2019. Normalized FFO, which excludes the special items described above, was $62.3 million, or $0.52 per diluted share, in the third quarter of 2020, compared with $83.1 million, or $0.70 per diluted share, in the third quarter of 2019.

EBITDA was $87.8 million in the third quarter of 2020, compared with $108.5 million in the third quarter of 2019. Adjusted EBITDA was $94.6 million in the third quarter of 2020, compared with $115.4 million in the third quarter of 2019. Adjusted EBITDA excludes the special items described above.

Financial results in the third quarter of 2020, compared with the third quarter of 2019, decreased primarily because of lower utilization of our existing contracts with Immigration and Customs Enforcement, or ICE, and modest utilization declines across many of our state-level contracts due to the ongoing impact of COVID-19. Financial results were also negatively impacted by the transition at our Cimarron Correctional Facility in Oklahoma from state populations to the U.S. Marshals Service, or USMS, resulting from a new contract executed in September 2020. Further, per share results in the third quarter of 2019 include $0.03, net of tax, for the favorable settlement of a contractual dispute with respect to revenues that would have been recognized during the previous several years, and $0.02 per share for a bonus award earned under one of our contracts with the Federal Bureau of Prisons, or BOP, for exceptional operating performance.

The declines in contract utilization were partially offset by utilization under new contracts executed in 2019 with (i) the USMS, to activate our previously idle 1,422-bed Eden Detention Center in Texas, (ii) ICE to activate our previously idle 910-bed Torrance County Detention Facility in New Mexico and to utilize capacity at our 2,232-bed Adams County Correctional Center in Mississippi, and (iii) the states of Mississippi, Kansas and Idaho to utilize available capacity at our 2,672-bed Tallahatchie County Correctional Facility in Mississippi and our 1,896-bed Saguaro Correctional Facility in Arizona. Financial results in our Properties segment were also favorably impacted by the commencement of new leases in July 2020 with the Commonwealth of Kentucky at our Southeast Correctional Complex, and in January 2020 with the state of Kansas at our newly constructed Lansing Correctional Facility.

Balance Sheet and Liquidity as of September 30, 2020

As of September 30, 2020, cash on hand was $282.5 million, with an additional $329.2 million available under our revolving credit facility. Net cash provided by operating activities was $107.2 million during the third quarter of 2020, compared with $75.4 million and $98.9 million in the first and second quarters of 2020, respectively. Net cash provided by operating activities enabled us to repay $102.2 million of total debt during the third quarter of 2020, net of the change in cash and cash equivalents, increasing our financial flexibility. We have no material capital commitments, and no debt maturities until October 2022, when $250.0 million of 5.0% unsecured notes matures. We currently expect to repay these notes upon maturity with cash on hand.

Business Development Update

New Management Contract with the United States Marshals Service at the Cimarron Correctional Facility. On September 15, 2020, we entered into a new contract under an Intergovernmental Agreement between the city of Cushing, Oklahoma and the USMS to utilize the Company’s 1,692-bed Cimarron Correctional Facility in Cushing, Oklahoma. The Company previously announced the intention to idle the Cimarron Correctional Facility during the third quarter of 2020, largely due to a lower number of inmate populations from the state of Oklahoma resulting from COVID-19, combined with the consequential impact of COVID-19 on the State’s budget. The new management contract commenced on September 15, 2020, and has an initial term of three years, with unlimited 24-month extension options following the initial term upon mutual agreement. As of September 30, 2020, we cared for 693 USMS detainees at the Cimarron facility. During 2019, and for the nine months ended September 30, 2020, this facility generated facility net operating income of $2.4 million and incurred an operating loss of $2.8 million, respectively. We expect an improvement in facility net operating income at this facility as a result of the new contract, with annual revenues increasing to approximately $30 million at current utilization levels, and an operating margin that approximates the average CoreCivic Safety operating margin percentage.

New Management Contract with the state of Idaho. On August 17, 2020, we entered into a new contract with the Idaho Department of Correction, or IDOC, to care for up to 1,200 adult male inmates at our 1,896-bed Saguaro Correctional Facility. Subject to available capacity, we may also care for IDOC inmates at our 4,128-bed Central Arizona Florence Correctional Complex under terms of the contract. The new management contract with the IDOC commenced on August 18, 2020, and has an initial term of five years, with unlimited extension options thereafter upon mutual agreement. We began accepting inmate populations into the Saguaro facility on August 18, 2020.

New Management Contract with the Federal Bureau of Prisons for Reentry Services. On October 1, 2020, we were awarded a new contract by the BOP for residential reentry and home confinement services at our 289-bed Turley Residential Center in Tulsa, Oklahoma and our 494-bed Oklahoma Reentry Opportunity Center in Oklahoma City, Oklahoma. As a result, we expect to reactivate the Turley Residential Center during the first quarter of 2021 and provide the BOP additional reentry services at our Oklahoma Reentry Opportunity Center which will supplement existing utilization by the state of Oklahoma.

Financial Guidance

On April 1, 2020, we withdrew our financial guidance because of uncertainties associated with COVID-19, and do not expect to provide financial guidance until we have further clarity around the uncertainties which continue to exist. Our business is very durable, and continues to generate cash flow even during these unprecedented disruptions to the economy and criminal justice system. This resiliency is due to the essential nature of our facilities and services in our Safety and Community segments, further enhanced by the diversification and stability of our Properties segment, all supported by payments from highly rated federal, state, and local government agencies.

Supplemental Financial Information and Investor Presentations

We have made available on our website supplemental financial information and other data for the third quarter of 2020. Interested parties may access this information through our website at http://ir.corecivic.com/ under “Financial Information” of the Investors section. We do not undertake any obligation, and disclaim any duties to update any of the information disclosed in this report.

Management may meet with investors from time to time during the fourth quarter of 2020. Written materials used in the investor presentations will also be available on our website beginning on or about November 16, 2020. Interested parties may access this information through our website at http://ir.corecivic.com/ under “Events & Presentations” of the Investors section.

Conference Call, Webcast and Replay Information

We will host a webcast conference call at 10:00 a.m. Central Time (11:00 a.m. Eastern Time) on Thursday, November 5, 2020, to discuss our third quarter 2020 financial results and business outlook. Interested parties may access this information through our website at http://ir.corecivic.com/ under “Events & Presentations” of the Investors page. The live broadcast can also be accessed by dialing 800-367-2403 in the U.S. and Canada, including the confirmation passcode 9125625. The conference call will be archived on our website following the completion of the call. In addition, there will be a telephonic replay available beginning at 1:00 p.m. central time (2:00 p.m. eastern time) on November 5, 2020, through 1:00 p.m. central time (2:00 p.m. eastern time) on November 13, 2020. To access the telephonic replay, dial 888-203-1112 in the U.S. and Canada. International callers may dial +1 719-457-0820 and enter passcode 8097453.

About CoreCivic

The Company is a diversified government solutions company with the scale and experience needed to solve tough government challenges in flexible, cost-effective ways. We provide a broad range of solutions to government partners that serve the public good through corrections and detention management, a network of residential reentry centers to help address America’s recidivism crisis, and government real estate solutions. We are a publicly traded real estate investment trust and the nation’s largest owner of partnership correctional, detention and residential reentry facilities. We also believe we are the largest private owner of real estate used by U.S. government agencies. The Company has been a flexible and dependable partner for government for more than 35 years. Our employees are driven by a deep sense of service, high standards of professionalism and a responsibility to help government better the public good. Learn more at http://ir.corecivic.com/.

Forward-Looking Statements

This press release contains statements as to our beliefs and expectations of the outcome of future events that are “forward-looking” statements within the meaning of Section 21E of the Securities Exchange Act of 1934, as amended, and the Private Securities Litigation Reform Act of 1995. These forward-looking statements are subject to risks and uncertainties that could cause actual results to differ materially from the statements made. These include, but are not limited to, the risks and uncertainties associated with: (i) changes in government policy, legislation and regulations that affect utilization of the private sector for corrections, detention, and residential reentry services, in general, or our business, in particular, including, but not limited to, the continued utilization of the South Texas Family Residential Center (STFRC) by ICE under terms of the current contract, and the impact of any changes to immigration reform and sentencing laws (our company does not, under longstanding policy, lobby for or against policies or legislation that would determine the basis for, or duration of, an individual’s incarceration or detention); (ii) our ability to obtain and maintain correctional, detention, and residential reentry facility management contracts because of reasons including, but not limited to, sufficient governmental appropriations, contract compliance, negative publicity and effects of inmate disturbances; (iii) changes in the privatization of the corrections and detention industry, the acceptance of our services, the timing of the opening of new facilities and the commencement of new management contracts (including the extent and pace at which new contracts are utilized), as well as our ability to utilize available beds; (iv) general economic and market conditions, including, but not limited to, the impact governmental budgets can have on our contract renewals and renegotiations, per diem rates, and occupancy; (v) fluctuations in our operating results because of, among other things, changes in occupancy levels, competition, contract renegotiations or terminations, increases in costs of operations, fluctuations in interest rates and risks of operations; (vi) the duration of the federal government’s denial of entry at the United States southern border to asylum-seekers and anyone crossing the southern border without proper documentation or authority in an effort to contain the spread of COVID-19; (vii) government and staff responses to staff or residents testing positive for COVID-19 within public and private correctional, detention and reentry facilities, including the facilities we operate; (viii) the location and duration of shelter in place orders and other restrictions associated with COVID-19 that disrupt the criminal justice system, along with government policies on prosecutions and newly ordered legal restrictions that affect the number of people placed in correctional, detention, and reentry facilities; (ix) whether revoking our REIT election and our revised capital allocation strategy can be implemented in a cost effective manner that provides the expected benefits, including facilitating our planned debt reduction initiative and planned return of capital to shareholders; (x) our ability to identify and consummate the sale of certain non-core assets at attractive prices; (xi) our ability to successfully identify and consummate future development and acquisition opportunities and our ability to successfully integrate the operations of our completed acquisitions and realize projected returns resulting therefrom; (xii) our ability, following the revocation of our REIT election, to identify and initiate service opportunities that were unavailable under the REIT structure; (xiii) our ability to meet and maintain qualification for taxation as a REIT for the years the Company elected REIT status; and (xiv) the availability of debt and equity financing on terms that are favorable to us, or at all. Other factors that could cause operating and financial results to differ are described in the filings we make from time to time with the Securities and Exchange Commission.

The Company takes no responsibility for updating the information contained in this press release following the date hereof to reflect events or circumstances occurring after the date hereof or the occurrence of unanticipated events or for any changes or modifications made to this press release or the information contained herein by any third-parties, including, but not limited to, any wire or internet services.

See CoreCivic’s website for Supplemental Financial Information For the Quarter Ended September 30, 2020

NOTE TO SUPPLEMENTAL FINANCIAL INFORMATION

Adjusted Net Income, EBITDA, Adjusted EBITDA, FFO, and Normalized FFO, and, where appropriate, their corresponding per share metrics are non-GAAP financial measures. The Company believes that these measures are important operating measures that supplement discussion and analysis of the Company’s results of operations and are used to review and assess operating performance of the Company and its properties and their management teams. The Company believes that it is useful to provide investors, lenders and security analysts disclosures of its results of operations on the same basis that is used by management. FFO, in particular, is a widely accepted non-GAAP supplemental measure of REIT performance, grounded in the standards for FFO established by the National Association of Real Estate Investment Trusts (NAREIT).

NAREIT defines FFO as net income computed in accordance with GAAP, excluding gains (or losses) from sales of property and extraordinary items, plus depreciation and amortization of real estate and impairment of depreciable real estate and after adjustments for unconsolidated partnerships and joint ventures calculated to reflect funds from operations on the same basis. EBITDA, Adjusted EBITDA, and Normalized FFO are useful as supplemental measures of performance of the Company’s properties because such measures do not take into account depreciation and amortization, or with respect to EBITDA, the impact of the Company’s tax provisions and financing strategies. Because the historical cost accounting convention used for real estate assets requires depreciation (except on land), this accounting presentation assumes that the value of real estate assets diminishes at a level rate over time. Because of the unique structure, design and use of the Company’s properties, management believes that assessing performance of the Company’s properties without the impact of depreciation or amortization is useful. The Company may make adjustments to FFO from time to time for certain other income and expenses that it considers non-recurring, infrequent or unusual, even though such items may require cash settlement, because such items do not reflect a necessary or ordinary component of the ongoing operations of the Company. Start-up expenses represent the incremental operating losses incurred during the period we activate idle correctional facilities. Normalized FFO excludes the effects of such items. The Company calculates Adjusted Net Income by adding to GAAP Net Income expenses associated with the Company’s debt refinancing, M&A activity, start-up expenses, and certain impairments and other charges that the Company believes are unusual or non-recurring to provide an alternative measure of comparing operating performance for the periods presented. Even though expenses associated with mergers and acquisitions may be recurring, the magnitude and timing fluctuate based on the timing and scope of M&A activity, and therefore, such expenses, which are not a necessary component of the ongoing operations of the Company, may not be comparable from period to period.

Other companies may calculate Adjusted Net Income, EBITDA, Adjusted EBITDA, FFO, and Normalized FFO differently than the Company does, or adjust for other items, and therefore comparability may be limited. Adjusted Net Income, EBITDA, Adjusted EBITDA, FFO, and Normalized FFO and, where appropriate, their corresponding per share measures are not measures of performance under GAAP, and should not be considered as an alternative to cash flows from operating activities, a measure of liquidity or an alternative to net income as indicators of the Company’s operating performance or any other measure of performance derived in accordance with GAAP. This data should be read in conjunction with the Company’s consolidated financial statements and related notes included in its filings with the Securities and Exchange Commission.

Contact:

Investors: Cameron Hopewell – Managing Director, Investor Relations – (615) 263-3024
Financial Media: David Gutierrez, Dresner Corporate Services – (312) 780-7204


The Prolonged Vote Counting Impact on the Stock Market


The FAANGs Come Out During Election Uncertainty


Investors trying to determine what impact the tight presidential race has had on the stock market may find stocks related to remote working and online communication have again become stock market leaders.

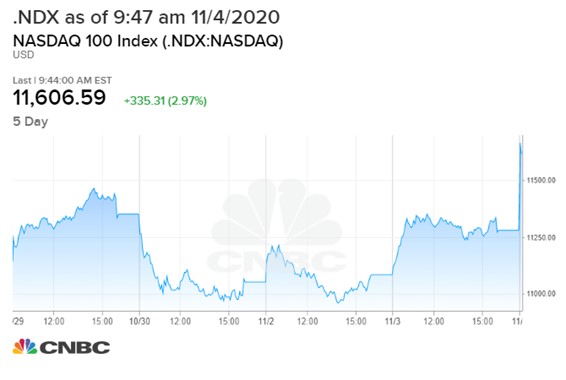
Clear election night winners include the NASDAQ 100 as indicated by futures contract trading. The tech-heavy Nasdaq 100 Index (NDX) is a basket of the 100 largest, most actively traded U.S companies listed on the Nasdaq exchange. Among the largest within the index are Apple (AAPL), Microsoft (MSFT), Amazon (AMZN), and Facebook (FB).


December 2020 contracts were up more than 3% overnight, with some of the largest gains coming after the President shared his concern about vote-counting efforts. Currently, both President Donald Trump and Challenger Joe Biden still have mathematical paths to occupying the White House over the next four years. Mega-cap stocks running out ahead of other stocks has been a theme during the COVID-19. The FAANG trend had recently reversed as election polls pointed to a Biden win.

In addition to the uncertain presidential race outcome, many expected a clear Democratic sweep within Congress. The reasoning was that Democrats are expected to be more inclined to put forth the largest stimulus package. The coming make-up of Congress is not expected to alter the strength much in either direction.

Recently the small cap Russel 2000 Index (RUT) has been outperforming the Nasdaq 100. Investors, for now, seem to be again favoring big tech in the face of a divided government, which is less likely to agree on spending plans.

David Bianco, the chief investment officer of the Americas at DWS Group Americas, Inc., has been quoted as saying, “If it’s a mixed government, it’s still a good environment for tech companies.” He gave these reasons, “You’re unlikely to get a big increase in corporate taxes. Less change, more status quo, more stability in taxes and regulation is good for all businesses including tech.”

There are benefits to Washington being unable to pass as many changes. Uncertainty as to which person or which party will hold the executive branch is likely to create speculative flows until resolved.


Suggested Reading:

Which Stocks Do Well After a Presidential Election

Fintech Pirates are Looting Unsuspecting Trading Accounts

Many Investors are Keeping Their Powder Dry

Each event in our popular Virtual Road Shows Series has a maximum capacity of 100 investors online. To take part, listen to and perhaps get your questions answered, see which virtual investor meeting intrigues you here.

 

Sources:

https://www.nytimes.com/live/2020/11/04/business/us-economy-coronavirus

https://www.investing.com/news/stock-market-news/futures-jump-in-volatile-trade-as-election-race-tightens-2340288

https://uk.finance.yahoo.com/finance/news/stay-home-nasdaq-trade-reasserts-031222341.html

https://www.wsj.com/articles/senate-election-2020-results-11604378353

https://www.cnbc.com/2020/11/04/how-the-nasdaq-and-tech-stocks-became-the-winner-on-election-night.html

Release – Energy Fuels (UUUU) – Webcast Postponed to November 4, 2020

Energy Fuels Webcast Postponed to November 4, 2020


LAKEWOOD, Colo., Nov. 3, 2020 /CNW/ – Energy Fuels Inc. (NYSE American: UUUU) (TSX: EFR) (“Energy Fuels” or the “Company”) announces that the conference call and webcast originally scheduled for November 3, 2020 has been postponed to November 4, 2020 at 4:00 pm ET (2:00 pm MT) due to technical issues.

To join the webcast, please click the link below to access the presentation and the viewer-controlled webcast slides:


Energy Fuels Q3-2020 Results – Webcast Link


A link to a recorded version of the proceedings will be available shortly after the webcast by calling 1-888-390-0541 (toll free in the U.S. and Canada) and entering the code 303725#. This recording will be available until November 17, 2020.

About Energy Fuels: Energy Fuels is the leading U.S.-based uranium mining company, supplying U3O8 to major nuclear utilities. The Company also produces vanadium from certain of its projects, as market conditions warrant, and is evaluating the potential to recover rare earth elements at its White Mesa Mill. Its corporate offices are near Denver, Colorado, and all of its assets and employees are in the United States. Energy Fuels holds three of America’s key uranium production centers – the White Mesa Mill in Utah, the Nichols Ranch in-situ recovery (“ISR”) Project in Wyoming, and the Alta Mesa ISR Project in Texas. The White Mesa Mill is the only conventional uranium mill operating in the U.S. today, has a licensed capacity of over 8 million pounds of U3O8 per year, and has the ability to produce vanadium when market conditions warrant. The Nichols Ranch ISR Project is on standby and has a licensed capacity of 2 million pounds of U3O8 per year. The Alta Mesa ISR Project is also on standby and has a licensed capacity of 1.5 million pounds of U3O8 per year. In addition to the above production facilities, Energy Fuels has one of the largest NI 43-101 compliant uranium resource portfolios in the U.S. and several uranium and uranium/vanadium mining projects on standby and in various stages of permitting and development. The primary trading market for Energy Fuels’ common shares is the NYSE American under the trading symbol “UUUU,” and the Company’s common shares are also listed on the Toronto Stock Exchange under the trading symbol “EFR.” Energy Fuels’ website is www.energyfuels.com.

SOURCE: Energy Fuels Inc.

For further information: Energy Fuels Inc., Curtis Moore – VP – Marketing & Corporate Development, (303) 974-2140 or Toll free: (888) 864-2125, [email protected],
www.energyfuels.com