Capstone Green Energy (Nasdaq:CGRN) Reports Fourth Quarter & Full-Year Fiscal 2021 Financial Results – Outlines Goals For New Fiscal Year
Annual Cash Provided by Operating Activities of $1.7M – Highest in Company History
Cash and Cash Equivalents Expands to $49.5M
VAN NUYS, CA / ACCESSWIRE / June 10, 2021 / Capstone Green Energy Corporation (NASDAQ:CGRN), formerly Capstone Turbine Corporation (www.capstoneturbine.com) (NASDAQ:CPST) (“Capstone,” the “Company,” “we” or “us”), a global leader in carbon reduction and on-site resilient green energy solutions, today announced its fourth-quarter and full-year fiscal 2021 financial results and outlined new goals for the upcoming year.
“I’m pleased to announce that we substantially achieved our goal of improving Adjusted EBITDA by $10 million year-over-year, and this was accomplished despite the global COVID-19 pandemic extending beyond what we originally forecasted in our fiscal 2021 planning sessions,” said Darren Jamison, President and Chief Executive Officer of Capstone Green Energy. “The global pandemic combined with our goal to build a stronger balance sheet, including as a selling point to our customers, put driving stronger liquidity at the top of our list of strategic goals. I’m proud to report that not only did we end the fiscal year with the best cash from operations performance in the company’s history, but we also achieved the highest ending cash balance since fiscal 2012,” concluded Mr. Jamison.
Financial Highlights of Fourth Quarter Fiscal 2021 vs. Fiscal 2020:
- Total revenue of $17.9 million for the quarter, up from $11.6 million year-over-year
- Negative gross margin of $2.6 million, or negative 14% as a percentage of revenue, compared to $0.5 million, or 4% of revenue, in the same period last year
- Non-GAAP gross margin of $2.7 million, or 15% of revenue, compared to 6% in the same period last year
- Net loss of $4.8 million for the quarter, improved from a net loss of $6.9 million in the fourth quarter of fiscal 2020
- Negative Adjusted EBITDA, excluding executive bonus, of $1.9 million, compared to negative Adjusted EBITDA of $5.0 million in the fourth quarter of fiscal 2020
- Generated positive cash from operations of $5.1 million, including a one-time $5.0 million legal settlement, compared to negative $4.0 million in the fourth quarter of fiscal 2020
- Cash and cash equivalents increased to $49.5 million, compared to $15.1 million as of March 31, 2020
Financial Highlights of Fiscal 2021 vs. Fiscal 2020:
- Total revenue of $67.6 million, compared to $68.9 million year-over-year, despite the global pandemic
- Gross margin of $6.9 million, or 10% of revenue, compared to $9.0 million, or 13% of revenue, in fiscal 2020
- Non-GAAP gross margin of $12.8 million, or 19% of revenue, compared to $10.2 million, or 15% or revenue, in the same period last year
- Net loss of $18.4 million for the fiscal year compared to $21.9 million last year
- Negative Adjusted EBITDA, excluding executive bonus, of $4.0 million, compared to Negative Adjusted EBITDA of $13.2 million in fiscal 2020
- Cash provided by operating activities of $1.7 million compared to cash used in operating activities of $19.7 million in fiscal 2020
Fiscal 2021 – The Year in Review
Despite COVID-19’s challenging business environment, the Company took swift, proactive steps to deliver the forecasted positive Adjusted EBITDA in the first quarter that ended on June 30, 2020. Those results represented a $5.1 million improvement compared to the prior quarter, March 31, 2020, and a $3.5 million improvement compared to the prior year quarter ended June 30, 2019. This was the culmination of our strategic plans to invest capital dollars to expend our long-term microturbine rental fleet and substantially lower operating costs in the following ways:
- Reduce direct material costs by $3.0 million annually
- Cut R&D spending by approximately 25%
- Closely manage operating expenses
- Increase aftermarket spare parts margins in part from our newly upgraded United Kingdom Integrated Remanufacturing Facility
In the second quarter of the Company’s fiscal year, we announced $1.9 million positive cash provided by operating activities and continued in our improvements in total revenue and gross new product bookings.
In the third quarter, we reported revenue of $20.7 million, which was a 39% percent increase from the prior quarter. We also proactively upsized our Goldman Sachs three-year term note from $30.0 million to $50.0 million, bringing $20.0 million of new cash into the business, with a reduction in the interest rate. Part of these new funds are to be used to grow our rental fleet from 10.6 to 21.1 megawatts (MW).
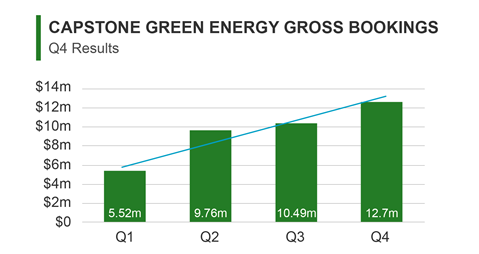
In the fourth quarter we saw continued growth in our gross product bookings, which drives future top-line revenue growth.
In addition, our total cash and cash equivalents increased $34.4 million to $49.5 million, compared to $15.1 million as of March 31, 2020, the start of the pandemic. This increase was primarily due to the upsize of our Goldman Sachs term note, equity sales of $15.9 million, net, from our at-the-market offering, and a beneficial $5.0 million settlement from the lawsuit we initiated with a former supplier for a faulty generator part, which were offset by operating costs and the building of rental assets.
New Fiscal 2022 Strategic Goals
Capstone Green Energy remains sharply focused on sustaining and achieving our strategic business goals to build competitive advantages and expand the total addressable markets (TAM) in the regions we service. These efforts are designed to position us as a green energy leader in fiscal 2022 and beyond. Our goals include:
- Broadening our already diverse energy products and service offerings
- Expanding our direct solutions sales team focused on growing top line
- Expanding our high-margin, long-term rental fleet to 21 MW and beyond
- Increasing aftermarket margins across the board
- Continuing to focus on managing working capital
- Continuing to grow the Distributor Support System (DSS) subscription program
New Hydrogen Products
During the year, Capstone continued to expand and develop our new hydrogen products. The Company released our first commercially available hydrogen-based Combined Heat and Power (CHP) product, which can safely run on a 10% hydrogen-90% natural gas mix, and we are targeting a commercial release of 30% hydrogen-70% natural gas mix product by March 31, 2022.
In addition, in May, we announced a demonstration project with Blue Economy CRC, a cooperative research center in partnership with national and international universities and industry that was established to bring together sustainable seafood production and renewable energy in order to further develop Australia’s aquaculture industry. This microturbine system is intended to run on 100% hydrogen.
ESG and a Sustainable Future
As part of our overall strategy, we are focusing on the significance of environmental, social, and governance (ESG) principles in everything we do. As a leading green energy solutions provider, we take pride in offering a diverse product offering that emphasizes protecting the environment by leaving it better than before. Capstone estimates that, over the last three years, it has helped save companies approximately $700 million on energy costs and over approximately one million tons of carbon. We are committed to offering our innovative and green, sustainable, and affordable energy solutions and to providing long-term, resilient, clean power to end users the world over.
Financial Results for the Fiscal 2021 Fourth Quarter and Full-Year
Total revenue for the fourth quarter of fiscal 2021 increased 54%, or $6.3 million, to $17.9 million, compared with $11.6 million in the fourth quarter of fiscal 2020. Despite the significant impacts of the global pandemic, total revenue for fiscal 2021 decreased only 2%, or $1.3 million, to $67.6 million, compared with total revenue of $68.9 million in fiscal 2020.
Gross margin was negative $2.6 million, or negative 14% as a percentage of revenue, compared to $0.5 million, or 4% as a percentage of revenue, in the fourth quarter of fiscal 2020. On a full-year basis, gross margin decreased to $6.9 million in fiscal 2021, compared to $9.0 million for fiscal 2020. The negative gross margin in the fourth quarter of fiscal 2021, was primarily due to a $4.9 million reliability repair accrual established to replace remaining fielded units affected by a supplier defect.
Non-GAAP gross margin, which is gross margin less depreciation and amortization, stock-based compensation expense, and the expense related to the reliability repair accrual, was $2.7 million, or 15% of revenue, compared to $0.7 million, or 6% of revenue, in the fourth quarter of fiscal 2020. The increase as a percentage of revenue was primarily due to improved Factory Protection Plan (FPP) margins year-over-year. On a full-year basis, non-GAAP gross margin increased to $12.8 million, or 19% of revenue, in fiscal 2021, compared to $10.2 million, or 15% of revenue, for fiscal 2020. The increase as a percentage of revenue was primarily due to lower overhead costs from the COVID-19 Business Continuity Plan on similar revenue levels.
Operating expenses in the quarter decreased $0.1 million, to $5.9 million, compared with $6.0 million in the fourth quarter of fiscal 2020 despite a $0.6 million executive bonus expense recognized in the fourth quarter of fiscal 2021 (with none in the prior year quarter). Operating expenses for fiscal 2021 were $20.8 million compared with $25.9 million for fiscal 2020. The decrease was primarily due to cost savings from the COVID-19 Business Continuity Plan.
Net loss was $4.8 million in the fourth quarter of fiscal 2021, compared to $6.9 million in the fourth quarter of fiscal 2020. Net loss was $18.4 million in fiscal 2021, compared to $21.9 million in fiscal 2020.
Adjusted EBITDA, excluding executive bonus, was negative $1.9 million in the fourth quarter of fiscal 2021, compared to Adjusted EBITDA of negative $5.0 million in the fourth quarter of fiscal 2020. Adjusted EBITDA, excluding executive bonus, for fiscal 2021 was negative $4.0 million compared to Adjusted EBITDA of negative $13.2 million in fiscal 2020.
Cash and cash equivalents were $49.5 million as of March 31, 2021, compared to $15.1 million as of March 31, 2020.
About Capstone Green Energy
Capstone Green Energy (NASDAQ:CGRN) is a leading provider of customized microgrid solutions and on-site energy technology systems focused on helping customers around the globe meet their environmental, energy savings, and resiliency goals. Capstone Green Energy focuses on four key business lines. Through its Energy as a Service (EaaS) business, it offers rental solutions utilizing its microturbine energy systems and battery storage systems, comprehensive Factory Protection Plan (FPP) service contracts that guarantee life-cycle costs, as well as aftermarket parts. Energy Conversion Products are driven by the Company’s industry-leading, highly efficient, low-emission, resilient microturbine energy systems offering scalable solutions in addition to a broad range of customer-tailored solutions, including hybrid energy systems and larger frame industrial turbines. The Energy Storage Products business line designs and installs microgrid storage systems creating customized solutions using a combination of battery technologies and monitoring software. Through Hydrogen Energy Solutions, Capstone Green Energy offers customers a variety of hydrogen products, including the Company’s microturbine energy systems.
For customers with limited capital or short-term needs, Capstone offers rental systems; for more information, contact: [email protected]. To date, Capstone has shipped over 10,000 units to 83 countries and estimates that, in FY21, it saved customers over $217 million in annual energy costs and approximately 397,000 tons of carbon. Total savings over the last three years are estimated to be $698 million in energy savings and 1,115,100 tons of carbon savings.
For more information about the Company, please visit www.CapstoneGreenEnergy.com. Follow Capstone Green Energy on Twitter, LinkedIn, Instagram, Facebook, and YouTube.
Cautionary Note Regarding Forward-Looking Statements
This release contains forward-looking statements as defined in the Private Securities Litigation Reform Act of 1995, including statements under the caption “New Fiscal 2022 Strategic Goals” and other statements, statements regarding expectations for green initiatives and execution on the Company’s growth strategy and other statements regarding the Company’s expectations, beliefs, plans, intentions, and strategies. The Company has tried to identify these forward-looking statements by using words such as “expect,” “anticipate,” “believe,” “could,” “should,” “estimate,” “intend,” “may,” “will,” “plan,” “goal” and similar terms and phrases, but such words, terms and phrases are not the exclusive means of identifying such statements. Actual results, performance and achievements could differ materially from those expressed in, or implied by, these forward-looking statements due to a variety of risks, uncertainties and other factors, including, but not limited to, the following: the ongoing effects of the COVID-19 pandemic; the availability of credit and compliance with the agreements governing the Company’s indebtedness; the Company’s ability to develop new products and enhance existing products; product quality issues, including the adequacy of reserves therefor and warranty cost exposure; intense competition; financial performance of the oil and natural gas industry and other general business, industry and economic conditions; the Company’s ability to adequately protect its intellectual property rights; and the impact of pending or threatened litigation. For a detailed discussion of factors that could affect the Company’s future operating results, please see the Company’s filings with the Securities and Exchange Commission, including the disclosures under “Risk Factors” in those filings. Except as expressly required by the federal securities laws, the Company undertakes no obligation to update or revise any forward-looking statements, whether as a result of new information, changed circumstances or future events, or for any other reason.
Financial Tables to Follow:
CAPSTONE GREEN ENERGY CORPORATION AND SUBSIDIARIES
CONSOLIDATED BALANCE SHEETS
(In thousands, except share amounts)
|
|
|
March 31, |
|
|
March 31, |
|
|
|
|
2021 |
|
|
2020 |
|
|
Assets
|
|
|
|
|
|
|
|
Current Assets:
|
|
|
|
|
|
|
|
Cash and cash equivalents
|
|
$ |
49,533 |
|
|
$ |
15,068 |
|
|
Accounts receivable, net of allowances of $314 at March 31, 2021 and $703 at March 31, 2020
|
|
|
20,593 |
|
|
|
16,240 |
|
|
Inventories, net
|
|
|
11,829 |
|
|
|
21,460 |
|
|
Prepaid expenses and other current assets
|
|
|
4,953 |
|
|
|
3,987 |
|
|
Total current assets
|
|
|
86,908 |
|
|
|
56,755 |
|
|
Property, plant, equipment and rental assets, net
|
|
|
9,630 |
|
|
|
7,749 |
|
|
Non-current portion of inventories
|
|
|
1,845 |
|
|
|
1,221 |
|
|
Other assets
|
|
|
7,639 |
|
|
|
8,230 |
|
|
Total assets
|
|
$ |
106,022 |
|
|
$ |
73,955 |
|
|
Liabilities and Stockholders’ Equity
|
|
|
|
|
|
|
|
|
|
Current Liabilities:
|
|
|
|
|
|
|
|
|
|
Accounts payable and accrued expenses
|
|
$ |
19,767 |
|
|
$ |
15,000 |
|
|
Accrued salaries and wages
|
|
|
1,889 |
|
|
|
1,644 |
|
|
Accrued warranty reserve
|
|
|
5,850 |
|
|
|
1,934 |
|
|
Deferred revenue
|
|
|
6,374 |
|
|
|
7,898 |
|
|
Current portion of notes payable and lease obligations
|
|
|
576 |
|
|
|
477 |
|
|
Total current liabilities
|
|
|
34,456 |
|
|
|
26,953 |
|
|
Deferred revenue – non-current
|
|
|
765 |
|
|
|
944 |
|
|
Term note payable, net
|
|
|
52,865 |
|
|
|
27,963 |
|
|
Long-term portion of notes payable and lease obligations
|
|
|
4,762 |
|
|
|
5,074 |
|
|
Total liabilities
|
|
|
92,848 |
|
|
|
60,934 |
|
|
Commitments and contingencies (Note 12)
|
|
|
|
|
|
|
|
|
|
Stockholders’ Equity:
|
|
|
|
|
|
|
|
|
|
Preferred stock, $.001 par value; 1,000,000 shares authorized; none issued
|
|
|
– |
|
|
|
– |
|
|
Common stock, $.001 par value; 51,500,000 shares authorized, 12,898,144 shares issued and 12,824,190 shares outstanding at March 31, 2021; 10,286,366 shares issued and 10,228,789 shares outstanding at March 31, 2020
|
|
|
13 |
|
|
|
10 |
|
|
Additional paid-in capital
|
|
|
934,381 |
|
|
|
915,755 |
|
|
Accumulated deficit
|
|
|
(919,271 |
) |
|
|
(900,869 |
) |
|
Treasury stock, at cost; 73,954 shares at March 31, 2021 and 57,577 shares at March 31, 2020
|
|
|
(1,949 |
) |
|
|
(1,875 |
) |
|
Total stockholders’ equity
|
|
|
13,174 |
|
|
|
13,021 |
|
|
Total liabilities and stockholders’ equity
|
|
$ |
106,022 |
|
|
$ |
73,955 |
|
|
|
|
|
|
|
|
|
|
CAPSTONE GREEN ENERGY CORPORATION AND SUBSIDIARIES
CONSOLIDATED STATEMENTS OF OPERATIONS
(In thousands, except per share amounts)
|
|
|
Three Months Ended |
|
|
Year Ended |
|
|
|
|
March 31, |
|
|
March 31, |
|
|
|
|
2021 |
|
|
2020 |
|
|
2021 |
|
|
2020 |
|
|
Revenue:
|
|
|
|
|
|
|
|
|
|
|
|
|
|
Product and accessories
|
|
$ |
9,946 |
|
|
$ |
4,053 |
|
|
$ |
36,517 |
|
|
$ |
35,338 |
|
|
Parts and service
|
|
|
7,916 |
|
|
|
7,507 |
|
|
|
31,119 |
|
|
|
33,588 |
|
|
Total revenue
|
|
|
17,862 |
|
|
|
11,560 |
|
|
|
67,636 |
|
|
|
68,926 |
|
|
Cost of goods sold:
|
|
|
|
|
|
|
|
|
|
|
|
|
|
|
|
|
|
Product and accessories
|
|
|
15,554 |
|
|
|
4,494 |
|
|
|
42,025 |
|
|
|
42,273 |
|
|
Parts and service
|
|
|
4,859 |
|
|
|
6,608 |
|
|
|
18,756 |
|
|
|
17,622 |
|
|
Total cost of goods sold
|
|
|
20,413 |
|
|
|
11,102 |
|
|
|
60,781 |
|
|
|
59,895 |
|
|
Gross margin
|
|
|
(2,551 |
) |
|
|
458 |
|
|
|
6,855 |
|
|
|
9,031 |
|
|
Operating expenses:
|
|
|
|
|
|
|
|
|
|
|
|
|
|
|
|
|
|
Research and development
|
|
|
714 |
|
|
|
838 |
|
|
|
2,417 |
|
|
|
3,649 |
|
|
Selling, general and administrative
|
|
|
5,158 |
|
|
|
5,196 |
|
|
|
18,391 |
|
|
|
22,211 |
|
|
Total operating expenses
|
|
|
5,872 |
|
|
|
6,034 |
|
|
|
20,808 |
|
|
|
25,860 |
|
|
Loss from operations
|
|
|
(8,423 |
) |
|
|
(5,576 |
) |
|
|
(13,953 |
) |
|
|
(16,829 |
) |
|
Other income (expense)
|
|
|
4,989 |
|
|
|
(32 |
) |
|
|
4,993 |
|
|
|
133 |
|
|
Interest income
|
|
|
7 |
|
|
|
8 |
|
|
|
30 |
|
|
|
8 |
|
|
Interest expense
|
|
|
(1,321 |
) |
|
|
(1,345 |
) |
|
|
(5,156 |
) |
|
|
(5,198 |
) |
|
Loss on debt extinguishment
|
|
|
– |
|
|
|
– |
|
|
|
(4,282 |
) |
|
|
– |
|
|
Loss before provision for income taxes
|
|
|
(4,748 |
) |
|
|
(6,945 |
) |
|
|
(18,368 |
) |
|
|
(21,886 |
) |
|
Provision for income taxes
|
|
|
9 |
|
|
|
4 |
|
|
|
19 |
|
|
|
12 |
|
|
Net loss
|
|
|
(4,757 |
) |
|
|
(6,949 |
) |
|
|
(18,387 |
) |
|
|
(21,898 |
) |
|
Less: Deemed dividend on purchase warrant for common shares
|
|
|
15 |
|
|
|
12 |
|
|
|
15 |
|
|
|
87 |
|
|
Net loss attributable to common stockholders
|
|
$ |
(4,772 |
) |
|
$ |
(6,961 |
) |
|
$ |
(18,402 |
) |
|
$ |
(21,985 |
) |
|
|
|
|
|
|
|
|
|
|
|
|
|
|
|
|
|
|
|
Net loss per common share attributable to common stockholders-basic and diluted
|
|
$ |
(0.39 |
) |
|
$ |
(0.73 |
) |
|
$ |
(1.63 |
) |
|
$ |
(2.70 |
) |
|
Weighted average shares used to calculate basic and diluted net loss per common share attributable to common stockholders
|
|
|
12,335 |
|
|
|
9,477 |
|
|
|
11,280 |
|
|
|
8,150 |
|
|
|
|
|
|
|
|
|
|
|
|
|
|
|
|
|
|
CAPSTONE GREEN ENERGY CORPORATION AND SUBSIDIARIES
RECONCILIATION OF NON-GAAP FINANCIAL MEASURES
(In thousands)
|
|
|
Three months ended |
|
|
Year ended |
|
|
Reconciliation of Reported Net Loss to EBITDA and Adjusted EBITDA
|
|
March 31, |
|
|
March 31, |
|
|
|
|
2021 |
|
|
2020 |
|
|
2021 |
|
|
2020 |
|
|
Net loss, as reported
|
|
$ |
(4,757 |
) |
|
$ |
(6,949 |
) |
|
$ |
(18,387 |
) |
|
$ |
(21,898 |
) |
|
Interest expense
|
|
|
1,321 |
|
|
|
1,345 |
|
|
|
5,156 |
|
|
|
5,198 |
|
|
Provision for income taxes
|
|
|
9 |
|
|
|
4 |
|
|
|
19 |
|
|
|
12 |
|
|
Depreciation and amortization
|
|
|
380 |
|
|
|
392 |
|
|
|
1,452 |
|
|
|
1,616 |
|
|
EBITDA
|
|
$ |
(3,047 |
) |
|
$ |
(5,208 |
) |
|
$ |
(11,760 |
) |
|
$ |
(15,072 |
) |
|
Loss on debt extinguishment
|
|
|
– |
|
|
|
– |
|
|
|
4,282 |
|
|
|
– |
|
|
Stock-based compensation and other expense
|
|
|
259 |
|
|
|
244 |
|
|
|
1,599 |
|
|
|
913 |
|
|
Restructuring charges
|
|
|
– |
|
|
|
– |
|
|
|
– |
|
|
|
927 |
|
|
Non-recurring legal settlement
|
|
|
(5,000 |
) |
|
|
– |
|
|
|
(5,000 |
) |
|
|
– |
|
|
Reliability repair accrual
|
|
|
4,945 |
|
|
|
– |
|
|
|
4,945 |
|
|
|
– |
|
|
Non-recurring legal costs related to settlement
|
|
|
300 |
|
|
|
– |
|
|
|
720 |
|
|
|
– |
|
|
Adjusted EBITDA
|
|
|
(2,543 |
) |
|
|
(4,964 |
) |
|
|
(5,214 |
) |
|
|
(13,232 |
) |
|
Executive bonus
|
|
|
611 |
|
|
|
– |
|
|
|
1,230 |
|
|
|
– |
|
|
Adjusted EBITDA excluding executive bonus
|
|
$ |
(1,932 |
) |
|
$ |
(4,964 |
) |
|
$ |
(3,984 |
) |
|
$ |
(13,232 |
) |
|
|
|
|
|
|
|
|
|
|
|
|
|
|
|
|
|
|
|
|
|
|
|
|
|
|
|
|
|
|
|
|
|
|
|
|
Three months ended March 31,
|
|
Year ended March 31,
|
| Reconciliation of Reported Gross Margin to |
|
|
As % of
|
|
|
|
As % of
|
|
|
|
As % of
|
|
|
|
As % of
|
|
Non-GAAP Gross Margin
|
|
2021
|
revenue
|
|
2020
|
revenue
|
|
2021
|
revenue
|
|
2020
|
revenue
|
| Gross Margin, as reported |
|
$
|
(2,551)
|
(14)%
|
|
$
|
458
|
4%
|
|
$
|
6,855
|
10%
|
|
$
|
9,031
|
13%
|
|
Depreciation and amortization
|
|
|
265
|
1%
|
|
|
259
|
2%
|
|
|
964
|
2%
|
|
|
1,079
|
2%
|
|
Stock-based compensation expense
|
|
|
24
|
–
|
|
|
17
|
–
|
|
|
83
|
–
|
|
|
69
|
–
|
|
Reliability repair accrual
|
|
|
4,945
|
28%
|
|
|
–
|
–
|
|
|
4,945
|
7%
|
|
|
–
|
–
|
| Non-GAAP Gross Margin |
|
$
|
2,683
|
15%
|
|
$
|
734
|
6%
|
|
$
|
12,847
|
19%
|
|
$
|
10,179
|
15%
|
|
|
|
|
|
|
|
|
|
|
|
|
|
|
|
|
|
To supplement the Company’s unaudited financial data presented on a generally accepted accounting principles (GAAP) basis, management has presented Adjusted EBITDA and Adjusted EBITDA excluding Executive Bonus, and Non-GAAP Gross Margin, which are non-GAAP measures. These non-GAAP measures are among the indicators management uses as a basis for evaluating the Company’s financial performance, as well as for forecasting future periods. Management establishes incentive compensation performance targets and annual budgets and makes operating decisions based in part upon these metrics. Accordingly, disclosure of these non-GAAP measures provides investors with some of the same information that management uses to understand the Company’s economic performance year-over-year.
EBITDA is defined as net income (loss) before interest, provision for income taxes, and depreciation and amortization expense. Adjusted EBITDA is defined as EBITDA before loss on debt extinguishment, stock-based compensation and other expense, restructuring charges, non-recurring legal settlement, reliability repair accrual, and non-recurring legal costs related to settlement. Loss on debt extinguishment includes expenses associated with the accounting for the October 2020 Goldman Sachs note transaction. Stock-based compensation and other expense includes expense related to stock issued to employees, directors, and vendors. Restructuring charges include facility consolidation costs and costs related to the Company’s cost reduction initiatives. Non-recurring legal settlement is a one-time payment from a lawsuit we initiated with a former supplier for a part defect. The reliability repair accrual accounts for the replacement of remaining high risk failure parts in some of our fielded units due to the former supplier part defect. Non-recurring legal costs related to settlement are legal costs associated with above settlement. Adjusted EBITDA excluding Executive Bonus is defined as EBITDA before expense related to Executive Bonus accruals.
Non-GAAP Gross Margin is defined as Gross Margin before depreciation and amortization expense, stock-based compensation expense, and a reliability repair accrual. Stock-based compensation expense includes expense related to stock issued to employees. The reliability repair accrual accounts for the replacement of remaining high risk failure parts in some of our fielded units due to the former supplier part defect.
EBITDA, Adjusted EBITDA, Adjusted EBITDA excluding Executive Bonus, and Non-GAAP Gross Margin are not measures of the Company’s liquidity or financial performance under GAAP and should not be considered as an alternative to net income or any other performance measure presented in accordance with GAAP, or as an alternative to cash flows from operating activities or any other measure of liquidity presented in accordance with GAAP.
While management believes that the non-GAAP financial measures provide useful supplemental information to investors, there are limitations associated with the use of these measures. The measures are not prepared in accordance with GAAP and may not be directly comparable to similarly titled measures of other companies.
CONTACT:
Capstone Green Energy
Investor and investment media inquiries:
818-407-3628
[email protected]
SOURCE: Capstone Green Energy Corporation