Seanergy Maritime (SHIP) – Shelf Offering Filed and Poison Pill Adopted

Tuesday, July 06, 2021

Seanergy Maritime (SHIP)
Shelf Offering Filed and Poison Pill Adopted

Seanergy Maritime Holdings Corp., an international shipping company, provides marine dry bulk transportation services through the ownership and operation of dry bulk vessels. Seanergy Maritime Holdings Corp. is the only pure-play Capesize shipping company listed in the US capital markets. Seanergy provides marine dry bulk transportation services through a modern fleet of 10 Capesize vessels, with total capacity of approximately 1,748,581 dwt and an average fleet age of about 9.8 years. The Company is incorporated in the Marshall Islands with executive offices in Athens, Greece and an office in Hong Kong. The Company’s common shares trade on the Nasdaq Capital Market under the symbol “SHIP” and class A warrants under “SHIPW”.

Poe Fratt, Senior Research Analyst, Noble Capital Markets, Inc.

Refer to the full report for the price target, fundamental analysis, and rating.

    Mixed shelf offering for $300 million filed. After the market closed on Friday, a Form F-3 was filed. The mixed shelf offering adds the ability to issue $300 million of equity, preferred and/or debt. We view the shelf offering filing as a formality, or an updated version of the previous shelf offering filing, and do not believe that the any common shares will be issued unless the stock is well above the current stock price. It is also worth noting that financing is already in place to fund the latest acquisitions and the last equity offering was priced at $1.70/share (with no warrant overage) in February so near-term funding and liquidity are good.

    No financials were included in the shelf offering, but the share count was updated.  As of June 30, 2021, there were 168.5 million shares were outstanding, which means that no new shares have been issued since 1Q2021 operating results were released on May 25th …


This research is provided by Noble Capital Markets, Inc., a FINRA and S.E.C. registered broker-dealer (B/D).

*Analyst certification and important disclosures included in the full report. NOTE: investment decisions should not be based upon the content of this research summary.  Proper due diligence is required before making any investment decision. 

Virtual Roadshow with ACCO Brands (ACCO) President & CEO Boris Elisman


ACCO Brands President & CEO Boris Elisman makes a formal corporate presentation. Afterwards, he is joined by Noble Capital Markets Senior Research Analyst Joe Gomes for a Q & A session featuring questions asked by the live audience throughout the event.

Research, News, and Advanced Market Data on ACCO


Information on upcoming live virtual roadshows

About ACCO Brands Corporation

ACCO Brands Corporation (NYSE: ACCO) is one of the world’s largest designers, marketers and manufacturers of branded academic, consumer and business products. Our widely recognized brands include Artline®, AT-A-GLANCE®, Barrilito®, Derwent®, Esselte®, Five Star®, Foroni®, GBC®, Hilroy®, Kensington®, Leitz®, Mead®, Quartet®, PowerA®, Rapid®, Rexel®, Swingline®, Tilibra®, Wilson Jones® and many others. Our products are sold in more than 100 countries around the world. More information about ACCO Brands, the Home of Great Brands Built by Great People, can be found at www.accobrands.com.

Release – Ocugen’s COVID-19 Vaccine Co-Development Partner, Bharat Biotech, Shares Phase 3 Results Demonstrating 77.8% Protection against Overall Disease


Ocugen’s COVID-19 Vaccine Co-Development Partner, Bharat Biotech, Shares Phase 3 Results Demonstrating 77.8% Protection against Overall Disease

  • Efficacy analysis demonstrates COVAXIN™ to be 93.4%
    protective against severe symptomatic COVID-19

  • Efficacy data demonstrates 65.2% protection against the
    SARS-CoV-2, B.1.617.2 Delta variant

  • Adverse events reported were similar to placebo, with
    12.4% of subjects experiencing commonly known side effects and less than
    0.5% of subjects feeling serious adverse events

MALVERN, Pa., and HYDERABAD, India, July 02, 2021 (GLOBE NEWSWIRE) — Ocugen, Inc. (NASDAQ:
OCGN), a biopharmaceutical company focused on discovering, developing, and commercializing gene therapies to cure blindness diseases and developing a vaccine to save lives from COVID-19, today announced that its co-development partner, Bharat Biotech, shared positive results of its Phase 3 study of COVAXIN™, a whole virion inactivated COVID-19 vaccine candidate.  COVAXIN™ demonstrated a vaccine efficacy in mild, moderate, and severe COVID-19 disease of 77.8% with efficacy against severe COVID-19 disease alone of 93.4%. 

“As we brace ourselves for the potential next wave of COVID-19 outbreaks from the Delta variant, reporting of the final efficacy analysis from this Phase 3 study comes at a crucial time.  We expect these efficacy and safety outcomes, along with demonstrated efficacy against emerging variants of concern, will support our initiatives to bring COVAXIN™ to the US and Canadian markets,” said Dr. Shankar Musunuri, Chairman of the Board, Chief Executive Officer and Co-Founder of Ocugen. 

“With the Delta variant becoming a dominant strain of COVID-19 in the United States, we believe that the Phase 3 efficacy results reported by Bharat Biotech demonstrate that COVAXIN™ has the potential to become an important option to expand protection against this emerging variant. Combining these data with the only Delta-variant results from a controlled Phase 3 clinical trial, evidence continues to support a favorable benefit-risk profile for COVAXIN™,” said Dr. Bruce Forrest, Acting Chief Medical Officer and a member of the vaccine scientific advisory board of Ocugen. 

Phase 3 Results as
Reported by Bharat Biotech
 
Bharat Biotech’s Phase 3 clinical trial enrolled 25,798 participants across 25 sites and between 18-98 years of age in India, including 2,750 over the age of 60 and 7,065 with comorbidities. The primary endpoint of the Phase 3 clinical trial is based on the first occurrence of PCR-confirmed symptomatic (mild, moderate, or severe) COVID-19 with onset at least 14 days after the second study vaccination in serologically negative (to SARS-CoV-2) adult participants at baseline.  

“The safety and efficacy readouts from Phase III clinical trials present a comprehensive data package for COVAXIN™. This has been a great journey of science leading to translational product development to combat this deadly pandemic,” added Dr. Krishna Ella, Chairman & Managing Director, Bharat Biotech. “We continue our efforts towards additional studies on variants of concern. Our commitment to data transparency has been sustained with 10 publications within the past year, and we will share our findings with regulators worldwide.”

COVAXIN™ demonstrated overall efficacy of 77.8% (95% CI; 65.2-86.4), achieving its primary endpoint. One hundred and thirty positive COVID-19 cases were observed: 24 in the vaccine group and 106 in the placebo group. Sixteen severe cases were observed: one in the vaccine group and 15 in the placebo group, achieving an efficacy of 93.4% (95% CI; 57.1-99.8) with respect to severe COVID-19 infection.

In the Phase 3 trial conducted by Bharat Biotech, subjects vaccinated with COVAXIN™ achieved greater protection against emerging B.1.617.2 (delta) and B.1.351 (beta) variants than those who had previous natural infections. Results showed an efficacy rate of 65.2% (95% CI; 33.1-83.0).

Adverse events reported were low, with 12.4% of subjects experiencing commonly known side effects and less than 0.5% of subjects feeling serious adverse events, side effects that keep many from considering taking current vaccines. Both adverse events and severe adverse events reported in the vaccine group were reported at similar rates to the placebo group.

Ocugen recently announced that it will pursue submission of a Biologics License Application (BLA) for its COVID-19 vaccine candidate, COVAXIN™ in the United States and has initiated discussions with Health Canada for regulatory approval.

About COVAXIN™
COVAXIN™, India’s COVID-19 vaccine by Bharat Biotech, is developed in collaboration with the Indian Council of Medical Research (ICMR) – National Institute of Virology (NIV). COVAXIN™ is a highly purified and inactivated vaccine that is manufactured using a vero cell manufacturing platform with an excellent safety track record of more than 300 million doses supplied. It is a two-dose vaccine given four weeks apart.

In addition to generating strong immune response against multiple antigens, COVAXIN™ has been shown to generate memory T cell responses, for its multiple epitopes, indicating longevity and a rapid antibody response to future infections. With published data demonstrating a safety profile superior to available data for several other vaccines, COVAXIN™ is packaged in multi-dose vials that can be stored at 2-8?C. 

Based on the more than 30 million doses supplied in India and other countries, COVAXIN™ has an excellent safety record. COVAXIN™ is currently being administered under emergency use authorizations in 13 countries, and applications for emergency use authorization are pending in more than 60 additional countries.

About Ocugen,
Inc.
 
Ocugen, Inc. is a biopharmaceutical company focused on discovering, developing, and commercializing gene therapies to cure blindness diseases and developing a vaccine to save lives from COVID-19. Our breakthrough modifier gene therapy platform has the potential to treat multiple retinal diseases with one drug – “one to many” and our novel biologic product candidate aims to offer better therapy to patients with underserved diseases such as wet age-related macular degeneration, diabetic macular edema, and diabetic retinopathy. We are co-developing Bharat Biotech’s COVAXIN™ vaccine candidate for COVID-19 in the U.S. and Canadian markets. For more information, please visit www.ocugen.com

About Bharat Biotech 
Bharat Biotech has established an excellent track record of innovation with more than 145 global patents, a wide product portfolio of more than 16 vaccines, 4 bio-therapeutics, registrations in more than 123 countries, and the World Health Organization (WHO) Pre-qualifications. Located in Genome Valley in Hyderabad, India, a hub for the global biotech industry, Bharat Biotech has built a world-class vaccine & bio-therapeutics, research & product development, Bio-Safety Level 3 manufacturing, and vaccine supply and distribution. 

Having delivered more than 4 billion doses of vaccines worldwide, Bharat Biotech continues to lead innovation and has developed vaccines for influenza H1N1, Rotavirus, Japanese Encephalitis, Rabies, Chikungunya, Zika, and the world’s first tetanus-toxoid conjugated vaccine for Typhoid. Bharat’s commitment to global social innovation programs and public-private partnerships resulted in introducing path-breaking WHO pre-qualified vaccines BIOPOLIO®, ROTAVAC®, and Typbar TCV® combatting polio, rotavirus, typhoid infections, respectively. The acquisition of the rabies vaccine facility, Chiron Behring, from GlaxoSmithKline (GSK) has positioned Bharat Biotech as the world’s largest rabies vaccine manufacturer. To learn more about Bharat Biotech, visit www.bharatbiotech.com

Cautionary Note on
Forward-Looking Statements 
 
This press release contains forward-looking statements within the meaning of The Private Securities Litigation Reform Act of 1995, which are subject to risks and uncertainties. We may, in some cases, use terms such as “predicts,” “believes,” “potential,” “proposed,” “continue,” “estimates,” “anticipates,” “expects,” “plans,” “intends,” “may,” “could,” “might,” “will,” “should” or other words that convey uncertainty of future events or outcomes to identify these forward-looking statements. Such forward-looking statements include information about qualitative assessments of available data, potential benefits, expectations for clinical trials, and anticipated timing of clinical trial readouts and regulatory submissions. This information involves risks and uncertainties that could cause actual results to differ materially from those expressed or implied by such statements. Risks and uncertainties include, among other things, the uncertainties inherent in research and development, including the ability to meet anticipated clinical endpoints, commencement and/or completion dates for clinical trials, regulatory submission dates, regulatory approval dates and/or launch dates, as well as risks associated with preliminary and interim data, including the possibility of unfavorable new clinical trial data and further analyses of existing clinical trial data; the risk that the results of in-vitro studies will not be duplicated in human clinical trials; the risk that clinical trial data are subject to differing interpretations and assessments, including during the peer review/publication process, in the scientific community generally, and by regulatory authorities; whether and when data from Bharat Biotech’s clinical trials will be published in scientific journal publications and, if so, when and with what modifications; whether we will be able to provide the U.S. Food and Drug Administration (FDA) with sufficient additional information regarding the design of and results from preclinical and clinical studies of COVAXIN™, which have been conducted by Bharat Biotech in India in order for those trials to support a biologics license application (BLA); the size, scope, timing and outcome of any additional trials or studies that we may be required to conduct to support a BLA; any additional chemistry, manufacturing and controls information that we may be required to submit the timing of our BLA filing; whether and when an application for authorization under interim order for emergency use will be filed in Canada; whether and when any such applications may be approved by Health Canada; whether developments with respect to COVID-19 pandemic will affect the regulatory pathway available for vaccines in the United States, Canada or other jurisdictions; market demand for COVAXIN™ in the United States or Canada; decisions by the FDA or Health Canada impacting labeling, manufacturing processes, safety and/or other matters that could affect the availability or commercial potential of COVAXIN™ in the United States or Canada, including development of products or therapies by other companies. These and other risks and uncertainties are more fully described in our periodic filings with the Securities and Exchange Commission (SEC), including the risk factors described in the section entitled “Risk Factors” in the quarterly and annual reports that we file with the SEC. Any forward-looking statements that we make in this press release speak only as of the date of this press release. Except as required by law, we assume no obligation to update forward-looking statements contained in this press release whether as a result of new information, future events or otherwise, after the date of this press release. 

Ocugen Contact: 
Ken Inchausti
Head, Investor Relations & Communications
+1 484 237 3398
[email protected]

Please submit investor-related inquiries to: [email protected]

Media contact for
Bharat Biotech:

Sheela Panicker | +91 9849809594 | [email protected]
Shilpa Suryawanshi | +91 9833738595 | [email protected]


Impact of Physical Nearness on Twitter Posts


Image Credit: Liz Henry (Flickr)


New York City or Los Angeles? Where You Live Says a Lot About What and When You Tweet


The Big Apple versus The Big Orange. The City of Dreams versus The City of Angels. I’m referring, of course, to the ongoing rivalry between New York City and Los Angeles. Hilarious “survey” videos and talk shows will give you one picture of the cities. My colleagues and I decided to take a more serious look at the differences between the cities, so we studied what everyone else was talking about – on Twitter.

We set out to answer a simple research question: Are people who are located near each other likely to tweet about similar things? To do so, we analyzed millions of GPS-enabled tweets across New York City and LA. This type of study – looking at huge amounts of social media traffic by location – is useful for more than tracking pop culture memes in different cities. It could be valuable for understanding many aspects of urban life, including the effects of the COVID-19 pandemic.

If we were considering the case of a single, small community that takes pride in local events, celebrities, and culture, the answer to our research question would be a resounding “yes.” One challenge in comparing two large, international cities is the reality that globalization has led to unprecedented interaction among multiple cultures and peoples, along with Starbucks and McDonald’s seemingly in every city on the planet.

For cities that are international but also take pride in their uniqueness, the key is teasing out the extent to which local qualities or global culture dominate tweeting behavior. We designed our methods to be precise enough to account for the fact that, contrary to the fun videos, New York City and LA are quite similar. Both have high housing costs, famous educational institutions, hospitals, museums and other cultural establishments, and residents who tend to vote Democratic.


Define ‘Close’ and ‘Same’

Our study tackled two problems: There’s no simple definition of “close together,” and it’s difficult to say whether two tweets are about the same topic. We combined several definitions of “close together,” ranging from people located in the same city to the distance in miles between their coordinates, using a common formula from spatial sciences.

It’s more difficult to determine whether two tweets are talking about similar things. Looking for common hashtags might suffice, but unfortunately many people do not use hashtags or use different hashtags when talking about the same thing. To overcome this problem, we used state-of-the-art natural language processing technology. Algorithms developed in this field read and interpret sentences in a manner similar to the way humans do, and they are able to deal with nuance.

We used this technology to group tweets into clusters of topics. We then studied whether tweets falling inside the same cluster were also from people who were close together based on their GPS-enabled tweets. This allowed us to determine, for example, that clusters containing art-related words and phrases tended to arise more often in New York than LA.


Health and Wealth Versus Art and Representing

Even before we looked at who tweets about what, we found tweeting across New York City to be more evenly spread, while in LA, more tweeting happens in wealthier areas, including Calabasas – home to Kim Kardashian – Palos Verdes, West Hollywood and the coastal areas.

We also found that New Yorkers referred to themselves and their city far more often than Angelenos did. On a per capita basis, New Yorkers like to talk about art, while Angelenos like to talk about health care and hospitality.

LA generates more tweets than New York throughout the day, despite having a smaller population, but from 8 p.m. to 5 a.m. local time, the two have comparable numbers of tweets. Tweeting in New York City rises sharply from 8 p.m. to a peak at 9 p.m., whereas tweeting in LA rises steadily from 2 p.m. to a peak at 7 p.m.


Computational Social Science


Our methods are a case study in the growing field of computational social science, which aims to find insights in unique, often large, data sets using artificial intelligence models and algorithms. In contrast, traditional social science tends to rely on surveys and polls to quantify public perception about an issue. Though surveys have some distinct statistical advantages, they can be expensive and time-consuming to use for collecting quality data with good response rates.

For example, Gallup releases new survey data every few months and currently charges US$30,000 for academic licenses. Decades ago, researchers found that monetary incentives increase response rates significantly. Even today, online surveys are often accompanied by lottery-based promises of receiving an Amazon gift card. Researchers are working on combining the benefits of traditional and computational social science.

Zooming into our data, we uncovered some fascinating trends that we hope future research will explore. We found, for example, that on a per capita basis, as crime increases, so do tweets, at least at the level of ZIP codes. Why do high-crime areas tweet more? We don’t know yet, but the trend is consistent across both New York City and LA.


Tweeting, Place and COVID-19

Studying tweeting behavior by location could also be useful for understanding disparate outcomes of large-scale events. For example, our twitter analysis could help shed light on how the COVID-19 pandemic has affected people in different places.

New York City was hit hard by COVID-19 early on, showing that even major cities were affected in different ways by this terrible pandemic. New reporting is now showing that even within cities, socioeconomically disadvantaged communities were disproportionately burdened.

Recently, we released a Twitter data set covering 10 of the largest metropolitan areas in the United States to further study such disparities using computational social science. We are already using our methods across all of these cities to better understand how COVID-19 has affected certain groups, and the levels of expressed vaccine hesitancy among these groups.

Eventually, we hope to use our methods with a large set of international metropolises to study urban behavior.


This article was republished with permission from The Conversation, a news site dedicated to sharing ideas from academic experts.  It was written by and represents the research-based opinions and findings of Mayank Kejriwal Research Assistant Professor of Industrial & Systems Engineering, University of Southern California.


Suggested Reading:

Bond Market Understanding is Again Critical fo Stock Investors

Why Gain-of-Function Research is Being Conducted


Workcations Add a New Class of Traveller

Michael Burry Again Closes His Twitter Account


Stay up to date. Follow us:


Stay up to date. Follow us:

Search and Rescue Technology at Disaster Sites


An Expert on Search and Rescue Robots Explains the Technologies Used in Disasters like the Florida Condo Collapse

Texas
A&M’s Robin Murphy has deployed robots at 29 disasters, including three
building collapses, two mine disasters and an earthquake as director of the
Center for Robot-Assisted Search and Rescue. She has also served as a technical
search specialist with the Hillsboro County (Florida) Fire and Rescue
Department. The Conversation talked to Murphy to provide readers an
understanding of the types of technologies that search and rescue crews at the
Champlain Towers South disaster site in Surfside, Florida, have at their
disposal, as well as some they don’t. The interview has been edited for length.


What types of technologies are rescuers using at the Surfside condo collapse site?

We don’t have reports about it from Miami-Dade Fire Rescue Department, but news coverage shows that they’re using drones.

A standard kit for a technical search specialist would be basically a backpack of tools for searching the interior of the rubble: listening devices and a camera-on-a-wand or borescope for looking into the rubble.


How are drones typically used to help searchers?

They’re used to get a view from above to map the disaster and help plan the search, answering questions like: What does the site look like? Where is everybody? Oh crap, there’s smoke. Where is it coming from? Can we figure out what that part of the rubble looks like?

In Surfside, I wouldn’t be surprised if they were also flying up to look at those balconies that are still intact and the parts that are hanging over. A structural specialist with binoculars generally can’t see accurately above three stories. So they don’t have a lot of ability to determine if a building’s safe for people to be near, to be working around or in, by looking from the ground.

Drones can take a series of photos to generate orthomosaics. Orthomosaics are like those maps of Mars where they use software to glue all the individual photos together and it’s a complete map of the planet. You can imagine how useful an orthomosaic can be for dividing up an area for a search and seeing the progress of the search and rescue effort.

Search and rescue teams can use that same data for a digital elevation map. That’s software that gets the topology of the rubble and you can start actually measuring how high the pile is, how thick that slab is, that this piece of rubble must have come from this part of the building, and those sorts of things.


How might ground robots be used in this type of disaster?

The current state of the practice for searching the interior of rubble is to use either a small tracked vehicle, such as an Inkutun VGTV Extreme, which is the most commonly used robot for such situations, or a snakelike robot, such as the Active Scope Camera developed in Japan.

Teledyne FLIR is sending a couple of tracked robots and operators to the site in Surfside, Florida.

Ground robots are typically used to go into places that searchers can’t fit into and go farther than search cameras can. Search cams typically max out at 18 feet, whereas ground robots have been able to go over 60 feet into rubble. They are also used to go into unsafe voids that a rescuer could fit in but that would be unsafe and thus would require teams to work for hours to shore up before anyone could enter it safely.

In theory, ground robots could also be used to allow medical personnel to see and talk with survivors trapped in rubble, and carry small packages of water and medicine to them. But so far no search and rescue teams anywhere have found anyone alive with a ground robot.


What are the challenges for using ground robots inside rubble?

The big problem is seeing inside the rubble. You’ve got basically a concrete, sheetrock, piping and furniture version of pickup sticks. If you can get a robot into the rubble, then the structural engineers can see the interior of that pile of pickup sticks and say “Oh, OK, we’re not going pull on that, that’s going to cause a secondary collapse. OK, we should start on this side, we’ll get through the debris quicker and safer.”

Going inside rubble piles is really hard. Scale is important. If the void spaces are on the order of the size of the robot, it’s tricky. If something goes wrong, it can’t turn around; it has to drive backward. Tortuosity – how many turns per meter – is also important. The more turns, the harder it is.

There’s also different surfaces. The robot may be on a concrete floor, next thing it’s on a patch of somebody’s shag carpeting. Then it’s got to go through a bunch of concrete that’s been pulverized into sand. There’s dust kicking up. The surroundings may be wet from all the sewage and all the water from sprinkler systems and the sand and dust start acting like mud. So it gets really hard really fast in terms of mobility.


What is your current research focus?

We look at human-robot interaction. We discovered that of all of the robots we could find in use, including ours – and we were the leading group in deploying robots in disasters – 51% of the failures during a disaster deployment were due to human error.

It’s challenging to work in these environments. I’ve never been in a disaster where there wasn’t some sort of surprise related to perception, something that you didn’t realize you needed to look for until you’re there.


What is your Ideal search and rescue robot?

I’d like someone to develop a robot ferret. Ferrets are kind of snakey-looking mammals. But they have legs, small little legs. They can scoot around like a snake. They can claw with their little feet and climb up on uneven rocks. They can do a full meerkat, meaning they can stretch up really high and look around. They’re really good at balance, so they don’t fall over. They can be looking up and all of a sudden the ground starts to shift and they’re down and they’re gone – they’re fast.


How do you see the field of search and rescue robots going forward?

There’s no real funding for these types of ground robots. So there’s no economic incentive to develop robots for building collapses, which are very rare, thank goodness.

And the public safety agencies can’t afford them. They typically cost US$50,000 to $150,000 versus as little as $1,000 for an aerial drone. So the cost-benefit doesn’t seem to be there.

I’m very frustrated with this. We’re still about the same level we were 20 years ago at the World Trade Center.


This article was republished with permission from The Conversation, a news site dedicated to sharing ideas from academic experts.  It was written by and represents the research-based opinions
of 
Robin R. Murphy Raytheon Professor of Computer Science and Engineering; Vice-President Center for
Robot-Assisted Search and Rescue (nfp), Texas A&M University


Suggested Content:

Why Gain of Function Research is Being Conducted

Mobile Artificial Intelligence is an Ever-Expanding Technology


Tracing the Origins of a Virus

One Stop Systems Virtual Road Show (Video)


Stay up to date. Follow us:


Stay up to date. Follow us:

Will the Robinhood IPO Further Democratize Finance?


Robinhood’s IPO is Likely to be a Big Focus this Summer, Here’s Why


Robinhood, the zero-commission investment app that has forever change what it means to be a self-directed investor, disclosed details of their plans to go public in an initial public offering (IPO). Robinhood’s IPO is already highly anticipated as customers of the service turned the markets on its head last year with their self-styled trading methods. As much as Robinhood was a disruptor in the brokerage industry, customers of the service have inspired disruptions to the entire market. Parts of this IPO may allow the company and its users to force even more change.


Details

The public now gets to peek behind the curtain as the required disclosures for an IPO bare so much about the private company that was unknown. In a prospectus made available Thursday (July 1), Robinhood states it had 18 million funded accounts for the quarter ended March 31. This customer base is more than double the 7.2 million accounts held at the end of the first quarter a year earlier. They also show a loss of $1.4 billion during the first quarter. Investors ’ determining value will be weighing account growth against revenues amongst a myriad of other factors.

According to the filings, Robinhood Markets, Inc. looks to raise $100 million. There are no disclosures as to how many shares will be offered or the price range. That information is expected to be brought out in future filings. The $100 million is a common “placeholder” number that will change with future filings. The stock’s symbol will be HOOD and will trade on the Nasdaq market. 

There’s a required 15 day waiting period after an IPO prospectus becomes available publicly before the company can begin marketing its IPO. The timeline allows for the company to become listed as early as late July.

The $1.4 billion in losses for the first quarter of 2021 is up from a $52.5 million loss for the same period in 2020. Revenue more than tripled to $522.1 million from Q1 2020 to Q1 2021. Most of the first-quarter losses were the result of a write-off related to a change in the fair value of convertible notes and warrants stemming from a $3.4 billion fundraising in February.


IPO Set-Aside for Customers

Robinhood has as part of its business model and mission to “Democratize Finance for All” this includes working to avail individual investors to IPOs. Customers of Robinhood, who use their IPO Access, can buy shares of certain offerings. The company is setting aside as much as 35% of the as yet issued shares in the IPO for sale to Robinhood customers through this IPO Access feature, (see prospectus).


Additional Info

Robinhood has raised $5.6 billion in funding. That includes $3.4 billion earlier in 2021  in a round led by Ribbit Capital with participation from existing investors including ICONIQ Capital, Andreessen Horowitz, Sequoia, Index Ventures, and NEA The firm was valued at nearly $12 billion before the IPO – that number is expected to hit $40 billion or more by the time of the offering.  The prospectus lists 17 investment banks working on the deal. Goldman Sachs and J.P. Morgan are the lead underwriters.


Take-Away

Retail investors are being liberated by technology, innovation, and competition. With greater freedoms comes greater responsibility to educate one’s self, act responsibly, and follow due diligence best practices. Channelchek is a resource for investors to dig a little deeper into the small and microcap sector to aid in assessing risk/reward possibilities.  Register to receive our daily research and reports here.


Suggested Reading:

How Rising Rates Could Make Brokers Like Robinhood More Profitable

Class Actions Suit Against Robinhood


Can Small Investors Compete With Wall Street?

A Feather in the Cap of Robinhood Traders


 Sources:

https://blog.robinhood.com/news/2021/2/1/robinhood-raises-34-billion-to-fuel-record-customer-growth

https://www.sec.gov/Archives/edgar/data/1783879/000162828021013318/robinhoods-1.htm

https://www.lw.com/thoughtLeadership/lw-us-ipo-guide

https://www.lw.com/thoughtLeadership/lw-us-ipo-guide

https://www.barrons.com/articles/robinhood-ipo-files-to-go-public-51625161493

https://blog.robinhood.com/news/2021/2/1/robinhood-raises-34-billion-to-fuel-record-customer-growth


Stay up to date. Follow us:


Stay up to date. Follow us:

Industry Report – Metals & Mining Second Quarter 2021 Review and Outlook

Friday, July 2, 2021

Minerals Industry Report

Metals & Mining Second Quarter 2021 Review and Outlook

Mark Reichman, Senior Research Analyst, Noble Capital Markets, Inc.

Refer to end of report for Analyst Certification & Disclosures

  • Mining companies modestly trailed the broader market. During the second quarter of 2021, mining companies (as measured by the XME) gained 7.9% compared to 8.2% for the broader market as measured by the S&P 500 index. The VanEck Vectors Gold Miners (GDX) and Junior Gold Miners (GDXJ) ETFs were up 4.6% and 3.9%, respectively. During the second quarter, gold, silver, copper, lead, and zinc futures prices were up 3.2%, 6.4%, 7.4%, 3.5%, and 9.5%, respectively. While gold and silver recovered some of their first quarter losses, prices were still down year-to-date through June 30, while copper, lead and zinc prices were up 21.8%, 13.7%, and 12.0%, respectively. While the U.S. Dollar Index rose 2.7% year-to-date through June 30, it was down under 1% during the second quarter.
  • Reading the Fed’s tea leaves. The Federal Reserve threw some cold water on the reflation trade during their Federal Open Market Committee (FOMC) meeting in June with economic projections that led investors to worry that the Fed could increase rates sooner than previously expected. While the FOMC will meet again in July, investors will have to wait until the FOMC meeting in September for the next set of economic projections. In the interim, commentary at the Jackson Hole Economic Policy Symposium in August may provide more clues about the Fed’s direction.
  • We remain constructive on the sector. We think gold and silver could remain somewhat range-bound for the remainder of 2021 with silver offering modestly higher upside due to growing industrial demand and where it trades relative to gold. Much will depend on inflation expectations, U.S. dollar strength, and other uncertainties. This is not a bad thing, in our view, given that precious metals prices should be profitable for producers at current levels. Demand for base metals will likely benefit from global economic growth and infrastructure spending and we think prices could go higher. Additionally, secular themes, including trends toward electrification, favor metals used in electric vehicle batteries, infrastructure, and solar and renewable power technologies.
  • Taking the long view. Investors should consider gaining exposure to precious and base metals through mining stocks. Real interest rates are likely to remain low for the foreseeable future, despite potential increases in nominal rates, and gold could remain attractive as a store of value. Presently, we do not view volatile cryptocurrencies as a credible substitute for this function. Importantly, metals prices could have an upward bias given relatively modest levels of reinvestment in new reserves and resources in recent years.

GENERAL DISCLAIMERS

All statements or opinions contained herein that include the words “we”, “us”, or “our” are solely the responsibility of Noble Capital Markets, Inc.(“Noble”) and do not necessarily reflect statements or opinions expressed by any person or party affiliated with the company mentioned in this report. Any opinions expressed herein are subject to change without notice. All information provided herein is based on public and non-public information believed to be accurate and reliable, but is not necessarily complete and cannot be guaranteed. No judgment is hereby expressed or should be implied as to the suitability of any security described herein for any specific investor or any specific investment portfolio. The decision to undertake any investment regarding the security mentioned herein should be made by each reader of this publication based on its own appraisal of the implications and risks of such decision.

This publication is intended for information purposes only and shall not constitute an offer to buy/sell or the solicitation of an offer to buy/sell any security mentioned in this report, nor shall there be any sale of the security herein in any state or domicile in which said offer, solicitation or sale would be unlawful prior to registration or qualification under the securities laws of any such state or domicile. This publication and all information, comments, statements or opinions contained or expressed herein are applicable only as of the date of this publication and subject to change without prior notice. Past performance is not indicative of future results. Noble accepts no liability for loss arising from the use of the material in this report, except that this exclusion of liability does not apply to the extent that such liability arises under specific statutes or regulations applicable to Noble. This report is not to be relied upon as a substitute for the exercising of independent judgement. Noble may have published, and may in the future publish, other research reports that are inconsistent with, and reach different conclusions from, the information provided in this report. Noble is under no obligation to bring to the attention of any recipient of this report, any past or future reports. Investors should only consider this report as single factor in making an investment decision.


IMPORTANT DISCLOSURES

This publication is confidential for the information of the addressee only and may not be reproduced in whole or in part, copies circulated, or discussed to another party, without the written consent of Noble Capital Markets, Inc. (“Noble”). Noble seeks to update its research as appropriate, but may be unable to do so based upon various regulatory constraints. Research reports are not published at regular intervals; publication times and dates are based upon the analyst’s judgement. Noble professionals including traders, salespeople and investment bankers may provide written or oral market commentary, or discuss trading strategies to Noble clients and the Noble proprietary trading desk that reflect opinions that are contrary to the opinions expressed in this research report.
The majority of companies that Noble follows are emerging growth companies. Securities in these companies involve a higher degree of risk and more volatility than the securities of more established companies. The securities discussed in Noble research reports may not be suitable for some investors and as such, investors must take extra care and make their own determination of the appropriateness of an investment based upon risk tolerance, investment objectives and financial status.

Company Specific Disclosures

The following disclosures relate to relationships between Noble and the company (the “Company”) covered by the Noble Research Division and referred to in this research report.
Noble is not a market maker in any of the companies mentioned in this report. Noble intends to seek compensation for investment banking services and non-investment banking services (securities and non-securities related) with any or all of the companies mentioned in this report within the next 3 months

ANALYST CREDENTIALS, PROFESSIONAL DESIGNATIONS, AND EXPERIENCE

Senior Equity Analyst focusing on Basic Materials & Mining. 20 years of experience in equity research. BA in Business Administration from Westminster College. MBA with a Finance concentration from the University of Missouri. MA in International Affairs from Washington University in St. Louis.
Named WSJ ‘Best on the Street’ Analyst and Forbes/StarMine’s “Best Brokerage Analyst.”
FINRA licenses 7, 24, 63, 87

WARNING

This report is intended to provide general securities advice, and does not purport to make any recommendation that any securities transaction is appropriate for any recipient particular investment objectives, financial situation or particular needs. Prior to making any investment decision, recipients should assess, or seek advice from their advisors, on whether any relevant part of this report is appropriate to their individual circumstances. If a recipient was referred to Noble Capital Markets, Inc. by an investment advisor, that advisor may receive a benefit in respect of
transactions effected on the recipients behalf, details of which will be available on request in regard to a transaction that involves a personalized securities recommendation. Additional risks associated with the security mentioned in this report that might impede achievement of the target can be found in its initial report issued by Noble Capital Markets, Inc. This report may not be reproduced, distributed or published for any purpose unless authorized by Noble Capital Markets, Inc.

RESEARCH ANALYST CERTIFICATION

Independence Of View
All views expressed in this report accurately reflect my personal views about the subject securities or issuers.

Receipt of Compensation
No part of my compensation was, is, or will be directly or indirectly related to any specific recommendations or views expressed in the public appearance and/or research report.

Ownership and Material Conflicts of Interest
Neither I nor anybody in my household has a financial interest in the securities of the subject company or any other company mentioned in this report.

NOBLE RATINGS DEFINITIONS
% OF SECURITIES COVERED
% IB CLIENTS
Outperform: potential return is >15% above the current price
78%
31%
Market Perform: potential return is -15% to 15% of the current price
8%
3%
Underperform: potential return is >15% below the current price
0%
0%

NOTE: On August 20, 2018, Noble Capital Markets, Inc. changed the terminology of its ratings (as shown above) from “Buy” to “Outperform”, from “Hold” to “Market Perform” and from “Sell” to “Underperform.” The percentage relationships, as compared to current price (definitions), have remained the same. Additional information is available upon request. Any recipient of this report that wishes further information regarding the subject company or the disclosure information mentioned herein, should contact Noble Capital Markets, Inc. by mail or phone.

Noble Capital Markets, Inc.
225 NE Mizner Blvd. Suite 150
Boca Raton, FL 33432
561-994-1191

Noble Capital Markets, Inc. is a FINRA (Financial Industry Regulatory Authority) registered broker/dealer.
Noble Capital Markets, Inc. is an MSRB (Municipal Securities Rulemaking Board) registered broker/dealer.
Member – SIPC (Securities Investor Protection Corporation)

Report ID: 12181
Metals & Mining | April 5, 2021

Industry Report – Energy – The Outlook for Energy Stocks Keeps Getting Better

Friday, July 2, 2021

Energy Industry Report

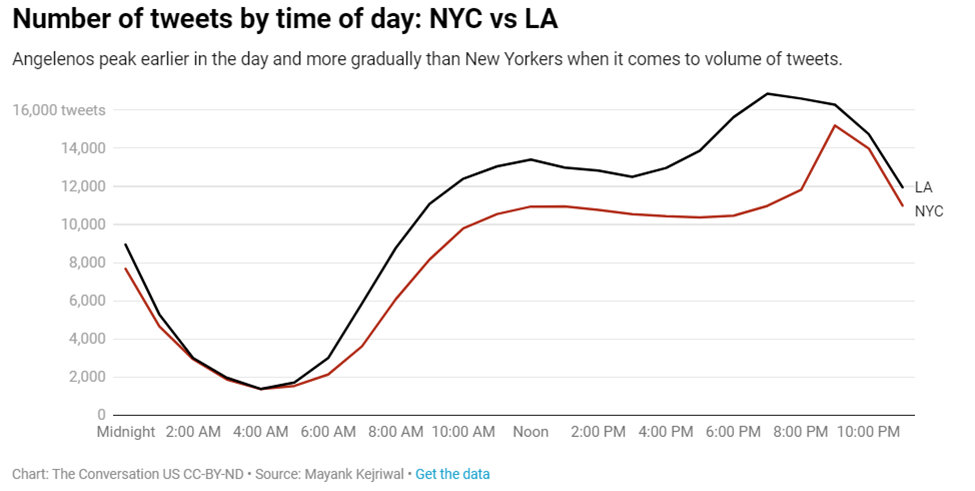
Where Is The Supply Response?

Michael Heim, CFA, Senior Research Analyst, Noble Capital Markets, Inc.

Refer to end of report for Analyst Certification & Disclosures

  • Stocks are responding.  Energy stocks, as measured by the XLE Energy Index, have underperformed the overall market for many years but have started to show signs of a rebound. The XLE rose 10.7% in the June quarter versus an 8.4% rise in the S&P 500 Index. This marks the third consecutive quarter of outperformance and tracks the rise in oil prices that began last November.
  • Oil prices are crossing new levels. Oil prices continued their upward trend in the first quarter with WTI prices crossing $75/bbl. at the end of the quarter. Oil prices have reached levels not seen since 2018 and show no signs of letting up. Brent prices are trading closer to $76/bbl. The spread between WTI and Brent prices has narrowed as U.S. producers have been slower to accelerate drilling than other parts of the world.
  • Natural gas prices are starting to take off. Natural Gas prices have also been exceptionally strong in recent months climbing above $3.60/mcf. Recent heat waves across much of the country has meant that gas-fired turbines are running at full speed.
  • Long-term trends favor renewable, nuclear and natural gas but oil is holding steady. Energy sources in the United States are undergoing a significant transformation away from carbon-based fuels. Coal consumption has been replaced by renewable, nuclear, and natural gas. Worth noting, petroleum consumption, which grew dramatically in the last 50 years, has maintained the levels reached at the end of the century.
  • The next few quarters could be very good for energy companies. The rebound in oil and natural prices came faster than expected and is staying higher than we would have expected. Our near-term outlook for energy stocks remains positive.


Energy Stocks

Energy stocks, as measured by the XLE Energy Index, have underperformed the overall market for many years but have started to show signs of a rebound. The XLE rose 10.7% in the June quarter versus an 8.4% rise in the S&P 500 Index. This marks the third consecutive quarter of outperformance and tracks the rise in oil prices that began last November. The chart below shows that the performance of energy stocks in comparison to the S&P Composite Index over the last twelve months.

Figure #1


Source: Yahoo Finance


Oil Prices

Oil prices continued their upward trend in the first quarter with WTI prices crossing $75/bbl. at the end of the quarter. Oil prices have reached levels not seen since 2018 and show no signs of letting up. Brent prices are trading closer to $76/bbl. The spread between WTI and Brent prices has narrowed as U.S. producers have been slower to accelerate drilling than other parts of the world. We would attribute the delays to transmission issues in the Permian Basin during extremely cold temperatures in Texas in February. The delay also reflects the impact that low oil prices in 2020 have had upon the health of smaller domestic producers.–

Figure #2

Source: OilPrice.com


OPEC, which initiated supply reductions last year, has maintained those reductions through the first half of 2021 despite the improved demand outlook. A tentative agreement between Saudi Arabia and Russia will gradually increase production by 2 million barrels/day over the rest of the year. We believe the increase will offset growing demand associated with post-pandemic global economic expansion and that it will not have an adverse impact on oil prices. The oil futures curve shows oil prices declining on the out months but staying above $70/bbl. through December.

Meanwhile, domestic producers have been slow to react to higher oil prices but have begun to accelerate drilling in recent months. There are 77% more than half the number of active oil rigs in the United States versus this time last year (470 verses 265). That said, there are only half the number of active rigs in the United States as compared to pre-pandemic levels. The figure below shows the contrast in rig count and oil prices over the last three years. The lack of a supply response to higher prices has meant, and will most likely continue to mean, that oil prices could stay at levels above what we consider to be the long-term normalized price for quite some time.

Figure #3

High oil prices, combined with improved operating efficiencies mean that production companies are facing very favorable returns on their investment. We look for companies to start reporting strong positive cash flow and to use cash flow to increase drilling and improve balance sheets. We do not expect companies to raise dividend payments given the cyclical nature of recent oil price trends but would not rule out share repurchases if stock prices do not rebound further.

 Natural Gas Prices

Natural Gas prices have also been exceptionally strong in recent months climbing above $3.60/mcf. Recent heat waves across much of the country has meant that gas-fired turbines are running at full speed.

Figure #4

Source: OilPrice.com


Storage levels, which exited the winter heating season below historical averages, have returned to normal levels. Drilling activity has started to pick up but remains well below pre-pandemic levels. There were 98 natural gas rigs drilling in the United States, up 30% from a year ago. As is the case with oil, we believe the lack of a supply response could mean that natural gas prices remain at elevated levels for several quarters. The gas futures curve is flat, dipping only a few cents into the fall months but then rising back above $3.60/mcf. during the winter months.

Figure #5


Longer-term energy trends

Energy sources in the United States are undergoing a significant transformation away from carbon-based fuels. While this should not be a surprise to anyone, it is worth taking a long-term view of energy consumption to highlight how the transformation has acerated in recent years. The chart below energy sources over the last 250 years. As one might expect, coal consumption has fallen sharply in the last ten years. Coal consumption has been replaced by renewable, nuclear, and natural gas. Worth noting, petroleum consumption, which grew dramatically in the last 50 years, has maintained the levels reached at the end of the century. We believe this trend will continue with petroleum providing a smaller portion of the overall energy picture, but not necessarily declining in absolute value.

Figure #6


Outlook

The rebound in oil and natural prices came faster than expected and is staying higher than we would have expected. We have been adjusting our models to reflect higher prices but are maintaining our long-term oil price forecast of $50 per barrel and $2.50 per mcf. Energy companies should start reporting positive cash flow at these prices and increasing drilling budgets.

Our near-term outlook for energy stocks remains positive. We expect companies to report favorable results for the next few quarters. Longer-term, we have concern that oil demand will be constrained by power generation competition from renewable energy and decreased demand for gasoline and diesel due to a growth in electric vehicles. At the same time, increased supply from OPEC and continued drilling productivity will mean lower energy prices. We recommend investors stay focused on energy companies with solid balance sheets, low operating costs and protected prices.

GENERAL DISCLAIMERS

All statements or opinions contained herein that include the words “we”, “us”, or “our” are solely the responsibility of Noble Capital Markets, Inc. (“Noble”) and do not necessarily reflect statements or opinions expressed by any person or party affiliated with the company mentioned in this report. Any opinions expressed herein are subject to change without notice. All information provided herein is based on public and non-public information believed to be accurate and reliable, but is not necessarily complete and cannot be guaranteed. No judgment is hereby expressed or should be implied as to the suitability of any security described herein for any specific investor or any specific investment portfolio. The decision to undertake any investment regarding the security mentioned herein should be made by each reader of this publication based on its own appraisal of the implications and risks of such decision.

This publication is intended for information purposes only and shall not constitute an offer to buy/sell or the solicitation of an offer to buy/sell any security mentioned in this report, nor shall there be any sale of the security herein in any state or domicile in which said offer, solicitation or sale would be unlawful prior to registration or qualification under the securities laws of any such state or domicile. This publication and all information, comments, statements or opinions contained or expressed herein are applicable only as of the date of this publication and subject to change without prior notice. Past performance is not indicative of future results.

Noble accepts no liability for loss arising from the use of the material in this report, except that this exclusion of liability does not apply to the extent that such liability arises under specific statutes or regulations applicable to Noble. This report is not to be relied upon as a substitute for the exercising of independent judgement. Noble may have published, and may in the future publish, other research reports that are inconsistent with, and reach different conclusions from, the information provided in this report. Noble is under no obligation to bring to the attention of any recipient of this report, any past or future reports. Investors should only consider this report as single factor in making an investment decision.

IMPORTANT DISCLOSURES

This publication is confidential for the information of the addressee only and may not be reproduced in whole or in part, copies circulated, or discussed to another party, without the written consent of Noble Capital Markets, Inc. (“Noble”). Noble seeks to update its research as appropriate, but may be unable to do so based upon various regulatory constraints. Research reports are not published at regular intervals; publication times and dates are based upon the analyst’s judgement. Noble professionals including traders, salespeople and investment bankers may provide written or oral market commentary, or discuss trading strategies to Noble clients and the Noble proprietary trading desk that reflect opinions that are contrary to the opinions expressed in this research report.

The majority of companies that Noble follows are emerging growth companies. Securities in these companies involve a higher degree of risk and more volatility than the securities of more established companies. The securities discussed in Noble research reports may not be suitable for some investors and as such, investors must take extra care and make their own determination of the appropriateness of an investment based upon risk tolerance, investment objectives and financial status.

Company Specific Disclosures

The following disclosures relate to relationships between Noble and the company (the “Company”) covered by the Noble Research Division and referred to in this research report.

Noble is not a market maker in any of the companies mentioned in this report. Noble intends to seek compensation for investment banking services and noninvestment banking services (securities and non-securities related) with any or all of the companies mentioned in this report within the next 3 months.

ANALYST CREDENTIALS, PROFESSIONAL DESIGNATIONS, AND EXPERIENCE

Senior Equity Analyst focusing on energy and utility stocks. 24 years of experience as an analyst. Chartered Financial Analyst©. MBA from Washington University in St. Louis and BA in Economics from Carleton College in Minnesota. Named WSJ ‘Best on the Street’ Analyst four times. Named Forbes/StarMine’s “Best Brokerage Analyst” three times. FINRA licenses 7, 63, 86, 87.

WARNING

This report is intended to provide general securities advice, and does not purport to make any recommendation that any securities transaction is appropriate for any recipient particular investment objectives, financial situation or particular needs. Prior to making any investment decision, recipients should assess, or seek advice from their advisors, on whether any relevant part of this report is appropriate to their individual circumstances. If a recipient was referred to by an investment advisor, that advisor may receive a benefit in respect of transactions effected on the recipients behalf, details of which will be available on request in regard to a transaction that involves a personalized securities recommendation. Additional risks associated with the security mentioned in this report that might impede achievement of the target can be found in its initial report issued by . This report may not be reproduced, distributed or published for any purpose unless authorized by.

RESEARCH ANALYST CERTIFICATION

Independence Of View

All views expressed in this report accurately reflect my personal views about the subject securities or issuers.

Receipt of Compensation

No part of my compensation was, is, or will be directly or indirectly related to any specific recommendations or views expressed in the public appearance and/or research report.

Ownership and Material Conflicts of Interest

Neither I nor anybody in my household has a financial interest in the securities of the subject company or any other company mentioned in this report.

NOBLE RATINGS DEFINITIONS % OF SECURITIES COVERED % IB CLIENTS
Outperform: potential return is >15% above the current price 84% 31%
Market Perform: potential return is -15% to 15% of the current price 3% 1%
Underperform: potential return is >15% below the current price 0% 0%

NOTE: On August 20, 2018, Noble Capital Markets, Inc. changed the terminology of its ratings (as shown above) from “Buy” to “Outperform”, from “Hold” to “Market Perform” and from “Sell” to “Underperform.” The percentage relationships, as compared to current price (definitions), have remained the same.

Additional information is available upon request. Any recipient of this report that wishes further information regarding the subject company or the disclosure information mentioned herein, should contact Noble Capital Markets, Inc. by mail or phone.

Noble Capital Markets, Inc.
225 NE Mizner Blvd. Suite 150
Boca Raton, FL 33432
561-994-1191

Noble Capital Markets, Inc. is a FINRA (Financial Industry Regulatory Authority) registered broker/dealer.
Noble Capital Markets, Inc. is an MSRB (Municipal Securities Rulemaking Board) registered broker/dealer.
Member – SIPC (Securities Investor Protection Corporation)

Report ID: 23804

Bassett Furniture (BSET) – Post COVID Recovery Continues

Friday, July 02, 2021

Bassett Furniture (BSET)
Post COVID Recovery Continues

Bassett Furniture Industries Inc is a manufacturer, importer, and retailer of home furnishings products in the United States. It operates through the following segments: The Wholesale segment focuses on the design, manufacture, sourcing, sale, and distribution of furniture products. The Retail segment consists of company-owned stores. The Logistical Services segment offers shipping, delivery, and warehousing services.

Joe Gomes, Senior Research Analyst, Noble Capital Markets, Inc.

Refer to the full report for the price target, fundamental analysis, and rating.

    2Q21 Results. Revenue of $124.1 million jumped 94% y-o-y and was up 15% compared to the non-COVID impacted 2Q19. Wholesale sales rose 129.7%, while Retail sales increased 29.3% and Logistics segment revenue was up 7.0%. Bassett reported net income of $6.0M, or $0.60 per share, compared to a net loss of $20.4 million, or $2.04 per share, last year, which included impairment charges and litigation expenses. We had forecast revenue of $116 million and EPS of $0.35.

    Strong Orders = Elevated Backlog.  Wholesale orders of $96 million rose 172% versus 2Q20 and were up 51% over 2Q19. Basset saw strong demand in its Bassett Design Center Network, up 212% and 87%, respectively compared to 2020 and 2019. Basset Club Level was up 328% versus 2019. And Bassett’s outdoor offerings were up 112% and 124%, respectively, over 2020 and 2019. Backlog in the quarter increased …


This Company Sponsored Research is provided by Noble Capital Markets, Inc., a FINRA and S.E.C. registered broker-dealer (B/D).

*Analyst certification and important disclosures included in the full report. NOTE: investment decisions should not be based upon the content of this research summary.  Proper due diligence is required before making any investment decision. 

Can You Invest in Uranium Directly?


Image Credit: IAEA Image Bank (Flickr)


This Firm Facilitates Direct Investment in Physical Uranium


Sure, Robinhood provides the ability to invest in fractional shares, and you can trade 7 different
cryptocurrency coins, but can you buy 50 tons of physical uranium?

In a press release dated this past Tuesday, Uranium Trading Corporation (UTC) announced they were the facilitator of the purchase of uranium for a large multifamily office.  The initial purchase amount is for 100,000 pounds of U3O8. Not too long ago a physical investment in U308 would have seemed impossible. Today the doors are opening on once undreamt-of investment fronts – holding this increasingly popular commodity is just another one.


Background

The demand for uranium is expected to exceed its supply in the near future. UTC, founded in 2018, was formed to provide the means for investors to invest in business opportunities in the civil uranium market. The means to transact in the fuel involves UTC,  a corporation that directly invests in natural uranium oxide in concentrates (“U3O8”) and uranium hexafluoride (“UF6)  and a company named 92 Trading, LLC which will provide management services to UTC.  92 Trading is engaged in pursuing commercial business and providing trading opportunities in the international uranium market. Its objective is to generate value for UTC investors and provide a pathway for it to invest in the storage of physical uranium with the goal of achieving capital appreciation resulting from any price increases due to expected future fundamental supply and demand imbalances.

As it relates to this transaction for the family office, David Berklite, CEO of Uranium Trading Corp said, “We are excited to have the opportunity to open up a market that has historically been isolated from the financial investment community,” he added “This purchase comes at a time when supply is being shut in globally and demand from reactor new builds continues its accelerated growth trajectory.  As an asset class, uranium as a commodity represents what we believe to be a compelling opportunity with almost no correlation to any other asset class.” 

No other details about this transaction have been given. Channelchek reached out to spokesman for UTC, for further information. We will pass anything pertinent along to our readers as they respond. Channelchek also discussed this with Noble Capital Markets Senior Energy Analyst Michael Heim, he commented, “…there is definitely a trend towards more speculative uranium trading.” Heim followed with, “…they now trade uranium futures, @UXX.1 on CNBC and UX=F on Yahoo, but they are very thinly traded.”


Take-Away

The move away from carbon-based fuels has caused a move toward uranium as a possible replacement for reliable energy for electric generation. Uranium has come back into vogue just as some large mines have closed or reduced output. Investors are looking to capitalize on what they now see as a recipe for higher uranium prices. Most trade in mining companies (see partial list below), it now appears direct investment is not impossible.

Paul Hoffman

Managing Editor, Channelchek

Suggested Content:

The Increasing Popularity of Uranium Investments

Recipe for Higher Uranium Prices


One-on-One With encore Energy

One-on-One with Energy Fuels


Sources:

https://prnmedia.prnewswire.com/news-releases/uranium-trading-corporation-makes-initial-uranium-purchase-301322469.html

https://www.sec.gov/Archives/edgar/data/1750407/000149315218014189/ex10-1.htm

Virtual Roadshow with Capstone Green Energy (CGRN) CEO Darren Jamison & CFO Eric Henchken


Capstone Green Energy President & CEO Darren Jamison and CFO Eric Henchken make a formal corporate presentation. Afterwards, they are joined by Noble Capital Markets Senior Research Analyst Michael Heim for a Q & A session featuring questions asked by the live audience throughout the event.

Research, News, and Advanced Market Data on CGRN


Information on upcoming live virtual roadshows

About Capstone Green Energy

Capstone Green Energy (www.CapstoneGreenEnergy.com) (NASDAQ:CGRN) is a leading provider of customized microgrid solutions and on-site energy technology systems focused on helping customers around the globe meet their environmental, energy savings, and resiliency goals. Capstone Green Energy focuses on four key business lines. Through its Energy as a Service (EaaS) business, it offers rental solutions utilizing its microturbine energy systems and battery storage systems, comprehensive Factory Protection Plan (FPP) service contracts that guarantee life-cycle costs, as well as aftermarket parts. Energy Conversion Products are driven by the Company’s industry-leading, highly efficient, low-emission, resilient microturbine energy systems offering scalable solutions in addition to a broad range of customer-tailored solutions, including hybrid energy systems and larger frame industrial turbines. The Energy Storage Products business line designs and installs microgrid storage systems creating customized solutions using a combination of battery technologies and monitoring software. Through Hydrogen Energy Solutions, Capstone Green Energy offers customers a variety of hydrogen products, including the Company’s microturbine energy systems.

Release – Kratos Developing Hypersonic Flight Experiment Test Vehicle in Maryland


Kratos Developing Hypersonic Flight Experiment Test Vehicle in Maryland


Defense & Rocket Support Services Division Contract to Bring New Jobs to Glen Burnie Facility

SAN DIEGO
July 01, 2021 (GLOBE NEWSWIRE) — 
Kratos Defense & Security Solutions, Inc. (Nasdaq: KTOS), a leading National Security Solutions provider, announced today that its Defense & 
Rocket Support Services (DRSS) Division has received a contract from the Navy Surface Warfare Center Port Hueneme Division, White Sands Detachment to develop a hypersonic, experimental test vehicle to perform flight tests for the maturation of high-speed flight technology for missile defense and hypersonics research.

Kratos DRSS is a leading provider of products and solutions in support of ballistic missile targets, hypersonic systems, sub-orbital research, sounding rockets, directed energy and laser program systems. Work under this contract will be performed at a secure Kratos facility in 
Glen Burnie and other vendor locations, bringing new jobs to 
Maryland.

Dave Carter, President of DRSS, said, “Our Hypersonic Flight Experiment Test Vehicle is a next generation solution based on proven sounding rocket technology that will allow for the conduct of rapidly fielded flight experiments for hypersonic technologies such as propulsion, thermal protection systems, seeker windows, control systems, and more. We are proud to be the first private industry player to develop these advanced systems in Maryland.”

The mission of this flight experiment vehicle will be to support the development of innovative and enabling technologies for urgent requirements by providing flight tests and demonstration opportunities in relevant environments. This rapid testing capability will allow lower Technology Readiness Level (TRL) components to be matured faster for insertion into future missile programs.

Eric DeMarco, President and CEO of Kratos Defense & Security Solutions, Inc., said, “This flight vehicle will be a game-changer for critical 
DoD programs to maneuver key hypersonic technologies through the “Valley of Death” between technology development and commercialization. This pivotal program is yet another demonstration of Kratos’ commitment to helping our customers achieve mission success for critical national security programs with our leading-edge, affordable solutions.”  

Kratos is partnered with the Naval Surface Warfare Center Port Hueneme Division, White Sands Detachment, 
New Mexico State University
Physical Sciences Laboratory, and others for this program.

About Kratos Defense & Security Solutions

Kratos Defense & Security Solutions, Inc. (NASDAQ:KTOS) develops and fields transformative, affordable technology, platforms and systems for United States National Security related customers, allies and commercial enterprises. Kratos is changing the way breakthrough technology for these industries are rapidly brought to market through proven commercial and venture capital backed approaches, including proactive research and streamlined development processes. At Kratos, affordability is a technology and we specialize in unmanned systems, satellite communications, cyber security/warfare, microwave electronics, missile defense, hypersonic systems, training, combat systems and next generation turbo jet and turbo fan engine development. For more information go to www.KratosDefense.com.

Notice Regarding Forward-Looking Statements
Certain statements in this press release may constitute “forward-looking statements” within the meaning of the Private Securities Litigation Reform Act of 1995. These forward-looking statements are made on the basis of the current beliefs, expectations and assumptions of the management of Kratos and are subject to significant risks and uncertainty. Investors are cautioned not to place undue reliance on any such forward-looking statements. All such forward-looking statements speak only as of the date they are made, and Kratos undertakes no obligation to update or revise these statements, whether as a result of new information, future events or otherwise. Although Kratos believes that the expectations reflected in these forward-looking statements are reasonable, these statements involve many risks and uncertainties that may cause actual results to differ materially from what may be expressed or implied in these forward-looking statements. For a further discussion of risks and uncertainties that could cause actual results to differ from those expressed in these forward-looking statements, as well as risks relating to the business of Kratos in general, see the risk disclosures in the Annual Report on Form 10-K of Kratos for the year ended 
December 27, 2020, and in subsequent reports on Forms 10-Q and 8-K and other filings made with the 
SEC by Kratos.

Press Contact:
Yolanda White
858-812-7302 Direct

Investor Information:
877-934-4687
[email protected]

Source: Kratos Defense & Security Solutions, Inc.

Release – Eagle Bulk Shipping Inc. Publishes 2021 ESG Sustainability Report

Eagle Bulk Shipping Inc. Publishes 2021 ESG Sustainability Report


STAMFORD, Conn.
July 01, 2021 (GLOBE NEWSWIRE) — 
Eagle Bulk Shipping Inc. (NASDAQ: EGLE) (“Eagle Bulk,” “Eagle” or the “Company”), one of the world’s largest owner-operators within the Supramax / Ultramax drybulk segment, today announced that it has issued its second annual Environmental, Social, and Governance (ESG) Sustainability Report.

The report, which has been prepared in accordance with the Marine Transportation Framework established by the 
Sustainability Accounting Standards Board (SASB), provides an overview of Eagle’s strategic priorities and performance with respect to various environmental, social, and governance-related matters.

Gary Vogel, Eagle Bulk’s CEO, commented, “We are very pleased to be publishing our second annual ESG Sustainability Report and hope it will provide readers with a good understanding of our ESG strategy, as well as our performance on environmental, social, and governance issues. Throughout the past year, we continued to execute on a number of important ESG-related initiatives, including our principal focus on ensuring the safety and wellbeing of all of our shipboard and shoreside colleagues throughout the pandemic. Notably, in the path towards decarbonization, we reaffirmed our commitment to transparent emissions reporting, by becoming early signatories to the Sea  Cargo Charter.”  

Eagle’s ESG Sustainability Report can be accessed at www.eagleships.com/ESG.

About Eagle Bulk Shipping Inc.

Eagle Bulk Shipping Inc. (“Eagle” or the “Company”) is a 
U.S. based fully integrated shipowner-operator providing global transportation solutions to a diverse group of customers including miners, producers, traders, and end users. Headquartered in 
Stamford, Connecticut, with offices in 
Singapore and 
Copenhagen, Denmark, Eagle focuses exclusively on the versatile mid-size drybulk vessel segment and owns one of the largest fleets of Supramax/Ultramax vessels in the world. The Company performs all management services in-house (including strategic, commercial, operational, technical and administrative) and employs an active management approach to fleet trading with the objective of optimizing revenue performance and maximizing earnings on a risk-managed basis. For further information, please visit our website: www.eagleships.com.

CONTACT

Company Contact:
Frank De Costanzo
Chief Financial Officer

Eagle Bulk Shipping Inc.
Tel. +1 203-276-8100
Email: [email protected]

Media:

Rose and Company
Tel. +1 212-359-2228

Source: Eagle Bulk Shipping Inc.