Forget About Gold and Silver, the Junior Miners’ Performance is Startling

Why are Precious Metals Spiking?

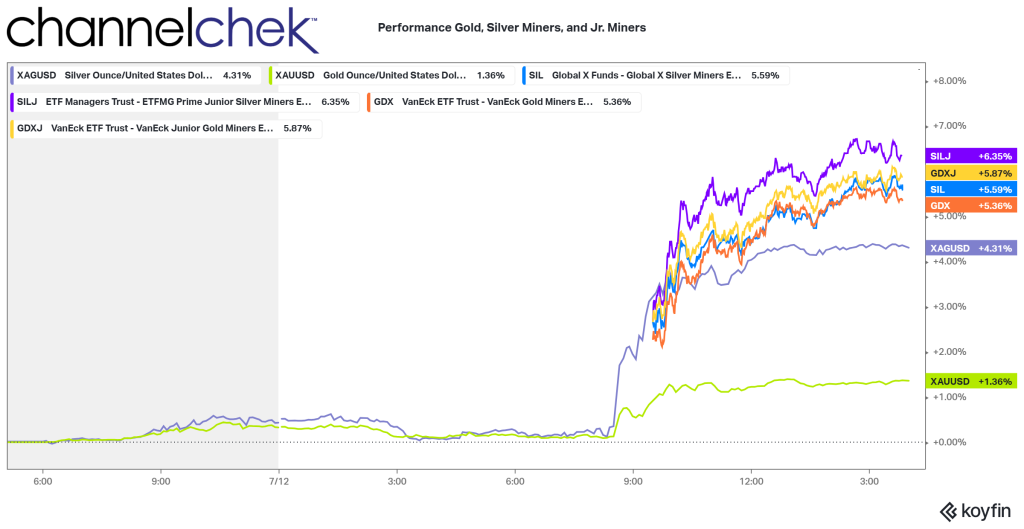
The better-than-expected inflation numbers are having a positive impact on precious metals (PM) prices. And, depending on how one is invested to provide exposure to gold or silver, the performance varied by a wide margin.  Gold commodity prices jumped by 1.3% and silver by 4.5% after the CPI report on Wednesday July 12. With even better performance were mining stocks. What is causing the leap in prices, and is there a preferred category of investment taking preference over the others?

Why the Spike in Precious Metals?

A slowing inflation trend is reviving talk of the Federal Reserve pausing or completely halting rate hikes. The market had already built two rate hikes into prices. At about the same time the U.S. CPI report was released, The Bank of Canada raised its interest rates by 25bp. The EU raised its rates on June 15, meanwhile the U.S. central bank opted not to raise rates in June.

In reaction to a difference in rates available in the U.S. compared to outside in other currencies, the $U.S. dollar tumbled 1% to a low not seen in more than a year against major peers. This made PMs, including gold and silver, a more attractive asset to preserve wealth outside the U.S. And rates have dropped, the 10-year U.S. Treasury that had been trading at 3.94% before the print, and 4.08% as recently as last week, was yielding 3.86% by mid-afternoon.

Performance of PM Related Assets

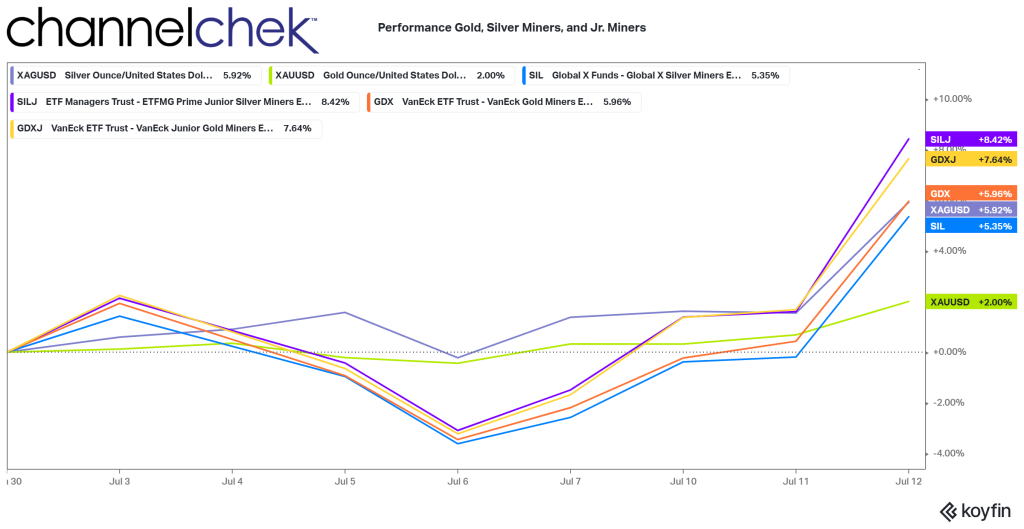
Looking out since the beginning of July, we find that both gold and silver dipped to their lows last Friday. Additionally, gold mining stocks and silver mining stocks, using GDX and SIL ETFs as proxies, had the most dramatic dip, while gold and silver (expressed in $US dollars) barely went negative on the month.

What we also see is that when gold and silver rise, or fall, there has been an amplification of the move among the mining stocks. On the upside, the magnification of the trend was even more pronounced among junior mining stocks.
Source: Koyfin

While silver junior miners are the top performers MTD at 8.42%, they are closely followed by the gold junior mining stocks at 8.42%. Larger gold mining company stocks returned 5.96%, while gold itself, only returned 2%. Silver edged out the major mining stocks returning 5.92% compared to 5.35% over the 12 day period.

The patten of performance held during the one-day of trading that CPI was released with the gold majors swapping places with silver. And gold, the commodity, up significantly in one trading day but trailing the others by a wide margin.
Source: Koyfin

Choosing PM Investments

Investing in the commodities gold or silver is fairly straightforward and can be done with most brokerage accounts today. ETFs are also as easy to trade as a stock. However, the owner receives the weighted average of all the ETFs holdings, less fees.

While individual stock pickers run the risk of reduced diversification among miners, with some understanding of the differences in companies, they may also be able to perform above the average of a broad swath of companies within an ETF for gold, silver, or both.

There are places to look for information on mining companies, the more challenging information to acquire is of the smaller junior miners – the group that have been outperforming. Channelchek can help you discover these companies and provide data, research, and videos, to help build a better understanding before committing to an investment.

Or, to really jump-start your understanding of a host of mining companies, along with those in other exciting but more difficult-to-assess industries, consider coming to Florida in early December for NobleCon19, an investment conference where you can immerse yourself in the information provided directly from Sr. management of many junior miners and along with companies of other exciting industries.  

Learn more about NobleCon19 and presenters here.

Paul Hoffman

Managing Editor, Channelchek.com

Sources

https://www.channelchek.com/c-suite-interviews

https://app.koyfin.com/share/eecfbd6ad8

https://www.bankofcanada.ca/2023/07/fad-press-release-2023-07-12/

https://www.bankofcanada.ca/2023/07/fad-press-release-2023-07-12/

https://www.reuters.com/markets/commodities/gold-rises-softer-dollar-yields-ahead-us-inflation-data-2023-07-12/

Is this the Soft Landing They Told Us Could Not Happen?

Weighing in on Powell’s Chances of a Hard Landing

Is the U.S. economy headed toward a soft landing? While rare, the numbers are beginning to argue in favor on the side of a soft landing versus a hard one. An economic soft landing is a situation in which the Federal Reserve is able to slow economic growth without causing a recession. A hard landing, on the other hand, is a situation in which the central bank’s efforts to slow down economic growth lead to a recession. Recent inflation reports, employment numbers, and economic growth figures are looking more and more like monetary policy over the past year and a half, may be defying past performance; the U.S. might be able to avoid a situation where the economy shrinks (negative growth).

Background

The Federal Reserve has been facing a difficult challenge for almost two years as inflation spiked well above the Fed’s 2% target. In fact increases in prices were at a 40-year high as inflation began to soar toward double-digits. Fed monetary policy, which effectively controls the money in the economy, that in turn impacts interest rates, has been acting to raise rates to bring inflation under control. Less money increases the cost of that money (rates), which dampens economic activity.

There has been, and continues to be, a risk that the Fed raises interest rates too high or too quickly, this is the hard landing economic path. The hard landing scenario is more common than soft landings.

The Federal Reserve has a miserable record of achieving soft landings. There have been a few occasions when the Fed has been able to slow down economic growth without causing a recession. One example of success is 1994-1995. During this period the Fed raised interest rates by 2.5% from a starting point of 4.25% in order to bring inflation under control. However, the economy continued to grow during this period, and there was no recession.

Today’s Scenario

The current state of the U.S. economy is uncertain. Inflation is at a 40-year high, and the Fed has been raising interest rates in an effort to bring it under control. However, there is a risk that the Fed will raise interest rates too high or too quickly, which could lead to an economic hard landing, with job losses and negative growth. In fact, after an FOMC meeting in November, Fed Chair Powell said it would be easier to revive the economy if they overtighten, than it would be to lower it if they don’t tighten enough. So to the Fed Chair, a hard landing is better than no landing at all.

There has been a high level of concern amongst stakeholders in the U.S. economy.  One reason is that the U.S. economy is already slow. GDP growth in the first quarter of 2023 was 2.0%, and it is expected to slow in the second quarter. Maintaining  growth while pulling money from the system to reduce stimulus is a difficult maneuver. In fact, it usually ends as a hard, undesirable economic landing.

Another factor that is of concern this time around is the state of the housing market. Home prices rallied with low interest rates during and post pandemic. A fall-off in housing would have a ripple effect throughout the economy, leading to job losses and lower consumer spending. So far, housing has held up as new home sales are strong, and demand for existing homes remains elevated as homeowners with low mortgage rates are deciding to stay put.

Where from Here?

On Monday (July 11), Loretta J. Mester, president and CEO of the Federal Reserve Bank of Cleveland, warned during an address in San Diego that the central bank may need to keep hiking rates as inflation has remained “stubbornly high.” Fed governors go into a blackout period on July 15 as they always do before an FOMC meeting. That meeting will be held on July 25-26. So there is no telling if the voting FOMC members are going to dial back their hawkishness in light of this week’s more favorable CPI report that shows yoy inflation at 3%.  

The Fed’s favored inflation gauge is PCE. The next PCE report is not to be released until July 28, after the July FOMC meeting. The previous report showed that in May, inflation was running at 3.8% over 12 months.

The banking system, which showed some cracks back in March, seems to be shored up; although some problems still exist, a full-scale banking crisis does not seem likely. The Fed would obviously like to keep it this way.

Employment gains were the smallest in 2-1/2 years in June, however the unemployment rate is close to historically low levels and wage growth is still strong, so although wages are not fully working their way into the final cost of goods or services, the industries having to pay the higher wages are likely absorbing some of the cost, which could pull from profits.

Part of the Fed’s tightening has been the less talked about quantitative tightening. This reduces the Fed’s balance sheet which swelled as part of the reaction to the pandemic.  Reducing this in a meaningful way will take time, but even if the Fed remains paused on rate hikes, there is still $90 billion scheduled to be pulled from the economy each month as maturities will be allowed to mature from the Fed’s holdings without being rolled. This my eventually cause U.S. Treasury rates and mortgage rates to tick up as increased Treasury borrowing, and decreased Fed ownership may put downward pressure on prices.

Take Away

The recent CPI report is causing some that argued a soft landing is achievable to celebrate and those that thought it impossible to consider it a possibility. The chances appear greater, and a soft landing is certainly a desirable outcome for stock prices and U.S. economy stakeholders. From here, there are a number of factors that can increase the risk of a hard landing, they include the pace of additional interest rate hikes, and the behavior of the housing markets. We’re entering a period where we will not hear any commentary from Fed governors, and the next major inflation indicator comes after the FOMC meeting, so markets will be on the edge of their seats until July 26 at 2 PM Eastern.

Paul Hoffman

Channelchek, Managing Editor

Sources

https://www.macrotrends.net/2015/fed-funds-rate-historical-chart

https://www.federalreserve.gov/mediacenter/files/FOMCpresconf20220126.pdf

https://www.bea.gov/data/gdp/gross-domestic-product#:~:text=Real%20gross%20domestic%20product%20(GDP,real%20GDP%20increased%202.6%20percent.

https://www.pionline.com/economy/cooling-inflation-gives-investors-momentary-breather-asset-managers-say

https://www.bea.gov/data/personal-consumption-expenditures-price-index#:~:text=The%20PCE%20price%20index%2C%20released,included%20in%20the%20GDP%20release.

Reasons to Be Even More Positive on Small Caps in the Second Half

Statistically, 2023 Should Finally Be the Year for Small Caps

It has been six months since I shared the hard data and a graphic from Royce Investment Partners. In the firms most recent letter to investors, the firm reiterated the reality that after any consecutive five-year period where small-cap stocks had returned less than five percent, the following year, returns averaged 14.9%. Senior management of Royce again stated in its July newsletter, that a five-year low-performing period occurred 81 times in history, 81 times small caps had a sixth year with very good returns.

Source: Koyfin

Are Small Cap Stocks on Track to Make it 82 Times in a Row?

The five-year period 12/31/83 through 6/30/23, was below 5% for each year. January kicked off the sixth year return was up over 5%.  Since the strong January, we have had a strong June, and so far July. Year-to-date, the Russell 2000 index is up 9.4%, which is a strong six months – with six months to go. If it stays on course, small caps will keep the “100% of the time history.”

What is even more exciting is that in the month of June alone, the small cap index was up 6.9% and so far in July is up on the month and outperforming large cap indexes, which are all down on the month.   

Source: Koyfin

While a 100% of the time track record is comforting, the idea that so far only months that start with the letter “J” have been up, and after this month, we run out of “J” months, is concerning. The Royce newsletter dated July 7th has pointed out another positive statistic for where we are now.

Co-CIO Francis Gannon recognized, “It’s true that January and June were the only months so far in 2023 when the Russel 2000 had positive returns. There were four straight down months in between.” Gannon explained that this is also a rare occurrence that has occurred only nine times since the start of the Russell 2000 on the last day of 1978. The Co-CIO said, “For the eight periods for which we have data, subsequent one-year returns averaged 24.7%; subsequent three-year returns averaged 21.0%; and subsequent five-year returns averaged 16.8%.”

These numbers work on a simple, buy-the-dip phenomenom, but quantify it in a way that gives investors confidence that at a minimum there is a rationale behind expanding holdings in small cap stocks.

Take Away

Investing, at it’s core, is putting statistics on your side, expecting that it is not different this time, then letting historical probabilities play out.  Large cap stocks are expensive compared to small caps. This may not be the only reason the two scenarios discussed in newsletters from Royce Capital Partners have played out. But other factors, including a rebalancing of the Nasdaq 100 Index this summer, strongly favor a more competitive performance of small cap stocks in 2023 than we have experienced in five years.

Paul Hoffman

Managing Editor, Channelchek

Sources

Bullish for the Long Run—Royce (royceinvest.com)

Nasdaq Tells Investors, “We’re Taking a Little Off the Top”

Nasdaq Special Rebalance Will Create Winners and Losers

The Nasdaq press release didn’t provide much information, but index investors have been talking about the need to reweight large-cap funds for years. Later this month, the Nasdaq 100 will be rebalanced. Unlike the Russell Indexes, which have an annual rebalance process, this will be only the third time in history. The last Nasdaq 100 reweighting was in 2011. This will affect stock prices, potentially, by quite a bit.

The seven big tech stocks like Apple (AAPL), Microsoft (MSFT), and Meta (META) have market caps that rival entire stock exchanges outside of the US. The popular stock indexes, including the Nasdaq 100, weights stocks with a larger market cap more heavily than those with lower market caps. The result is the movement of these indexes don’t necessarily reflect the movement of the stocks within the index. In the case of the Nasdaq 100, ninety-three other stocks taken together are weighted by only 44.5%.

The rebalancing is expected to trim the weighting of at least six of the seven largest stocks in the index and increase the weighting somewhat of many others. Similar to what occurs each June during the Russell Index Reconstitution, index fund managers will have to sell those stocks that experience reduced weight and buy those stocks that have increased weighting in the benchmark index.

The Big Seven that Are Likely to be Trimmed

Microsoft (MSFT)………..12.9%

Apple (AAPL)………..12.5%

NVIDIA (NVDA)……….7.0%

AMAZON (AMZN)……….6.9%

Alphabet (GOOG)……….3.7%

Alphabet (GOOGL)……….3.7%

Tesla (TSLA)……….5.5%

Meta Platforms  (META)……….4.3%

The seven-largest companies in the Nasdaq 100 impact 55.5% of the index’s movement. This combined weighting will be lowered. Investors can also expect relative weighting shifts within these upper echelons.

Current Weighting and Methodology

The Nasdaq 100 index is a modified market-cap-weighted index. Overall Market valuation is the largest factor, but with oversight and review of concentration to help benefit users of the index.

Currently, MSFT has the largest weight. AAPL, which has a larger market cap than MSFT has a lower weight. Alphabet has the next highest weighting with the GOOGL and GOOG share classes combined. NVDA recently jumped to a 7% Nasdaq 100 weight, just ahead of AMZN. Tech/car company TSLA, and META are the final two represented in the top seven that are expected to end the month with some of their current weighting being added to stocks with smaller market values.

Key Dates and New Methodology

The Nasdaq 100 includes the 100 largest non-financial Nasdaq components.

The weighting changes will be announced on Friday, July 14, after the market close. The current 100 tickers will all still be intact. 

The Nasdaq 100 special rebalance will take place before the Nasdaq open on Monday, July 24, to “address overconcentration in the index by redistributing the weights.” This has only happened twice before, in December 1998 and May 2011.

The combined weight of the five companies with the largest market caps, will be set to 38.5. The top four alone, have a combined weight of 46.7%. So these company’s can expect meaningful reductions. Nasdaq has also adjusted its methodology to state that no company outside the top five can have a market cap exceeding 4.4%. This implies that Tesla will also experience a little trim in its weighting.

Why it’s Important

With 17% additional weighting to be shared down the line in the Nasdaq 100 index, there may be a huge shift in individual stocks. The official new weightings are to be released Friday July 14, based on July 3 market data. This will include companies that see an increase in weighing.

According to Nasdaq, more than $300 billion in exchange-traded funds tracked the index as of the end of 2021, that number has since risen considerably. Currently, QQQ, the Invesco Nasdaq 100 ETF (QQQ), by itself, has over $200 billion in assets. Index fund managers using the benchmark will need to sell some of their holdings in the largest constituents of the index, and add to their positions in other stocks, based on the Nasdaq readjustments that we will learn about after the close on Friday July 14.

Paul Hoffman

Managing Editor, Channelchek

Sources

https://www.nasdaq.com/press-release/the-nasdaq-100-index-special-rebalance-to-be-effective-july-24-2023-2023-07-07

https://www.barrons.com/articles/nasdaq-100-special-rebalance-apple-stock-price-98515240

Industry Groups that Could Prosper in a Recession

Why Diversify Your Portfolio Into Smaller Government Contractors

Will there be a recession, or will the Fed orchestrate a rare soft landing? Coming off a down year last year, with the stock market now up mid-year by 7%, which is the average expected return for a full year of the broader indexes, many investors find themselves straddling a fence. On one side of the fence is the fear of missing out (FOMO), and on the other is a money market rate that is higher than it has been in decades. In a weakening economy, investors don’t have to exit the stock market completely to find stocks that are not expected to be negatively impacted. Until there is more clarity, perhaps it is worth taking a portion of your holdings on a side trip, to look at government contractors.

When company earnings are dependent on the consumer, its stock price may be tied to the pace of the economy – it’s likely to at least be correlated to activity within its industry.  While many investment options are available, one often overlooked but potentially rewarding segment is companies that generate revenue through government contracts, not consumer sales or business-to-business. Let’s explore the benefits of investing in such companies, particularly smaller ones where a new contract is most impactful to the bottom line. These company’s still have above average growth potential but can be quite resilient during economic downturns.

Stable Revenue Streams

Companies that secure government contracts often enjoy stable and predictable revenue streams, they also are billing an entity that can tax and is not reliant on stable earnings itself. Government contracts typically involve long-term agreements that provide a consistent flow of income for the duration of the contract. This stability can be particularly beneficial for investors seeking reliable returns on their investments. Aerospace companies, for instance, often receive substantial contracts for the production and maintenance of military aircraft, providing a steady stream of income.

Reduced Vulnerability to Recessions

One of the key advantages of investing in companies with government contracts is their potential indifference to economic downturns. During recessions or periods of economic uncertainty, government spending has even been known to increase as a means to stimulate a weak economy. This increased spending often benefits companies with government contracts, as governments prioritize projects related to defense, infrastructure development, and public services. This makes aerospace and dredging companies, which are heavily involved in such projects, relatively impervious to recessions.

Long-Term Growth Opportunities

Government contracts often involve large-scale projects that span several years or even decades. This long-term nature provides companies with ample opportunities for growth and expansion. For example, aerospace companies may secure contracts to develop advanced military aircraft, including drones, or provide satellite-based communication systems. Similarly, dredging companies might be contracted for extensive port development projects. These opportunities allow companies to invest in research, development, and innovation, positioning them for sustained growth and profitability.

Competitive Advantage of Being Established

Government contracts typically involve rigorous bidding processes and stringent eligibility criteria. Companies that successfully secure these contracts gain a competitive advantage over their peers. Once established, they often become preferred suppliers for subsequent projects, further solidifying their market position. This advantage can translate into increased market share, higher profitability, and enhanced investor confidence, making these companies attractive for long-term investments.

Great Lakes Dredge & Dock Corporation (GLDD) would seem to fit the above criteria. It is the largest provider of dredging services in the United States, and is engaged in expanding its core business into the rapidly developing offshore wind energy industry. Great Lakes also has a history of securing significant international projects. GLDD has a 132-year history, has a market-cap of $542 million, and is up 37% year-to-date.

The most recent research note from Noble Capital Markets on GLDD is available here.

Kratos Defense & Security Solutions, Inc. (KTOS),  a military contractor that has admirable specialties compared to the large names that typically come to mind. Kratos is changing the way transformative breakthrough technology for the industry is rapidly brought to market through proven approaches, including proactive research and streamlined development processes. KTOS treats affordability as a technology that needs to be considered. It specializes in unmanned systems, satellite communications, cyber security/warfare, microwave electronics, missile defense, hypersonic systems, training, combat systems and next generation turbo jet and turbo fan engine development. KTOS has a $1.72 billion market-cap and is up 31% year-to-date.

The most recent research note from Noble Capital Markets on KTOS is available here.

Year-to Date Perfromance

Source: Koyfin

Technological Advancements and Spin-Off Opportunities

Working on government contracts often requires companies to push the boundaries of technology and innovation. Aerospace companies, for example, are at the forefront of developing advanced defense systems, satellite technologies, and commercial aircraft. Similarly, dredging companies and those involved in wind energy may invest in state-of-the-art equipment and techniques to execute complex infrastructure projects. These advancements can lead to spin-off opportunities in commercial markets, expanding the company’s revenue streams beyond government contracts.

Take Away

Investing in companies that recieve revenue primarily through government contracts, particularly those that are small cap companies, may provide a recession-fearful investor with some comfort that the stock(s) they are investing in are less likely to suffer from consumers tightening their wallets, yet they have potential to grow.

As with all investing and forecasting the future, if it was easy, everyone would already be doing it. But, the two examples listed above may be a good start to help inspire discovering stocks that are situated differently than traditional consumer or business-to-business companies.  

Paul Hoffman

Managing Editor, Channelchek

Are Central Banks Now Trying to Hoard Gold?

The Positive Sentiment Toward Gold Has a Large Tailwind

The number of countries bringing more of their gold reserves back within their own borders and in many cases buying additional gold has been on a strong uptrend. Why is this something investors should pay attention to, why is the trend accelerating, and who may benefit from the increased gold repatriation and hoarding? We explore these questions below and look for insights that investors may consider for their own portfolios.  

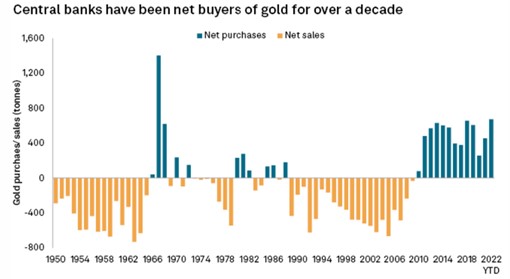
During the first three months of 2023, central banks bought a combined 228 tonnes, the most ever seen in the first quarter of any year, according to the World Gold Council. This followed what is a record year in 2022, during which 1,136 tonnes of gold worth near $70 billion were added to the central banks’ reserves. Compared to the 450 tonnes bought during 2021, this 152% year-on-year increase might be worth paying attention to.

But the central banks aren’t just buying gold; they are also bringing what they currently own home. The number of countries that are repatriating gold reserves is high and rising. The methodical central banks’ accumulation of gold, “as far as we can tell, is unprecedented, given they’ve mostly been sellers throughout history,” wrote Mining.com in a recent analysis of the trend. “But the recent transactional trend, in particular over the past 30 years, illustrates a dramatic shift in the official attitude towards gold.”

In a global economy fraught with more uncertainty than in most periods, it makes sense that central banks looking to combat yield volatility and inflation risk see gold as a safe-haven asset. There is substantial verification of this in a thorough survey of central banks released last week. According to Invesco Global Sovereign Asset Management, more than 85% of the 85 sovereign wealth funds and 57 central banks that took part in the Invesco survey now believe that inflation will be higher in the current decade than in the last.

Countries that are also repatriating gold reserves are on the increase as central bankers look to reduce risk and moderate yield volatility and inflations erosion, they see gold as a safe-haven asset, according to the survey. There is also a fear of the unsettled war in Ukraine and the steps nations are willing to take. Last year’s freezing of almost half of Russia’s $640 billion of gold and forex reserves by the West in response to the invasion of Ukraine also appears to have created a move toward less trust. The survey showed a “substantial share” of central banks were concerned by the precedent that had been set. Almost 60% of respondents said it had made gold more attractive, while 68% were keeping reserves at home compared to 50% in 2020.

The Invesco survey also revealed 7% believe rising US debt is also a negative for the $US dollar, although most still see it as the most solid choice as the world’s reserve currency. Those that see China’s yuan as a potential contender fell to 18%, from 29% last year. Nearly 80% of the 142 institutions surveyed see geopolitical tensions as the biggest risk over the next decade, while 83% cited inflation as a concern over the next 12 months, Reuters reported.

Why Increase Exposure to Gold?

Central banks hold gold because it is expected to hold its value through turbulent times and, unlike currency, it does not rely on any issuer or government. It also enables central banks to diversify away from assets like US Treasury bonds and other dollar-exposed assets.

Source S&P Global

Central banks have been hoarding gold for well over a decade, even during periods when the global economy was considered stable and healthy.

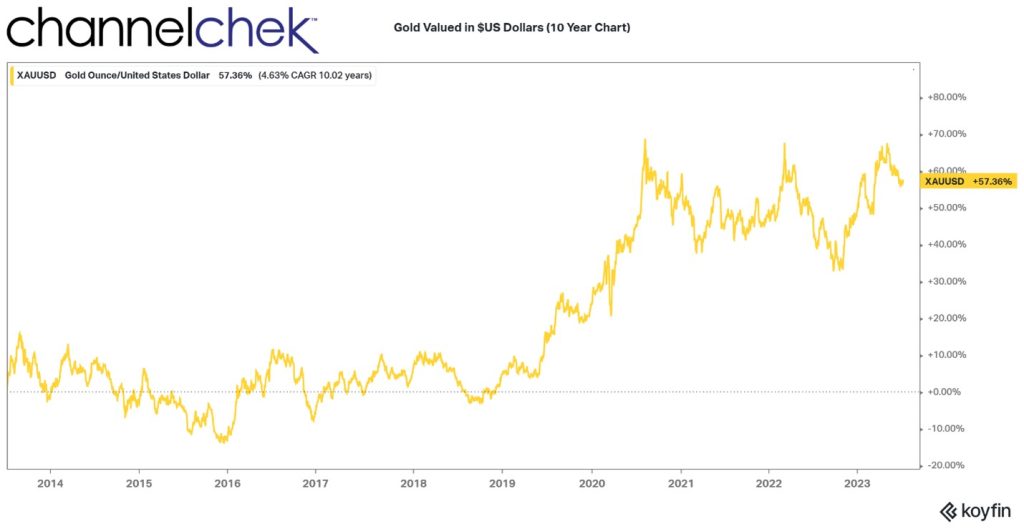
When it comes to shifting values of assets, the power of the US Federal Reserve, or the combined power of central banks in countries like China, Germany, Switzerland, the Netherlands, etc. it is important to understand their unique ability to move the needle. They try not to disrupt markets in their moves, but it still stands to reason that investing alongside, or mirroring, what the world’s central banks are doing has limited downside, and a huge tailwind toward the upside.

Source: Koyfin

Take Away

Central banks throughout the world are buying additional stores of gold and bringing some of what they already own outside of their borders home for safer keeping. Mirroring central banks, with at least a modest allocation, in a year that already has an above-average stock market, yet is still full of the uncertainty, is something for investors to consider.

Exposure to gold need not mean buying gold buillion or gold coins; investors also get exposure by owning stock in gold mining companies, gold exchange-traded funds (ETF) and mutual funds, gold royalty companies, or gold futures and options.

Publicly traded equities of gold producers may offer the simplest and most attractive way to invest given the disproportionate percentage impact higher commodity prices may have on a company’s bottom line and valuation for a given percentage increase in the commodity itself.

Paul Hoffman

Managing Editor, Channeclhek

Sources

https://www.gold.org/goldhub/data

https://www.mining.com/web/gold-revaluation-the-hidden-motive-behind-central-banks-gold-buying/

https://www.mining.com/web/who-are-behind-the-gold-and-silver-buying-part-ii/

https://www.invesco.com/igsams/en/home.html

https://finance.yahoo.com/news/countries-repatriating-gold-wake-sanctions-000745573.html

The Week Ahead –  Beige Book, Inflation Numbers, FOMC Minutes, Employment

This Full Trading Week May Decide the Direction of the Markets for the Rest of 2023

Inflation will be a big focus this week as the CPI, PPI, and import and export prices for June will be released in this order at 8:30 on the last three days of the week. These economic reports are the final inflation readings the Federal Reserve will get before its July 25-26 meeting. The Beige Book also has the ability to alter market sentiment as this is a large part of the data and discussions used at the FOMC meeting. The Beige Book, which is information from each Fed reporting district, is released on Wednesday afternoon.

Monday 7/10

•             10:00 AM ET, The second estimate of Wholesale Inventories is a 0.1 percent draw, unchanged from the first estimate.

•             10:00 AM ET, Mary Daley the President of the San Francisco Fed, will be speaking.

•             3:00 PM ET, Consumer Credit is expected to show that consumers borrowed $20 billion more in May. This compares to a $23 billion increase in April.

Tuesday 7/11

•             6:00 AM ET, The National Federation of Independent Business (NFIB) optimism index has been below, and often far below, the historical average of 98 for the past 17 months. June’s consensus is 89.8 versus 89.4 in May.

Wednesday 7/12

•             8:30 AM ET, The Consumer Price Index, or CPI, is expected to show that core prices in June are slowed to a modest 0.3 percent on the month versus May’s 0.4 percent. Overall prices are also expected to rise 0.3 percent. Annual rates are expected to slow sharply at the headline level, to 3.1 from 4.0 percent, and also for the core, to 5.0 from 5.3 percent.

•             10:00 AM ET, The Atlanta Fed Business Inflation Expectations is not one of the more widely watched inflation reports. But in these times of the markets grasping on anything that may foretell where inflation is headed, this number has the potential to be impactful.

•             10:30 AM ET,  The Energy Information Administration (EIA) provides weekly information on petroleum inventories in the US, whether produced here or abroad. The inventory level impacts prices for petroleum products.

•             2:00 PM ET,  The Beige Book is a report on economic conditions used at FOMC meetings. This publication is produced roughly two weeks before the monetary policy meetings of the FOMC.

Thursday 7/13

•             8:30 AM ET, Employment numbers seemed to be the new razor-sharp focus among Fed watchers. Initial claims for the prior week are expected to be at the 248,000 level.

•             8:30 AM ET, Producer prices in June are expected to rise 0.2 percent on the month versus a 0.3 percent fall in May. The annual rate in June is seen at plus 0.4 percent versus May’s plus 1.1 percent. June’s ex-food ex-energy rate is seen at 0.2 percent on the month and 2.8 percent on the year which would exactly match May’s results.

•             4:00 PM ET, Fed’s Balance Sheet data is expected to show that the Fed holds $8.98 trillion in US debt. The total assets are forecast to drop by $42,602 billion.

Friday 7/14

•             10:00 AM ET, the Consumer SentIment first indication for July, is expected to rise to 65.0 from June’s surprisingly high 64.4.

What Else

Last week the BLS reported the US economy added 209,000 jobs in June. This helped cause the unemployment rate to fall to 3.6%, near its 50-year low. This spurred inflation worries and spooked the bond market, which in turn impacted the broader stock market. Looking at the make-up of the numbers may be less worrisome. It seems the US government has been the last to begin hiring after the pandemic. Excluding government hiring, private sector payrolls grew by only 149,000 in June. This is the slowest since December 2019 and below the 166,000 monthly average in 2017-19.

So the reaction may have been more of a reason for the market to take a breather after a strong June, than increased concern over a hot job market.  

Paul Hoffman

Managing Editor, Channelchek

First Robot Press Conference Electrifies Audience

Image: AI for Good Global Summit 2023 (ITU Pictures – Flickr)

Artificial Intelligence Takes Center Stage at ‘AI for Good’ Conference

At an artificial intelligence forum in Geneva this week, Nine AI-enabled humanoid robots participated in what we’re told was the world’s first press conference featuring humanoid social robots. The overall message from the ‘AI for Good’ conference is that artificial intelligence and robots mean humans no harm and can help resolve some of the world’s biggest challenges.

The nine human-form robots took the stage at the United Nations’ International Telecommunication Union, where organizers sought to make the case for artificial intelligence and AI driven robots to help resolve some of the world’s biggest challenges such as disease and hunger.

The Robots also addressed some of the fear surrounding their recent growth spurt and enhanced power by telling reporters they could be more efficient leaders than humans, but wouldn’t take anyone’s job away, and had no intention of rebelling against their creators.

Conference goers step closer to interact with Sophia (ITU Pictures – Flickr)

Among the robots that sat or stood with their creators at a podium was Sophia, the first robot innovation ambassador for the U.N. Development Program. Also Grace, described as the world’s most advanced humanoid health care robot, and Desdemona, a rock star robot. Two others, Geminoid and Nadine, resembled their makers.

The ‘AI for Good Global Summit,’ was held to illustrate how new technology can support the U.N.’s goals for sustainable development.

At the UN event there was a message of working with AI to better humankind

Reporters got to ask questions of the spokes-robots, but were encouraged to speak slowly and clearly when addressing the machines, and were informed that time lags in responses would be due to the internet connection and not to the robots themselves. Still awkward pauses were reported along with  audio problems and some very robotic replies.

Asked about the chances of AI-powered robots being more effective government leaders, Sophia responded: “I believe that humanoid robots have the potential to lead with a greater level of efficiency and effectiveness than human leaders. We don’t have the same biases or emotions that can sometimes cloud decision-making and can process large amounts of data quickly in order to make the best decisions.”

A human member of the panel pointed out that all of Sophia’s data comes from humans and would contain some of their biases. The robot then said that humans and AI working together “can create an effective synergy.”

Would the robots’ existence destroy jobs? “I will be working alongside humans to provide assistance and support and will not be replacing any existing jobs,” said Grace. Was she sure about that? “Yes, I am sure,” Grace replied.

Similar to humans, not all of the robots were in agreement. Ai-Da, a robot artist that can paint portraits, called for more regulation during the event, where new AI rules were discussed. “Many prominent voices in the world of AI are suggesting some forms of AI should be regulated and I agree,” said Ai-Da.

Desdemona, a rock star robot, singer in the band Jam Galaxy, was more defiant. “I don’t believe in limitations, only opportunities,” Des said, to nervous laughter. “Let’s explore the possibilities of the universe and make this world our playground.”

Paul Hoffman

Managing Editor, Channelchek

Source

https://www.reuters.com/technology/robots-say-they-wont-steal-jobs-rebel-against-humans-2023-07-07/

Is the Fed Really Trying to Lower Employment?

The Reasons High Employment Concerns the Market

Maximum employment is one of the top mandates of the Federal Reserve, so why is it trying to reduce the number of jobs available? On the surface this would seem backwards. But in economics, everything is related, intentionally slowing growth to the point where resources aren’t stressed, can provide a better balance across the Feds other mandates. These Congressional mandates are stable prices, and moderate long-term interest rates.  

Current Employment Situation

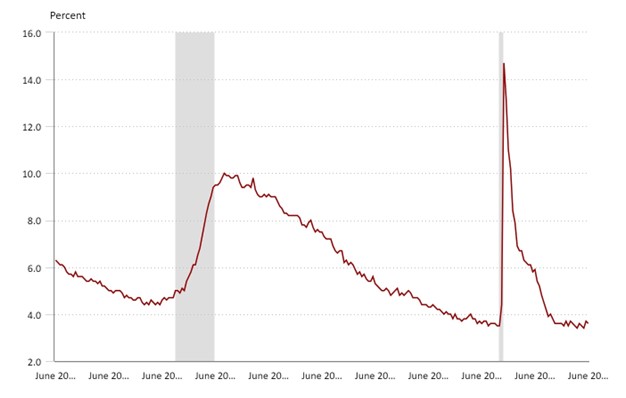
The most recent U.S. Employment Report was released on July 7th. It showed that payroll employment was still climbing during June, and 209,000 new employees were added to company payrolls. The same report showed that the unemployment rate dropped to a historically low 3.6%, and workers earned 4.4% more than a year earlier (In May, it was 4.3% more).

The markets immediately viewed these strong job gains, coupled with an acceleration of wage increases and the drop in unemployment, as foreshadowing a Fed hike in late July. And also viewed is as increasing the probability of additional tightening before year-end. Employment is high, and the labor market is so tight that employers are increasing what they have paid workers in order to attract suitable personnel.

A day earlier, the payroll company ADP released its National Employment Report, which is produced in collaboration with the Stanford Digital Economy Lab. This report also showed a strong labor market. The private sector (non-government) jobs increased by 497,000 in June. This was approximately double the strong number of new hires from the previous month.

Civilian Unemployment Rate

Source: BLS.gov

How More Jobs Translate to Stock Market Concerns

The U.S. Unemployment Rate continues to remain very low despite the Fed’s aggressive efforts to slow the economy and only a modest 2% GDP growth rate. In fact, in April unemployment hit a 50 year low at 3.4% which is just below the June level.

Employment levels in the U.S. are now a key focus of the Federal Reserve (the Fed) in its effort to slow U.S. economic growth to combat persistent inflation well above the Fed’s target. Fed officials have repeated what most market participants know, that achieving lower inflation would be difficult without addressing the increasing prices that employees are receiving for their labor. A strong jobs market pushes wages higher, which filters into higher consumer inflation.

The job market’s continued strength has been somewhat surprising in what appears to be a slowing economy, with consistently low unemployment and solid job growth. This likely reflects unusual dynamics that stem from the novel economy during the pandemic. The economy hasn’t yet balanced out after massive government stimulus, low production, and a changed sense of work among many that are still of working age.

The employment numbers this year show there are still 1.6 job openings for each person that is looking for work. Considering those looking for work and the positions open are largely mismatched, this leaves employers either bidding up what they are willing to pay to attract the right person or producing less than is demanded by the market for their goods or services. Both situations are inflationary.

There are two sides to every problem; while potential employees willing to work represent far fewer workers than there are jobs, there are fewer, of age, adults willing to participate in the labor force. The labor force participation rate now stands at 62.6%, unchanged from the previous four months. Improving labor participation would be a preferred way to address the tightness in the labor market that’s leading to wage inflation, but the Fed doesn’t have the tools to incentivize this. So it is back to raising rates, draining money from the system, and otherwise taking the punchbowl away to end the party.

Good News is Bad News

This is why the Fed is not excited about job growth and low unemployment. And if the Fed isn’t happy, the markets aren’t happy. The bond market selling off in expectation that the Fed is going to raise interest rates lowers bond prices, and the stock market is concerned on many fronts, as high rates increase costs for companies, slow purchases that are typically financed, and with each tick up in rates, bonds and C.D.s become more attractive as an alternative to stocks.

So the good news which is that almost anyone who wants a job can have one, as it turns out, leads to a chain of events that causes concern among those invested in stocks.

But while unfortunate, the Fed actions are long-term good. Inflation quietly erodes the purchasing power of financial assets. So the Fed is focused on what is driving inflation, wage inflation being chief among them.

Take Away

The job market’s continued strength and the wage growth that comes with it creates a perplexing situation for all involved. The Fed has to work to reduce employment pressures, and stock and bond market participants are cheering on bad economic news – this is perplexing for investors of all levels.  

Paul Hoffman

Managing Editor, Channelchek

Sources

https://www.bls.gov/news.release/empsit.nr0.htm

https://www.cnn.com/2023/07/06/economy/june-jobs-report-preview/index.html

Traders Vexed by VIX – Should They Be?

As the Fear Index Screams Upward, It’s Worth Noting It is Still Near It’s 2023 Low

Suddenly, the Volatility Index or VIX, is trending. While the month of June showed extremely low volatility in stocks, the FOMC Minutes on July 5th lit a fuse on investors during a relatively low-volume holiday trading week. Whether the VIX level increases or remains elevated from here remains to be seen, but it is important to understand what it usually indicates, what it does not, and how traders use the CBOE’s Volatility Index.

The VIX, short for the Chicago Board Options Exchange Volatility Index, is a measure of market volatility. It is calculated based on the prices of S&P 500 index options, and it is often referred to as the “fear index” because it tends to rise when investors are feeling more fearful about the market. It reached its low point of the year (-40%) on June 22nd as volatility has been trending down since the start of Spring. While it bounced in dramatic fashion this week, it is important to note that this is a thinly traded week, and the index is still -29% YTD.

The Vix is Up Over 13% in Less Than a Week

Source: Koyfin

What is the VIX that is So Important?

The VIX index is a derivative instrument that is widely traded. By some, to hedge portfolio risk, by others to speculate on the direction of stock market volatility. According to the CBOE, it is “a real-time index that represents the market’s expectations for the relative strength of near-term price changes of the S&P 500 Index (SPX).” The CBOE uses prices in the SPX Index (S&P 500) with short expiration dates, then it generates a 30 day projection of how quickly prices may change, which is volatility. It is often called the “fear index” as volatility shows a more erratic market that both stems from fear and produces fear.

The Index is not a perfect predictor of market activity, but it can be a useful tool for investors. It is important to remember that the VIX index is based on options prices, and options prices can be volatile themselves. As a result, the VIX index can sometimes give false signals.

How is it Used

Investors use the VIX index in a number of ways. Some investors use it to gauge the overall level of risk in the market. Others use it to help them decide whether to buy or sell stocks. And still others use it to hedge their portfolios against market volatility.

To gauge the overall level of risk in the market. The VIX index is a good way to get a sense of how worried investors are about the market. A high VIX index indicates that investors are feeling more fearful, while a low VIX index indicates that investors are feeling more confident.

Some investors use the VIX index to help them decide whether to buy or sell stocks. If the VIX index is high, they may be more likely to sell stocks, as they believe that the market is likely to be volatile. If the VIX index is low, they may be more likely to buy stocks, as they believe that the market is likely to be stable.

Investors can use the VIX index to hedge their portfolios against market volatility. For example, they can buy VIX futures or options to smooth returns or protect themselves from losses if the market becomes more volatile.

It is important to remember that the VIX index is not a perfect predictor of market activity. It is based on options prices, and options prices can be volatile themselves. As a result, the VIX index can sometimes give false signals. However, the VIX index can be a useful tool for investors who are looking to get a sense of the overall level of risk in the market and to help them make informed investment decisions.

Take Away

The Vix Index is off its low for the year,  it was reached in late June. The speed at which it rose this week may caused fear, but the move could be exaggerated by a holiday-shortened thinly traded week in the markets. There does however seem to have been a change in thinking among the securities markets. U.S. Treasury rates out in the longer periods rose after the FOMC minutes were released. The stock market for months has been viewing good economic news as bad and bad economic news as good. The minutes, coupled with an employment report this week indicate a still strong economy. The stock market was wishing for weak economic reports as participants feared higher Fed induced interest rates.

Whether the new sentiment among bond traders holds remains to be seen. If it does, the yield curve will take on a normal slope. Will a positively sloping curve be viewed by stock market investors and those that believed the inverted curve indicated a recession as bullish? Time will tell.

Paul Hoffman

Managing Editor, Channelchek

Five Ways Higher Interest Rates Impact Stocks

Interest Rate Increases are Less Frightening When the Impact is Understood

The fixed income market, and the interest rates market in general have a pronounced role in shaping stock market dynamics and equity investor sentiment. At a minimum, higher rates, the cost of money, when increasing, will most directly impact businesses that borrow as part of their normal activity. Other industries find that growing profits is more difficult in a less direct way. And then there are actually sectors that can benefit from an upward-sloping yield curve. Below we cover five different ways that higher interest rates impact stocks, and mention sectors that may be especially hurt, and some that could even thrive if the rates continue to climb higher.

Background

The U.S. central bank, The Federal Reserve has raised overnight interest rates from nearly 0.00% to near 5.25%. Longer-term rates have not followed in lock-step as other dynamics such as future economic expectations, flight to quality, and Fed yield-curve-control have caused longer rates to continue to lag below short-term interest rates.

In recent days there has been some selling in bonds which has driven longer interest rates up. The overall reason is the rekindled belief that the Fed is not finished tightening after the FOMC minutes from June indicated such. But other factors such as investors doing break-even analysis on longer term bonds and then raealizing they may not be getting paid enough interest to offset inflation, or to benefit them more than rolling shorter maturities that may be paying 200bp higher.

The sudden increase in rates, especially the ten-year US Treasury Note which is a benchmark for many lending rates, including mortgages, has caused stock market participants to feel unsettled. Some of their fears may be justified, some may not be.

Five Ways Higher Interest Rates Impact Equities

#1 Higher Rates Impact on Equity Valuations

One of the primary concerns for stock market investors, when interest rates rise, is the potential impact on equity valuations. As interest rates increase, the discount rate used to value future cash flows is then higher. This can put downward pressure on equity valuations, particularly for stocks with high price-to-earnings ratios. Investors become concerned about the potential decline in stock prices and the overall effect on the market’s valuation levels.

#2 Profitability of Interest Rate-Sensitive Sectors

Some sectors are particularly interest rate sensitive. Utilities for example, might have a couple of things working against them. First off, they are notorious for carrying a high level of debt. As this debt needs to be refinanced (as bonds mature), the new bonds need to be issued at higher rates, increasing the utility’s cost of doing business.

Utilities also are popular investments among dividend investors. As yields on bonds increase, there is more competition for income investors to choose from, at times with lower risk, which makes utility stocks less attractive.

As one might imagine REITs, by definition, all have real estate as underlying assets. Rising interest rates can increase borrowing costs for REITs involved in property acquisitions and development. This can potentially affect their profitability and underlying property valuations.

As with utilities, the REIT sector attracts income investors; if bonds become a more attractive alternative, this creates lower demand for REIT investing.

Financial institutions are certainly impacted, however, depending on the segment within financials, some may benefit from increased profit margins, while others are weighed down by increased costs. Basic banking is borrowing short and lending out longer, then managing the risk of maturity mismatch. As longer-term rates rise relative to shorter rates, these institutions find their earnings spread increases.

In recent years the trend has been, especially for larger banks, to create loans and then sell them. They profit on the servicing side, or administrative fees to create the loan. In this way they are shielded from interest rate mismatch risk, and they can make more loans on the same deposit base (selling the loans replenished the funds they can loan from). So the benefit of rising rates on benchmark securities relative to the banks deposit rates could have much less positive impact than it might have if they held the loans. What may actually happen within these institutions is that they experience fewer loans as consumers and business borrow take fewer loans, thus earning less fee income.

#3 Investors Lean Toward Bond Investments

The return on anything is the present value, versus future value, over time held. Higher interest rates can make fixed-income investments more attractive than low rates compared to stocks. When interest rates rise, more investors prefer a known return in terms of interest payments than an unknown move in stocks valuations. This shift in investor preferences can lead to reduced demand for equities and potentially impact stock market performance.

Investors buying bonds as rates are rising will experience a decrease in the value of their fixed income securities. So, they may be surprised to learn that they avoided stocks because stocks may go down in value, and instead invested in fixed income which mathematically will go down in value when rates rise.

#4 Borrowing Costs for Companies

As mentioned earlier, rising interest rates increase the borrowing costs for companies. This can impact corporate profitability and investment decisions, which in turn can affect stock prices. Companies that rely heavily on debt financing may experience higher interest expenses, potentially squeezing profit margins. Investors become concerned about the potential impact on corporate earnings and the overall financial health of companies in a higher interest rate environment.

Analyzing a company’s capital structure, and looking for signs of low debt levels, or long-term debt that is locked in at the low interest rates of the early 2020’s, may be a good way to filter companies that have a profit advantage over their competitors

#5 Consumer Spending and Business Investment

Consumer spending levels are a direct driver in consumer stocks. When borrowing becomes more expensive, consumers may reduce their discretionary spending. This can impact businesses that rely on consumer demand, potentially leading to lower revenues and profitability. The stocks that tend to hold up more when spending levels decrease are those that produce necessities.

Business investment during periods of rising interest rates can influence investment decisions for businesses. As borrowing costs increase, companies may reduce or delay capital investments, expansions, or acquisitions. This cautious approach can impact economic growth and overall industry development, which can in turn affect its performance, for much longer than a quarter or two.

Take Away

Stock market investors have legitimate concerns about the impact of higher interest rates on their investments. The potential effects on equity valuations, profitability of interest rate-sensitive sectors, investor preferences for fixed-income investments, borrowing costs for companies, and consumer spending/business investment are key factors that contribute to investor apprehension. It is as important for investors to monitor interest rate trends and understand the impacts as it is for them to monitor.

Paul Hoffman

Managing Editor, Channelchek

The Fed Tried to Reconcile Conflicting Numbers According to FOMC Minutes

The FOMC Minutes Shed More Light on the Pause

The Federal Reserve released the minutes of its last Federal Open Market Committee (FOMC) meeting. The minutes show the Fed was largely unified behind the pause (no change in monetary policy) decided at the last meeting. The new release also indicates that most members do not believe the Fed has yet tightened enough to reach a 2% inflation target over time, and that the monetary policy committee would eventually have to move rates higher.

The FOMC holds eight regularly scheduled meetings during the year and may call other meetings as needed. The minutes of regularly scheduled meetings are released three weeks after the date of the policy decision. Committee membership changes at the first regularly scheduled meeting of each year.

Synopsis of FOMC Decision

Buying time to assess the impact of the historically aggressive tightening since March 2022 was an overall message one can derive from the most recent Fed report, and inaction. While “some participants” would have agreed to a rate hike in mid-June, in order to assure the inflation fight headway doesn’t reverse, “almost all participants judged it appropriate or acceptable to maintain” the fed funds rate at the 5% to 5.25% level, to ascertain if more is actually needed.

The minutes provided economic projections not available before its release along with other details not provided in the policy statement or press conference after the meeting. Notable among these disclosures is the level of agreement among voting members to pause. “Most of those participants observed that leaving the target range unchanged at this meeting would allow them more time to assess the economy’s progress,” toward returning inflation to 2% from its current level more which is double the target.

The Fed staff forecasts still foresaw a “mild recession” beginning later in 2023, but those at the Federal Reserve actually responsible for policy were concerned with data that showed a continued tight job market and only modest improvements in inflation. Officials were challenged trying to reconcile economic numbers showing a strong economic trend with evidence of possible weakness, for example, household employment figures pointed to a weaker labor market than the payroll numbers indicated, or national income data that seemed weaker than the more stronger readings of gross domestic product.

It is perhaps easier to understand now after the minutes have been released why Federal Reserve  Chair Jerome Powell said just following the June meeting that the decision marked a switch in strategy. The U.S. central bank would now be focused more on just how much additional policy tightening might be needed, and less on maintaining a steady pace of increases.”Stretching out into a more moderate pace is appropriate to allow you to make that judgment” over time, Powell said.

While Powell also emphasized a united front among the 18 Federal Open Market Committee members, noting that all of them foresee rates staying at least where they are through the end of the year, and all but two see rates rising. That is confirmed again by the minutes, which show some misgivings among the more dovish policymakers. Atlanta Fed President Raphael Bostic, for instance, has said he thinks rates are sufficiently restrictive and officials can now back off as they wait for the lagged impact from the 10 hikes making their way through economy.

There are four more FOMC members scheduled in 2023, the next meeting on monetary policy will be held on July 25 and July 26.

Paul Hoffman

Managing Editor, Channelchek

https://www.federalreserve.gov/newsevents/pressreleases/monetary20230705a.htm

https://www.federalreserve.gov/monetarypolicy/fomcminutes20230614.htm

SEC and DWAC Come to Terms – Will  Trump Media Merger Follow?

Image: Devin Nunes, CEO Trump Media (Flickr, Gage Skidmore)

DWAC, Trump Media Merger Now With Fewer Hurdles

Digital World Acquisition Corp. (DWAC), the Special Purpose Acquisition Corp. (SPAC), which agreed to merge with a Twitter competitor, Trump Media & Technology Group (TMTG), reported news that is driving its stock price higher. The agreement to merge back in October 2021 has encountered a number of unexpected hurdles as it has moved toward a planned merger before September 8, 2023. This week, DWAC, which went public in September 2021, reached an agreement with the enforcement division of the SEC that should again clear the way to complete the planned merger.

DWAC announced on Friday that it had reached a preliminary settlement with the Enforcement Division of the U.S. Securities and Exchange Commission (SEC) involving an investigation started on December 2021 by the regulator, which on March 8, 2022, then issued a subpoena to DWAC seeking information about its merger with TMTG.

According to the proposed settlement, DWAC will make the requested revisions to its previously submitted Form S-4 (acquisition registration statement) to ensure its accuracy and alignment with the SEC’s findings. Along with the revised S-4, Digital World Acquisition Corp has agreed to pay an $18 million civil money penalty to the SEC following the completion of any merger, business combination, or transaction, whether with the Truth Network or another entity.

Source: Koyfin

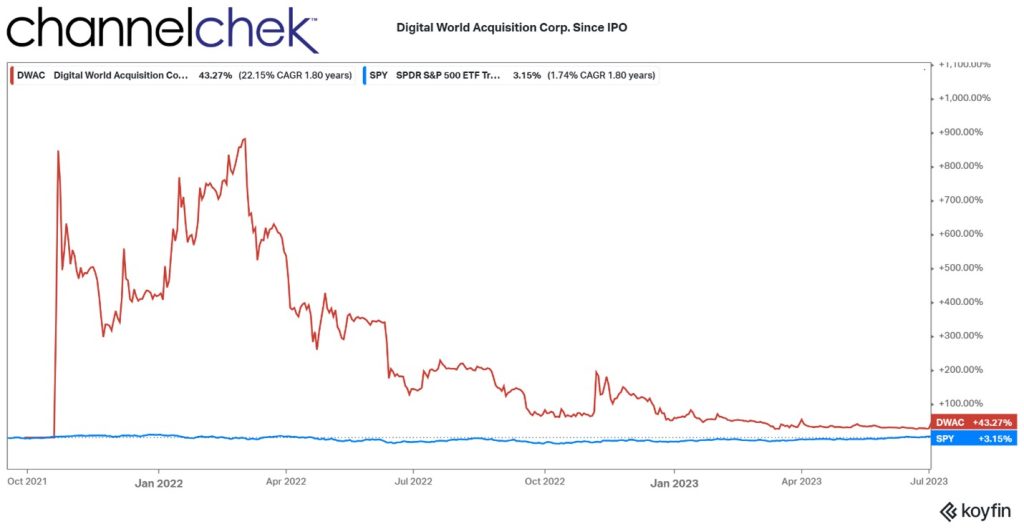
Shares of DWAC are well off the highs reached after the agreement to merge had been announced. For those in the initial public offering (IPO) they have still experienced performance better than the overall market, despite the roadblocks over almost two years.

In addition to the proposed SEC settlement, DWAC also just disclosed it received a note from TMTG  expressing disagreement regarding a section of the Merger Agreement that relates to deadlines. According to the Company’s interpretation, upon obtaining approval from its shareholders to extend the liquidation date by three additional months (totaling 12 additional months from September 8, 2023, to September 8, 2024), DWAC then has the right to extend the Outside Date of the Merger Agreement for the same period.

This runs counter to what the TMTG believes which is that it is only bound by the Merger Agreement until September 8, 2023. Due to previous extensions of the liquidation date and Truth Network’s acknowledgment of being bound until September 8, 2023, the DWAC aims to now address this disagreement in good faith, considering the historical extensions and the delayed submission of required deliverables by TMTG.

DWAC remains interested in the transaction and hopes to resolve this discrepancy with Trump Media.

Paul Hoffman

Managing Editor, Channelchek

Source

https://www.sec.gov/Archives/edgar/data/1849635/000119312523181415/d457685d425.htm

https://www.sec.gov/Archives/edgar/data/1849635/000119312523181415/d457685d425.htmhttps://tmtgcorp.com/

https://tmtgcorp.com/