VANCOUVER, BC, Feb. 28, 2023 /PRNewswire/ – Defense Metals Corp. (“Defense Metals” or the “Company“) (TSXV: DEFN) (OTCQB: DFMTF) (FSE:35D) is pleased to report favourable comminution results on multiple samples extracted from the Wicheeda deposit. The data allows the design of the crushing and grinding plant that will be an integral part of the planned Wicheeda development. These data are essential inputs to the upcoming pre-feasibility study (PFS).
Comminution, i.e., crushing and grinding, will be the first step in the processing of material mined from the Wicheeda deposit. In the process, coarse, as-mined, rocks are reduced in size to sand-like particles, typically less than 1 mm in size, and suitable for upgrading by flotation or other means. Comminution usually accounts for a significant percentage of the energy demand, production cost and carbon footprint of a mineral processing plant.
John Goode, Metallurgy Advisor, stated: “Comminution tests on seventeen variability samples and a Master Composite show that the ore is soft, amenable to conventional grinding operations and has a low abrasion index. The recent results confirm, and expand on data obtained from a 30 t bulk sample taken in 2019. The data show that a conventional semi-autogenous grinding (SAG) mill-ball mill circuit will work well and that grinding energy and supply costs will be relatively low.”
Key Highlights:
The Wicheeda variability samples and Master Composite were studied using the industry-standard SMC test to determine amenability to, and sizing design parameters for, SAG processing. The A x b value averaged 97 and the SAG Circuit Specific Energy (SCSE) averaged 7 kWh/t indicating a very soft ore.
The Bond rod mill work index test was applied to the Master Composite and returned a value of 10 kWh/t – which again indicates a very soft feed material.
The Bond ball mill work index test was applied to all samples and resulted in an average of 10 kWh/t using a 65-mesh closing screen. This again indicates a very soft feed material.
A standard Bond abrasion test was performed on the Master Composite and returned a value of 0.059 g meaning a very low consumption of grinding balls and mill liners is anticipated.
The Bond ball mill work index and abrasion index data for these new samples are very similar to the values obtained on the 2019 bulk sample taken from the Wicheeda deposit giving additional confidence in the new data. Comminution data for the 2019 bulk sample were used during preparation of the 2021 Independent Preliminary Economic Assessment1.
Methodology
Seventeen variability samples and a Master Composite were made from drill core taken from the Wicheeda deposit. The variability samples covered different lithologies, depths, areas and grades of the deposit. The Master Composite had a mass of 260 kg and included all lithologies in the approximate ratios of their mass in the deposit.
SGS Lakefield performed all of the comminution tests. The SMC testing protocol is an industry-standard method of evaluating the amenability of material to grinding in a semi-autogenous grinding (SAG) mill. The Bond rod and ball mill indices and abrasion index are also industry-standard tests performed on crushed ore and are essential to the accurate sizing of a grinding circuit.
The comminution data will be used, along with other information, during the upcoming pre-feasibility study (PFS) to design the comminution circuit for the Wicheeda project.
PDAC Convention, Toronto, March 5 – 8, 2023
The Company is also pleased to announce that it will be attending this year’s Prospector’s and Developer’s Annual Convention (PDAC) in Toronto, Ontario, Canada from Sunday, March 5 to Wednesday, March 8, 2023.
The Company’s management team, members of the Board of Directors and technical advisors will be available during the convention (www.pdac.ca/convention) and invite you to drop by Booth #2500 in the Investors Exchange in the Metro Toronto Convention Centre from March 5 – 7, 2023, 10 a.m. to 5 p.m. and March 8, 2023, 9 a.m. to 12 p.m. to discuss the Company’s latest activities and plans for 2023 and onward.
In addition, we invite you to attend the following presentation at PDAC, which includes Kris Raffle, P.Geo, a director of the Company, presenting on behalf of Defense Metals at 2:14 p.m.: Electric materials / Rare earth elements (REE), Room 801B – MTCC Level 800.
Qualified Person
The scientific and technical information contained in this news release, as it relates to the Wicheeda Rare-Earth Project, has been reviewed and approved by John Goode, P. Eng., who is a Qualified Person as defined by National Instrument 43-101 and who has provided the technical information relating to metallurgy in this news release.
About the Wicheeda REE Property
Defense Metals 100% owned, 4,262-hectare (~10,532-acre) Wicheeda REE property is located approximately 80 km northeast of the city of Prince George, British Columbia; population 77,000. The Wicheeda REE Project is readily accessible by all-weather gravel roads and is near infrastructure, including hydro power transmission lines and gas pipelines. The nearby Canadian National Railway and major highways allow easy access to the port facilities at Prince Rupert, the closest major North American port to Asia.
The 2021 Wicheeda REE Project Preliminary Economic Assessment technical report (“PEA”) outlined a robust after-tax net present value (NPV@8%) of $517 million and an 18% IRR1. This PEA contemplated an open pit mining operation with a 1.75:1 (waste:mill feed) strip ratio providing a 1.8 Mtpa (“million tonnes per year”) mill throughput producing an average of 25,423 tonnes REO annually over a 16 year mine life. A Phase 1 initial pit strip ratio of 0.63:1 (waste:mill feed) would yield rapid access to higher grade surface mineralization in year 1 and payback of $440 million initial capital within 5 years.
About Defense Metals Corp.
Defense Metals Corp. is a mineral exploration and development company focused on the acquisition, exploration and development of mineral deposits containing metals and elements commonly used in the electric power markets, defense industry, national security sector and in the production of green energy technologies, such as, rare earths magnets used in wind turbines and in permanent magnet motors for electric vehicles. Defense Metals owns 100% of the Wicheeda Rare Earth Element Deposit located near Prince George, British Columbia, Canada. Defense Metals Corp. trades in Canada under the symbol “DEFN” on the TSX Venture Exchange, in the United States, under “DFMTF” on the OTCQB and in Germany on the Frankfurt Exchange under “35D”.
Neither the TSX Venture Exchange nor its Regulation Services Provider (as that term is defined in the policies of the TSX Venture Exchange) accepts responsibility for the adequacy or accuracy of this news release.
Cautionary Statement Regarding “Forward-Looking” Information
This news release contains “forward–looking information or statements” within the meaning of applicable securities laws, which may include, without limitation, statements relating to advancing the Wicheeda REE Project, completion of the PFS, attending PDAC, the Company’s plans for its Wicheeda REE Project, expected results and outcomes from the comminution data, the technical, financial and business prospects of the Company, its project and other matters. All statements in this news release, other than statements of historical facts, that address events or developments that the Company expects to occur, are forward-looking statements. Although the Company believes the expectations expressed in such forward-looking statements are based on reasonable assumptions, such statements are not guarantees of future performance and actual results may differ materially from those in the forward-looking statements. Such statements and information are based on numerous assumptions regarding present and future business strategies and the environment in which the Company will operate in the future, including the price of rare earth elements, the anticipated costs and expenditures, the ability to achieve its goals, that general business and economic conditions will not change in a material adverse manner, that financing will be available if and when needed and on reasonable terms. Such forward-looking information reflects the Company’s views with respect to future events and is subject to risks, uncertainties and assumptions, including the risks and uncertainties relating to the interpretation of exploration and metallurgical results, risks related to the inherent uncertainty of exploration and development and cost estimates, the potential for unexpected costs and expenses and those other risks filed under the Company’s profile on SEDAR at www.sedar.com. While such estimates and assumptions are considered reasonable by the management of the Company, they are inherently subject to significant business, economic, competitive and regulatory uncertainties and risks. Factors that could cause actual results to differ materially from those in forward looking statements include, but are not limited to, continued availability of capital and financing and general economic, market or business conditions, adverse weather and climate conditions, failure to maintain or obtain all necessary government permits, approvals and authorizations, failure to maintain community acceptance (including First Nations), risks relating to unanticipated operational difficulties (including failure of equipment or processes to operate in accordance with specifications or expectations, cost escalation, unavailability of personnel, materials and equipment, government action or delays in the receipt of government approvals, industrial disturbances or other job action, and unanticipated events related to health, safety and environmental matters), risks relating to inaccurate geological, metallurgical and engineering assumptions, decrease in the price of rare earth elements, the impact of Covid-19 or other viruses and diseases on the Company’s ability to operate, an inability to predict and counteract the effects of COVID-19 on the business of the Company, including but not limited to, the effects of COVID-19 on the price of commodities, capital market conditions, restriction on labour and international travel and supply chains, loss of key employees, consultants, or directors, increase in costs, delayed results, litigation, and failure of counterparties to perform their contractual obligations. The Company does not undertake to update forward–looking statements or forward–looking information, except as required by law.
1 Independent Preliminary Economic Assessment for the Wicheeda Rare Earth Element Project, British Columbia, Canada, dated January 6, 2022, with an effective date of November 7, 2021, and prepared by SRK Consulting (Canada) Inc. is filed under Defense Metals Corp.’s Issuer Profile on SEDAR (www.sedar.com).
Continued progress for programs targeting eye diseases with the submission of an IND application for OCU200
Expanded portfolio now includes inhaled vaccines for COVID-19, seasonal flu, and a combination COVID-19+seasonal flu vaccine
MALVERN, Pa., Feb. 28, 2023 (GLOBE NEWSWIRE) — Ocugen, Inc. (Ocugen or the Company) (NASDAQ: OCGN), a biotechnology company focused on discovering, developing, and commercializing novel gene and cell therapies, biologics, and vaccines, today reported fourth quarter and full year 2022 financial results along with a general business update.
“We continue to grow and advance as a diversified biotechnology organization as reflected in our accomplishments of 2022,” said Dr. Shankar Musunuri, Chairman, Chief Executive Officer, and Co-Founder of Ocugen. “Our pipeline has been expanded to appropriately address the current challenges and gaps in the fight against COVID-19, application of OCU410 to address Stargardt (a rare eye disease), and our novel approach to address dry age-related macular degeneration (dAMD)—a disease affecting vision in over 266 million people worldwide.
“Following FDA concurrence in the fourth quarter of 2022 on a confirmatory Phase 3 clinical trial design for NeoCart®, we are developing internal capabilities to move our regenerative medicine asset, NeoCart®, into the clinic next year.”
“The FDA has granted expanded orphan drug designations to OCU400 for the treatment of retinitis pigmentosa (RP) and Leber congenital amaurosis (LCA),” said Dr. Musunuri. “These broad, gene-agnostic designations are encouraging at this stage in the development of OCU400.”
“During our first decade, we have built a strong foundation for addressing the diseases and conditions we aim to treat. We delivered on our promise to file an OCU200 IND in the first quarter of 2023 and look forward to delivering on important milestones in 2023, especially regarding preliminary efficacy data for gene therapy product OCU400, as we progress toward realizing our long-term vision to address unmet medical needs through courageous innovation,” Dr. Musunuri concluded.
Business Updates
Ophthalmic Gene Therapies
OCU400 – Established the high dose as the maximum tolerable dose, completed retinitis pigmentosa patient enrollment, and continuing to enroll patients with LCA to receive the high dose. Ocugen intends to initiate a Phase 3 clinical trial near the end of 2023.
OCU410 and OCU410ST – Executing IND-enabling studies and intend to submit IND applications in the second quarter of 2023 to initiate Phase 1/2 clinical trials in dry AMD (geographic atrophy) and Stargardt disease.
Ophthalmic Biologic Product
OCU200 – Submitted an IND application on February 27, 2023 to initiate a Phase 1 clinical trial targeting diabetic macular edema.
Regenerative Cell Therapies
NeoCart® – Received concurrence from the FDA on the confirmatory Phase 3 clinical trial design. Ocugen intends to initiate the Phase 3 clinical trial in the first half of 2024. Ocugen is renovating its facility to accommodate cGMP manufacturing of NeoCart® for clinical trials and beyond.
Vaccines Portfolio
OCU500 Series – Developing a novel mucosal vaccine platform which includes OCU500, a bivalent COVID-19 inhaled vaccine; OCU510, a seasonal quadrivalent flu inhaled vaccine; and OCU520 a combination quadrivalent seasonal flu and bivalent COVID-19 inhaled vaccine.
COVAXIN™ (BBV152) – Completed enrollment in Phase 2/3 immuno-bridging and broadening clinical trial in fourth quarter 2022.
Financial Results
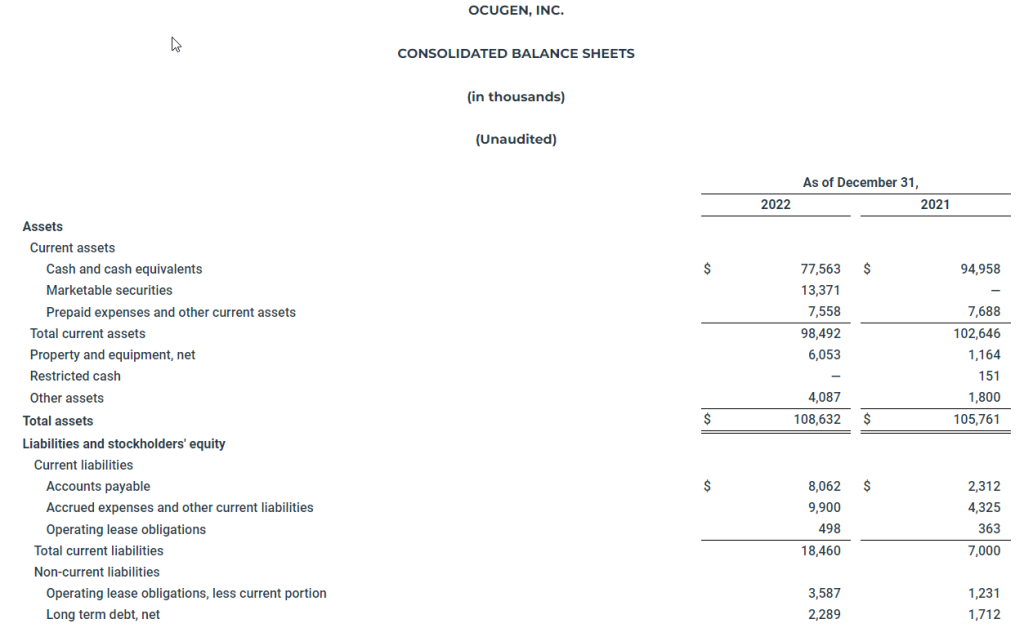
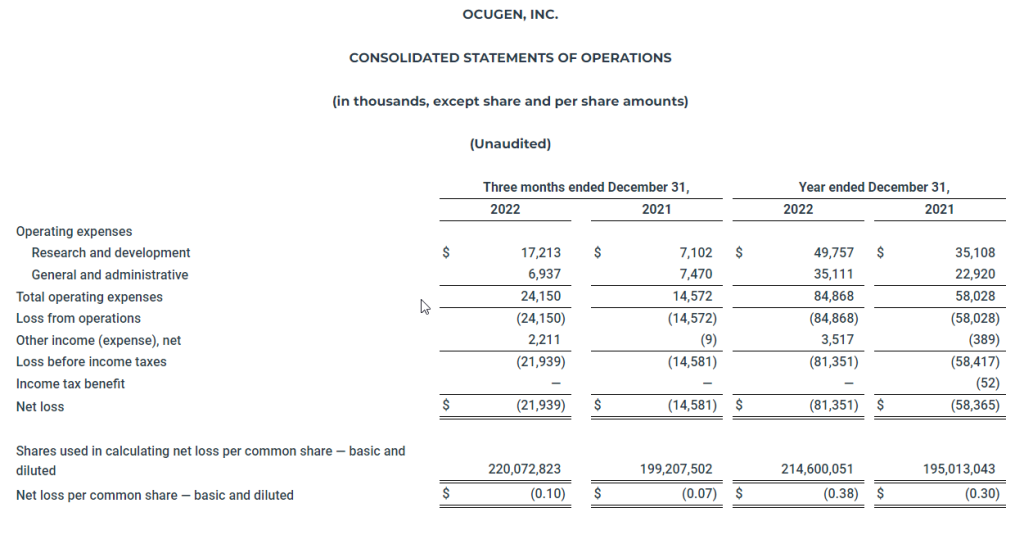
Fourth quarter — Research and development expenses for the three months ended December 31, 2022, were $17.2 million compared to $7.1 million for the three months ended December 31, 2021. General and administrative expenses for the three months ended December 31, 2022, were $6.9 million compared to $7.5 million for the three months ended December 31, 2021. Ocugen reported a $0.10 net loss per common share for the three months ended December 31, 2022, compared to a $0.07 net loss per common share for the three months ended December 31, 2021.
Full year — Research and development expenses for the year ended December 31, 2022, were $49.8 million compared to $35.1 million for the year ended December 31, 2021. General and administrative expenses for the year ended December 31, 2022, were $35.1 million compared to $22.9 million for the year ended December 31, 2021. Ocugen reported a $0.38 net loss per common share for the year ended December 31, 2022, compared to a $0.30 net loss per common share for the year ended December 31, 2021.
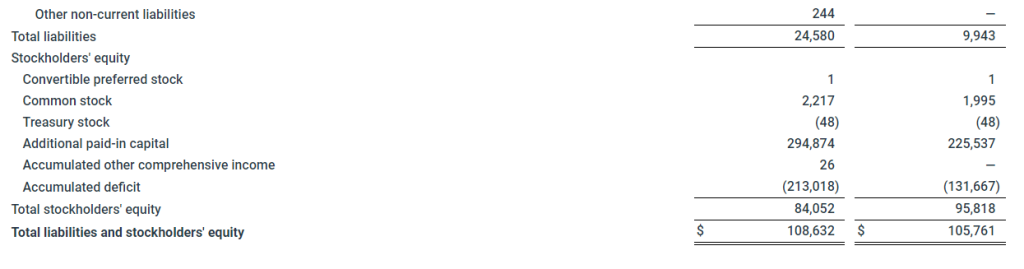
Ocugen’s cash, cash equivalents, restricted cash, and investments totaled $90.9 million as of December 31, 2022, compared to $95.1 million as of December 31, 2021. The Company estimates that its current cash, cash equivalents, and investments will enable it to fund its operations into the first quarter of 2024. The Company had 221.6 million shares of common stock outstanding as of December 31, 2022.
Conference Call and Webcast Details
Ocugen has scheduled a conference call and webcast for 8:30 a.m. ET today to discuss the financial results and recent business highlights. Ocugen’s senior management team will host the call, which will be open to all listeners. There will also be a question-and-answer session following the prepared remarks.
Attendees are invited to participate on the call or webcast using the following details:
Dial-in Numbers: (800) 715-9871 for U.S. callers and (646) 307-1963 for international callers Conference ID: 8912239 Webcast: Available on Ocugen’s investor site
A replay of the call and archived webcast will be available for approximately 45 days following the event on the Ocugen investor site.
About Ocugen, Inc. Ocugen, Inc. is a biotechnology company focused on discovering, developing, and commercializing novel gene and cell therapies, biologics, and vaccines that improve health and offer hope for patients across the globe. We are making an impact on patient’s lives through courageous innovation—forging new scientific paths that harness our unique intellectual and human capital. Our breakthrough modifier gene therapy platform has the potential to treat multiple retinal diseases with a single product, and we are advancing research in infectious diseases to support public health and orthopedic diseases to address unmet medical needs.
Forward-Looking Statements This press release contains forward-looking statements within the meaning of The Private Securities Litigation Reform Act of 1995, which are subject to risks and uncertainties. We may, in some cases, use terms such as “predicts,” “believes,” “potential,” “proposed,” “continue,” “estimates,” “anticipates,” “expects,” “plans,” “intends,” “may,” “could,” “might,” “will,” “should,” or other words that convey uncertainty of future events or outcomes to identify these forward-looking statements. Such statements are subject to numerous important factors, risks, and uncertainties that may cause actual events or results to differ materially from our current expectations. These and other risks and uncertainties are more fully described in our periodic filings with the Securities and Exchange Commission (SEC), including the risk factors described in the section entitled “Risk Factors” in the quarterly and annual reports that we file with the SEC. Any forward-looking statements that we make in this press release speak only as of the date of this press release. Except as required by law, we assume no obligation to update forward-looking statements contained in this press release whether as a result of new information, future events, or otherwise, after the date of this press release.
MALVERN, Pa., Feb. 27, 2023 (GLOBE NEWSWIRE) — Ocugen, Inc. (“Ocugen” or the “Company”) (NASDAQ: OCGN), a biotechnology company focused on discovering, developing, and commercializing novel gene and cell therapies, biologics, and vaccines, today announced that it has submitted an Investigational New Drug application (IND) with the U.S. Food and Drug Administration (FDA) to initiate a Phase 1 clinical trial of OCU200, a fusion protein with a distinct mechanism of action (MOA), for the treatment of diabetic macular edema (DME). This regulatory milestone fulfills the Company’s commitment to file the IND for OCU200 within the first quarter of 2023.
“Today’s achievement is an important step towards fulfilling our mission to bring novel therapeutics to address limitations of the current standard of care or unmet medical needs in hard-to-treat blindness diseases,” said Dr. Arun Upadhyay, Chief Scientific Officer at Ocugen. “We are encouraged by the potential for OCU200 to provide a new treatment option for the significant percentage of people living with DME, including non-responders to the current standard of care.”
The planned Phase 1 clinical study will assess the unilateral intravitreal administration of OCU200 alone or in combination with an approved anti-VEGF therapy in participants with DME. This is a multicenter, open-label, dose-ranging study with 3 cohorts in the dose-escalation portion of the study and 1 cohort in the combination therapy portion of the study.
DME is one of the most common vision-threatening diseases occurring in people with diabetes and includes blurriness in vision and progressive vision loss as the disease progresses. Approximately 745,000 people in the United States are affected with DME, and this number is expected to further increase as the number of people with diabetes increases.
The Company intends to pursue additional indications for OCU200 to potentially treat diabetic retinopathy and wet age-related macular degeneration, which combined affect nearly 9.0 million Americans.
About Ocugen, Inc. Ocugen, Inc. is a biotechnology company focused on discovering, developing, and commercializing novel gene and cell therapies, biologics, and vaccines, that improve health and offer hope for patients across the globe. We are making an impact on patient’s lives through courageous innovation—forging new scientific paths that harness our unique intellectual and human capital. Our breakthrough modifier gene therapy platform has the potential to treat multiple retinal diseases with a single product, and we are advancing research in infectious diseases to support public health and orthopedic diseases to address unmet medical needs. Discover more at www.ocugen.com and follow us on Twitter and LinkedIn.
About OCU200 OCU200 is a novel fusion protein consisting of human transferrin linked to human tumstatin. It exerts anti-proliferative, anti-inflammatory, and anti-oxidative effects by selective targeting to the retinal and choroidal tissues. OCU200 potentially showcases better bioavailability and tissue penetrance than tumstatin alone due to transferrin and provides distinct MOA binding through αVβ3 integrin pathways that can potentially reduce the number of injections for patients.
OCU200 can potentially be used for the treatment of diabetic macular edema, diabetic retinopathy, and wet age-related macular degeneration. These diseases, combined, account for approximately 10 million cases in the U.S.
Forward-Looking Statements This press release contains forward-looking statements within the meaning of The Private Securities Litigation Reform Act of 1995, which are subject to risks and uncertainties. We may, in some cases, use terms such as “predicts,” “believes,” “potential,” “proposed,” “continue,” “estimates,” “anticipates,” “expects,” “plans,” “intends,” “may,” “could,” “might,” “will,” “should,” or other words that convey uncertainty of future events or outcomes to identify these forward-looking statements. Such statements are subject to numerous important factors, risks, and uncertainties that may cause actual events or results to differ materially from our current expectations. These and other risks and uncertainties are more fully described in our periodic filings with the Securities and Exchange Commission (SEC), including the risk factors described in the section entitled “Risk Factors” in the quarterly and annual reports that we file with the SEC. Any forward-looking statements that we make in this press release speak only as of the date of this press release. Except as required by law, we assume no obligation to update forward-looking statements contained in this press release whether as a result of new information, future events, or otherwise, after the date of this press release.
SANTA MONICA, Calif.–(BUSINESS WIRE)– Entravision (NYSE: EVC), a leading global advertising solutions, media and technology company, announced today that its Asia-based digital business unit has become the Authorized Sales Partner in Mongolia of Meta, the company that owns Facebook, Instagram and WhatsApp.
“This partnership reinforces our commitment to advertisers and their agencies to connect brands to consumers through local strategic support, creative expertise and relevant in-market training,” said Pieter-Jan de Kroon, Chief Executive Officer of Entravision Asia. “As we continue to expand our presence throughout Asia, we are thrilled to partner with Meta as their Authorized Sales Partner in Mongolia to equip and empower local businesses with the most advanced and effective advertising solutions.”
As an Authorized Sales Partner of Meta, Entravision will provide a dedicated local team, strategic direction, support, training, lines of credit and local billing to advertisers in the Mongolian market to enable them to meet their business objectives.
“Mongolia is an important country for Meta, and it is a priority for us to invest in the market and to be closer to the people and businesses here,” said Jordi Fornies, Managing Director of Emerging Markets for APAC at Meta. “As such, we are excited to introduce Entravision as Meta’s Authorized Sales Partner in Mongolia. With robust local expertise and insights, we can provide better support for businesses and agencies to help them to emerge from this challenging time stronger and further unlock their potential growth.”
About Entravision
Entravision is a leading global advertising, media and ad-tech solutions company connecting brands to consumers by representing top platforms and publishers. Our dynamic portfolio includes digital, television and audio offerings. Digital, our largest revenue segment, is comprised of four business units: our digital sales representation business; Smadex, our programmatic ad purchasing platform; our branding and mobile performance solutions business; and our digital audio business. Through our digital sales representation business, we connect global media companies such as Meta, Twitter, TikTok and Spotify with advertisers in primarily emerging growth markets worldwide. Smadex is our mobile-first demand side platform, enabling advertisers to execute performance campaigns using machine learning. We also offer a branding and mobile performance solutions business, which provides managed services to advertisers looking to connect with global consumers, primarily on mobile devices, and our digital audio business provides digital audio advertising solutions for advertisers in the Americas. In addition to digital, Entravision has 49 television stations and is the largest affiliate group of the Univision and UniMás television networks. Entravision also manages 45 primarily Spanish-language radio stations that feature nationally recognized, Emmy award-winning talent. Shares of Entravision Class A Common Stock trade on the NYSE under ticker: EVC. Learn more about our offerings at entravision.com or connect with us on LinkedIn and Facebook.
About Meta
Meta builds technologies that help people connect, find communities, and grow businesses. When Facebook launched in 2004, it changed the way people connect. Apps like Messenger, Instagram, and WhatsApp further empowered billions around the world. Now, Meta is moving beyond 2D screens toward immersive experiences like augmented and virtual reality to help build the next evolution in social technology.
Forward-Looking Statements
This press release contains certain forward-looking statements. These forward-looking statements, which are included in accordance with the safe harbor provisions of the Private Securities Litigation Reform Act of 1995, may involve known and unknown risks, uncertainties and other factors that may cause the Company’s actual results and performance in future periods to be materially different from any future results or performance suggested by the forward-looking statements in this press release. Although the Company believes the expectations reflected in such forward-looking statements are based upon reasonable assumptions, it can give no assurance that actual results will not differ materially from these expectations, and the Company disclaims any duty to update any forward-looking statements made by the Company. From time to time, these risks, uncertainties and other factors are discussed in the Company’s filings with the Securities and Exchange Commission.
Investors: Christopher T. Young Interim Chief Executive Officer 310-447-3870
Received guidance on registrational path for combination in recurrent/metastatic, immune checkpoint inhibitor refractory head and neck cancer
FLORHAM PARK, N.J., Feb. 27, 2023 (GLOBE NEWSWIRE) — PDS Biotechnology Corporation (Nasdaq: PDSB), a clinical-stage immunotherapy company developing a growing pipeline of targeted immunotherapies for cancer and infectious disease, announced the successful completion of a Type B meeting with the U.S. Food and Drug Administration (FDA) for a combination therapy of PDS0101, PDS0301 and an FDA-approved immune checkpoint inhibitor (ICI) for the treatment of recurrent/metastatic human papilloma virus (HPV)-positive, ICI refractory head and neck cancer. Head and neck cancers are the most common of all HPV-positive cancers and the number of cases is growing rapidly, according to the National Cancer Institute (NCI), one of the National Institutes of Health (NIH). There remains a critical unmet medical need to develop new treatment options for patients who have failed treatment with ICIs.
In recent interactions with the FDA, PDS Biotech has confirmed the required contents of the study design for a potential registrational trial of the combination of PDS0101, PDS0301 and a commercial immune checkpoint inhibitor. PDS0101, PDS Biotech’s lead candidate, is a Versamune® based investigational immunotherapy designed to stimulate a potent targeted T cell attack against HPV16-positive cancers. PDS0301 is a novel, proprietary investigational tumor-targeting fusion protein of Interleukin 12 (IL-12) that enhances the proliferation, potency and longevity of T cells in the tumor microenvironment, and is designed to overcome tumor immune suppression utilizing a different mechanism from checkpoint inhibitors. The combination of Versamune® and IL-12 is patented by PDS Biotech. In a National Cancer Institute (NCI)-led clinical trial in advanced HPV-positive ICI refractory patients, the combination of PDS0101 and PDS0301 administered with an investigational bi-functional ICI resulted in a median overall survival of 21 months, which compares favorably to the historical median survival of 3-4 months.
“We are pleased with the guidance from the FDA on key elements of a study design to progress the development of our assets, PDS0101 and PDS0301, in combination with a commercial immune checkpoint inhibitor,” said Dr. Frank Bedu-Addo, Chief Executive Officer of PDS Biotech. “This concurrence to substitute an FDA-approved commercially available ICI for the investigational agent studied in the NCI trial simplifies the regulatory pathway for this triple combination.”
Dr. Bedu-Addo continued, “Versamune® based investigational immunotherapies in combination with PDS0301 represent a potentially transformative treatment approach for recurrent/metastatic, ICI refractory cancer patients with poor survival prognosis. We remain committed to addressing unmet needs in cancer with more effective immunotherapy.”
About PDS0101 PDS0101, PDS Biotech’s lead candidate, is a novel investigational human papilloma virus (HPV)-targeted immunotherapy that stimulates a potent targeted T cell attack against HPV-positive cancers. PDS
Refinancing Expected to Strengthen Company’s Balance Sheet
IRVING, Texas–(BUSINESS WIRE)– Salem Media Group, Inc. (NASDAQ: SALM) (the “Company”), today announced that it has issued an irrevocable notice of redemption (the “Notice”) to the trustee of its outstanding 6.75% Senior Secured Notes due 2024 (the “2024 Notes”). The Notice calls for the redemption in full of the remaining $36.5 million in outstanding aggregate principal amount of 2024 Notes.
The redemption date will be March 27, 2023 and the redemption price will be equal to 100% of the principal amount of the 2024 Notes being redeemed, plus accrued and unpaid interest to the redemption date, in accordance with the provisions of the indenture governing the 2024 Notes.
The Company expects to pay the redemption price for the 2024 Notes by issuing an additional $44.685 million in aggregate principal amount of its 7.125% Senior Secured Notes due 2028 (the “2028 Notes”) to certain holders of its 2028 Notes (the “Additional Notes Issuance”) pursuant to a purchase agreement entered into with such holders in connection with the initial issuance of the 2028 Notes. The closing of the Additional Notes Issuance is subject to the satisfaction of customary closing conditions and there can be no assurance that the Additional Notes Issuance will be completed as contemplated or at all.
Additional information concerning the terms and conditions of the redemption are fully described in the Notice distributed to holders of the 2024 Notes. Beneficial holders with any questions about the redemption should contact their respective brokerage firm or financial institution.
About Salem Media Group, Inc.
Salem Media Group is America’s leading multimedia company specializing in Christian and conservative content, with media properties comprising radio, digital media and book and newsletter publishing. Each day Salem serves a loyal and dedicated audience of listeners and readers numbering in the millions nationally. With its unique programming focus, Salem provides compelling content, fresh commentary and relevant information from some of the most respected figures across the Christian and conservative media landscape. Learn more about Salem Media Group, Inc. at www.salemmedia.com, Facebook and Twitter.
Forward-Looking Statements
Statements used in this press release that relate to future plans, events, financial results, prospects or performance, including statements relating to the anticipated Additional Notes Issuance, are forward-looking statements as defined under the Private Securities Litigation Reform Act of 1995. Actual results may differ materially from those anticipated as a result of certain risks and uncertainties, including but not limited to the ability of Salem to close and integrate announced transactions, including its ability to close the Additional Notes Issuance, market acceptance of Salem’s radio station formats, competition from new technologies, inflation and other adverse economic conditions, and other risks and uncertainties detailed from time to time in Salem’s reports on Forms 10-K, 10-Q, 8-K and other filings filed with or furnished to the Securities and Exchange Commission. Readers are cautioned not to place undue reliance on these forward-looking statements, which speak only as of the date hereof. Salem undertakes no obligation to update or revise any forward-looking statements to reflect new information, changed circumstances or unanticipated events.
MELVILLE, N.Y. – Feb. 27, 2023– Comtech (NASDAQ: CMTL) announced today that the company will join Microsoft’s Azure Operator Nexus Ready Program to offer customers interoperable cloud services.
Microsoft’s Azure Nexus Operator Ready Program certifies that Comtech’s Location Management Function (LMF), a standards-based location server for 5G, will be interoperable with Azure Operator Nexus. LMF runs on Comtech’s Dynamic Cloud Platform (DCP), which is designed to be infrastructure, cloud, and application agnostic-allowing communications providers and other organizations to easily orchestrate, integrate, and manage applications across private, hybrid, and public cloud networks.
“As one of Microsoft’s first Azure Operator Nexus Ready Program members, our customers and partners can now leverage Comtech’s enterprise technologies and software solutions on the Azure Operator Nexus platform,” said Ken Peterman, President and CEO, Comtech. “This collaboration demonstrates the flexibility, security, and adaptability of our DCP as well as the substantial benefits Comtech’s innovative software technology solutions can bring to cloud providers across the globe.”
Comtech’s DCP also unlocks the availability of new third-party applications across current and future computing environments, such as Microsoft Azure Operator Nexus.
About Comtech
Comtech Telecommunications Corp. is a leading global technology company providing terrestrial and wireless network solutions, next-generation 9-1-1 emergency services, satellite and space communications technologies, and cloud native capabilities to commercial and government customers around the world. Our unique culture of innovation and employee empowerment unleashes a relentless passion for customer success. With multiple facilities located in technology corridors throughout the United States and around the world, Comtech leverages our global presence, technology leadership, and decades of experience to create the world’s most innovative communications solutions.For more information, please visit www.comtech.com.
Forward-Looking Statements
Certain information in this press release contains statements that are forward-looking in nature and involve certain significant risks and uncertainties. Actual results and performance could differ materially from such forward-looking information. The Company’s Securities and Exchange Commission filings identify many such risks and uncertainties. Any forward-looking information in this press release is qualified in its entirety by the risks and uncertainties described in such Securities and Exchange Commission filings.
Toronto, Ontario, February 24, 2023 – Aurania Resources Ltd. (TSXV: ARU; OTCQB: AUIAF; Frankfurt: 20Q) (“Aurania” or the “Company”) is pleased to announce that it will be attending the Prospector’s and Developers International Convention (PDAC) being held March 5th – 8th, 2023 at the Metro Toronto Convention Centre (MTCC) in Toronto, Canada.
PDAC Booth Location
Aurania will be exhibiting at booth 2948 in the Investors Exchange located in the MTCC South Building, Level 800. Please note our new booth location. For more information about PDAC and registration, please visit https://www.pdac.ca/convention/registration.
March 5th – 5:00pm Shareholder Meet and Greet with Management
Aurania is hosting a meet-and-greet for shareholders on Sunday, March 5th from 5:00pm-8:00pm in Salon 1, 19th Floor, at The Fairmont Royal York Hotel, 100 Front Street West, Toronto, Ontario. Due to capacity limitations, we kindly ask that you confirm your attendance no later than March 1st by RSVP to [email protected].
March 6th – 9:05am Ecuador Day
Ecuador Day will take place on Monday, March 6th at 8:00am ET in Room 206F at the MTCC. Ecuador Day is being organized and hosted by the Ecuador Chamber of Mines and will run from 8:00am-12:00pm. Representatives from the Government of Ecuador are expected to provide an update on the mining industry in Ecuador during this event.
March 7th – 10:00am Panel on Planning for Sustainable Mineral Development 101
Aurania’s Head of CSR, Ms. Carolina Lasso, has been invited to participate in a session sub-topic titled “Setting the stage for success with the S in ESG: Engagement and agreement making in early exploration” on Tuesday, March 7th at 10:00am in Room 715 at the MTCC.
ERM – Environmental Resources Management has put together this two-hour lightning talks panel in collaboration with the PDAC Sustainability Committee. The panel will feature key sub-topics within the sustainable mining framework explored by junior companies, community members, investors, and expert speakers. Click here for more information:
Aurania is a mineral exploration company engaged in the identification, evaluation, acquisition and exploration of mineral property interests, with a focus on precious metals and copper in South America. Its flagship asset, The Lost Cities – Cutucu Project, is located in the Jurassic Metallogenic Belt in the eastern foothills of the Andes mountain range of southeastern Ecuador.
Information on Aurania and technical reports are available at www.aurania.com and www.sedar.com, as well as on Facebook at https://www.facebook.com/auranialtd/, Twitter at https://twitter.com/auranialtd, and LinkedIn at https://www.linkedin.com/company/aurania-resources-ltd-.
Neither the TSX-V nor its Regulation Services Provider (as that term is defined in the policies of the TSX-V) accepts responsibility for the adequacy or accuracy of this release.
RICHMOND, Va.–(BUSINESS WIRE)– Bowlero Corp., (NYSE: BOWL) the global leader in bowling entertainment, completed the acquisition of The Big Event in New Jersey on February 14th. This announcement marks the Company’s first completed acquisition in calendar year 2023, out of a robust pipeline of remaining acquisitions.
Brett Parker, President & Chief Financial Officer of Bowlero Corp., stated, “Today’s announcement illustrates our continued commitment to expanding our unit base and simultaneously improving our average unit volumes.”
The Big Event is located in Cherry Hill, NJ, 20 miles outside of Philadelphia. This impressive 36 lane center features billiards, ping pong, shuffleboard, arcade games and VIP private event rooms. The acquisition of The Big Event marks the Company’s 10th location in the state of New Jersey. This center opened under Bowlero Corp. management on Friday, February 17th.
Parker stated in closing, “We look forward to welcoming this center to our growing national footprint and, as always, we remain focused on growth while continuing to prioritize a world-class experience for our guests.”
Thus far in fiscal year 2023 Bowlero Corp completed 12 acquisitions.
About Bowlero Corp Bowlero Corp. is the global leader in bowling entertainment, media, and events. With more than 325 bowling centers across North America, Bowlero Corp. serves more than 30 million guests each year through a family of brands that includes Bowlero, Bowlmor Lanes, and AMF. In 2019, Bowlero Corp. acquired the Professional Bowlers Association, the major league of bowling, which boasts thousands of members and millions of fans across the globe. For more information on Bowlero Corp., please visit BowleroCorp.com
Net sales were $1.95 billion, down 4 percent; comparable sales up 1 percent
Gained market share across multiple product categories in North America in 2022
Achieved quarterly sequential margin improvement in EMEA as pricing actions took hold
Realized double-digit sales and profit growth in the International segment
Generated $78 million of cash from operations; adjusted free cash flow of $78 million
During fourth quarter of 2022 actioned annual cost savings of $13 million from significant restructuring initiatives
Full year 2023 outlook anticipates margin expansion and profit growth
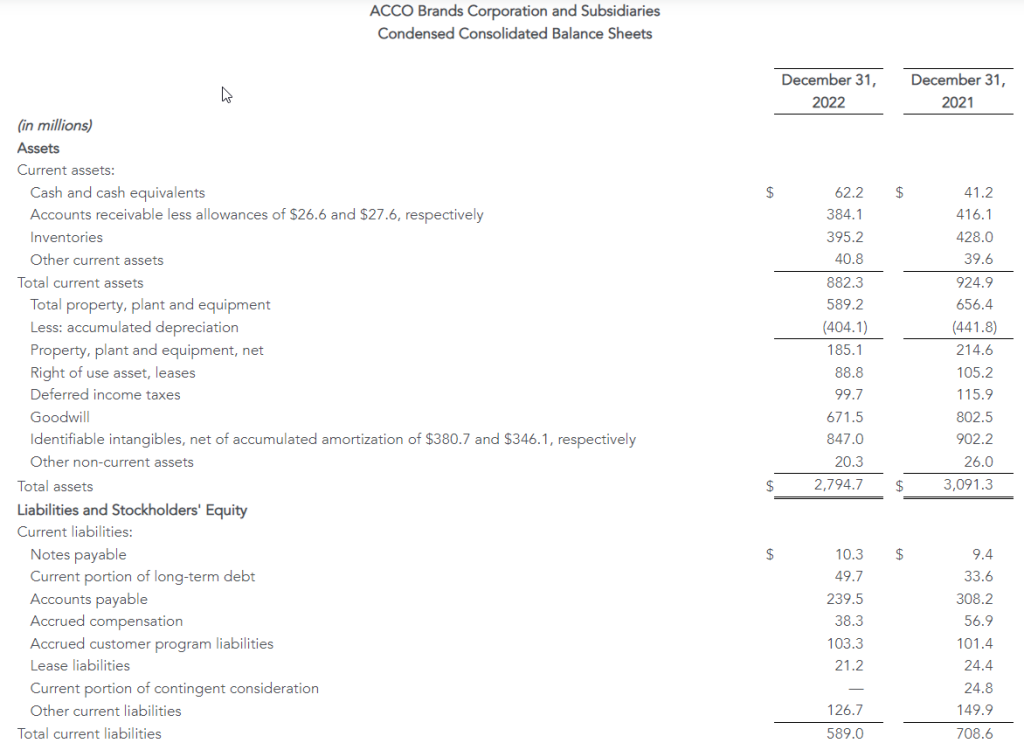
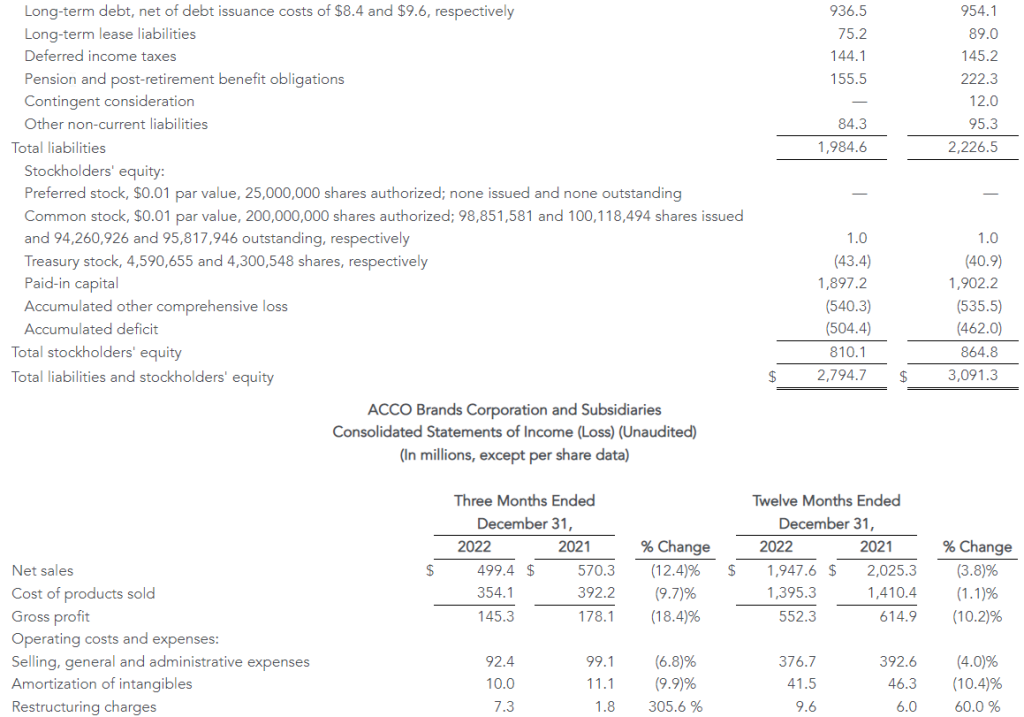
LAKE ZURICH, Ill.–(BUSINESS WIRE)– ACCO Brands Corporation (NYSE: ACCO) today announced its fourth quarter and full year results for the period ended December 31, 2022.
“We delivered 1% comparable sales growth in 2022 as we continue to execute on our strategic transformation, including expanding our product categories, broadening our geographic reach and bringing innovative new consumer-centric products to market. This enabled us to achieve market share gains with many of our brands, including Five Star®, Kensington®, Mead®, Quartet® and AT-A-GLANCE®. These successes give us confidence that our strategy of being a more consumer, brand and technology centric company and our portfolio of strong brands will position us to deliver sustainable organic growth over the long-term,” said Boris Elisman, Chairman and Chief Executive Officer of ACCO Brands.
“In 2023 our top priority is to restore our margin profile through incremental pricing actions implemented in January of 2023, the restructuring initiatives undertaken during the fourth quarter of 2022 and the additional productivity programs we will implement in 2023. We expect these actions will drive margin expansion and profit growth for the full year of 2023. With our expected continued strong cash flow in 2023, we will support our quarterly dividend, pay down debt and continue to invest in new product development and go-to-market initiatives, which we expect will better position us for future growth,” added Elisman.
Fourth Quarter Results
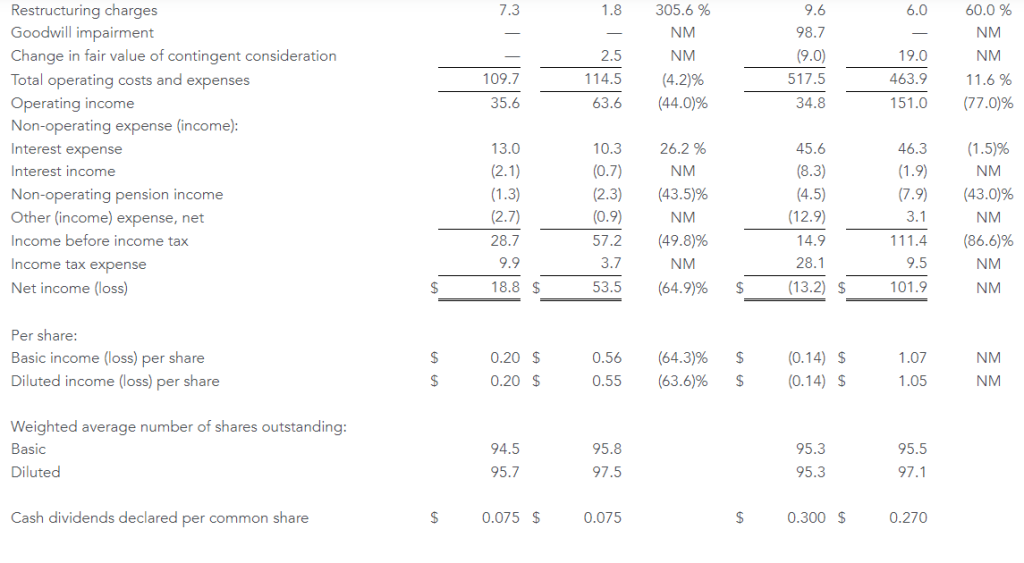
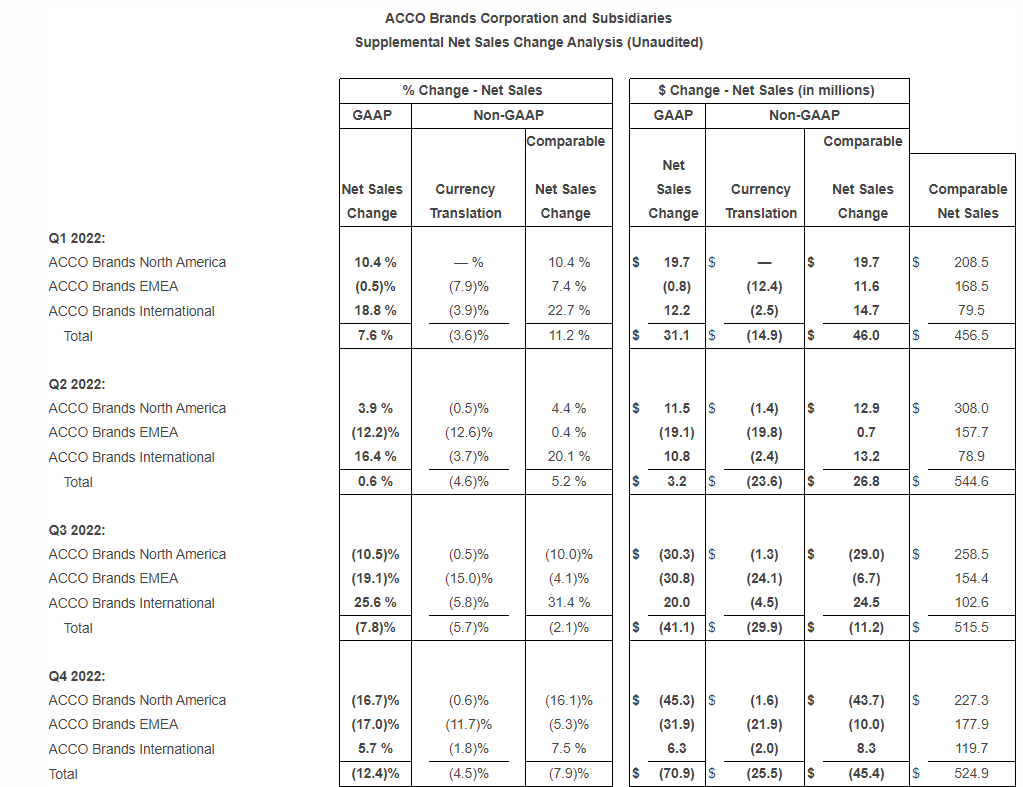
Net sales declined 12.4 percent to $499.4 million from $570.3 million in 2021. Adverse foreign exchange reduced sales $25.5 million, or 4.5 percent. Comparable sales fell 7.9 percent. Both reported and comparable sales declines were due to weaker sales of gaming accessories, lower inventory replenishment by our retailer customers and reduced volumes due to a deterioration in the macroeconomic environment. These more than offset global price increases.
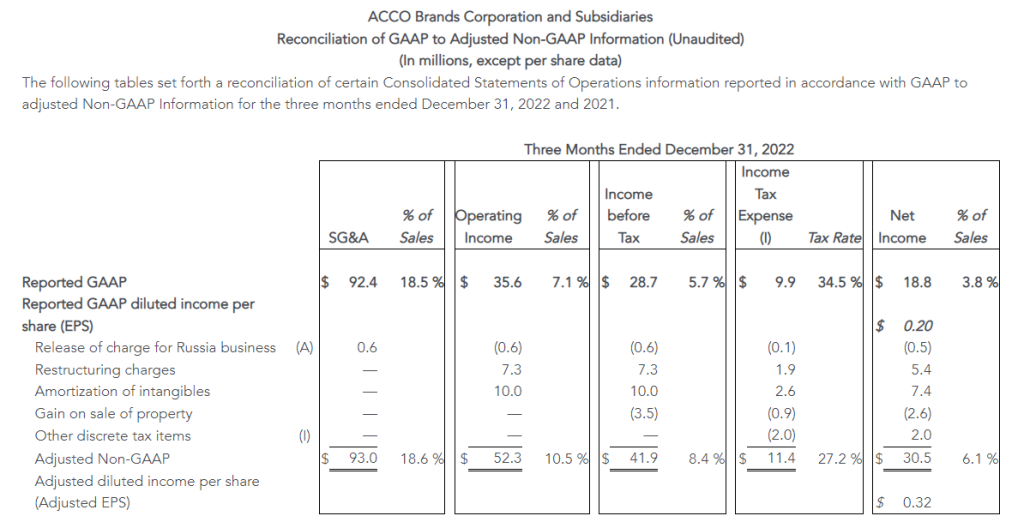
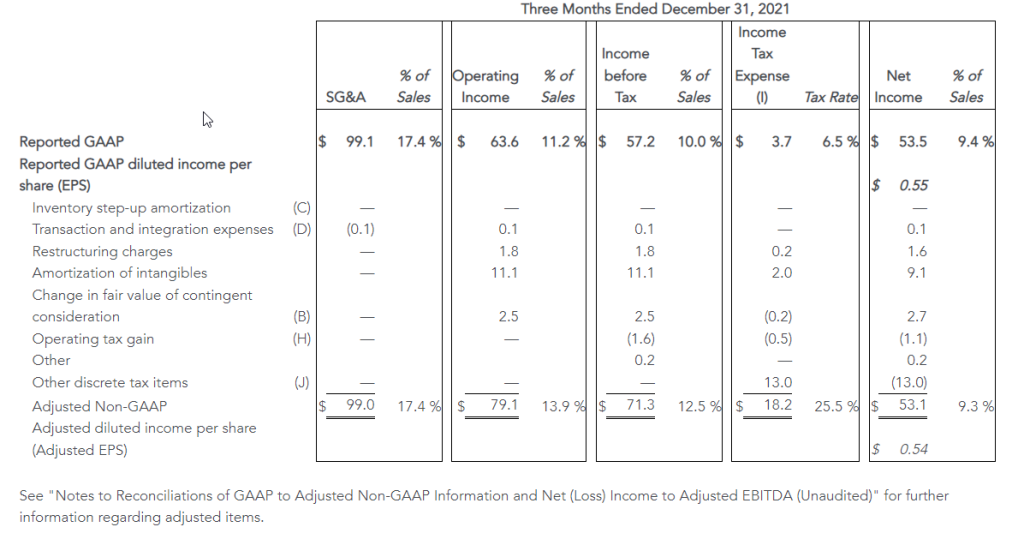
Operating income was $35.6 million versus $63.6 million in 2021, and adjusted operating income decreased to $52.3 million from $79.1 million in the prior year. Both reported and adjusted operating income reflect the impact of lower sales volumes and higher inflation on raw materials, finished goods and transportation costs, which was partially offset by price increases, and reduced SG&A expense due to lower incentive compensation expense. Adverse foreign exchange reduced operating income by $2.2 million.
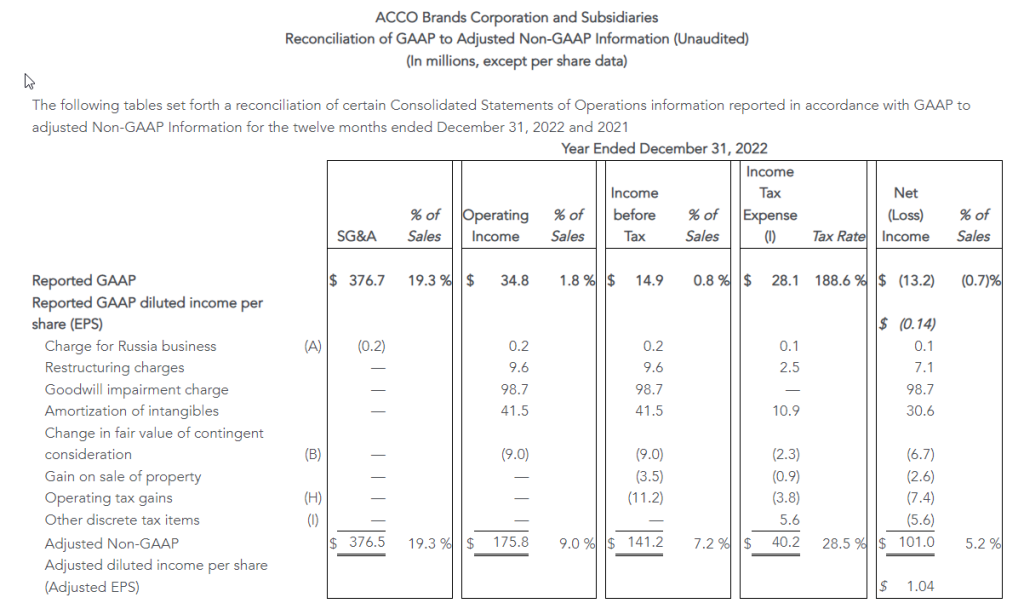
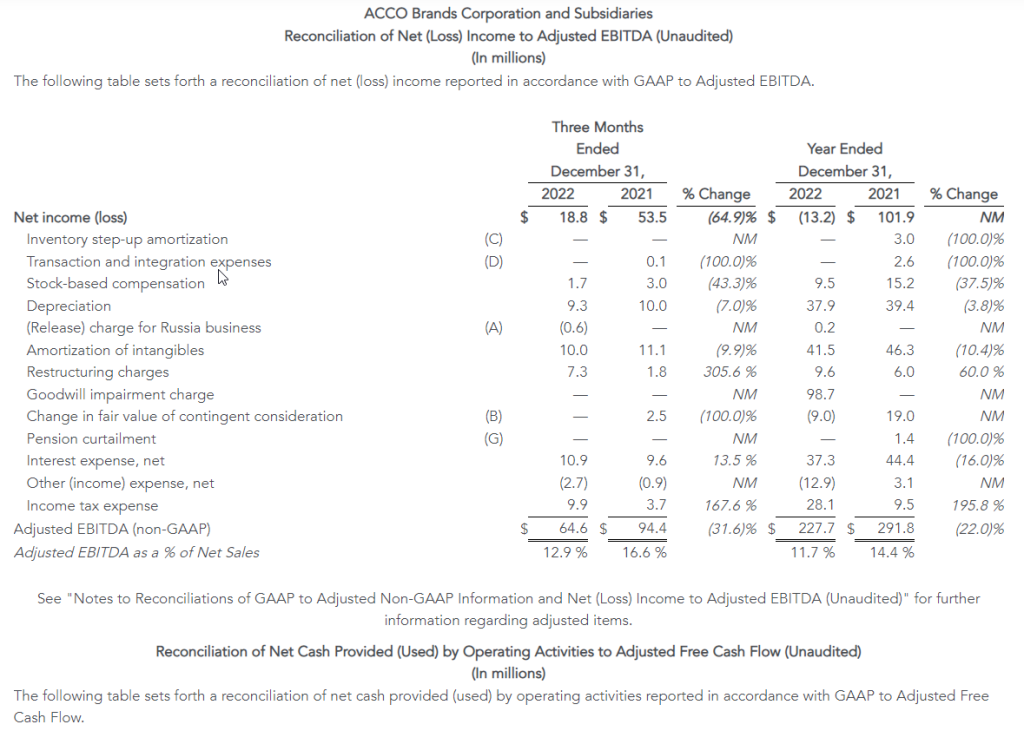
The Company reported net income of $18.8 million, or $0.20 per share, compared with prior year net income of $53.5 million, or $0.55 per share, which included $13.0 million of favorable discrete tax items. Adjusted net income was $30.5 million, or $0.32 per share, compared with $53.1 million, or $0.54 per share in 2021. The remaining declines in underlying reported net income, as well as adjusted net income were due to the items noted above in operating income.
Full Year Results
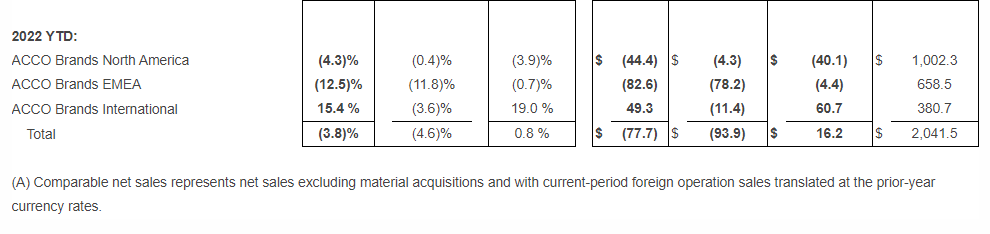
Net sales decreased 3.8 percent to $1.95 billion from $2.03 billion in 2021. The unfavorable impact of foreign exchange reduced sales by $93.9 million, or 4.6 percent. Comparable sales increased 0.8 percent. Both reported and comparable sales reflect the benefit of higher prices in all segments and strong volume growth in the International segment, partially offset by weaker sales of gaming accessories, and lower volumes in North America and EMEA due to the challenging macroeconomic environment.
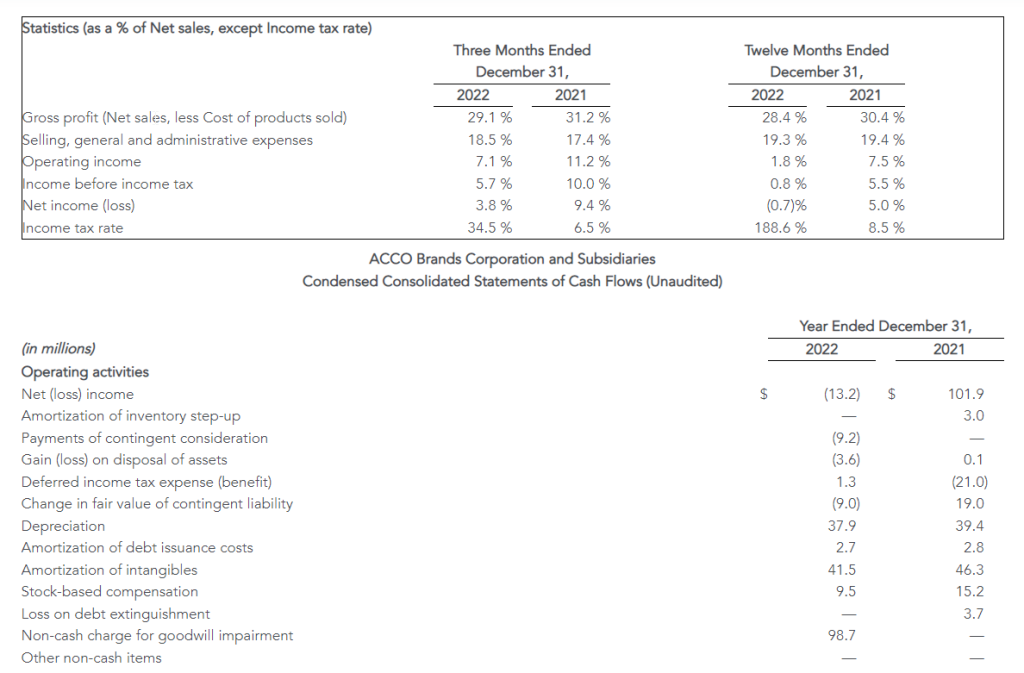
Operating income was $34.8 million compared to $151.0 million in 2021, with the decline primarily due to the non-cash goodwill impairment charge of $98.7 million, partially offset by the favorable change in fair value of $28.0 million related to the PowerA contingent earnout. Adjusted operating income declined to $175.8 million from $227.9 million in 2021. The declines in both reported and adjusted operating income also reflect the impact of inflation that exceeded the benefit of price increases, and reduced volumes, partially offset by reduced SG&A expense which includes lower incentive compensation expense. Unfavorable foreign exchange reduced operating income by $6.3 million.
Net loss was $13.2 million, or ($0.14) per share, compared with net income of $101.9 million, or $1.05 per share, in 2021. The current year net loss includes $98.7 million in non-cash goodwill impairment charges, mitigated by the favorable change in fair value of the contingent earnout consideration of $20.9 million. Prior year net income also included $19.7 million of additional favorable discrete tax items, partially offset by $9.9 million of expenses related to the debt refinancing. Adjusted net income was $101.0 million, compared with $136.8 million in 2021, and adjusted earnings per share were $1.04 compared with $1.41 in 2021. The remaining declines in reported net income and adjusted net income reflect the changes noted above for adjusted operating income, partially offset by higher interest income due to higher cash balances and increased interest rates in Brazil. Interest expense was similar to the prior year.
Capital Allocation and Dividend
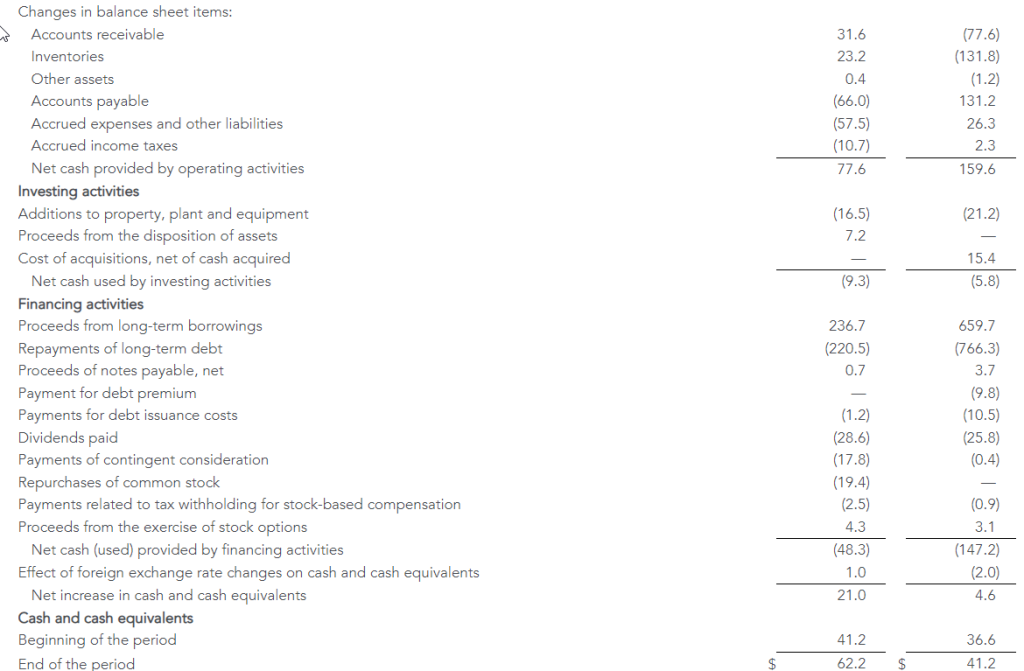
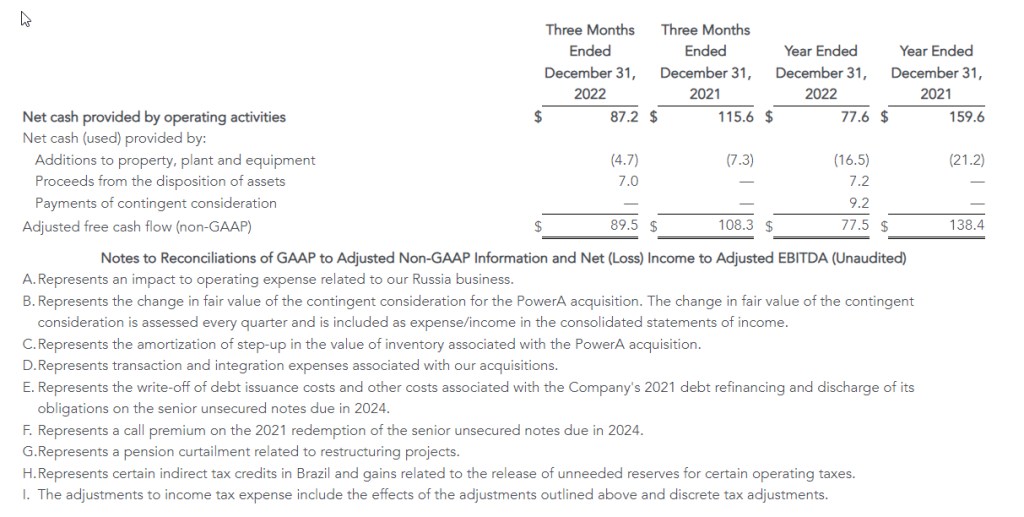
For the full year, the Company’s cash generated by operating activities was $77.6 million versus $159.6 million in the prior year. Adjusted free cash flow in 2022 was $77.5 million, reflecting net investing activity and excluding the operating component of the contingent earnout payment. In 2022 the Company paid $28.6 million in dividends, repurchased 2.7 million shares for $19.4 million and fully paid $27.0 million related to the 2021 PowerA contingent earnout.
ACCO Brands announced on February 17, 2023, that its board of directors declared a regular quarterly cash dividend of $0.075 per share. The dividend will be paid on April 5, 2023, to stockholders of record at the close of business on March 10, 2023.
Restructuring Actions
During the fourth quarter of 2022, the Company developed restructuring plans for both its North America and EMEA operating segments, intended to expand margins through initiatives focused on improving operating efficiency and reducing cost. In the Company’s North America segment, the plan is focused on consolidation of supply chain operations, SKU reduction, automating our sales support process, and sourcing optimization. In the Company’s EMEA segment, the focus is on reducing redundancy and enhancing productivity in its operations, SKU reduction, and sourcing initiatives. The Company anticipates these initiatives will create operating efficiencies and improve profitability, as well as provide for future growth investments. The Company has the following expectations for the restructuring plans:
Targeted annualized operating profit improvement of $13 million, with the vast majority of these savings delivered in 2023
Total profit improvements to be realized approximately 75% through lower SG&A costs and 25% through reduced cost of goods sold
Pre-tax restructuring charges of approximately $7 million were recorded in the fourth quarter, primarily comprised of severance and employee related costs
In addition, the Company has implemented plans to reduce inventory levels, increase inventory turns and improve cash flow and working capital.
Business Segment Results
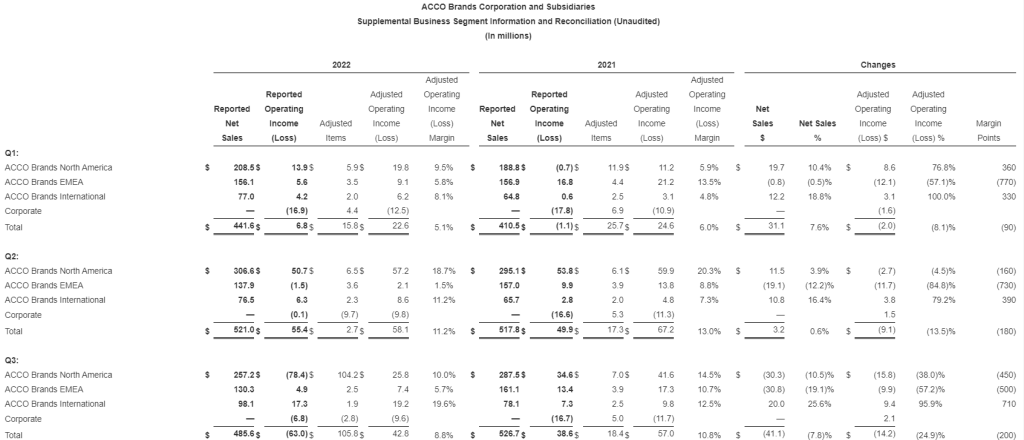
ACCO Brands North America – Fourth quarter segment net sales of $225.7 million decreased 16.7 percent versus the prior year’s segment net sales of $271.0 million. Adverse foreign exchange reduced sales by 0.6 percent. Comparable sales of $227.3 million were down 16.1 percent. The decrease was primarily due to lower demand for gaming accessories and channel inventory destocking, more than offsetting price increases.
Fourth quarter operating income in North America was $8.9 million versus $34.2 million a year earlier, and adjusted operating income was $18.7 million compared to $41.9 million a year ago, with the decline in both primarily reflecting the impact of lower sales, reduced gross margin rates from negative fixed cost leverage and higher inflation on raw materials, finished goods and transportation costs. In addition, we incurred one-off items in the quarter of $7.8 million, reducing the margin rate by 340 basis points. We anticipate stabilization of product costs in select areas and improved ocean freight rates, which should benefit our margin profile in future periods.
For the full year, 2022 North America net sales of $998.0 million decreased 4.3 percent from $1,042.4 million in 2021, and comparable sales declined 3.9 percent. Higher sales and market share gains in many brands and product categories were more than offset by weaker demand for gaming accessories. Sales were stronger in the first half of 2022, driven by early demand for back-to-school products as retailers pulled their shipments to earlier in the year seeking to secure product for the selling season, while second half sales were challenged by both this pull forward, as well as inventory destocking and a slowdown in demand related to the macroeconomic environment.
In North America, the full year operating loss was $4.9 million versus operating income of $121.9 million in 2021. The loss was primarily due to the $98.7 million non-cash goodwill impairment charge. Adjusted operating income of $121.5 million decreased from $154.6 million in 2021. The decreases to reported operating loss/income and adjusted operating income reflect lower sales volumes and reduced gross margin from higher inflation on raw materials, finished goods and transportation costs.
ACCO Brands EMEA – Fourth quarter segment net sales of $156.0 million decreased 17.0 percent versus the prior year’s segment revenue of $187.9 million. Adverse foreign exchange reduced sales by 11.7 percent. Comparable sales of $177.9 million decreased 5.3 percent versus the prior-year period. Both reported and comparable sales declines were due to lower volumes which more than offset price increases. In Europe, the current energy crisis and significant inflation have created a challenging macroeconomic environment impacting sales.
Fourth quarter operating income in EMEA was $12.7 million versus $21.6 million a year earlier, and adjusted operating income was $18.4 million compared to $24.9 million a year ago. The decreases in both reported operating income and adjusted operating income were due primarily to lower sales and reduced gross margins reflecting negative fixed cost leverage and higher costs for finished goods, raw materials and freight due to significant inflation. In the fourth quarter, EMEA’s operating margin improved on a sequential basis benefiting from pricing actions and deflation in certain product and transportation costs.
Net sales for the full year in the EMEA segment of $580.3 million decreased 12.5 percent from $662.9 million in 2021. The impact of adverse foreign exchange reduced sales $78.2 million, or 11.8 percent. Comparable sales of $658.5 million decreased $4.4 million or 0.7 percent. Both reported and comparable sales declines reflect stronger sales volumes in early 2022 driven by computer accessories and business products, offset by persistent inflation and a challenging demand environment in the second half of the year, as well as the stoppage of sales to Russia.
The EMEA segment posted full-year operating income of $21.7 million compared with operating income of $61.7 million in 2021. Adjusted operating income was $37.0 million, down from $77.2 million in 2021. The declines in both reflects the impact of lower sales volumes and reduced gross margins reflecting higher costs for finished goods, raw materials and freight due to significant inflation and negative fixed cost leverage.
ACCO Brands International – Fourth quarter segment sales of $117.7 million increased 5.7 percent versus the prior year’s segment revenue of $111.4 million. Adverse foreign exchange reduced sales by 1.8 percent. Comparable sales of $119.7 million increased 7.5 percent versus the year-ago period. Both reported and comparable sales increased primarily due to price increases, more than offsetting lower volumes. Strong sales in Brazil benefited from a return to in-person education.
Fourth quarter operating income in the International segment was $22.7 million versus $20.9 million a year earlier, and adjusted operating income was $24.3 million compared to $22.9 million a year ago. The increases in both operating income and adjusted operating income were due primarily to price increases, and the strong performance in our Brazil business.
International segment sales of $369.3 million for the full year increased 15.4 percent from $320.0 million in 2021. Adverse foreign exchange reduced sales by $11.4 million. Comparable sales were $380.7 million, up 19.0 percent, due to increased volume and higher prices, primarily in Latin America from a return of in-person education and work.
Operating income of $50.5 million increased from $31.6 million in 2021. Adjusted operating income of $58.3 million increased from $40.6 million. The increases in both operating and adjusted operating income were primarily due to higher sales volumes, pricing and improved expense leverage.
Commentary and Outlook for 1Q and Full Year 2023
“Our priority in 2023 is to improve our operating profitability and free cash flow through pricing, productivity and restructuring initiatives and more efficient use of working capital. We anticipate that these actions, along with a moderating rate of inflation, will allow us to deliver margin expansion and profit and cash flow growth in 2023. We achieved comparable sales growth in 2022 and are confident in the long term sales potential of our business. Our proven business strategy, which includes geographic diversity, and our strong portfolio of brands and innovative products have us well positioned for continued long term profitable growth,” added Elisman.
“While the current economic environment remains fluid, we have an experienced management team with a proven track record of navigating periods of economic uncertainties. We are also well-capitalized, with no near-term debt maturities and generate consistent free cash flow. We remain confident in our strategic transformation and believe we have taken the right actions to drive long-term shareholder value,” Elisman concluded.
The Company is providing full year 2023 and 1Q outlook. For the full year, we expect comparable sales to be down 3 percent to flat, reflecting a challenging near-term demand environment. Foreign exchange is expected to be neutral to reported revenue. Full year adjusted EPS is expected to rise 4 percent to 8 percent, to $1.08 to $1.12, approaching low double-digit growth in adjusted operating income, partially offset by higher interest and non-cash non-operating pension expenses. 2023 free cash flow is expected to grow to at least $100 million.
Our quarterly sales and profit projection for 2023 will reflect a different cadence than last year. In 2022, the Company experienced good sales growth in the first half of the year reflecting strong demand from the post-pandemic economic recovery. In addition, North America sales benefited from the pull forward of purchases by retailers to ensure product availability for back-to-school. Concerns about the economy, the war in Ukraine and related energy crisis in EMEA challenged demand and our sales in the second half of 2022. In addition, our retail customers proactively curtailed purchases in the back half of the year to aggressively reduce their inventory levels. Against these comparisons, we are projecting our sales to be down in both the first quarter and first half of 2023, with growth anticipated in the second half of the year.
In the first quarter, we expect comparable sales to decline 10 percent to 7 percent, primarily due to the timing of back-to-school shipments and lower sales of gaming accessories in North America, partially offset by higher sales in our International segment. First quarter adjusted EPS is expected to be $0.05 to $0.07 with higher gross margins offset by sales deleveraging, higher interest and non-cash, non-operating pension expenses.
Webcast
At 8:30 a.m. ET on February 24, 2023, ACCO Brands Corporation will host a conference call to discuss the Company’s fourth quarter and full year 2022 results. The call will be broadcast live via webcast. The webcast can be accessed through the Investor Relations section of www.accobrands.com. The webcast will be in listen-only mode and will be available for replay following the event.
About ACCO Brands Corporation
ACCO Brands, the Home of Great Brands Built by Great People, designs, manufactures and markets consumer and end-user products that help people work, learn, play and thrive. Our widely recognized brands include AT-A-GLANCE®, Five Star®, Kensington®, Leitz®, Mead®, PowerA®, Swingline®, Tilibra® and many others. More information about ACCO Brands Corporation (NYSE: ACCO) can be found at www.accobrands.com.
Non-GAAP Financial Measures
In addition to financial results reported in accordance with generally accepted accounting principles (GAAP), we have provided certain non-GAAP financial information in this earnings release to aid investors in understanding the Company’s performance. Each non-GAAP financial measure is defined and reconciled to its most closely related GAAP financial measure in the “About Non-GAAP Financial Measures” section of this earnings release.
Forward-Looking Statements
Statements contained herein, other than statements of historical fact, particularly those anticipating future financial performance, business prospects, growth, strategies, business operations and similar matters, results of operations, liquidity and financial condition, are “forward-looking statements” within the meaning of the Private Securities Litigation Reform Act of 1995. These statements are based on the beliefs and assumptions of management based on information available to us at the time such statements are made. These statements, which are generally identifiable by the use of the words “will,” “believe,” “expect,” “intend,” “anticipate,” “estimate,” “forecast,” “project,” “plan,” and similar expressions, are subject to certain risks and uncertainties, are made as of the date hereof, and we undertake no duty or obligation to update them. Because actual results may differ materially from those suggested or implied by such forward-looking statements, you should not place undue reliance on them when deciding whether to buy, sell or hold the company’s securities.
Our outlook is based on certain assumptions, which we believe to be reasonable under the circumstances. These include, without limitation, assumptions regarding the impact of the COVID-19 pandemic and the war in Ukraine; the impact of inflation and global economic uncertainties, fluctuations in foreign currency exchange rates and acquisitions; and the other factors described below.
Among the factors that could cause our actual results to differ materially from our forward-looking statements are: our ability to successfully execute our restructuring plans and realize the benefits of our productivity initiatives; our ability to obtain additional price increases and realize longer-term cost reductions; the ongoing impact of the COVID-19 pandemic; a relatively limited number of large customers account for a significant percentage of our sales; issues that influence customer and consumer discretionary spending during periods of economic uncertainty or weakness; risks associated with foreign currency exchange rate fluctuations; challenges related to the highly competitive business environment in which we operate; our ability to develop and market innovative products that meet consumer demands and to expand into new and adjacent product categories that are experiencing higher growth rates; our ability to successfully expand our business in emerging markets and the exposure to greater financial, operational, regulatory, compliance and other risks in such markets; the continued decline in the use of certain of our products; risks associated with seasonality; the sufficiency of investment returns on pension assets, risks related to actuarial assumptions, changes in government regulations and changes in the unfunded liabilities of a multi-employer pension plan; any impairment of our intangible assets; our ability to secure, protect and maintain our intellectual property rights, and our ability to license rights from major gaming console makers and video game publishers to support our gaming business; continued disruptions in the global supply chain; risks associated with inflation and other changes in the cost or availability of raw materials, transportation, labor, and other necessary supplies and services and the cost of finished goods; the continued global shortage of microchips which are needed in our gaming and computer accessories businesses; risks associated with outsourcing production of certain of our products, information technology systems and other administrative functions; the failure, inadequacy or interruption of our information technology systems or its supporting infrastructure; risks associated with a cybersecurity incident or information security breach, including that related to a disclosure of personally identifiable information; our ability to grow profitably through acquisitions; our ability to successfully integrate acquisitions and achieve the financial and other results anticipated at the time of acquisition, including planned synergies; risks associated with our indebtedness, including limitations imposed by restrictive covenants, our debt service obligations, and our ability to comply with financial ratios and tests; a change in or discontinuance of our stock repurchase program or the payment of dividends; product liability claims, recalls or regulatory actions; the impact of litigation or other legal proceedings; our failure to comply with applicable laws, rules and regulations and self-regulatory requirements, the costs of compliance and the impact of changes in such laws; our ability to attract and retain qualified personnel; the volatility of our stock price; risks associated with circumstances outside our control, including those caused by public health crises, such as the occurrence of contagious diseases like COVID-19, severe weather events, war, terrorism and other geopolitical incidents; and other risks and uncertainties described in “Part I, Item 1A. Risk Factors” in our Annual Report on Form 10-K for the year ended December 31, 2021, “Part II, Item 1A Risk Factors” in our Quarterly Report on Form 10-Q for the quarter ended September 30, 2022 and in other reports we file with the Securities and Exchange Commission.
About Non-GAAP Financial Measures
We explain below how we calculate each of our non-GAAP financial measures and a reconciliation of our current period and historical non-GAAP financial measures to the most directly comparable GAAP financial measures follows.
We use our non-GAAP financial measures both to explain our results to stockholders and the investment community and in the internal evaluation and management of our business. We believe our non-GAAP financial measures provide management and investors with a more complete understanding of our underlying operational results and trends, facilitate meaningful period-to-period comparisons and enhance an overall understanding of our past and future financial performance.
Our non-GAAP financial measures exclude certain items that may have a material impact upon our reported financial results such as restructuring charges, transaction and integration expenses associated with material acquisitions, the impact of foreign currency exchange rate fluctuations and acquisitions, unusual tax items, goodwill impairment charges, and other non-recurring items that we consider to be outside of our core operations. These measures should not be considered in isolation or as a substitute for, or superior to, the directly comparable GAAP financial measures and should be read in connection with the Company’s financial statements presented in accordance with GAAP.
Our non-GAAP financial measures include the following:
Comparable Sales : Represents net sales excluding the impact of material acquisitions with current-period foreign operation sales translated at prior-year currency rates. We believe comparable sales are useful to investors and management because they reflect underlying sales and sales trends without the effect of acquisitions and fluctuations in foreign exchange rates and facilitate meaningful period-to-period comparisons. We sometimes refer to comparable sales as comparable net sales.
Adjusted Gross Profit : Represents gross profit excluding the effect of the amortization of the step-up in inventory from material acquisitions. We believe adjusted gross profit is useful to investors and management because it reflects underlying gross profit without the effect of inventory adjustments resulting from acquisitions that we consider to be outside our core operations and facilitates meaningful period-to-period comparisons.
Adjusted Selling, General and Administrative (SG&A) Expenses : Represents selling, general and administrative expenses excluding transaction and integration expenses related to material acquisitions. We believe adjusted SG&A expenses are useful to investors and management because they reflect underlying SG&A expenses without the effect of expenses related to acquiring and integrating acquisitions that we consider to be outside our core operations and facilitate meaningful period-to-period comparisons.
Adjusted Operating Income/Adjusted Income Before Taxes/Adjusted Net Income/Adjusted Net Income Per Diluted Share :Represents operating income, income before taxes, net income, and net income per diluted share excluding restructuring and goodwill impairment charges, the amortization of intangibles, the amortization of the step-up in value of inventory, the change in fair value of contingent consideration, transaction and integration expenses associated with material acquisitions, non-recurring items in interest expense or other income/expense such as expenses associated with debt refinancing, a bond redemption, or a pension curtailment, and other non-recurring items as well as all unusual and discrete income tax adjustments, including income tax related to the foregoing. We believe these adjusted non-GAAP financial measures are useful to investors and management because they reflect our underlying operating performance before items that we consider to be outside our core operations and facilitate meaningful period-to-period comparisons. Senior management’s incentive compensation is derived, in part, using adjusted operating income and adjusted net income per diluted share, which is derived from adjusted net income. We sometimes refer to adjusted net income per diluted share as adjusted earnings per share or adjusted EPS.
Adjusted Income Tax Expense/Rate :Represents income tax expense/rate excluding the tax effect of the items that have been excluded from adjusted income before taxes, unusual income tax items such as the impact of tax audits and changes in laws, significant reserves for cash repatriation, excess tax benefits/losses, and other discrete tax items. We believe our adjusted income tax expense/rate is useful to investors because it reflects our baseline income tax expense/rate before benefits/losses and other discrete items that we consider to be outside our core operations and facilitates meaningful period-to-period comparisons.
Adjusted EBITDA: Represents net income excluding the effects of depreciation, stock-based compensation expense, amortization of intangibles, the change in fair value of contingent consideration, interest expense, net, other (income) expense, net, and income tax expense, the amortization of the step-up in value of inventory, transaction and integration expenses associated with material acquisitions, restructuring and goodwill impairment charges, non-recurring items in interest expense or other income/expense such as expenses associated with debt refinancing, a bond redemption, or a pension curtailment and other non-recurring items. We believe adjusted EBITDA is useful to investors because it reflects our underlying cash profitability and adjusts for certain non-cash charges, and items that we consider to be outside our core operations and facilitates meaningful period-to-period comparisons.
Adjusted Free Cash Flow: Represents cash flow from operating activities, excluding cash payments made for contingent earnouts, less cash used for additions to property, plant and equipment, plus cash proceeds from the disposition of assets. We believe adjusted free cash flow is useful to investors because it measures our available cash flow for paying dividends, funding strategic material acquisitions, reducing debt, and repurchasing shares.
Consolidated Leverage Ratio: Represents balance sheet debt, plus debt origination costs and less any cash and cash equivalents divided by adjusted EBITDA. We believe that consolidated leverage ratio is useful to investors since the company has the ability to, and may decide to use a portion of its cash and cash equivalents to retire debt.
We also provide forward-looking non-GAAP comparable sales, adjusted earnings per share, adjusted free cash flow, adjusted EBITDA, and adjusted tax rate, and historical and forward-looking consolidated leverage ratio. We do not provide a reconciliation of these forward-looking and historical non-GAAP measures to GAAP because the GAAP financial measure is not currently available and management cannot reliably predict all the necessary components of such non-GAAP measures without unreasonable effort or expense due to the inherent difficulty of forecasting and quantifying certain amounts that are necessary for such a reconciliation, including adjustments that could be made for restructuring, integration and acquisition-related expenses, the variability of our tax rate and the impact of foreign currency fluctuation and material acquisitions, and other charges reflected in our historical results. The probable significance of each of these items is high and, based on historical experience, could be material.
Christopher McGinnis Investor Relations (847) 796-4320
TORONTO, ON / ACCESSWIRE / February 23, 2023 / Eskay Mining Corp. (“Eskay” or the “Company”) (TSXV:ESK) (OTCQX:ESKYF) (Frankfurt:KN7)(WKN:A0YDPM) is pleased to announce further encouraging diamond drill results from its 2022 exploration program at its 100% controlled Consolidated Eskay Property in the Golden Triangle, British Columbia.
“Results from our 2022 exploration season demonstrate Eskay’s team has made considerable progress toward unraveling the district-scale potential of VMS mineralization surrounding the Eskay Creek deposit,” commented Dr. John DeDecker, VP of Exploration for Eskay Mining Corp. “Achievements of the 2022 exploration program include defining a new trend of VMS mineralization along the Scarlet-Tarn corridor parallel to and approximately seven kilometers east of the Eskay anticline. Tarn Lake and Scarlet Knob are situated along an east-west trending VMS feeder structure hosted by Eskay rhyolite like that seen in the footwall of the Eskay Creek deposit. Mapping and prospecting define a westward stratigraphic younging direction suggesting that stockwork and replacement-style mineralization at Tarn Lake may represent feeders to seafloor-hosted mineralization up-section towards the important Contact Mudstone horizon, host to high-grade mineralization at Eskay Creek. This recognition is a significant step towards meeting our goal of discovering new Eskay Creek-like high-grade VMS systems. Drilling at TV now shows that Au- and Ag-bearing massive sulfide extends 100 m along strike and overlies an even more extensive zone of stockwork mineralization. We are eager to follow up on all of these encouraging results in 2023.”
TV Extensional Drilling
Highlight results:
4.61 gpt Au and 22.17 gpt Ag (4.89 gpt Au Eq) over 6.28m within 2.84 gpt Au and 22.17 gpt Ag (3.13 gpt Au Eq) over 16.36m in hole TV22-105
2.66 gpt Au and 30.45 gpt Ag (3.05 gpt Au Eq) over 10.56m within 1.51 gpt Au and 25.39 gpt Ag (1.83 gpt Au Eq) over 43.09m in hole TV22-120
3.36 gpt Au and 109.50 gpt Ag (4.76 gpt Au Eq) over 2.00m within 1.14 gpt Au and 30.40 gpt Ag (1.53 gpt Au Eq) over 30.56m in hole TV22-97
6.88 gpt Au and 21.00 gpt Ag (7.15 gpt Au Eq) over 1.10m within 1.28 gpt Au and 87.92 gpt Ag (2.41 gpt Au Eq) over 14.95m in hole TV22-109
Drilling at TV in 2022 expanded the footprint of both the Upper Massive Sulfide Zone and Stockwork Zone at TV (Figures 1, 2 and 3). Massive sulfide mineralization now extends approximately 100 m along strike, ranges from 5 to 10 m in thickness, and is characterized by sulfide lenses hosted by intensely silicified carbonaceous mudstone associated with peperitic dacite (Figures 4 and 5). Massive and semi-massive sulfide mineralization overlies an extensive stockwork feeder zone hosted by dacitic and andesitic breccia and peperite. Stockwork mineralization now extends approximately 175 m along strike, 175 m down dip, and ranges in thickness from 50 to 100 m. Significantly, drill holes testing the up-dip extent of the stockwork zone (TV22-106, 108, and 112) intercepted strongly anomalous Au and Ag values with interspersed values over 1 gpt Au equivalent. Rock chip samples collected from the vicinity of these drill holes suggest that this up-dip zone may contain higher grade pockets of Au and Ag mineralization (Figure 2).
Significant mineralized intervals from 2022 drill holes completed in the vicinity of the TV deposit are presented in the table below. A complete list of the coordinates of drill holes including holes without significant mineralized intercepts is found at the bottom of this release.
Hole
From (m)
To (m)
Length (m)
Au (gpt)
Ag (gpt)
Au Eq (gpt)
Ag Eq (gpt)
TV22-88
133.30
135.00
1.70
1.22
1.22
1.24
96.38
TV22-97
95.44
126.00
30.56
1.14
30.40
1.53
119.68
includes
114.00
116.00
2.00
3.36
109.50
4.76
371.58
TV22-99
88.72
93.60
4.88
0.70
23.50
1.00
78.17
97.64
103.34
5.70
1.77
19.46
2.02
157.82
includes
102.55
103.34
0.79
8.85
23.00
9.14
713.30
TV22-105
86.72
103.08
16.36
2.84
22.17
3.13
243.78
includes
86.72
93.00
6.28
4.61
22.17
4.89
381.59
and
96.00
101.00
5.00
2.39
25.40
2.71
211.66
TV22-106
2.56
4.60
2.04
1.69
2.38
1.72
134.20
24.91
26.91
2.00
0.78
17.50
1.00
78.30
TV22-108
4.20
6.99
2.79
1.94
6.00
2.02
157.32
15.00
18.00
3.00
1.33
2.17
1.36
105.76
TV22-109
50.05
65.00
14.95
1.28
87.92
2.41
188.00
includes
50.05
51.15
1.10
6.88
21.00
7.15
557.64
and
57.58
63.23
5.65
1.03
173.12
3.25
253.38
TV22-110
72.27
88.95
16.68
1.44
19.62
1.69
131.55
TV22-111
51.56
58.78
7.22
0.45
92.99
1.64
127.96
includes
54.83
56.51
1.68
0.87
309.00
4.84
377.21
TV22-112
0.00
7.00
7.00
0.75
9.31
0.87
68.05
includes
4.00
5.00
1.00
3.57
8.18
3.67
286.64
TV22-120
127.79
170.88
43.09
1.51
25.39
1.83
142.83
includes
130.18
131.00
0.82
4.19
15.00
4.38
341.82
and
136.58
147.14
10.56
2.66
30.45
3.05
238.18
TV22-121
95.00
97.18
2.18
0.13
121.87
1.69
131.82
128.31
132.00
3.69
1.27
40.31
1.79
139.37
Au Eq and Ag Eq values have all been adjusted to the silver-to-gold ratio of 78:1 for this news release.
Tarn Lake
Assay results from the maiden drill program at Tarn Lake have already defined an 80m-long open-ended trend of Au mineralization that dips west-northwest (Figures. 1, 7 and 8). Rock chip sample results suggest that Au mineralization extends up-dip from the drill holes to the surface. Mineralization remains open down-dip.
Sulfide mineralization intercepted by drilling is dominantly replacement-style and stockwork-style (Figure 9), and is hosted by intensely altered Eskay rhyolite. This style of mineralization and intense hydrothermal alteration are consistent with a position in the immediate sub-seafloor environment of a VMS feeder zone. Geological mapping, drilling, and lithological facies analyses show extensive rhyolite-bearing volcaniclastic debris flow beds, peperitic rhyolite, and flow-banded rhyolite defining a rhyolite dome complex that formed at a paleoseafloor position proximal to a syn-volcanic VMS feeder structure, supporting the interpretation based on mineralization and alteration. Based on this geology, Eskay’s exploration team thinks there is considerable potential for the presence of seafloor-hosted VMS mineralization at one or more horizons at Tarn Lake, as is seen along the parallel Eskay Creek-Sib-Lulu trend to the west (Figure 10).
Eskay’s geological mapping team has determined that the stratigraphic younging direction along the Scarlet-Tarn trend is to the west, and that the contact between the Eskay rhyolite and the Willow Ridge basalt lies to the west of Tarn Lake (Figure 10). The contact between these lithologies defines the Contact mudstone horizon that hosts the world-class Au-Ag mineralization at Eskay Creek Mine. Given that recent rock chip sampling indicates Au mineralization continues west of Tarn Lake, it is possible the Tarn VMS system continues up-stratigraphy to the Contact mudstone horizon. These findings are a significant step towards our goal of finding Eskay Creek-like VMS deposits on the Consolidated Eskay Property.
In addition to the potential for Au and Ag mineralization down-dip and up-section from 2022 drilling, there is considerable potential for mineralization to extend beneath Bruce Glacier to Scarlet Knob along east-west trending feeder structures (Figure 11). These feeder structures are delineated by andesite dikes surrounded by sulfide mineralization and intense hydrothermal alteration of the host Eskay rhyolite.
Significant drill results from hole TN22-8 completed at Tarn Lake are presented in the table below.
Hole
From (m)
To (m)
Length (m)
Au (gpt)
Ag (gpt)
Au Eq (gpt)
Ag Eq (gpt)
TN22-8
90.19
92.88
2.69
0.75
29.00
1.12
87.50
117.33
123.00
5.67
1.37
3.37
1.41
110.00
133.53
139.72
6.19
1.46
2.13
1.49
116.16
158.04
161.00
2.96
1.27
4.11
1.32
102.78
Au Eq and Ag Eq values have all been adjusted to the silver-to-gold ratio of 78:1 for this news release.
2022 Exploration Program
The fundamental goal of the 2022 exploration program was to identify new precious metal-rich VMS deposits across the Consolidated Eskay Project through early-stage work including mapping and geochemical sampling, and more advanced work including widely spaced drilling. During the 2022 exploration season, Eskay Mining successfully completed 29,500m of diamond drilling along the TV-Jeff corridor and along the Scarlet Ridge-Tarn Lake trend.
Drill results discussed in this news release come from holes drilled in the vicinity of the TV deposit and the newly discovered Tarn Lake mineralizing system. As of this news release, all assays have returned from the 2022 drill program.
Au Eq and Ag Eq Calculations and True Width:
Note on use of Au eq (Au eq=Au+Ag/78) and Ag eq (Ag eq=Au*78+Ag): Mineralization at the TV and Jeff deposits displays similar characteristics and mineralogy to the Eskay Creek deposit and therefore for Au eq, and Au:Ag, a ratio of 78:1 is used and Au eq and Ag eq values are deemed to be reasonable based on assumed gold recovery (84.2%) and silver recovery (87.3%) as reported in the Eskay Creek Project NI 43-101 Technical Report and Prefeasibility Study, British Columbia, Canada, Effective Date: 22 July, 2021, Prepared for: Skeena Resources Ltd., Prepared by: Absence Engineering Canada Inc.
True widths of reported intercepts are not fully understood at this time but given the moderately dipping tabular nature of these deposits and the steep angle of drilling, Eskay geologists estimate true widths represent approximately 70-90% of the reported drill intercept lengths.
QA/QC, Methodology Statement:
Halved HQ drill core samples are submitted to ALS Geochemistry in Terrace, British Columbia for preparation and analysis. ALS is accredited to the ISO/IEC 17025 standard for gold assays. All analytical methods include quality control standards inserted at set frequencies. The entire sample interval is crushed and homogenized, 250 g of the homogenized sample is pulped. All samples were analyzed for gold, silver, mercury, and a suite of 48 major and trace elements. Analysis for gold is by fire assay fusion followed by Inductively Coupled Plasma Atomic Emission Spectroscopy (ICP-AES) on 30 g of pulp. Analysis for silver is by fire assay and gravimetric analysis on 30 g of pulp. Mercury is analyzed using the trace Hg Inductively Coupled Plasma Mass Spectroscopy (ICP-MS) method. All other major and trace elements are analyzed by four-acid digestion followed by ICP-MS.
Historical rock chip sample data is sourced from Assessment Report AR19675 by Granges dated February 7, 1990. Eskay Mining is unable to fully verify this data, and it should be treated as such by the reader.
Dr. Quinton Hennigh, P. Geo., a Director of the Company and its technical adviser, a qualified person as defined by National Instrument 43-101, has reviewed and approved the technical contents of this news release.
About Eskay Mining Corp:
Eskay Mining Corp (TSX-V:ESK) is a TSX Venture Exchange listed company, headquartered in Toronto, Ontario. Eskay is an exploration company focused on the exploration and development of precious and base metals along the Eskay rift in a highly prolific region of northwest British Columbia known as the “Golden Triangle,” 70km northwest of Stewart, BC. The Company currently holds mineral tenures in this area comprised of 177 claims (52,600 hectares).
Neither the TSX Venture Exchange nor its Regulation Services Provider (as that term is defined in the policies of the TSX Venture Exchange) accepts responsibility for the adequacy or accuracy of this release.
Forward-Looking Statements: This Press Release contains forward-looking statements that involve risks and uncertainties, which may cause actual results to differ materially from the statements made. When used in this document, the words “may”, “would”, “could”, “will”, “intend”, “plan”, “anticipate”, “believe”, “estimate”, “expect” and similar expressions are intended to identify forward-looking statements. Such statements reflect our current views with respect to future events and are subject to risks and uncertainties. Many factors could cause our actual results to differ materially from the statements made, including those factors discussed in filings made by us with the Canadian securities regulatory authorities. Should one or more of these risks and uncertainties, such as actual results of current exploration programs, the general risks associated with the mining industry, the price of gold and other metals, currency and interest rate fluctuations, increased competition and general economic and market factors, occur or should assumptions underlying the forward looking statements prove incorrect, actual results may vary materially from those described herein as intended, planned, anticipated, or expected. We do not intend and do not assume any obligation to update these forward-looking statements, except as required by law. Shareholders are cautioned not to put undue reliance on such forward-looking statements.
Firm improves financial flexibility, eliminates mandatory annual principal payments under new all-revolver facility with more favorable terms, extended maturity date
STAMFORD, Conn.–(BUSINESS WIRE)– Information Services Group (ISG) (Nasdaq: III), a leading global technology research and advisory firm, today announced it has successfully amended its $140 million credit facility at more favorable terms, to improve the firm’s financial flexibility.
The new credit agreement amends the previous agreement entered into on March 10, 2020. Key updates include:
Converting the previous term and revolving loan into an all-revolving credit facility
Eliminating $4.3 million of mandatory annual principal payments due in 2023 and 2024
Extending the maturity date of the previous agreement by three years, to February 2028
“Our amended credit facility greatly enhances our financial flexibility and offers further validation of our robust business performance that enabled these enhancements,” said Michael P. Connors, chairman and CEO of ISG. “We thank our lenders for their partnership and confidence in our ability to deliver long-term sustainable growth and value for our shareholders.”
BofA Securities Inc. was the Sole Lead Arranger and Sole Bookrunner on the transaction.
Additional details about the amended credit agreement can be found in the Form 8-K ISG filed today with the U.S. Securities and Exchange Commission, a link to which can be found on ISG’s website.
Forward-Looking Statements
This communication contains “forward-looking statements” which represent the current expectations and beliefs of management of ISG concerning future events and their potential effects. Statements contained herein including words such as “anticipate,” “believe,” “contemplate,” “plan,” “estimate,” “target,” “expect,” “intend,” “will,” “continue,” “should,” “may,” and other similar expressions, are “forward-looking statements” under the Private Securities Litigation Reform Act of 1995. These forward-looking statements are not guarantees of future results and are subject to certain risks and uncertainties that could cause actual results to differ materially from those anticipated. Those risks relate to inherent business, economic and competitive uncertainties and contingencies relating to the businesses of ISG and its subsidiaries including without limitation: (1) failure to secure new engagements or loss of important clients; (2) ability to hire and retain enough qualified employees to support operations; (3) ability to maintain or increase billing and utilization rates; (4) management of growth; (5) success of expansion internationally; (6) competition; (7) ability to move the product mix into higher margin businesses; (8) general political and social conditions such as war, political unrest and terrorism; (9) healthcare and benefit cost management; (10) ability to protect ISG and its subsidiaries’ intellectual property or data and the intellectual property or data of others; (11) currency fluctuations and exchange rate adjustments; (12) ability to successfully consummate or integrate strategic acquisitions; (13) outbreaks of diseases, including coronavirus, or similar public health threats or fear of such an event; and (14) engagements may be terminated, delayed or reduced in scope by clients. Certain of these and other applicable risks, cautionary statements and factors that could cause actual results to differ from ISG’s forward-looking statements are included in ISG’s filings with the U.S. Securities and Exchange Commission. ISG undertakes no obligation to update or revise any forward-looking statements to reflect subsequent events or circumstances.
About ISG
ISG (Information Services Group) (Nasdaq: III) is a leading global technology research and advisory firm. A trusted business partner to more than 800 clients, including 75 of the world’s top 100 enterprises, ISG is committed to helping corporations, public sector organizations, and service and technology providers achieve operational excellence and faster growth. The firm specializes in digital transformation services, including automation, cloud and data analytics; sourcing advisory; managed governance and risk services; network carrier services; strategy and operations design; change management; market intelligence and technology research and analysis. Founded in 2006, and based in Stamford, Conn., ISG employs more than 1,300 digital-ready professionals operating in more than 20 countries—a global team known for its innovative thinking, market influence, deep industry and technology expertise, and world-class research and analytical capabilities based on the industry’s most comprehensive marketplace data. For more information, visit www.isg-one.com.
Company Focuses on Development of Neuromuscular Blocking Agents
Phase II Randomized Trial for BX1000 Initiated, Positive Interim Results Announced; Completion of Study Enrollment Expected Q1 2023, Top Line Results Expected Early Q2 2023
BX2000 Dose Escalation Study Progressing
$5 Million in Financing Secured through Public Offering
MALVERN, Pa., Feb. 23, 2023 (GLOBE NEWSWIRE) — Baudax Bio, Inc. (Nasdaq:BXRX) (the “Company”), a pharmaceutical company focused on innovative products for hospital and related settings, today reported financial results for the fourth quarter and year ended December 31, 2022, updated the status of the neuromuscular blocking (NMB) agent development program, and provided an overview of other corporate and financial developments.
“During our fourth quarter we refocused our priorities on our NMB portfolio, initiating our Phase II trial for BX1000 and advancing our Phase I dose escalation trial for BX2000,” said Gerri Henwood, Baudax Bio’s President and Chief Executive Officer. “The encouraging interim data we announced from the BX1000 trial showed all patients treated to date have met the criteria for Good or Excellent intubating conditions at 60 seconds, and that BX1000 has been generally well tolerated. We believe these data speak to the potential of our NMB portfolio to improve patient management and deliver cost efficiencies in procedures where NMB is required. We expect to complete enrollment in the BX1000 trial during the first quarter of 2023, and to announce top line data early in the second quarter of 2023. Concurrently, BX2000, our ultrashort acting NMB, is continuing through its dose escalation study, which we expect to complete by the end of 2023. BX3000, our NMB reversal agent, remains on track, and we expect to complete the nonclinical and manufacturing studies needed to support an IND filing for BX3000, the NMB reversal agent in the summer of 2023. Data from these trials will provide us with insight on the profiles of the two blocking agents, which will contribute to decisions to move forward later in 2023.”
“Due to persistent economic challenges facing hospitals, as previously disclosed, we have taken the strategic decision to discontinue commercialization of ANJESO,” continued Ms. Henwood. “We continue to believe in ANJESO’s advantages over other non-opioid pain therapies, as well as its potential to overcome many of the issues associated with commonly prescribed opioid therapeutics.”
Fourth Quarter 2022 and Recent Business Highlights
NMBs
BX1000 (IV Intermediate duration of action). Results for a planned interim analysis of the Phase II trial for BX1000 were announced in January 2023. This randomized, double-blind, active-controlled clinical trial comparing three different doses of BX1000 to a standard dose of rocuronium (rocuronium bromide 0.6 mg/kg IV Bolus) is planned to enroll a total of 80 adult patients undergoing elective surgery utilizing total intravenous anesthesia currently at a single clinical site in the U.S. The primary efficacy endpoint is the proportion of patients meeting criteria for Good or Excellent intubating conditions using a standardized scale. Additionally, the trial is evaluating the safety and tolerability profile of BX1000 and rocuronium in this patient population.
BX1000 Interim Data. The pre-planned interim analysis evaluated the intubating conditions for each randomized patient after administration of study drug in a blinded fashion. In the 20-patient cohort, 5 patients per group received one of the study medications. All 20 patients were observed to have met the criteria for Good or Excellent intubating conditions at 60 seconds. Nineteen of the subjects were successfully intubated following the assessment at 60 seconds, with one remaining subject successfully intubated following the assessment at 90 seconds. Study treatments were generally well tolerated with no occurrence of severe or serious adverse events. This blinded interim analysis did not result in the decision to drop any of the four study groups nor any decision to adjust planned study enrollment numbers.
BX2000 (IV Ultra-short duration of action). Cohort enrollment is ongoing for the Phase I dose escalation study evaluating the safety, tolerability, and pharmacokinetics of BX2000 in intubated healthy volunteers. This study is comprised of likely seven or eight dosing cohorts and each cohort is planned to enroll eight patients. The first and second cohorts have been dosed and enrollment of the third cohort is underway. The Company expects to complete enrollment of the remaining cohorts in the study by the end of 2023.
BX3000 (Reversal agent). Baudax Bio expects to complete nonclinical studies and manufacturing data required to support the IND for BX3000 in the summer of 2023. Early single agent clinical trials of BX3000 will not require intubation and so would be expected to progress quickly once the IND is active, and trials are ready to initiate. The Company believes progress towards a reversal study using BX3000 in patients who have received BX1000 could begin before the end of 2023.
The Company believes the data from the ongoing clinical trials for BX1000 and BX2000 will contribute to decisions to move forward later in 2023.
ANJESO
ANJESO U.S. Commercialization Discontinued. Despite having distinct benefits as the first and only once-daily, non-opioid IV analgesic, market conditions are not favorable for the introduction and commercialization of a new pain management product in the hospital market. As a result, Baudax Bio has formally discontinued the commercialization of ANJESO and the product is currently on hold due to these business conditions.
Corporate and Financial
Closed $5 million public offering – on December 6, 2022 the Company closed a public offering of an aggregate of 1,042,787 shares of its common stock (or pre-funded warrants in lieu thereof), Series A-3 warrants to purchase up to 1,042,787 shares of common stock and Series A-4 warrants to purchase 1,042,787 shares of common stock, at a combined public offering price of $4.795 per share (or pre-funded warrant) and accompanying warrants. The Series A-3 warrants have an exercise price of $4.50 per share, are exercisable immediately upon issuance and expire five years from the date of issuance, and the Series A-4 warrants have an exercise price of $4.50 per share, are exercisable immediately and expire thirteen months from the date of issuance. The Company intends to use the net proceeds from this offering for working capital, pipeline development activities and general corporate purposes. In January 2023, 961,787 warrants were exercised providing $4.3 million in cash to the Company.
Financial Results for the Three Months Ended December 31, 2022
As of December 31, 2022, Baudax had cash and cash equivalents of $5.3 million.
Net product revenue related to sales of ANJESO in the U.S., recognized according to U.S. GAAP, for the three months ended December 31, 2022 was $0.3 million. This compares to $0.4 million for the three months ended December 31, 2021, a decrease of $0.1 million, resulting from the impact of the reduction in our field staff in 2022 and the impact of our discontinuation of commercialization in the fourth quarter of 2022. While utilizing the title model of distribution, product revenue was recognized as shipments were made to the Company’s third-party logistics provider.
Cost of sales for the three months ended December 31, 2022 was $4.8 million, compared to $0.6 million for the three months ended December 31, 2021, an increase of $4.2 million, and consisted of product costs, royalty expense and certain fixed costs associated with the manufacturing of ANJESO, including supply chain and quality costs. The increase of $4.2 million was primarily a result of an increase in the non-cash charge for inventory reserve expense of $4.4 million, partially offset by the decrease in fixed personnel related costs of $0.2 million. Certain product costs of ANJESO units recognized as revenue during the three months ended December 31, 2022 and 2021 were expensed prior to the FDA approval of ANJESO in February 2020, and therefore are not included in cost of sales during the related periods.
Research and development expense for the three months ended December 31, 2022 was $1.0 million compared to $0.5 million for the three months ended December 31, 2021, an increase of $0.5 million, which was a result of an increase in NMB clinical trial costs of $0.9 million, partially offset by a decrease in personnel costs of $0.3 million.
Selling, general and administrative expenses for the three months ended December 31, 2022 were $2.1 million, of which $0.2 million was attributable to selling expense and $1.9 million was attributable to general and administrative expense. This compares to $11.5 million for the same prior year period, of which $6.5 million was attributable to selling expense and $5.0 million was attributable to general and administrative expense. Selling expenses decreased $6.3 million, primarily as a result of a reduction in personnel costs of $4.4 million, a decrease in marketing costs of $1.6 million and a decrease in associated travel expenses of $0.3 million. The decrease of $3.1 million in general and administrative costs was primarily a result of a decrease in personnel costs of $2.2 million, a decrease in public company costs of $0.5 million and a decrease in both consulting costs and travel expenses of $0.2 million.
As a result of the discontinuation of commercialization of ANJESO, Baudax Bio evaluated the intangible asset carrying value attributed to ANJESO as of December 31, 2022 and recorded a non-cash impairment loss of $1.9 million to eliminate the carrying value of the asset. The value of its construction in progress related to the construction of an additional manufacturing suite for ANJESO was further reduced by $0.5 million.
Baudax Bio reported net loss of $9.2 million, or $(12.33) per share, including non-cash charges of $6.1 million (primarily related to the inventory reserve expense discussed above), for the three months ended December 31, 2022. Adjusted net loss* was $3.1 million for the three months ended December 31, 2022. Net income for the three months ended December 31, 2021 was $29.4 million, or $437.19 per diluted share, including a non-cash benefit of $41.3 million. Adjusted net loss* was $11.9 million for the three months ended December 31, 2021.
Financial Results for the Year Ended December 31, 2022
Net product revenue related to sales of ANJESO in the U.S., recognized according to U.S. GAAP, for the year ended December 31, 2022 was $1.3 million. This compares to $1.1 million for the year ended December 31, 2021, an increase of $0.2 million, which was attributable to increased demand at existing accounts. While utilizing the title model of distribution, product revenue was recognized as shipments were made to the Company’s third-party logistics provider.
Cost of sales for the year ended December 31, 2022 was $7.0 million, compared to $2.4 million for the year ended December 31, 2021, an increase of $4.6 million, and consisted of product costs, royalty expense and certain fixed costs associated with the manufacturing of ANJESO, including supply chain and quality costs. The increase of $4.6 million was primarily a result of the increase in the non-cash charge for inventory reserve expense of $5.2 million, partially offset by the reduction in personnel related costs of $0.4 million and the reduction in production and storage costs of $0.2 million. Certain product costs of ANJESO units recognized as revenue during the year ended December 31, 2022 and 2021 were expensed prior to the FDA approval of ANJESO in February 2020, and therefore are not included in cost of sales during the related periods.
Research and development expenses for the year ended December 31, 2022 were $3.9 million compared to $3.1 million for the year ended December 31, 2021. The increase of $0.8 million was primarily due to the increase in the NMB portfolio clinical trial costs of $1.0 million and an increase of $0.2 million related to the pediatric clinical trial costs for ANJESO. These costs were partially offset by a decrease in personnel related costs of $0.4 million.
Selling, general and administrative expenses for the year ended December 31, 2022 were $24.1 million, of which $9.4 million was attributable to selling expense and $14.7 million was attributable to general and administrative expense. This compares to $45.3 million for the same prior year period, of which $22.4 million was attributable to selling expense and $22.9 million was attributable to general and administrative expense. Selling expenses decreased $13.0 million, primarily as a result of a reduction in personnel costs of $7.9 million, a decrease in marketing costs of $4.7 million and a decrease in travel expenses of $0.4 million compared to 2021. The decrease of $8.2 million in general and administrative expenses was primarily a result of a decrease in personnel costs of $4.7 million, a decrease in public company costs of $2.3 million, a decrease in consulting costs of $0.9 million and a decrease in other costs of $0.3 million.
As a result of the discontinuation of commercialization of ANJESO, Baudax Bio evaluated the intangible asset carrying value attributed to ANJESO as of December 31, 2022 and recorded a non-cash impairment loss of $19.7 million to eliminate the carrying value of the asset. Additionally, the value of its construction in progress related to the construction of an additional manufacturing suite for ANJESO was reduced by $4.2 million.
Baudax Bio reported net loss of $58.8 million, or $(177.30) per share, including net non-cash charges of $30.9 million, for the year ended December 31, 2022. Adjusted net loss* was $27.9 million for the year ended December 31, 2022. For the year ended December 31, 2021 net loss was $19.8 million, or $(361.16) per share, including net non-cash benefit of $26.4 million. Adjusted net loss* was $46.2 million for the year ended December 31, 2021.
Non-GAAP Financial Measures
To supplement the Company’s financial results determined by U.S. generally accepted accounting principles (“GAAP”), the Company is reporting certain non-GAAP information for its business, including adjusted net loss. Adjusted net loss is net loss as determined under GAAP, excluding the changes in fair values of contingent consideration and warrant valuations, gain on extinguishment of debt, interest, depreciation, amortization, stock-based compensation, losses on impairment of construction in progress and intangible assets and the write off of inventory. The Company believes this non-GAAP financial measure is helpful in understanding its business as it is useful to investors in allowing for greater transparency of supplemental information used by management. This measure is used by investors, as well as management in assessing the Company’s performance. Non-GAAP financial measures should be considered in addition to, but not as a substitute for, reported GAAP results. Further, Non-GAAP financial measures, even if similarly titled, may not be calculated in the same manner by all companies, and therefore should not be compared. Please see the section of this press release titled “Reconciliation of GAAP to Non-GAAP Financial Measures” for a reconciliation of non-GAAP adjusted net loss to its most directly comparable GAAP measure.
About Baudax Bio
Baudax Bio is a pharmaceutical company focused on innovative products for hospital and related settings. The Company has a pipeline of innovative pharmaceutical assets including two clinical-stage, novel neuromuscular blocking (NMBs) agents, one undergoing a Phase II clinical trial and an additional unique NMB undergoing a dose escalation Phase I clinical trial, as well as a proprietary chemical reversal agent specific to these NMBs, which is currently undergoing nonclinical and manufacturing studies to prepare for an expected IND filing in the summer of 2023. For more information, please visit www.baudaxbio.com.
Forward Looking Statements
This press release contains forward-looking statements that involve risks and uncertainties. Such forward-looking statements reflect Baudax Bio’s expectations about its future performance and opportunities that involve substantial risks and uncertainties. When used herein, the words “anticipate,” “believe,” “estimate,” “may,” “upcoming,” “plan,” “target,” “goal,” “intend” and “expect” and similar expressions, as they relate to Baudax Bio or its management, are intended to identify such forward-looking statements. These forward-looking statements are based on information available to Baudax Bio as of the date of publication on this internet site and are subject to a number of risks, uncertainties, and other factors that could cause Baudax Bio’s performance to differ materially from those expressed in, or implied by, these forward-looking statements. These risks and uncertainties include, among other things, risks related to market, economic and other conditions, the ongoing economic and social consequences of the COVID-19 pandemic, Baudax Bio’s ability to advance its current product candidate pipeline through pre-clinical studies and clinical trials, Baudax Bio’s ability to raise future financing for continued development of its product candidates such as BX1000, BX2000 and BX3000, Baudax Bio’s ability to pay its debt and satisfy conditions necessary to access future tranches of debt, Baudax Bio’s ability to comply with the financial and other covenants under its credit facility, Baudax Bio’s ability to manage costs and execute on its operational and budget plans, Baudax Bio’s ability to achieve its financial goals; Baudax Bio’s ability to maintain listing on the Nasdaq Capital Market; and Baudax Bio’s ability to obtain, maintain and successfully enforce adequate patent and other intellectual property protection. These forward-looking statements should be considered together with the risks and uncertainties that may affect Baudax Bio’s business and future results included in Baudax Bio’s filings with the Securities and Exchange Commission at www.sec.gov. These forward-looking statements are based on information currently available to Baudax Bio, and Baudax Bio assumes no obligation to update any forward-looking statements except as required by applicable law.
To supplement the Company’s financial results determined by U.S. generally accepted accounting principles (“GAAP”), the Company has disclosed in the tables below the following non-GAAP information about adjusted net loss.
Adjusted net loss is net loss as determined under GAAP, excluding the changes in fair values of contingent consideration and warrant valuations, gain on extinguishment of debt, interest, depreciation, amortization, stock-based compensation, losses on impairment of construction in progress and intangible assets and the write off of inventory.
The Company believes that non-GAAP financial measures are helpful in understanding its business as it is useful to investors in allowing for greater transparency of supplemental information used by management. Adjusted net loss is used by investors, as well as management in assessing the Company’s performance. Non-GAAP financial measures should be considered in addition to, but not as a substitute for, reported GAAP results. Further, Non-GAAP financial measures, even if similarly titled, may not be calculated in the same manner by all companies, and therefore should not be compared.