Star Buds Retailer Now Enters the Fort Collins and Garden City Markets in Colorado
DENVER, Feb. 21, 2023 /CNW/ – Schwazze, (NEO: SHWZ) (OTCQX: SHWZ) (“Schwazze” or the “Company”), announced that it has signed definitive documents to acquire certain assets of Cannabis Care Wellness Centers, LLC and Green Medicals Wellness Center #5, LLC (d/b/a “Smokey’s”). The proposed transaction includes the adult use Smokey’s dispensaries located at 2515 7th Avenue in Garden City as well as 5740 S. College Ave. in Fort Collins. These two vibrant cannabis markets have limited licenses and present Schwazze with more opportunities to serve customers in northern Colorado. This acquisition continues Schwazze’s deliberate expansion in Colorado and, upon close, will bring the Company’s total number of Colorado dispensaries to 27.
The consideration for the proposed acquisition is US$7.5 million and will be paid as $3.75M cash and $3.75M stock at closing. The acquisition is expected to close in the second quarter of 2023 after Colorado Marijuana Enforcement Division and local licensing approvals.
“We are excited to bring our Star Buds operations to Garden City and Fort Collins. Bringing our operating playbook to two key cities in northern Colorado allows us to deliver our brands, product assortment and our dedicated service to customers in new neighborhoods as we continue to go deep in the state,” said Nirup Krishnamurthy, President of Schwazze.
Since April 2020, Schwazze has acquired, announced the planned acquisition of, or opened 44 cannabis dispensaries as well as seven cultivation facilities and two manufacturing assets in Colorado and New Mexico. In May 2021, Schwazze announced its BioSciences division and in August 2021 it commenced home delivery services in Colorado.
About Schwazze
Schwazze (NEO: SHWZ) (OTCQX: SHWZ) is building a premier vertically integrated regional cannabis company with assets in Colorado and New Mexico and will continue to take its operating system to other states where it can develop a differentiated regional leadership position. Schwazze is the parent company of a portfolio of leading cannabis businesses and brands spanning seed to sale. The Company is committed to unlocking the full potential of the cannabis plant to improve the human condition. Schwazze is anchored by a high-performance culture that combines customer-centric thinking and data science to test, measure, and drive decisions and outcomes. The Company’s leadership team has deep expertise in retailing, wholesaling, and building consumer brands at Fortune 500 companies as well as in the cannabis sector. Schwazze is passionate about making a difference in our communities, promoting diversity and inclusion, and doing our part to incorporate climate-conscious best practices.
Medicine Man Technologies, Inc. was Schwazze’s former operating trade name. The corporate entity continues to be named Medicine Man Technologies, Inc. Schwazze derives its name from the pruning technique of a cannabis plant to enhance plant structure and promote healthy growth.
Forward-Looking Statements
This press release contains “forward-looking statements.” Such statements may be preceded by the words “plan,” “will,” “may,” “continue,” “predicts,” or similar words. Forward-looking statements are not guarantees of future events or performance, are based on certain assumptions, and are subject to various known and unknown risks and uncertainties, many of which are beyond the Company’s control and cannot be predicted or quantified. Consequently, actual events and results may differ materially from those expressed or implied by such forward-looking statements. Such risks and uncertainties include, without limitation, risks and uncertainties associated with (i) our inability to manufacture our products and product candidates on a commercial scale on our own or in collaboration with third parties; (ii) difficulties in obtaining financing on commercially reasonable terms; (iii) changes in the size and nature of our competition; (iv) loss of one or more key executives or scientists; (v) difficulties in securing regulatory approval to market our products and product candidates; (vi) our ability to successfully execute our growth strategy in Colorado and outside the state, (vii) our ability to consummate the acquisition described in this press release or to identify and consummate future acquisitions that meet our criteria, (viii) our ability to successfully integrate acquired businesses, including the acquisition described in this press release, and realize synergies therefrom, (ix) the ongoing COVID-19 pandemic, * the timing and extent of governmental stimulus programs, and (xi) the uncertainty in the application of federal, state and local laws to our business, and any changes in such laws. More detailed information about the Company and the risk factors that may affect the realization of forward-looking statements is set forth in the Company’s filings with the Securities and Exchange Commission (SEC), including the Company’s Annual Report on Form 10-K and its Quarterly Reports on Form 10-Q. Investors and security holders are urged to read these documents free of charge on the SEC’s website at http://www.sec.gov. The Company assumes no obligation to publicly update or revise its forward-looking statements as a result of new information, future events or otherwise except as required by law.
TORONTO–(BUSINESS WIRE)– Largo Inc. (“Largo” or the “Company”) (TSX: LGO) (NASDAQ: LGO) will release its fourth quarter and annual 2022 financial results on Thursday, March 9, 2023 after the close of market trading. Additionally, the Company will host a webcast and conference call to discuss its fourth quarter and annual 2022 results and updates on Friday, March 10 at 1:00 p.m. ET.
To join the conference call without operator assistance, you may register and enter your phone number at https://bit.ly/3Yho3fJ to receive an instant automated call back.
You can also dial direct to be entered to the call by an Operator via dial-in details below.
To view press releases or any additional financial information, please visit the Investor Resources section of the Company’s website at: www.largoinc.com/English/investor-resources
About Largo
Largo has a long and successful history as one of the world’s preferred vanadium companies through the supply of its VPURETM and VPURE+TM products, which are sourced from one of the world’s highest-grade vanadium deposits at the Company’s Maracás Menchen Mine in Brazil. Aiming to enhance value creation at Largo, the Company is in the process of implementing a titanium dioxide pigment plant using feedstock sourced from its existing operations in addition to advancing its U.S.-based clean energy division with its VCHARGE vanadium batteries. Largo’s VCHARGE vanadium batteries contain a variety of innovations, enabling an efficient, safe and ESG-aligned long duration solution that is fully recyclable at the end of its 25+ year lifespan. Producing some of the world’s highest quality vanadium, Largo’s strategic business plan is based on two pillars: 1.) leading vanadium supplier with an outlined growth plan and 2.) U.S.-based energy storage business support a low carbon future.
Largo’s common shares trade on the Nasdaq Stock Market and on the Toronto Stock Exchange under the symbol “LGO”. For more information on the Company, please visit www.largoinc.com.
Infectimune™ (R-DOTAP) nanoparticles significantly enhance cytokine-inducing, CD4 T cell responses compared to leading commercial adjuvants being used in approved vaccines
FLORHAM PARK, N.J., Feb. 16, 2023 (GLOBE NEWSWIRE) — PDS Biotechnology Corporation (Nasdaq: PDSB), a clinical-stage immunotherapy company developing a growing pipeline of targeted immunotherapies for cancer and infectious disease, announced that new research performed in the laboratory of preeminent CD4 T cell researcher, Andrea Sant, PhD at the University of Rochester Center for Vaccine Biology and Immunology, was published in the peer-reviewed journal, Viruses. The preclinical research studied Infectimune™, PDS Biotech’s novel investigational infectious disease immune activating platform, and demonstrated the technology’s potency in eliciting CD4 T cells. The studies focused on comparing Infectimune™ induced immune responses following primary vaccination against influenza with immune responses induced by leading vaccine adjuvants. This publication follows a recent article in Viruses highlighting the ability of Infectimune™ to generate a broad immune response against viruses, including SARS-CoV-2 and multiple strains of influenza.
The paper, titled, “R-DOTAP cationic lipid nanoparticles outperform squalene-based adjuvant systems in elicitation of CD4 T cells after recombinant influenza hemagglutinin vaccination,” reported findings from a preclinical study investigating the ability of Infectimune™ (R-DOTAP) to promote CD4 T cell responses to vaccination with recombinant influenza protein. Infectimune™ was compared to AddaVax™, which is analogous to commercial adjuvant MF59®, and AddaVax™ combined with CpG, a commercial adjuvant, using HA-B as the influenza vaccine antigen. Results from the study concluded that Infectimune™ dramatically enhanced CD4 T cell responses to recombinant HA-B proteins relative to AddaVax™ and AddaVax™ plus CpG. Further, the Infectimune™ elicited CD4 T cells displayed abundant Interferon (IFN)-gamma and Interleukin (IL)-2 production that are critical for protective immunity. CD4 T cells are documented to present multiple functions including CD8 T cell expansion and antibody responses as well as direct anti-viral effects and potentiation of antigen presenting function to enhance protection against viral infection.
“Influenza remains challenging due to low immune responses, especially in the elderly. Thus, there is a significant opportunity to develop a flu vaccine that induces broadly protective responses to influenza,” stated Dr. Gregory Conn, Chief Scientific Officer of PDS Biotech.
Dr. Sant, the senior author on the paper stated, “These results showing the potency of R-DOTAP to promote epitope-specific, cytokine-inducing CD4 T cells against a recombinant influenza antigen are exceptionally promising.”
The preclinical research published in Viruses demonstrates the ability of Infectimune™ to significantly boost CD4 T cell activity, suggesting that Infectimune™ based vaccines could provide durable protection against seasonal flu and potentially emerging pandemic flu.
The research was supported by grants from the NIAID Collaborative Influenza Vaccine Innovation Centers (CIVICs) program and funded in part by the National Institute of Allergy and Infectious Diseases.
About Infectimune™
Infectimune™ is a novel investigational immune activating platform that generates broad and robust antibody and T cell responses that provide durable protection against infectious disease. Infectimune™ based vaccines are given by intramuscular injection and generate robust and durable protection against infectious agents in preclinical studies. Infectimune™ based vaccines have demonstrated safety in preclinical studies and appear to provide more robust and longer-lasting protection against infectious disease.
About PDS Biotechnology
PDS Biotech is a clinical-stage immunotherapy company developing a growing pipeline of targeted cancer and infectious disease immunotherapies based on our proprietary Versamune®, PDS0301, and Infectimune™ T cell-activating platforms. We believe our targeted Versamune® and PDS0301 based candidates have the potential to overcome the limitations of current immunotherapy approaches through the activation of the right type, quantity and potency of T cells. To date, our lead Versamune® clinical candidate, PDS0101, has demonstrated the ability to reduce tumors and stabilize disease in combination with approved and investigational therapeutics in patients with a broad range of HPV16-associated cancers in multiple Phase 2 clinical trials. Our Infectimune™ based vaccines have also demonstrated the potential to induce not only robust and durable neutralizing antibody responses, but also powerful T cell responses, including long-lasting memory T cell responses in pre-clinical studies to date. To learn more, please visit www.pdsbiotech.com or follow us on Twitter at @PDSBiotech.
Forward Looking Statements
This communication contains forward-looking statements (including within the meaning of Section 21E of the United States Securities Exchange Act of 1934, as amended, and Section 27A of the United States Securities Act of 1933, as amended) concerning PDS Biotechnology Corporation (the “Company”) and other matters. These statements may discuss goals, intentions and expectations as to future plans, trends, events, results of operations or financial condition, or otherwise, based on current beliefs of the Company’s management, as well as assumptions made by, and information currently available to, management. Forward-looking statements generally include statements that are predictive in nature and depend upon or refer to future events or conditions, and include words such as “may,” “will,” “should,” “would,” “expect,” “anticipate,” “plan,” “likely,” “believe,” “estimate,” “project,” “intend,” “forecast,” “guidance”, “outlook” and other similar expressions among others. Forward-looking statements are based on current beliefs and assumptions that are subject to risks and uncertainties and are not guarantees of future performance. Actual results could differ materially from those contained in any forward-looking statement as a result of various factors, including, without limitation: the Company’s ability to protect its intellectual property rights; the Company’s anticipated capital requirements, including the Company’s anticipated cash runway and the Company’s current expectations regarding its plans for future equity financings; the Company’s dependence on additional financing to fund its operations and complete the development and commercialization of its product candidates, and the risks that raising such additional capital may restrict the Company’s operations or require the Company to relinquish rights to the Company’s technologies or product candidates; the Company’s limited operating history in the Company’s current line of business, which makes it difficult to evaluate the Company’s prospects, the Company’s business plan or the likelihood of the Company’s successful implementation of such business plan; the timing for the Company or its partners to initiate the planned clinical trials for PDS0101, PDS0203 and other Versamune® and Infectimune™ based product candidates; the future success of such trials; the successful implementation of the Company’s research and development programs and collaborations, including any collaboration studies concerning PDS0101, PDS0203 and other Versamune® and Infectimune™ based product candidates and the Company’s interpretation of the results and findings of such programs and collaborations and whether such results are sufficient to support the future success of the Company’s product candidates; the success, timing and cost of the Company’s ongoing clinical trials and anticipated clinical trials for the Company’s current product candidates, including statements regarding the timing of initiation, pace of enrollment and completion of the trials (including the Company’s ability to fully fund its disclosed clinical trials, which assumes no material changes to our currently projected expenses), futility analyses, presentations at conferences and data reported in an abstract, and receipt of interim or preliminary results (including, without limitation, any preclinical results or data), which are not necessarily indicative of the final results of the Company’s ongoing clinical trials; any Company statements about its understanding of product candidates mechanisms of action and interpretation of preclinical and early clinical results from its clinical development programs and any collaboration studies; the success of the Company’s license agreements, including the potential for the clinical and nonclinical data available under the Company’s exclusive license agreement with Merck KGaA to aid in the development of the Versamune® platform; and other factors, including legislative, regulatory, political and economic developments not within the Company’s control, including unforeseen circumstances or other disruptions to normal business operations arising from or related to COVID-19. The foregoing review of important factors that could cause actual events to differ from expectations should not be construed as exhaustive and should be read in conjunction with statements that are included herein and elsewhere, including the risk factors included in the Company’s annual and periodic reports filed with the SEC. The forward-looking statements are made only as of the date of this press release and, except as required by applicable law, the Company undertakes no obligation to revise or update any forward-looking statement, or to make any other forward-looking statements, whether as a result of new information, future events or otherwise.
Versamune® is a registered trademark and Infectimune™ is a trademark of PDS Biotechnology. AddaVax™ is a trademark of InvivoGen. MF59® is a registered trademark of Novartis AG.
Co-Hosted by the Biotechnology Innovation Organization (BIO) and Solve M.E., an Advocacy Group for Chronic Fatigue Syndrome/Myalgic Encephalomyelitis (CFS/ME)
CHATHAM, N.J., Feb. 16, 2023 (GLOBE NEWSWIRE) — Tonix Pharmaceuticals Holding Corp. (Nasdaq: TNXP) (Tonix or the Company), a clinical-stage biopharmaceutical company, today announced that Seth Lederman, M.D., President and Chief Executive Officer of Tonix Pharmaceuticals, will present at a virtual event co-hosted by BIO and Solve M.E. titled, “Long COVID: What Will it Take to Accelerate Therapeutic Progress?”, which is being held February 21, 2023 from 1:00 – 4:30 p.m. ET. Dr. Lederman will present during the session “Clinical Studies and Emerging Therapeutic Approaches”, which begins at approximately 3:10 p.m. ET.
According to Solve M.E., the session will cover emerging research in Long COVID, as well as the existing body of data in other post-infection diseases like CFS/ME. The session will feature perspectives from a host of participants, including government, academic, and industry researchers, patient groups, funding sources, and policymakers.
Registration is open to the general public and is required in advance through the BIO website found here. The presentation will be available after the event, under the Presentations tab of the Tonix website at www.tonixpharma.com.
About Solve M.E.
Solve M.E. is a non-profit organization that serves as a catalyst for critical research into diagnostics, treatments, and cures for CFS/ME, Long COVID and other post-infection conditions.
About BIO
BIO is the world’s largest advocacy association representing member companies, state biotechnology groups, academic and research institutions, and related organizations across the United States and in 30+ countries.
About Long COVID or Post-Acute Sequelae of SARS-CoV-2 (PASC)
Although most people recover from COVID-19 within weeks of the acute illness, a substantial portion develop a chronic syndrome called Long COVID. These individuals experience a constellation of symptoms long past the time of recovery from acute COVID-19. Most Long COVID patients who have been studied appear to have cleared the SARS-CoV-2 virus from their systems. The symptoms of Long COVID can include fatigue, sleep disorders, pain, fevers, shortness of breath, cognitive impairment described as “brain fog” or memory disturbance, gastrointestinal symptoms, anxiety, and depression. Long COVID can persist for months and can range in severity from mild to incapacitating. Several cohort studies have reported that persistence of symptoms following SARS-CoV-2 infection occurs in more than 30% of patients.1 While typically associated with moderate or severe COVID-19, Long COVID can occur after mild COVID-19 or even after asymptomatic SARS-CoV-2 infection. Patients with Long COVID are sometimes referred to as “long-haulers”. Long COVID is a chronic disabling condition that is expected to result in a significant global health and economic burden.2 In response to the urgent need for therapies that address Long COVID, Congress awarded $1.15 billion to the National Institutes of Health to study Long COVID last December.3 While the vaccines available in the U.S. under Emergency Use Authorization have been shown to prevent acute COVID, their ability to prevent Long COVID is unknown. There is currently no approved drug for the treatment of Long COVID.
Tonix Pharmaceuticals Holding Corp.*
Tonix is a clinical-stage biopharmaceutical company focused on discovering, licensing, acquiring and developing therapeutics to treat and prevent human disease and alleviate suffering. Tonix’s portfolio is composed of central nervous system (CNS), rare disease, immunology and infectious disease product candidates. Tonix’s CNS portfolio includes both small molecules and biologics to treat pain, neurologic, psychiatric and addiction conditions. Tonix’s lead CNS candidate, TNX-102 SL (cyclobenzaprine HCl sublingual tablet), is in mid-Phase 3 development for the management of fibromyalgia with a new Phase 3 study launched in the second quarter of 2022 and interim data expected in the second quarter of 2023. TNX-102 SL is also being developed to treat Long COVID, a chronic post-acute COVID-19 condition. Tonix initiated a Phase 2 study in Long COVID in the third quarter of 2022. TNX-1300 (cocaine esterase) is a biologic designed to treat cocaine intoxication and has been granted Breakthrough Therapy designation by the FDA. A Phase 2 study of TNX-1300 is expected to be initiated in the second quarter of 2023. TNX-1900 (intranasal potentiated oxytocin), a small molecule in development for chronic migraine, is being studied in a potential pivotal Phase 2 study that initiated enrollment in the first quarter of 2023 and for which interim data is expected in the fourth quarter of 2023. TNX-601 ER (tianeptine hemioxalate extended-release tablets) is a once-daily formulation of tianeptine being developed as a potential treatment for major depressive disorder (MDD) with a Phase 2 study expected to be initiated in the first quarter of 2023. Tonix’s rare disease portfolio includes TNX-2900 (intranasal potentiated oxytocin) for the treatment of Prader-Willi syndrome. TNX-2900 has been granted Orphan Drug designation by the FDA. Tonix’s immunology portfolio includes biologics to address organ transplant rejection, autoimmunity and cancer, including TNX-1500, which is a humanized monoclonal antibody targeting CD40-ligand (CD40L or CD154) being developed for the prevention of allograft and xenograft rejection and for the treatment of autoimmune diseases. A Phase 1 study of TNX-1500 is expected to be initiated in the second quarter of 2023. Tonix’s infectious disease pipeline includes a vaccine in development to prevent smallpox and monkeypox, TNX-801; a next-generation vaccine to prevent COVID-19, TNX-1850; a platform to make fully human monoclonal antibodies to treat COVID-19, TNX-3600; and humanized anti-SARS-CoV-2 monoclonal antibodies, TNX-3800; and a class of broad-spectrum small molecule oral antivirals, TNX-3900. TNX-801, Tonix’s vaccine in development to prevent smallpox and monkeypox, also serves as the live virus vaccine platform or recombinant pox vaccine (RPV) platform for other infectious diseases. A Phase 1 study of TNX-801 is expected to be initiated in the second half of 2023.
*All of Tonix’s product candidates are investigational new drugs or biologics and have not been approved for any indication.
1Nalbandian, Ani, et al. “Post-acute COVID-19 syndrome.” Nature Medicine (2021): 1-15.
2Briggs, Andrew, and Anna Vassall. “Count the cost of disability caused by COVID-19.” (2021): 502-505.
3The NIH provision of Title III Health and Human Services, Division M–Coronavirus Response and Relief Supplemental Appropriations Act, 2021, of H.R. 133, The Consolidated Appropriations Act of 2021. The bill was enacted into law on 27 December 2020, becoming Public Law 116-260.
This press release and further information about Tonix can be found at www.tonixpharma.com.
Forward Looking Statements
Certain statements in this press release are forward-looking within the meaning of the Private Securities Litigation Reform Act of 1995. These statements may be identified by the use of forward-looking words such as “anticipate,” “believe,” “forecast,” “estimate,” “expect,” and “intend,” among others. These forward-looking statements are based on Tonix’s current expectations and actual results could differ materially. There are a number of factors that could cause actual events to differ materially from those indicated by such forward-looking statements. These factors include, but are not limited to, risks related to the failure to obtain FDA clearances or approvals and noncompliance with FDA regulations; delays and uncertainties caused by the global COVID-19 pandemic; risks related to the timing and progress of clinical development of our product candidates; our need for additional financing; uncertainties of patent protection and litigation; uncertainties of government or third party payor reimbursement; limited research and development efforts and dependence upon third parties; and substantial competition. As with any pharmaceutical under development, there are significant risks in the development, regulatory approval and commercialization of new products. Tonix does not undertake an obligation to update or revise any forward-looking statement. Investors should read the risk factors set forth in the Annual Report on Form 10-K for the year ended December 31, 2021, as filed with the Securities and Exchange Commission (the “SEC”) on March 14, 2022, and periodic reports filed with the SEC on or after the date thereof. All of Tonix’s forward-looking statements are expressly qualified by all such risk factors and other cautionary statements. The information set forth herein speaks only as of the date thereof.
TORONTO–(BUSINESS WIRE)– Largo Inc. (“Largo” or the “Company”) (TSX: LGO) (NASDAQ: LGO) announces a change in leadership in which Paulo Misk, President and Chief Executive Officer has left the organization with immediate effect.
The Company’s Board of Directors (“the Board”) has appointed Mr. Daniel Tellechea as interim Chief Executive Officer to assist the Company through this period of transition. Mr. Tellechea has served on the Company’s Board of Directors since 2015 and currently serves as the Chair of the Company’s Operations Committee.
A search for a permanent Chief Executive Officer has begun and the Company has not amended its goals or objectives planned for the ensuing year, including its previously announced 2023 guidance.
J. Alberto Arias Chairman of the Board of Directors stated, “Daniel has extensive experience in the metals and mining sector with some of the most successful metal companies in the Americas. His skill set will be invaluable during this period of management transition and his priority will be on the efficiency of the Company’s vanadium operations in Brazil. The Company continues with its goal of adding shareholder value through its two-pillar strategy as a tier one vanadium supplier with an emerging U.S.-based energy storage business with manufacturing facilities in Massachusetts.”
Mr. Tellechea has extensive experience in international mining, most recently serving as President & CEO of Sierra Metals, Inc. from 2007 to 2014, a Toronto based mining company listed on both the Toronto Stock Exchange with assets in Mexico and Peru. Prior to Sierra Metals, Mr. Tellechea was President and CEO of Asarco LLC from 2003 to 2005, and also served as the Managing Director of Finance and Administration for Asarco’s parent, Grupo Mexico from 1994 to 2003. Mr. Tellechea also served as Asarco’s Chief Financial Officer and Vice President of Finance for Southern Copper Corporation, which was majority owned by Grupo Mexico. Mr. Tellechea earned a Bachelor of Science in Accounting and a Master’s Degree in Business Administration from Tecnologico de Monterrey.
About Largo
Largo has a long and successful history as one of the world’s preferred vanadium companies through the supply of its VPURE™ and VPURE+™ products, which are sourced from one of the world’s highest-grade vanadium deposits at the Company’s Maracás Menchen Mine in Brazil. Aiming to enhance value creation at Largo, the Company is in the process of implementing a titanium dioxide pigment plant using feedstock sourced from its existing operations in addition to advancing its U.S.-based clean energy division with its VCHARGE vanadium batteries. Largo’s VCHARGE vanadium batteries contain a variety of innovations, enabling an efficient, safe and ESG-aligned long duration solution that is fully recyclable at the end of its 25+ year lifespan. Producing some of the world’s highest quality vanadium, Largo’s strategic business plan is based on two pillars: 1.) leading vanadium supplier with an outlined growth plan and 2.) U.S.-based energy storage business support a low carbon future.
Largo’s common shares trade on the Nasdaq Stock Market and on the Toronto Stock Exchange under the symbol “LGO”. For more information on the Company, please visit www.largoinc.com.
TORONTO–(BUSINESS WIRE)– Sierra Metals Inc. (TSX: SMT) (“Sierra Metals” or “the Company”) announces the filing at the BVL by its subsidiary, Sociedad Minera Corona S.A. (“Corona”) of its unaudited Financial Statements and the Management’s Discussion and Analysis (“MD&A”) for the fourth quarter and full-year 2022.
The Company holds an 81.8% interest in Corona. The unaudited Financial Statements and MD&A can be viewed at:
To search for the Company’s financial statements, enter the following parameters in the empty fields:
Empresa: Sociedad Minera Corona S.A. Periodo: 2022 and Trimestre IV
Sierra Metals will release its Q4 and full-year 2022 consolidated financial statements on Monday, March 13th, 2023, with an investor conference call on Tuesday, March 14th, 2023.
About Sierra Metals
Sierra Metals Inc. is a diversified Canadian mining company with Green Metal exposure including copper production and base metal production with precious metals byproduct credits, focused on the production and development of its Yauricocha Mine in Peru, and Bolivar and Cusi Mines in Mexico. The Company is focused on increasing production volume and growing mineral resources. The Company has large land packages at all three mines with several prospective regional targets providing longer-term exploration upside and mineral resource growth potential.
The Company’s Common Shares trade on the Toronto Stock Exchange under the symbol “SMT”.
For further information regarding Sierra Metals, please visit www.sierrametals.com or contact:
DENVER, Feb. 16, 2023 /CNW/ – Medicine Man Technologies operating as Schwazze, (OTCQX: SHWZ) (NEO: SHWZ) (“Schwazze” or the “Company”), announces a key addition to its executive leadership team as it pursues expansion of its footprint in Colorado and New Mexico.
Christine Jones joins the Company as Chief Legal Officer. Jones replaces Dan Pabon who in late 2022 moved into a newly created role at Schwazze as Chief Policy and Regulatory Affairs Officer.
Jones joins Schwazze with more than 25 years of experience as corporate counsel to several prominent companies and an extensive background in providing tactical and strategic advice to executive management and Boards of Directors. In her most recent role, she served as the Senior Vice President, Legal and Corporate Secretary of Long Play, Inc. and its affiliates. Long Play is a vertically integrated cannabis company with cultivation, manufacturing, retail, and a portfolio of brands that includes Willie Nelson and the Grateful Dead.
In Jones’ position with Long Play, she managed all of the company’s legal affairs, including regulatory compliance, securities, licensing, litigation, employment, mergers and acquisitions, real estate, risk management, and intellectual property. Prior to joining Long Play, Jones delivered general counsel services to domestic and global companies of varying sizes. In addition, she also served as General Counsel of Jeppesen, which provides aeronautical navigational information, operations planning tools, flight planning products and software. Jones also served as Vice President and Assistant General Counsel to TTech Holding and Vice President and Assistant General Counsel of Archstone-Smith, where she managed both company’s litigation and employment.
Jones received a BA from the University of Virginia and a JD from Washington College of Law at American University.
“We are excited to add a skilled cannabis legal professional to our Executive Leadership team as the Company positions itself for growth in both Colorado and New Mexico. Christine Jones’ expertise in corporate governance, contract management, and mergers and acquisitions will benefit Schwazze immensely as we pursue our regional growth model,” said Nirup Krishnamurthy, President of Schwazze.
Since April 2020, Schwazze has acquired, opened or announced the planned acquisition of 43 cannabis retail dispensaries (Star Buds, Emerald Fields and R,Greenleaf) as well as five cultivation facilities and two manufacturing plants in Colorado and New Mexico. In May 2021, Schwazze announced its Biosciences division, and in August 2021 it commenced home delivery services in Colorado.
About Schwazze
Schwazze (OTCQX: SHWZ; NEO: SHWZ) is building a premier vertically integrated regional cannabis company with assets in Colorado and New Mexico and will continue to take its operating system to other states where it can develop a differentiated regional leadership position. Schwazze is the parent company of a portfolio of leading cannabis businesses and brands spanning seed to sale. The Company is committed to unlocking the full potential of the cannabis plant to improve the human condition. Schwazze is anchored by a high-performance culture that combines customer-centric thinking and data science to test, measure, and drive decisions and outcomes. The Company’s leadership team has deep expertise in retailing, wholesaling, and building consumer brands at Fortune 500 companies as well as in the cannabis sector. Schwazze is passionate about making a difference in our communities, promoting diversity and inclusion, and doing our part to incorporate climate-conscious best practices.
Medicine Man Technologies, Inc. was Schwazze’s former operating trade name. The corporate entity continues to be named Medicine Man Technologies, Inc. Schwazze derives its name from the pruning technique of a cannabis plant to enhance plant structure and promote healthy growth. To learn more about Schwazze, visit www.Schwazze.com.
Forward-Looking Statements
This press release contains “forward-looking statements.” Such statements may be preceded by the words “plan,” “will,” “may,” “continue,” “predicts,” or similar words. Forward-looking statements are not guarantees of future events or performance, are based on certain assumptions, and are subject to various known and unknown risks and uncertainties, many of which are beyond the Company’s control and cannot be predicted or quantified. Consequently, actual events and results may differ materially from those expressed or implied by such forward-looking statements. Such risks and uncertainties include, without limitation, risks and uncertainties associated with (i) our inability to manufacture our products and product candidates on a commercial scale on our own or in collaboration with third parties; (ii) difficulties in obtaining financing on commercially reasonable terms; (iii) changes in the size and nature of our competition; (iv) loss of one or more key executives or scientists; (v) difficulties in securing regulatory approval to market our products and product candidates; (vi) our ability to successfully execute our growth strategy in Colorado and outside the state, (vii) our ability to consummate the acquisition described in this press release or to identify and consummate future acquisitions that meet our criteria, (viii) our ability to successfully integrate acquired businesses, including the acquisition described in this press release, and realize synergies therefrom, (ix) the ongoing COVID-19 pandemic, * the timing and extent of governmental stimulus programs, and (xi) the uncertainty in the application of federal, state and local laws to our business, and any changes in such laws. More detailed information about the Company and the risk factors that may affect the realization of forward-looking statements is set forth in the Company’s filings with the Securities and Exchange Commission (SEC), including the Company’s Annual Report on Form 10-K and its Quarterly Reports on Form 10-Q. Investors and security holders are urged to read these documents free of charge on the SEC’s website at http://www.sec.gov. The Company assumes no obligation to publicly update or revise its forward-looking statements as a result of new information, future events or otherwise except as required by law.
MALVERN, Pa., Feb. 15, 2023 (GLOBE NEWSWIRE) — Ocugen, Inc. (Ocugen or the Company) (NASDAQ: OCGN), a biotechnology company focused on discovering, developing, and commercializing novel gene and cell therapies and vaccines, today announced that it will host a conference call and live webcast to discuss the Company’s fourth quarter and full year 2022 financial results and provide a business update at 8:30 a.m. ET on Tuesday, February 28, 2023.
Ocugen will issue a pre-market earnings announcement on the same day. Attendees are invited to participate on the call using the following details:
Dial-in Numbers: (800) 715-9871 for U.S. callers and (646) 307-1963 for international callers Conference ID: 8912239 Webcast: Available on the events section of the Ocugen investor site
A replay of the call and archived webcast will be available for approximately 45 days following the event on the Ocugen investor site.
About Ocugen, Inc. Ocugen, Inc. is a biotechnology company focused on discovering, developing, and commercializing novel gene and cell therapies and vaccines that improve health and offer hope for patients across the globe. We are making an impact on patient’s lives through courageous innovation—forging new scientific paths that harness our unique intellectual and human capital. Our breakthrough modifier gene therapy platform has the potential to treat multiple retinal diseases with a single product, and we are advancing research in infectious diseases to support public health and orthopedic diseases to address unmet medical needs. Discover more at www.ocugen.com and follow us on Twitter and LinkedIn.
Cautionary Note on Forward-Looking Statements This press release contains forward-looking statements within the meaning of The Private Securities Litigation Reform Act of 1995, which are subject to risks and uncertainties. We may, in some cases, use terms such as “predicts,” “believes,” “potential,” “proposed,” “continue,” “estimates,” “anticipates,” “expects,” “plans,” “intends,” “may,” “could,” “might,” “will,” “should,” or other words that convey uncertainty of future events or outcomes to identify these forward-looking statements. Such statements are subject to numerous important factors, risks, and uncertainties that may cause actual events or results to differ materially from our current expectations. These and other risks and uncertainties are more fully described in our periodic filings with the Securities and Exchange Commission (SEC), including the risk factors described in the section entitled “Risk Factors” in the quarterly and annual reports that we file with the SEC. Any forward-looking statements that we make in this press release speak only as of the date of this press release. Except as required by law, we assume no obligation to update forward-looking statements contained in this press release whether as a result of new information, future events, or otherwise, after the date of this press release.
MCLEAN, Va., Feb. 15, 2023 /PRNewswire/ — V2X, Inc., (NYSE: VVX), a leading provider of critical mission solutions and support to defense clients globally, will report 2022 fourth quarter and full year financial results on Thursday, March 2, 2023, after market close. Senior management will conduct a conference call at 4:30 p.m. ET that same day.
U.S.-based participants may dial in to the conference call at 877-506-6380, while international participants may dial 412-542-4198. A live webcast of the conference call as well as an accompanying slide presentation will be available on the V2X Investor Relations website at http://investors.vectrus.com.
A replay of the conference call will be posted on the V2X website shortly after completion of the call and will be available for one year. A telephonic replay will also be available through March 16, 2023, at 844-512-2921 (domestic) or 412-317-6671 (international) with passcode 10174938.
ABOUT V2X V2X is a leading provider of critical mission solutions and support to defense clients globally, formed by the 2022 merger of Vectrus and Vertex to build on more than 120 combined years of successful mission support. The Company delivers a comprehensive suite of integrated solutions across the operations and logistics, aerospace, training and technology markets to national security, defense, civilian and international clients. Our global team of approximately 14,000 employees brings innovation to every point in the mission lifecycle, from preparation, to operations, to sustainment, as they tackle the most complex challenges with agility, grit and dedication.
DALLAS, Feb. 15, 2023 (GLOBE NEWSWIRE) — Permex Petroleum Corporation (CSE: OIL) (OTCQB: OILCF) (FSE: 75P) (“Permex” or the “Company”), an independent energy company engaged in the acquisition, exploration, development, and production of oil and natural gas properties on private, state and federal land in the United States, today issued a letter to shareholders from its President & CEO, Mehran Ehsan.
Dear Fellow Shareholders:
Building upon the strong foundation laid in prior years, our team continued to advance our evolving position in the North American oil and gas market during 2022, executing our strategy to add sustainable marginal production through low risk, low cost recompletions while preparing for drilling programs for continued growth.
Within our current portfolio of 78 oil and gas wells, our near-term focus remains on recompletions and stimulations of approximately 30 wells that we believe have the potential in coming online at an average of 5 to 10 barrels of oil equivalent per day (BOEPD). Across our properties in west Texas and southeast New Mexico, we successfully recompleted seven wells in 2022 that have collectively stabilized at a rate of 71 BOEPD.
In January 2022, we began the pilot re-entry on the West Henshaw well #15-3 in New Mexico. The recompletion was successful, came online at an initial rate of 30 barrels of oil per day (BOPD), and has stabilized at 15 BOPD. We believe production rates from this mature, long-life well will continue with less than 10% decline year over year.
We also successfully recompleted the West Henshaw well #6-10 in the first half of 2022 with production coming online at an initial rate of 15 BOPD and stabilizing at 10 BOPD, a rate which we also believe can continue with less than 10% decline year over year.
The Railroad Commission of Texas approved our permit application for drilling on our flagship property in Martin County, Texas, in August 2022, reviewing and approving our request for well development.
Also in 2022, we continued our re-entry and stimulation program on our Henshaw Premier Unit and Oxy Yates properties situated in Eddy County, New Mexico. The re-entry and stimulations involved targeting the Grayburg formation in the Henshaw well numbers 107, 2L, 3B, while targeting the Yates formation in Oxy yates 14-3 well. We also recompleted the Mabee Breedlove Clearfork Unit #12 on our Breedlove field within the Clearfork formation located in Martin County. The recompletions were successful, came online at a combined initial production rate of 50 BOPD, and have stabilized at a rate of 35 BOPD. In addition to the re-entry and stimulation of the wells, we have begun an extensive enhanced oil recovery study on the Clearfork formation for our Martin County asset. This includes a review of all injection wells, downhole pressure, and communication between injectors and receiving wells.
In August, we commenced drilling our Martin County flagship property – the 7,780 gross acre Breedlove oilfield in September 2022 with two initial wells permitted. In November, we announced the successful completion of the first phase of drilling on our Eoff PPC#3 well which is the formation test on a vertical basis. We achieved a target depth of 8,100 ft (2468 meters) with the casing run to total depth. It is worth noting that the hole is pre cased with 8 5/8 casing which prepares the wellbore for lateral drilling and converting it to a horizontal well. The electric wireline logging sequence of the wellbore was also completed, and we believe the results to be positive and favorable as all indications from the drilling show multiple zones which allows us to proceed with the next steps of perforation, conversion, and completion.
We believe that there is significant value to be created by drilling the identified undeveloped opportunities on our properties in conjunction with the stimulation and rework of our shut-in wells. While our near-term plans are focused on drilling wells on our existing 11,700 acres to develop the potential contained therein, our long-term plans also include continuing to evaluate acquisition and leasing opportunities that can earn attractive rates of return on capital employed.
Looking at our financial position, we closed a $7.5 million brokered private placement in the first half of 2022 enabled us to considerably strengthen our balance sheet and ending us to end the fiscal year with $3.3 million in cash and cash equivalents, up more than tenfold year-over-year.
Turning to the broader markets, oil prices began rallying off their lows at year end, after declining for much of the second half of 2022, in part due to OPEC+ production cuts that began in November. Importantly, OPEC+ pledged to continue to support the market at a recent meeting in early February, with producers reconfirming their commitment to cut production by 2 million barrels per day (BPD) through the remainder of 2023. While fears of global recession remain a drag on prices, a potential rebound in Chinese demand could further support an upward trajectory on prices moving forward.
Finally, we further strengthened our team in 2022 with great additions to both our management and board. On the management side, we welcomed Greg Montgomery as our new Chief Financial Officer in May. Greg has served on our board since 2020 and provided our leadership team with invaluable guidance. In addition to his existing knowledge of Permex’s operations, he has vast experience in the oil and gas industry, including prior CFO and management roles with public companies. This makes Greg uniquely qualified to lead our financial strategy. In October, we also welcomed Melissa Folz P.E. as the newest member of our board. Melissa brings an extensive background from the oil and gas industry, and I believe she will contribute meaningfully to our strategic plans and growth as an organization.
Looking ahead, we are focused on the drilling and development of our unique asset base while redeploying the expected strong cash flow from completed wells back into further drilling and development programs. Additionally, we continue to evaluate acquisition opportunities of undervalued, low-risk opportunities that support building a strong portfolio with strategic development upside.
Thank you to all our shareholders, partners, and staff for your support on our journey. As we continue to work diligently to execute on our methodical approach to sustainable, long-term growth, I am confident that Permex will thrive in the years ahead.
On Behalf of your Permex Team,
Mehran Ehsan
Chief Executive Officer
About Permex Petroleum Corporation
Permex Petroleum is a uniquely positioned junior oil and gas company with assets and operations across the Permian Basin of West Texas and the Delaware Sub-Basin of New Mexico. The Company focuses on combining its low-cost development of Held by Production assets for sustainable growth with its current and future Blue-Sky projects for scale growth. The Company, through its wholly-owned subsidiary, Permex Petroleum US Corporation, is a licensed operator in both states, and owns and operates on private, state and federal land. For more information, please visit www.permexpetroleum.com.
Forward-Looking Statements
Statements in this press release may constitute forward-looking statements for the purposes of the safe harbor provisions under the Private Securities Litigation Reform Act of 1995 and other federal securities laws as well as applicable Canadian securities laws. These forward-looking statements are made on the basis of the current beliefs, expectations and assumptions of management, are not guarantees of performance and are subject to significant risks and uncertainty. These forward-looking statements should, therefore, be considered in light of various important factors, including those set forth in Company’s reports that it files from time to time with the U.S. Securities and Exchange Commission and the Canadian securities regulators which you should review. When used in this press release, words such as “will,” “could,” “plan,” “estimate”, “expect”, “intend”, “may”, “potential”, “believe”, “should” and similar expressions, are forward-looking statements. Forward-looking statements may include, without limitation, statements relating to the Company’s plans to list on NYSE American, financial condition and operating results, legal, economic, business, competitive and/or regulatory factors affecting Permex’s businesses and any other statements regarding events or developments Permex believes or anticipates will or may occur in the future. These forward-looking statements should not be relied upon as predictions of future events, and the Company cannot assure you that the events or circumstances discussed or reflected in these statements will be achieved or will occur. If such forward-looking statements prove to be inaccurate, the inaccuracy may be material. You should not regard these statements as a representation or warranty by the Company or any other person that it will achieve its objectives and plans in any specified timeframe, or at all. You are cautioned not to place undue reliance on these forward-looking statements, which speak only as of the date of this press release. The Company disclaims any obligation to publicly update or release any revisions to these forward- looking statements, whether as a result of new information, future events or otherwise, after the date of this press release or to reflect the occurrence of unanticipated events, except as required by law.
Contact Information
Permex Petroleum Corporation
Mehran Ehsan President, Chief Executive Officer & Director (469) 804-1306
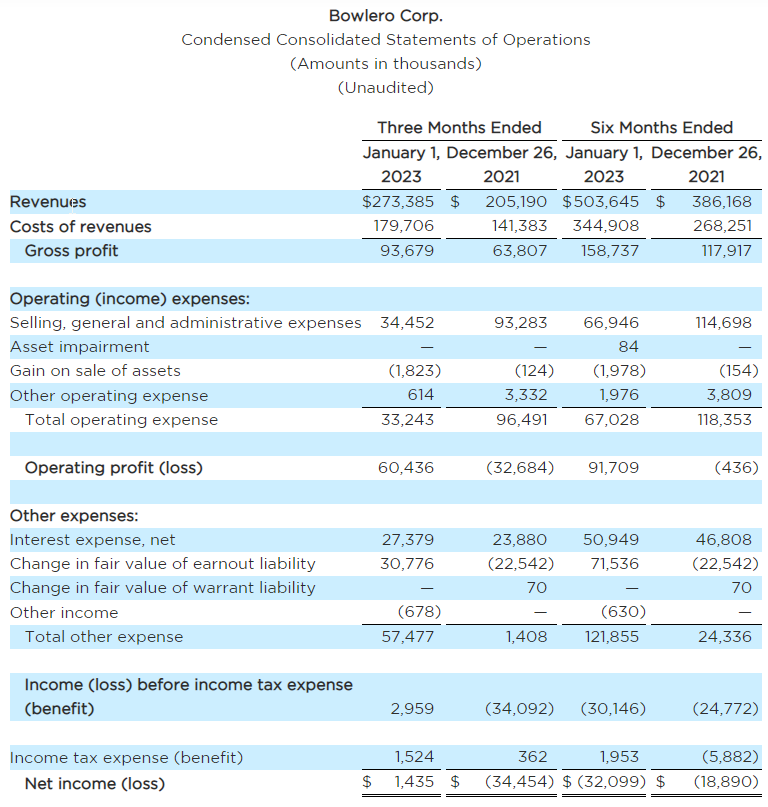
Revenue was a record-breaking $273.4 million in the second quarter, growing $68.2 million, or 33.2%, year-over-year, and $88.5 million, or 47.9%, relative to the corresponding pre-pandemic period.1 Same-store revenue increased $54.4 million, or 27.3%, year-over-year, and grew $53.9 million, or 30.2%, vs. the comparable pre-pandemic period.2
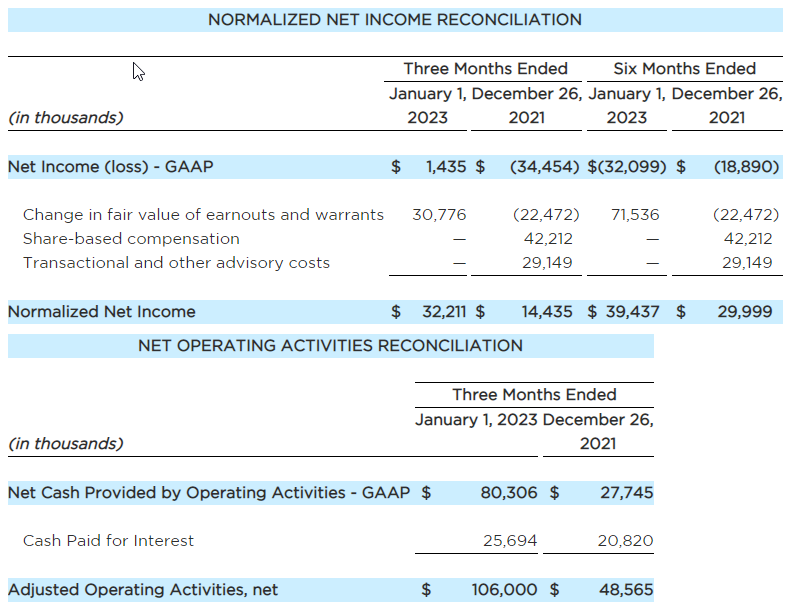
Net income in the second the quarter was $1.4 million, impacted by the non-cash expense related to the revaluation of the earnout shares ($30.8 million). Adjusted for this non-cash expense, Normalized Net Income was $32.2 million.
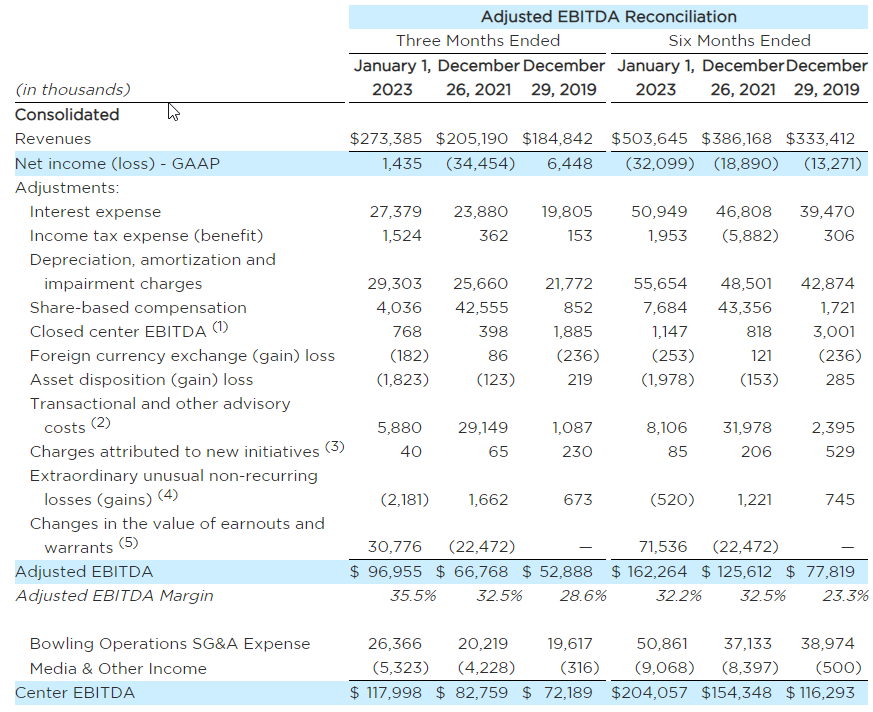
Adjusted EBITDA in the second quarter was $97.0 million, $30.2 million, or 45.2%, higher vs. the prior year’s quarter, and $44.1 million, or 83.3%, higher relative to pre-pandemic performance.
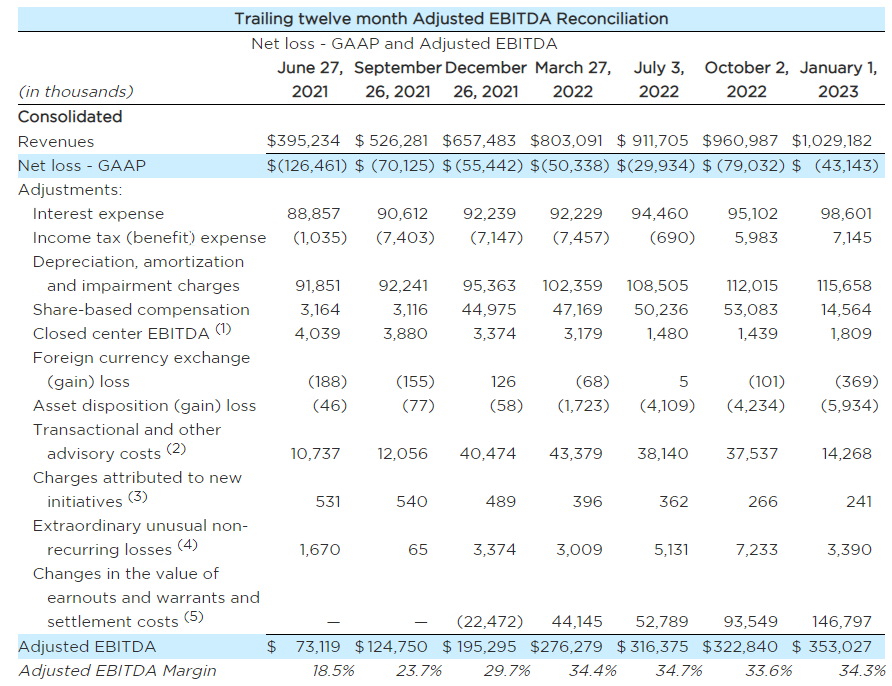
Trailing Twelve Month (TTM) Revenue was $1.03 billion, a high watermark in the Company’s history. The TTM Revenue was $151 million or 17% higher than the corresponding projection provided in the December 2021 go-public transaction.
TTM Adjusted EBITDA was $353.0 million with a 34.3% margin and increased $158 million or 80.8% compared to prior year TTM period.
MoneyBowl™, the Company’s proprietary skill-based gamification app, is active in 37 centers as of February 15, 2023, which represents over 11% of the center population.
The Company added 8 new centers during the quarter. Total centers in operation as of January 1, 2023 were 326. Subsequent to the quarter-end, the Company acquired an additional 1 center bringing the updated center count to 327, and signed leases for another 6 locations to be newly constructed.
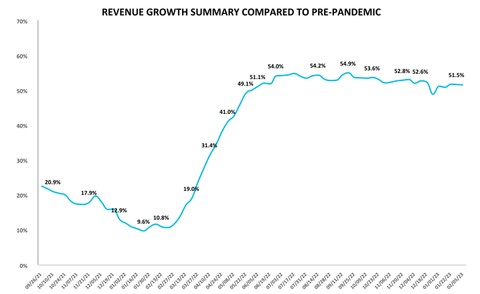
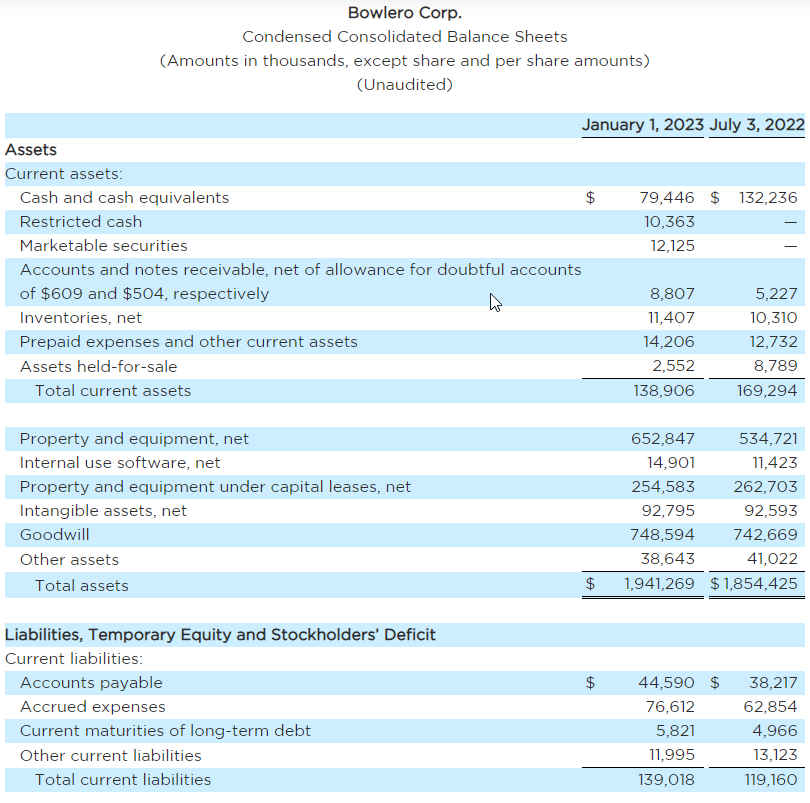
RICHMOND, Va.–(BUSINESS WIRE)– Bowlero Corp. (NYSE: BOWL) (“Bowlero” or the “Company”), the world’s largest owner and operator of bowling centers, today provided financial results for the second quarter of the 2023 fiscal year, which ended on January 1, 2023. Bowlero announced revenue of $273.4 million, which was driven by dramatic growth in event revenue and a solid increase in walk-in-retail and league revenue. Event Revenue grew 74% ($29.6 million) vs. the prior year’s quarter and 59% ($25.8 million) vs. the pre-pandemic quarter. Total revenue grew by 33.2% on a year-over-year basis and 47.9% compared to pre-pandemic performance. Same-store sales rose by 27.3% year-over-year and 30.2% relative to pre-pandemic quarter.
Bowling Center Trailing 13-week Revenue Growth Trend (Graphic: Business Wire)
“The Company’s second quarter top-line and bottom-line growth was extraordinary. The re-investment in our people that we made in the first quarter prepared us for a record holiday season that delivered on every facet. Event Revenue continued to drive revenue growth with event sales up $30 million over prior year’s quarter, more than offsetting the estimated $10 million loss in revenue due to the emergence of the COVID-19 Omicron variant in the prior year,” said Thomas Shannon, Founder and Chief Executive Officer. “The future for the Company is as bright as ever. In addition to record financial performance in the quarter, we continue to achieve exciting milestones, including surpassing $1.0 billion in TTM revenue, $350 million in TTM Adjusted EBITDA, and rolling out MoneyBowl™, our entirely in-house gamification app to 37 centers and counting, which we anticipate will revolutionize how bowlers interact with the lanes.”
Second-Quarter 2023 Operating Results
Tremendous growth in Revenue during the second quarter, totaling $273.4 million, up 33.2% on a year-over-year basis, and up 47.9% relative to pre-pandemic performance. Same-store sales increased 27.3% year-over-year, demonstrating the Company’s ability to continue to drive organic growth.
Net income for the quarter was $1.4 million, after giving effect to $30.8 million of non-cash expenses related to the increase in the fair value of earnouts. In the prior year, Net loss for the quarter was $34.5 million, driven primarily by non-recurring expenses related to the successful de-SPAC transaction net of the non-cash decrease in expenses related to fair value of the earnouts ($48.9 million). Adjusted for the non-cash expense, normalized Net Income was $14.4 million in the prior year’s quarter. Normalized Net Income increased $17.8 million or 123.1% vs. the prior year’s quarter. Adjusted EBITDA for the quarter was $97.0 million, up 45.2% year-over-year and 83.3% relative to pre-pandemic performance.The Company was able to expand margin as a result of the QMS’s tech-enabled financial performance optimization tool and operating leverage from higher revenue generation in the quarter.
Brett Parker, President and CFO of Bowlero, said, “We had a fantastic quarter. The second quarter’s margin improvement was the result of our relentless pursuit of operating leverage in the business while simultaneously driving sales in order to maximize EBITDA. Through our proprietary, algorithmic-based technology toolkit, management remained hyper-focused on maximizing both revenue and profit. We had a strong and balanced performance across all segments of our bowling business–walk-in retail, leagues, and events–and saw robust demand throughout the quarter.”
Financial Position
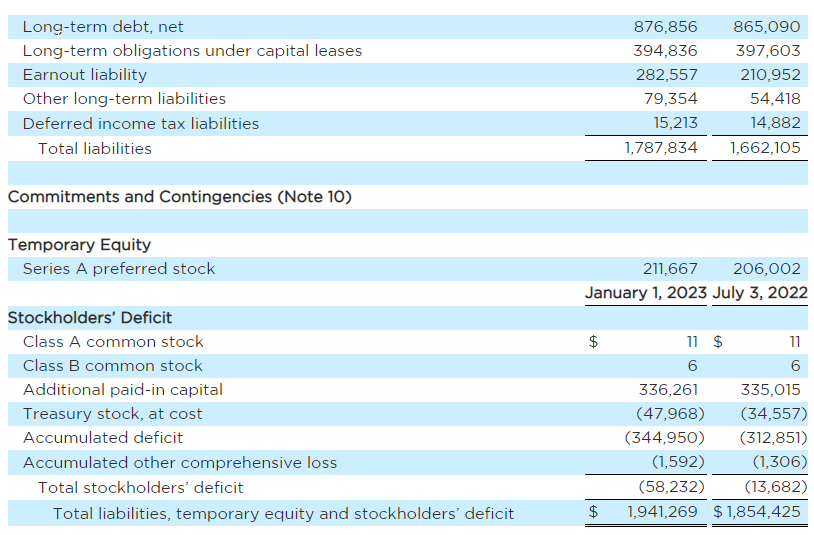
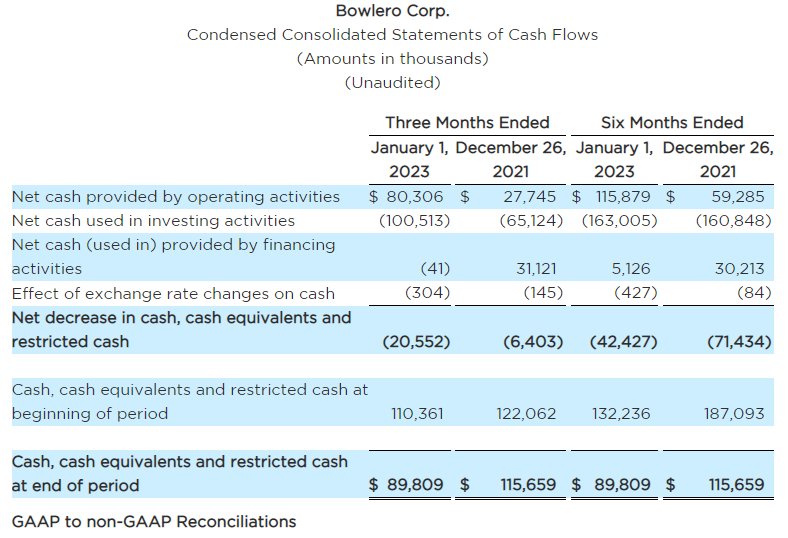
As of January 1, 2023, cash, cash equivalents, and restricted cash totaled $89.8 million and total debt was $887.7 million, resulting in net debt of $797.9 million. At the end of the second quarter of 2023, Bowlero’s Net Leverage Ratio was 2.3x TTM Adjusted EBITDA. For the second quarter of 2023, Net Cash provided by operating Activities was $80.3 million, and Net Cash generated from Adjusted Operating Activities was $106.0 million when adjusted for the $25.7 million in interest expense paid in cash.
Share Repurchase Program
The Company repurchased 629,677 shares of Class A common stock during the second quarter at an average price of $12.62, bringing the total shares repurchased to 4,528,447 shares (average price per share of $10.59) and bringing the total Class A and Class B shares outstanding down to 162.4 million as of January 1, 2023. The Company has now repurchased more than 100% of the shares issued as a result of the warrant redemption in May 2022. Bowlero has $146.6 million of share repurchase authorization remaining as of January 1, 2023.
Bowling Center Trailing 13-week Revenue Growth Trend3
[Please see the Bowling Center Trailing 13-week Revenue Growth TrendChart]
Investor Webcast Information
Listeners may access an investor webcast hosted by Bowlero. The webcast and results presentation will be accessible at 4:30 PM ET on February 15, 2023 in the Events & Presentations section of the Bowlero Investor Relations website at https://ir.bowlerocorp.com/overview/default.aspx.
About Bowlero Corp.
Bowlero Corp. is the worldwide leader in bowling entertainment. With more than 325 bowling centers across North America, Bowlero Corp. serves nearly 30 million guests each year through a family of brands that includes Bowlero and AMF. Bowlero Corp. is also home to the Professional Bowlers Association, which boasts thousands of members and millions of fans across the globe. For more information on Bowlero Corp., please visit BowleroCorp.com.
Forward Looking Statements
Some of the statements contained in this press release are forward-looking statements within the meaning of Section 27A of the Securities Act of 1933, as amended, and Section 21E of the Securities Exchange Act of 1934, as amended. These forward-looking statements are generally identified by the use of words such as “anticipate,” “believe,” “could,” “estimate,” “expect,” “intend,” “may,” “plan,” “potential,” “predict,” “project,” “should,” “target,” “will,” “would” and, in each case, their negative or other various or comparable terminology and include preliminary results. These forward-looking statements reflect our views with respect to future events as of the date of this release and are based on our management’s current expectations, estimates, forecasts, projections, assumptions, beliefs and information. Although management believes that the expectations reflected in these forward-looking statements are reasonable, it can give no assurance that these expectations will prove to have been correct. All such forward-looking statements are subject to risks and uncertainties, many of which are outside of our control, and could cause future events or results to be materially different from those stated or implied in this document. It is not possible to predict or identify all such risks. These risks include, but are not limited to: the impact of COVID-19 or other adverse public health developments on our business; our ability to grow and manage growth profitably, maintain relationships with customers, compete within our industry and retain our key employees; changes in consumer preferences and buying patterns; the possibility that we may be adversely affected by other economic, business, and/or competitive factors; the risk that the market for our entertainment offerings may not develop on the timeframe or in the manner that we currently anticipate; general economic conditions and uncertainties affecting markets in which we operate and economic volatility that could adversely impact our business, including the COVID-19 pandemic and other factors described under the section titled “Risk Factors” in the Company’s Annual Report on Form 10-K filed with the U.S. Securities and Exchange Commission (the “SEC”) by the Company on September 15, 2022, as well as other filings that the Company will make, or has made, with the SEC, such as Quarterly Reports on Form 10-Q and Current Reports on Form 8-K. These factors should not be construed as exhaustive and should be read in conjunction with the other cautionary statements that are included in this press release and in other filings. We expressly disclaim any obligation to publicly update or review any forward-looking statements, whether as a result of new information, future developments or otherwise, except as required by applicable law.
Non-GAAP Financial Measures
To provide investors with information in addition to our results as determined under Generally Accepted Accounting Principles (“GAAP”), we disclose net income, normalized for extraordinary and non-recurring items, cash generated from Adjusted Operating Activities, net, Adjusted EBITDA, and trailing twelve month Adjusted EBITDA as “non-GAAP measures” that management believes provide useful information to investors because each measure assists both investors and management in analyzing and benchmarking the performance and value of our business. Accordingly, management believes that these measurements are useful for comparing general operating performance from period to period, and management relies on these measures for planning and forecasting of future periods. Additionally, these measures allow management to compare our results with those of other companies that have different financing and capital structures. These measures are not financial measures calculated in accordance with GAAP and should not be considered as a substitute for revenue, net income, net cash provided (used) by operating activities or any other operating performance or liquidity measure calculated in accordance with GAAP, and may not be comparable to a similarly titled measure reported by other companies.
Net income normalized for extraordinary and non-recurring items represents Net income (loss) before non-cash expenses or income related to Changes in the value of earnouts and warrants. Cash generated from Adjusted Operating Activities, net represents Net cash provided by operating activities before cash interest. Adjusted EBITDA represents Net income (loss) before Interest, Income Taxes, Depreciation and Amortization, Share-based Compensation, EBITDA from Closed Centers, Foreign Currency Exchange Loss (Gain), Asset Disposition Loss (Gain), Transactional and other advisory costs, Charges attributed to new initiatives, Extraordinary unusual non-recurring gains or losses and Changes in the value of earnouts and warrants and settlement costs. Trailing twelve month Adjusted EBITDA represents Adjusted EBITDA over the most recent twelve month period.
The Company considers net income normalized for extraordinary and non-recurring items as an important financial measure because it provides an indicator of performance that is not affected by fluctuations in certain costs or other items. However, this measure has limitations as an analytical tool, and you should not consider it in isolation or as a substitute for analysis of our results as reported under GAAP. Some of these limitations are that it does not reflect every cash expenditure and is not adjusted for all non-cash income or expense items that are reflected in our statements of cash flows.
The Company considers Cash generated from Adjusted Operating Activities, net as an important financial measure because it provides an indicator of cash flow that is not affected by how the Company finances its operations. However, this measure has limitations as an analytical tool, and you should not consider it in isolation or as a substitute for analysis of cash generation as reported under GAAP.
The Company considers Adjusted EBITDA as an important financial measure because it provides a financial measure of the quality of the Company’s earnings. Other companies may calculate Adjusted EBITDA differently than we do, which might limit its usefulness as a comparative measure. Adjusted EBITDA is used by management in addition to and in conjunction with the results presented in accordance with GAAP. Additionally, we believe trailing twelve month Adjusted EBITDA provides the current run-rate for trending purposes, rather than annualizing the respective quarters, as the Company’s business is seasonal, with the second and third fiscal quarters being higher than the first and last quarters.
We have presented Adjusted EBITDA solely as a supplemental disclosure because we believe it allows for a more complete analysis of results of operations and assists investors and analysts in comparing our operating performance across reporting periods on a consistent basis by excluding items that we do not believe are indicative of our core operating performance.
Adjusted EBITDA has limitations as an analytical tool, and you should not consider it in isolation or as a substitute for analysis of our results as reported under GAAP. Some of these limitations are that Adjusted EBITDA and trailing twelve month Adjusted EBITDA: do not reflect every expenditure, future requirements for capital expenditures or contractual commitments; do not reflect changes in our working capital needs; do not reflect the interest expense, or the amounts necessary to service interest or principal payments, on our outstanding debt; do not reflect income tax (benefit) expense, and because the payment of taxes is part of our operations, tax expense is a necessary element of our costs and ability to operate; do not reflect non-cash equity compensation, which will remain a key element of our overall equity based compensation package; and do not reflect the impact of earnings or charges resulting from matters we consider not to be indicative of our ongoing operations.
The closed center adjustment is to remove EBITDA for closed centers. Closed centers are those centers that are closed for a variety of reasons, including permanent closure, newly acquired or built centers prior to opening, centers closed for renovation or rebranding and conversion. Closed centers do not include centers closed in compliance with local, state and federal government restrictions due to COVID-19. If a center is not open on the last day of the reporting period, it will be considered closed for that reporting period. If the center is closed on the first day of the reporting period for permanent closure, the center will be considered closed for that reporting period.
The adjustment for transaction costs and other advisory costs is to remove charges incurred in connection with any transaction, including mergers, acquisitions, refinancing, amendment or modification to indebtedness, dispositions and costs in connection with an initial public offering, in each case, regardless of whether consummated.
The adjustment for charges is to remove charges attributed to new initiatives include charges with the undertaking and/or implementation of new initiatives, business optimization activities, cost savings initiatives, cost rationalization programs, operating expense reductions and/or synergies and/or similar initiatives and/or programs (including in connection with any integration, restructuring or transition, any reconstruction, decommissioning, recommissioning, or reconfiguration of fixed assets for alternative uses, any office or facility opening and/or pre-opening), including any inventory optimization program and/or any curtailment, any business optimization charge, any restructuring charge (including any charges relating to any tax restructuring), any charge relating to the closure or consolidation of any office or facility (including but not limited to rent terminations, moving costs and legal costs), any systems implementation charge, any severance charge, any one time compensation charge, any charge relating to entry into a new market, any charge relating to any strategic initiative or contract, any charge relating to any entry into new markets and contracts, any lease run-off charge, any charge associated with improvements to information technology (IT) or accounting functions, losses related to temporary decreases in work volume and expenses related to maintaining underutilized personnel, any charge relating to a new contract, any consulting charge and/or any corporate development charge; provided, that, in this case of any such charge, the results of any such action relating to such charge are projected by in good faith to be achieved with 24 months of undertaking.
The adjustment for extraordinary unusual non-recurring gains or losses is to remove extraordinary gains and losses, which include any gain or charge from any extraordinary item as determined in good faith by the Company and/or any non-recurring or unusual item as determined in good faith by the Company and/or any charge associated with and/or payment of any legal settlement, fine, judgment or order.
The adjustment for changes in the value of earnouts and warrants is to remove the impact of the revaluation of the earnouts and warrants. As a result of the Company’s de-SPAC transaction, the Company recorded liabilities for earnouts and warrants. Changes in the fair value of the earnout and warrant liabilities are recognized in the statement of operations. Decreases in the liability will have a favorable impact on the income statement and increases in the liability will have an unfavorable impact.
The closed center adjustment is to remove EBITDA for closed centers. Closed centers are those centers that are closed for a variety of reasons, including permanent closure, newly acquired or built centers prior to opening, centers closed for renovation or rebranding and conversion. Closed centers do not include centers closed in compliance with local, state and federal government restrictions due to COVID-19. If a center is not open on the last day of the reporting period, it will be considered closed for that reporting period.If the center is closed on the first day of the reporting period for permanent closure, the center will be considered closed for that reporting period.
The adjustment for transaction costs and other advisory costs is to remove charges incurred in connection with any transaction, including mergers, acquisitions, refinancing, amendment or modification to indebtedness, dispositions and costs in connection with an initial public offering, in each case, regardless of whether consummated.
The adjustment for charges is to remove charges attributed to new initiatives include charges with the undertaking and/or implementation of new initiatives, business optimization activities, cost savings initiatives, cost rationalization programs, operating expense reductions and/or synergies and/or similar initiatives and/or programs (including in connection with any integration, restructuring or transition, any reconstruction, decommissioning, recommissioning, or reconfiguration of fixed assets for alternative uses, any office or facility opening and/or pre-opening), including any inventory optimization program and/or any curtailment, any business optimization charge, any restructuring charge (including any charges relating to any tax restructuring), any charge relating to the closure or consolidation of any office or facility (including but not limited to rent terminations, moving costs and legal costs), any systems implementation charge, any severance charge, any one time compensation charge, any charge relating to entry into a new market, any charge relating to any strategic initiative or contract, any charge relating to any entry into new markets and contracts, any lease run-off charge, any charge associated with improvements to information technology (IT) or accounting functions, losses related to temporary decreases in work volume and expenses related to maintaining underutilized personnel, any charge relating to a new contract, any consulting charge and/or any corporate development charge; provided, that, in this case of any such charge, the results of any such action relating to such charge are projected by in good faith to be achieved with 24 months of undertaking.
The adjustment for extraordinary unusual non-recurring gains or losses is to remove extraordinary gains and losses, which include any gain or charge from any extraordinary item as determined in good faith by the Company and/or any non-recurring or unusual item as determined in good faith by the Company and/or any charge associated with and/or payment of any legal settlement, fine, judgment or order.
The adjustment for changes in the value of earnouts and warrants is to remove the impact of the revaluation of the earnouts and warrants. As a result of the Company’s de-SPAC transaction, the Company recorded liabilities for earnouts and warrants. Changes in the fair value of the earnout and warrant liabilities are recognized in the statement of operations. Decreases in the liability will have a favorable impact on the income statement and increases in the liability will have an unfavorable impact. The adjustment also includes realized costs associated with the settlement of warrants during past reporting periods.
1 The pre-pandemic comparable period for quarter ended January 1, 2023 is the quarter ended on December 29, 2019.
2 Same-store sales are measured by comparing revenues for centers open for the entire duration of both the current and comparable measurement periods.
3 Revenue growth is calculated as the growth in Bowling Center Revenue compared to the comparable week during the pre-pandemic 52-week period beginning March 2019 and ending February 2020. Total Bowling Center Revenue (i) excludes media-related revenue and closed bowling centers from both current period and pre-pandemic and prior year periods and (ii) includes new bowling centers that have opened since March 2020. For weeks ending between September 26, 2021 and December 26, 2021, the percentages above are calculated by comparing each week to the comparable week in 2019. For weeks ending between January 2, 2022 and February 27, 2022, the percentages above are calculated by comparing each week to the comparable week in 2020. For weeks ending between March 6, 2022 and February 5, 2023, the percentages above are calculated by comparing each week to the comparable week in 2019. Total Bowling Center Revenue for each date is the 13-week rolling average of weekly Total Bowling Center Revenue. We use the 13-week rolling average because the revenue performance in individual weeks can be positively or negatively impacted by timing shift of holiday/sporting events, holidays moving to weekends, and extreme weather events. Data for all weeks following the close of the quarter ended on January 1, 2023 are preliminary and have not been audited or reviewed and are forward-looking statements based solely on information available to us as of the date of this announcement.
Acquisition expected to establish Item 9 Labs Corp. as the largest cannabis franchisor in North America & among the top 10 cannabis retailers
Sessions currently generates over CA$80 million in annual systemwide sales across more than 45 dispensaries in Ontario, with an Adjusted EBITDA* margin of approximately 65%
Item 9 Labs Corp. (OTCQX: INLB ) (the “Company”), a vertically integrated U.S. cannabis dispensary franchisor and operator that produces premium, award-winning products, shared that it has secured the necessary financing to complete the previously announced acquisition of Sessions Cannabis (“Sessions”), one of Canada’s largest cannabis retail franchisors. The total cash purchase price of the transaction is $12.8 million, which is being fully funded through an Acquisition Line of Credit with a 5-year term from a commercial lender.
“Our highly anticipated acquisition of Sessions is on track to close in March. We have completed the due diligence process, received all required approvals, and now, secured the financing to bring this transformative acquisition across the finish line and create the largest international cannabis retail franchiser and publicly traded cannabis franchise company in North America,” said CEO of Item 9 Labs Corp. Mike Weinberger.
The Canadian cannabis market is expected to reach upwards of $6.3 billion by 2026, according to data research firm BDSA . Most of the growth is projected to be produced from Ontario, Canada’s most populous province, as it contributes nearly $1.3 billion of legal sales alone.
Sessions currently generates more than CA$80 million in annual systemwide sales with over 45 locations open throughout Ontario, up from 40 earlier in 2022, and is continuing to grow rapidly. The franchise network consists of 15-plus franchisees, with over 10 who are multi-unit owner-operators. The franchise anticipates maintaining strong performance with multiple openings in prime retail shopping centers surrounded by well-known grocers, quick service restaurants, and more, already slated for the coming months.
The franchise business model will become fundamental to accommodate the shifts in the Canadian cannabis landscape and allow the future joint company to aid both existing independent dispensaries and prospective franchisees as part of its international growth strategy. By joining the greater combined North American franchise network of more than 50 dispensaries, they gain the ongoing, dedicated support and buying power needed to excel in highly competitive markets.
“Franchising is the key vehicle to unlocking untapped market potential and significantly increasing brand penetration,” Weinberger continued. “Sessions stores are strategically placed in prime retail locations and have not seen the same impact others have experienced in competitive Canadian cannabis markets. Their dispensaries are thriving, and we anticipate with our unified team that we will be able to scale quickly across the country.”
The closing of the acquisition is subject to customary closing conditions, details of which can be found in the Company’s 8-K filing on May 24, 2022 .
For more information about Item 9 Labs Corp. and its brands, visit item9labscorp.com . For potential merger and acquisition opportunities, contact Mark Busch at [email protected].
*Adjusted EBITDA is a non-GAAP financial measure of earnings. Adjusted EBITDA represents EBITDA plus stock-based compensation and non-recurring revenue and expenses.
ABOUT ITEM 9 LABS CORP.
Item 9 Labs Corp. (OTCQX: INLB) is a vertically integrated cannabis operator and dispensary franchisor delivering premium products from its large-scale cultivation and production facilities in the United States. The award-winning Item 9 Labs brand specializes in best-in-class products and user experience across several cannabis categories. The company also offers a unique dispensary franchise model through the national Unity Rd. retail brand. Easing barriers to entry, the franchise provides an opportunity for both new and existing dispensary owners to leverage the knowledge, resources and ongoing support needed to thrive in their state compliantly and successfully. Item 9 Labs brings the best industry practices to markets nationwide through distinctive retail experience, cultivation capabilities and product innovation. The veteran management team combines a diverse skill set with deep experience in the cannabis sector, franchising and the capital markets to lead a new generation of public cannabis companies that provide transparency, consistency and well-being. Headquartered in Arizona, the company is currently expanding its operations space up to 640,000-plus square feet on its 50-acre site, one of the largest properties in Arizona zoned to grow and cultivate flower. For additional information, visit item9labscorp.com .
ABOUT SESSIONS CANNABIS
Sessions Cannabis is a community focused retailer selling safe, Health Canada regulated cannabis. Sessions is one of Ontario’s first brick and mortar cannabis retailers with multiple locations in Ontario. The company’s mission is to bring people together by providing a retail experience that is inviting, comfortable and educational. More information can be found at sessions.ca .
FORWARD-LOOKING STATEMENTS
This press release contains forward-looking statements within the meaning of the safe harbor provisions of the Private Securities Litigation Reform Act of 1995. Such statements involve risks and uncertainties, including, but not limited to, risks and effects of legal and administrative proceedings and governmental regulation, especially in a foreign country, future financial and operational results, competition, general economic conditions, proposed transactions that are not legally binding obligations of the company and the ability to manage and continue growth. Should one or more of these risks or uncertainties materialize, or should underlying assumptions prove incorrect, actual outcomes may vary materially from those indicated. Important factors that could cause actual results to differ materially from the forward-looking statements we make in this news release include the introduction of new technology, market conditions and those set forth in reports or documents we file from time to time with the SEC. We undertake no obligation to revise or update such statements to reflect current events or circumstances after the date hereof or to reflect the occurrence of unanticipated events.
Sale provides Energy Fuels with significant non-dilutive funding for expansion of industry-leading US uranium production and completion of ‘Phase 1’ rare earth separation circuit.
LAKEWOOD, Colo., Feb. 15, 2023 /CNW/ – Energy Fuels Inc. (NYSE American: UUUU) (TSX: EFR) (“Energy Fuels” or the “Company”) is pleased to announce that it has completed the sale (the “Closing“) of three (3) wholly-owned subsidiaries that together hold Energy Fuels’ Alta Mesa ISR Project (“Alta Mesa“) to enCore Energy Corp. (“enCore“) for total consideration of $120 million (the “Transaction“). Unless otherwise indicated, all references to dollar amounts in this press release are references to US$.
The consideration is comprised of:
$60 million cash at or prior to Closing; and
$60 million in a secured convertible note (the “Note“), payable in two (2) years from the Closing, bearing annual interest of eight percent (8%). The Note will be convertible at Energy Fuels’ election into enCore common shares at a conversion price of $2.9103 per share, being a 20% premium to the 10-day volume-weighted average price of enCore shares ending the day before the Closing. enCore was recently listed on the NYSE American and also trades on the TSX Venture Exchange. The Note is guaranteed by enCore and is fully secured by Alta Mesa. Unless a block trade or similar distribution is executed by Energy Fuels to sell enCore shares received upon conversion of the Note, Energy Fuels will be limited to converting the Note into a maximum of $10 million principal amount per thirty (30) day period.
In addition, enCore is required to replace the existing reclamation bonds for the Alta Mesa project shortly after the Closing, which will result in Energy Fuels receiving an additional $3.6 million cash as a return of collateral from those bonds. The Transaction also reduces the Company’s holding costs related to Alta Mesa by approximately $2 million per year.
The Transaction provides Energy Fuels with significant additional cash and working capital, enabling the Company to ramp-up its US industry-leading uranium and rare earth element (“REE“) production, while avoiding dilution to shareholders. In addition, the Note provides Energy Fuels with significant exposure to uranium market upside through potential conversion into enCore common shares.
Boosting Industry-Leading US Uranium Production:
Energy Fuels plans to invest a portion of the proceeds from the Transaction into increasing its US industry-leading uranium production. At the current time, the Company’s White Mesa Mill (the “Mill“) is the only US uranium facility producing material quantities of uranium, having produced 162,000 pounds of U3O8 in Q4-2022. The Company is also preparing four (4) of its conventional uranium and uranium/vanadium mines to be ready to resume uranium ore production, including significant workforce expansion and performing needed rehabilitation of surface and underground infrastructure. The exact timing for resumption of ore production from each of these projects will be subject to current and future uranium sales and inventory requirements.
Energy Fuels’ 2022 uranium production of 162,000 pounds exceeded its previously announced guidance of 130,000 to 140,000 pounds of U3O8. In addition, over the past several months, the Company has invested in additional uranium inventories, having purchased approximately 301,000 pounds of US-origin U3O8 at a weighted average price of $50.08 per pound. In addition, in January 2023, the Company sold 300,000 pounds of U3O8 to the US government for the establishment of the strategic Uranium Reserve, earning total gross proceeds of $18.5 million, or $61.57 per pound.
As a result of 2022 production, recent purchases, and the sale to the US government, Energy Fuels currently holds approximately 847,000 pounds of U3O8 in inventory at a book value of $29.19 per pound (worth about $42.5 million at the current weekly uranium spot price as reported by TradeTech). In combination with future uranium production, the Company expects to utilize this inventory to fulfill its delivery obligations under its supply contracts with US nuclear utilities. Energy Fuels is also actively seeking additional uranium sales contracts with nuclear utilities at increasingly higher uranium prices bolstered by improving market fundamentals, including the global energy transition toward less carbon intensive sources of energy, including nuclear, efforts to move away from Russian uranium and nuclear fuel supply, and other factors related to transportation and security of supply. As a result of the Company’s strategic moves in the uranium space, the Company believes it is creating significant flexibility by growing and managing its existing inventories and preparing several of its US assets for near-term production.
Investing in Production of Advanced Rare Earth Materials in the US:
In a February 13, 2023 news release, the Company announced that it had achieved several milestones related to its expanding REE supply chain, including completion of the acquisition of the Bahia Project in Brazil and continued progress on procuring natural monazite sand concentrate. Today, the Company is producing the most advanced REE material in the US and is currently performing modifications and enhancements to the existing solvent extraction (“SX“) circuits at the Mill (“Phase 1“) that are expected to enable Energy Fuels to annually produce up to 5,000 metric tons (“MT“) of total REE oxides (“TREO“), including up to 1,000 MT of neodymium-praseodymium (“NdPr“) oxide (or oxalate), subject to receipt of sufficient REE-bearing monazite sand supply and successful commissioning. The “Phase 1” circuit will be in the same SX building where uranium and vanadium is produced at the Mill. If these milestones are achieved, Energy Fuels believes it will be the ‘first to market’ among US companies with commercial quantities of separated NdPr available to electric vehicle (“EV“), renewable energy, and other companies for offtake, while fully maintaining our uranium and vanadium recovery capabilities. Energy Fuels’ “Phase 1” “light” separation circuit is expected to produce commercial quantities of separated NdPr oxide (or oxalate) by later this year or early 2024, followed by planned further enhancements to expand NdPr production capability (“Phase 2“) and to produce separated “heavy” REEs, including Dy, Tb, and potentially other REE materials, in the future (“Phase 3“) from monazite and potentially other REE-bearing process streams.
Mark S. Chalmers, President and CEO of Energy Fuels stated: “Energy Fuels’ sale of the Alta Mesa project for $120 million of total consideration is highly strategic for a variety of reasons. When combined with our already strong balance sheet, the proceeds from this sale are expected to fully fund our current uranium, vanadium and rare earth business plans through approximately 2024 without the dilution to shareholders one might normally expect, nor depletion of working capital. On the uranium front, this sale provides Energy Fuels with the ability to make the focused investments in infrastructure and human capital required to resume production at our lowest-cost and nearest-term uranium mines and facilities. We believe Energy Fuels will be among the quickest to market with significant new US uranium production and retain our position as the leading US uranium producer for many years to come.
“Of the four (4) conventional mines we are currently preparing for production, three (3) produce both uranium and vanadium. Vanadium prices are currently on the move, having risen from $7.50 per pound of V2O5 in October 2022 to $10.80 per pound today. Vanadium is important to our uranium business, as strong vanadium prices contribute to the economics of these mines, making them a more attractive option for us as we evaluate which mines to place back into production. Due to today’s strong vanadium markets, we are also evaluating the sale of more of our existing vanadium inventory which currently sits at 987,000 pounds of V2O5.
“Even though uranium is Energy Fuels’ core business, we expect to invest some of the proceeds from the sale of Alta Mesa into our rapidly expanding rare earths business. We have started the modifications and enhancements at our White Mesa Mill in Utah that are expected to produce commercial quantities (500 – 1,000 MT) of NdPr oxide (or oxalate) by later this year or early in 2024, while maintaining our uranium and vanadium capabilities. NdPr oxide is a high-demand advanced material needed in the EV, renewable energy and defense industries. We are not aware of any other US company that will get this far down the US rare earth supply chain as quickly as Energy Fuels. It is also virtually unheard of anywhere else in the world to produce uranium, vanadium and separated rare earths in the same building, which demonstrates the creativity and resourcefulness of the team at the Mill.
“We also expect to invest some of the proceeds from Alta Mesa into advancing our Bahia Project in Brazil, where we plan to continue our comprehensive sonic drill program in 2023 to better define and delineate the titanium (ilmenite and rutile), zirconium (zircon), and of course rare earths (monazite) resources. We believe the Bahia Project has the potential to produce 3,000 to 10,000 MT per year of monazite concentrate for our Mill as soon as 2025 and for decades to come. Bahia, combined with other Company-owned and third-party monazite sources, is expected to supply the feed for ‘Phase 1’ and ‘Phase 2’ ‘light’ rare earth separation, and ‘Phase 3’ ‘heavy’ rare earth separation at the Mill.
“We see our rapidly developing REE business as highly complementary to our primary uranium business. We can utilize our existing facilities to recover uranium and REEs from monazite, which increases our uranium production and also allows us to generate margins from multiple commodities. No other US uranium producer has the ability to complement its primary uranium business in this manner.
“Finally, the $60 million secured convertible note Energy Fuels received from enCore at closing provides the Company with additional uranium market upside through the potential conversion of the Note into enCore Energy shares at an attractive conversion price.”
ABOUT ENERGY FUELS
Energy Fuels is a leading US-based critical minerals company. The Company mines uranium and produces natural uranium concentrates that are sold to major nuclear utilities for the production of carbon-free nuclear energy. Energy Fuels recently began production of advanced rare earth element (“REE“) materials, including mixed REE carbonate, and plans to produce commercial quantities of separated REE oxides in the future. Energy Fuels also produces vanadium from certain of its projects, as market conditions warrant, and is evaluating the recovery of radionuclides needed for emerging cancer treatments. Its corporate offices are in Lakewood, Colorado, near Denver, and substantially all its assets and employees are in the United States. Energy Fuels holds two of America’s key uranium production centers: the White Mesa Mill in Utah and the Nichols Ranch in-situ recovery (“ISR“) Project in Wyoming. The White Mesa Mill is the only conventional uranium mill operating in the US today, has a licensed capacity of over 8 million pounds of U3O8 per year, has the ability to produce vanadium when market conditions warrant, as well as REE products, from various uranium-bearing ores. The Nichols Ranch ISR Project is on standby and has a licensed capacity of 2 million pounds of U3O8 per year. The Company recently acquired the Bahia Project in Brazil, which is believed to have significant quantities of titanium (ilmenite and rutile), zirconium (zircon) and REE (monazite) minerals. In addition to the above production facilities, Energy Fuels also has one of the largest NI 43-101 compliant uranium resource portfolios in the US and several uranium and uranium/vanadium mining projects on standby and in various stages of permitting and development. The primary trading market for Energy Fuels’ common shares is the NYSE American under the trading symbol “UUUU,” and the Company’s common shares are also listed on the Toronto Stock Exchange under the trading symbol “EFR.” Energy Fuels’ website is www.energyfuels.com.
This news release contains “forward-looking information” within the meaning of applicable securities laws in the United States and Canada. Forward-looking information may relate to future events or future performance of Energy Fuels. All statements in this release, other than statements of historical facts, with respect to Energy Fuels’ objectives and goals, as well as statements with respect to its beliefs, plans, objectives, expectations, anticipations, estimates, and intentions, are forward-looking information. Specific forward-looking statements in this discussion include, but are not limited to, the following: any expectation that the Company will receive an additional $3.6 million cash as a return of collateral from the Alta Mesa reclamation bonds; any expectation that the conversion price of the Note may be attractive or that the Company will convert all or any portion of the Note; any expectation that the proceeds from the sale of Alta Mesa will fully fund the Company’s current uranium, vanadium and REE business plans through approximately 2024 without dilution to shareholders or depletion of working capital; any expectation that the Company will invest a portion of the proceeds of the Transaction into its uranium production; any expectation that the Company will successfully prepare any of its mines to resume ore production or that any of its mines will enter into production in the near term or at all; any expectation that the Company will utilize any of its inventories to fulfill delivery obligations under its existing supply contracts or will be successful in obtaining any additional supply contracts; any expectation as to the quantities of uranium and heavy minerals, including monazite, NdPr, Dy and Tb contained in the Bahia Project; any expectation as to the potential annual supply of monazite sands from the Bahia Project to the Mill, the contained MT of TREO per year, or the number of years or decades of such potential supply; any expectation as to the timing of mining at the Bahia Project; any expectation that the Company will complete its Phase 1, Phase 2 and/or Phase 3 separation facilities on the time frames indicated, if at all; any expectation as to the expected throughput rates, production capability, and REEs to be produced; any expectation that the Company will be the first to market among US companies with commercial quantities of separated NdPr available to EV, renewable energy and other companies for offtake; any expectation that the Company will retain its position as the leading US uranium producer for many years to come; any expectations as to vanadium or other commodity prices; any expectation that the Company will sell any of existing inventory at attractive prices or at all; any expectation that the Company will be able to utilize the Mill to generate margins from recovering uranium and REEs from monazite sands and other ores independent of the price of uranium; any expectation that the Company’s REE business may become a profitable stand-alone business for the Company, or provide commodity price diversification for the Company; and any expectation that the Mill is a unique and highly strategic asset in the US. Often, but not always, forward-looking information can be identified by the use of words such as “plans”, “expects”, “is expected”, “budget”, “scheduled”, “estimates”, “continues”, “forecasts”, “projects”, “predicts”, “intends”, “anticipates” or “believes”, or variations of, or the negatives of, such words and phrases, or state that certain actions, events or results “may”, “could”, “would”, “should”, “might” or “will” be taken, occur or be achieved. This information involves known and unknown risks, uncertainties and other factors that may cause actual results or events to differ materially from those anticipated in such forward-looking information. Factors that could cause actual results to differ materially from those anticipated in these forward-looking statements include risks associated with: technical difficulties; mining or processing difficulties and upsets;licensing, permitting and regulatory delays; litigation risks; competition from others; political actions or instability in foreign countries; and market factors, including future demand for and prices realized from the sale of uranium, vanadium and REEs. Forward-looking statements contained herein are made as of the date of this news release, and Energy Fuels disclaims, other than as required by law, any obligation to update any forward-looking statements whether as a result of new information, results, future events, circumstances, or if management’s estimates or opinions should change, or otherwise. There can be no assurance that forward-looking statements will prove to be accurate, as actual results and future events could differ materially from those anticipated in such statements. Accordingly, the reader is cautioned not to place undue reliance on forward-looking statements. Energy Fuels assumes no obligation to update the information in this communication, except as otherwise required by law.
SOURCE Energy Fuels Inc.
For further information: ENERGY FUELS, Curtis Moore – VP of Marketing & Corporate Development, (303) 974-2154; CONTACT: ENERGY FUELS, Curtis Moore – SVP of Marketing & Corporate Development, (303) 974-2154