Research News and Market Data on ODP
Operational Excellence and Disciplined Capital Allocation Drive Solid Operating Performance and Strong EPS Growth
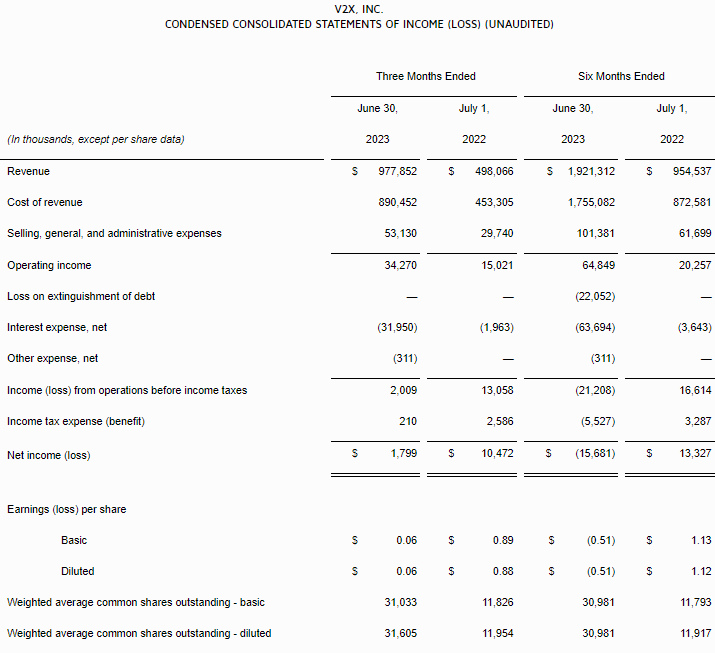
Second Quarter Revenue of $1.9 Billion with GAAP EPS of $0.87; Adjusted EPS of $0.99
GAAP Operating Income of $46 Million; GAAP Net Income of $34 Million; Adjusted EBITDA of $86 Million
Repurchased $31 Million of Shares in the Second Quarter of 2023
Updates Full-Year 2023 Guidance
BOCA RATON, Fla.–(BUSINESS WIRE)–Aug. 9, 2023– The ODP Corporation (“ODP,” or the “Company”) (NASDAQ:ODP), a leading provider of products, services, and technology solutions to businesses and consumers, today announced results for the second quarter ended July 1, 2023.
| Consolidated (in millions, except per share amounts) | 2Q23 | 2Q22 | YTD23 | YTD22 |
| Selected GAAP and Non-GAAP measures: | ||||
| Sales | $1,908 | $2,034 | $4,016 | $4,212 |
| Sales change from prior year period | (6)% | (5)% | ||
| Operating income | $46 | $28 | $141 | $104 |
| Adjusted operating income (1) | $53 | $54 | $152 | $143 |
| Net income from continuing operations | $34 | $20 | $107 | $75 |
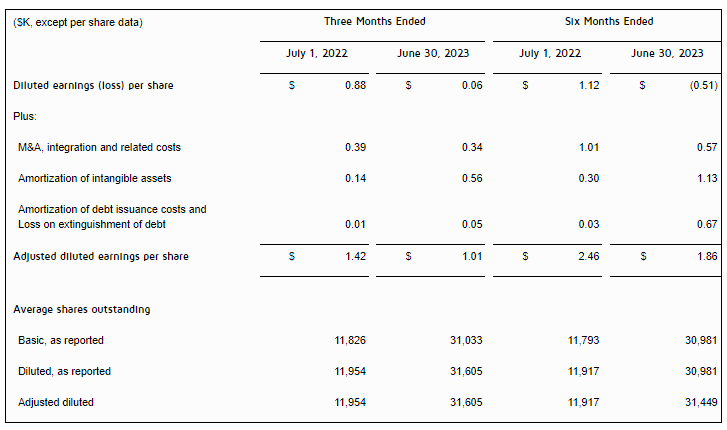
| Diluted earnings per share from continuing operations | $0.87 | $0.39 | $2.61 | $1.49 |
| Adjusted net income from continuing operations (1) | $39 | $39 | $114 | $104 |
| Adjusted earnings per share from continuing operations (fully diluted) (1) | $0.99 | $0.79 | $2.80 | $2.06 |
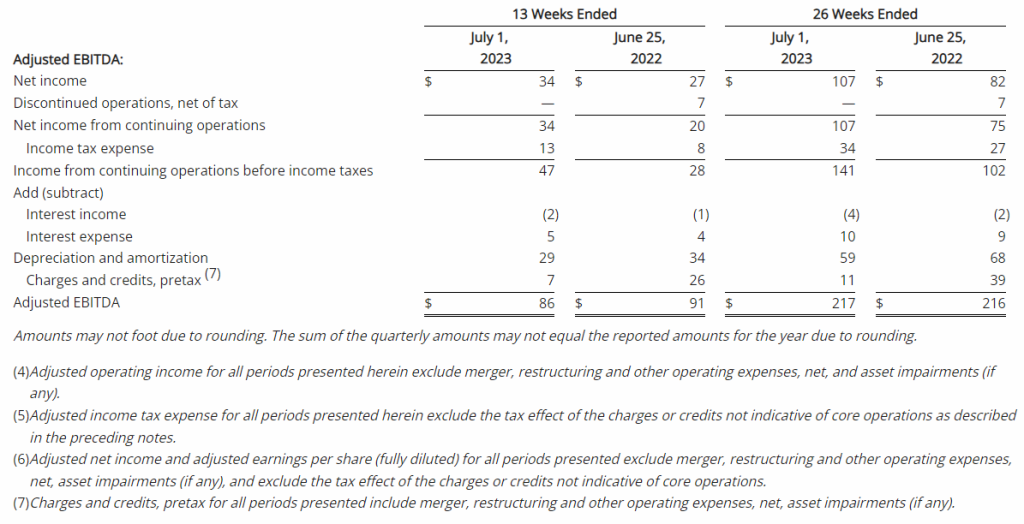
| Adjusted EBITDA (1) | $86 | $91 | $217 | $216 |
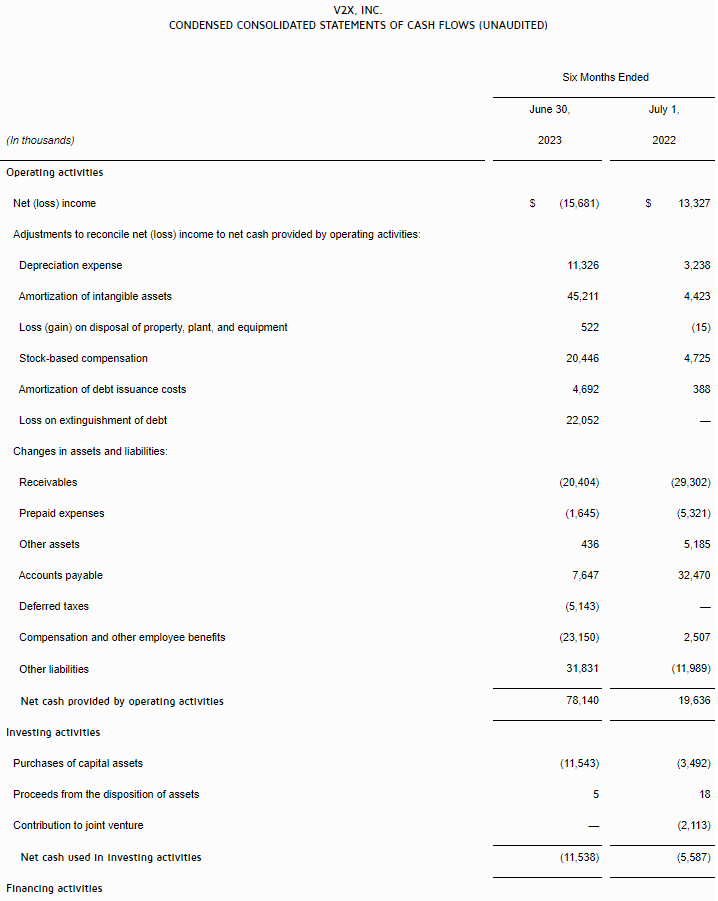
| Operating Cash Flow from continuing operations | $(8) | $(114) | $149 | $(84) |
| Free Cash Flow (2) | $(31) | $(135) | $97 | $(127) |
| Adjusted Free Cash Flow (3) | $(30) | $(121) | $103 | $(106) |
Second Quarter 2023 Summary(1)(2)(3)
- Total reported sales of $1.9 billion, down 6% versus the prior year, primarily due to lower sales in its Office Depot consumer division, largely driven by 68 fewer retail locations in service compared to the prior year, as well as lower retail and online consumer traffic and transactions
- GAAP operating income of $46 million and net income from continuing operations of $34 million, or $0.87 per diluted share, versus $28 million and $20 million, or $0.39 per diluted share, respectively in the prior year
- Adjusted operating income of $53 million, compared to $54 million in the second quarter of 2022; adjusted EBITDA of $86 million, compared to $91 million in the second quarter of 2022
- Adjusted net income from continuing operations of $39 million, or adjusted diluted earnings per share from continuing operations of $0.99, versus $39 million or $0.79, respectively in the prior year
- Operating cash flow from continuing operations of ($8 million) and adjusted free cash flow of ($30 million), versus $(114 million) and $(121 million), respectively in the prior year
- Repurchased 724 thousand shares for $31 million in the second quarter of 2023
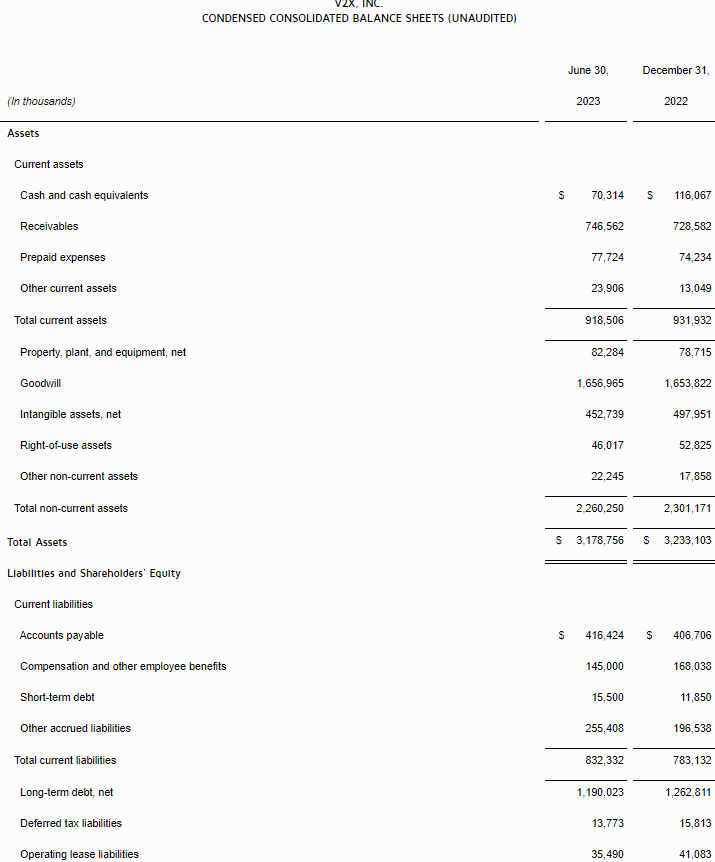
- $1.1 billion of total available liquidity including $335 million in cash and cash equivalents at quarter end
“Our continued focus on operational excellence and disciplined capital allocation drove solid operating results and a strong increase in earnings per share,” said Gerry Smith, chief executive officer of The ODP Corporation. “ODP Business Solutions led the way, expanding its margin profile and driving an impressive year-over-year increase in operating income. Veyer added new third-party business, remaining on-track to more than double external EBITDA in 2023, and Varis continues to onboard customers and incorporate feedback and new features onto its platform. While the weaker macroeconomic environment and somewhat sluggish consumer activity created top-line headwinds in our consumer business during the quarter, Office Depot continued to provide a superior customer experience and we are encouraged by our expanded assortment, which positions us well for the upcoming back-to-school selling season.”
“Combining our solid operating performance with our continued disciplined capital allocation, which included repurchasing about $31 million of our shares in the quarter, we drove an impressive 25% year-over-year increase in adjusted earnings per share in the second quarter,” Smith continued.
“Our low-cost business model, multiple routes to market, and strong balance sheet have us well positioned to continue navigating the ongoing challenging macroeconomic conditions. Moving ahead, we will continue to drive operational excellence across our four business units and prioritize capital allocation, remaining squarely focused on driving value for our shareholders,” Smith concluded.
Consolidated Results
Reported (GAAP) Results
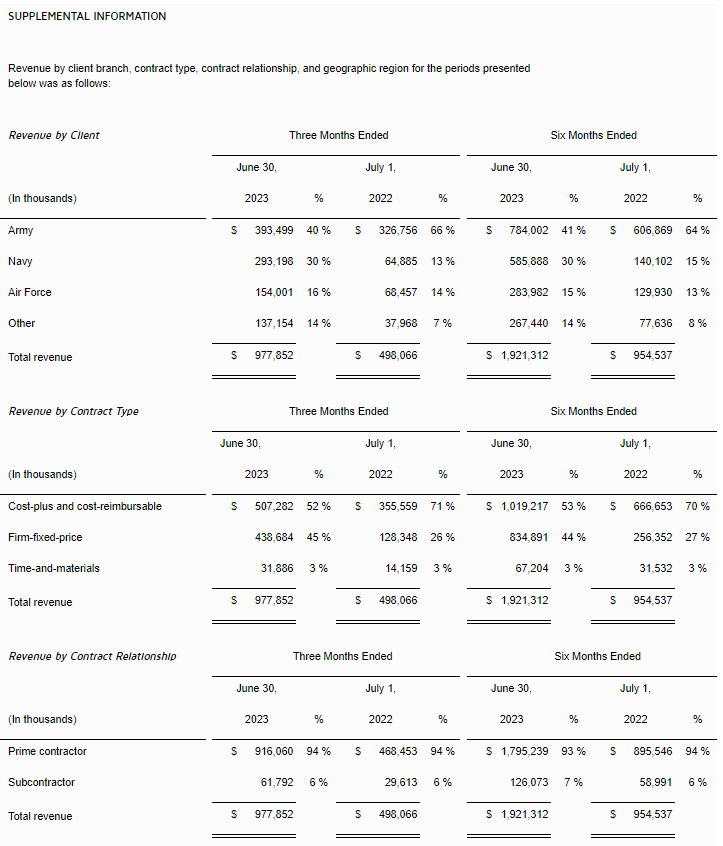
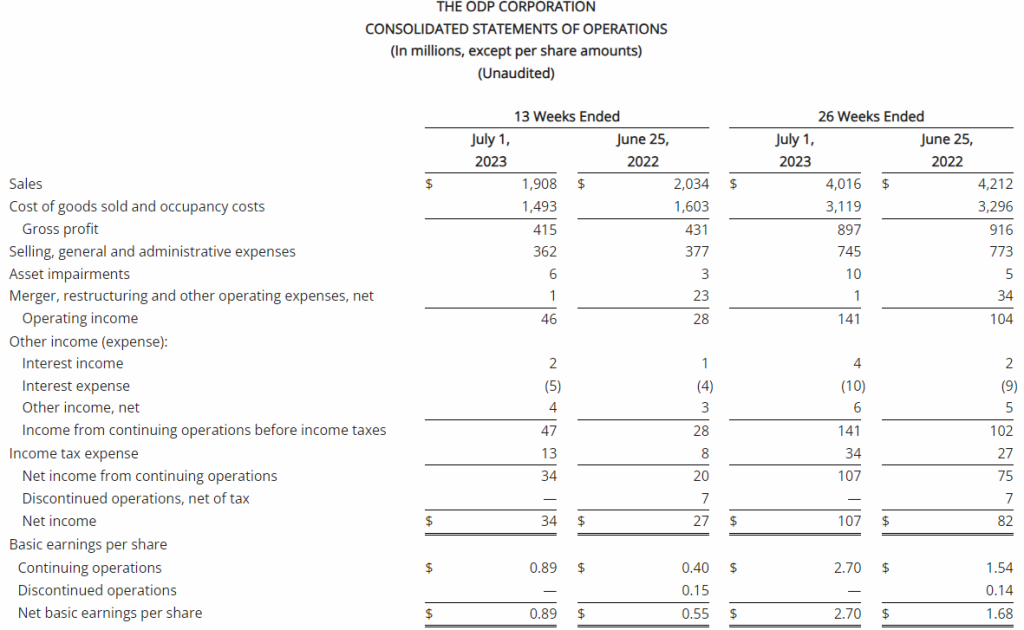
Total reported sales for the second quarter of 2023 were $1.9 billion, a decrease of 6% compared with the same period last year. This was driven primarily by lower sales in its consumer division, Office Depot, primarily due to 68 fewer stores in service compared to last year related to planned store closures, as well as lower retail and online consumer traffic. Sales at ODP Business Solutions Division were flat year over year, as increases in sales for paper and certain adjacency categories, and flexible pricing strategies, were largely offset by lower sales in product categories including ink, toner, office supplies and personal protective equipment. Additionally, Veyer provided strong logistics support for the ODP Business Solutions and Office Depot Divisions, and began to capture additional demand for its supply chain and procurement solutions among other third-party customers.
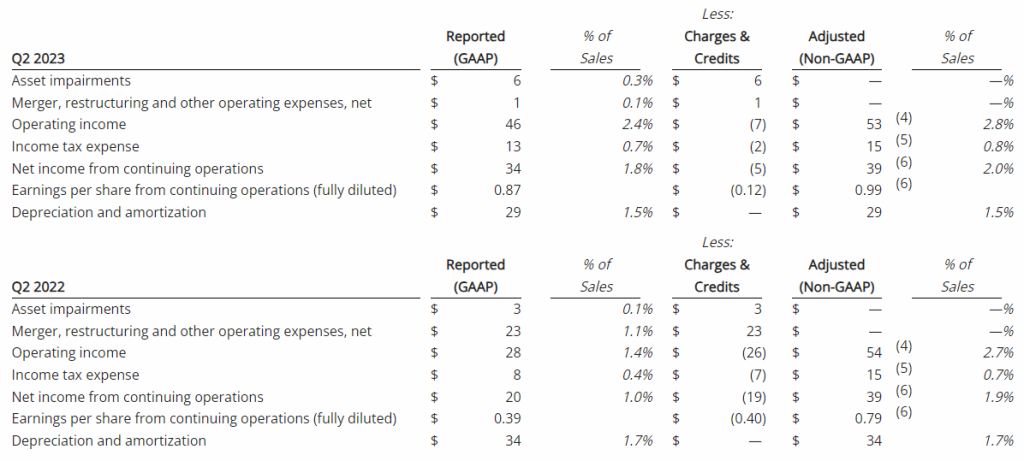
The Company reported operating income of $46 million in the second quarter of 2023, up 64% compared to operating income of $28 million in the prior year period. Operating results in the second quarter of 2023 included $7 million of charges. These charges consisted primarily of $6 million associated with non-cash asset impairments largely related to the operating lease right-of-use (ROU) assets associated with the Company’s retail store locations. Net income from continuing operations was $34 million, or $0.87 per diluted share in the second quarter of 2023, up from $20 million, or $0.39 per diluted share in the second quarter of 2022.
Adjusted (non-GAAP) Results(1)
Adjusted results for the second quarter of 2023 exclude charges and credits totaling $7 million as described above and the associated tax impacts.
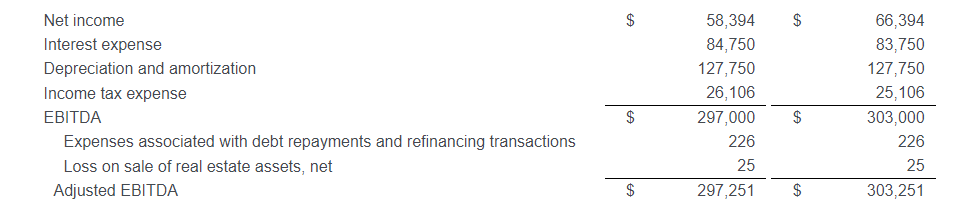
- Second quarter of 2023 adjusted EBITDA was $86 million compared to $91 million in the prior year period. This included depreciation and amortization of $29 million and $34 million in the second quarters of 2023 and 2022, respectively
- Second quarter of 2023 adjusted operating income was $53 million compared to $54 million in the second quarter of 2022
- Second quarter of 2023 adjusted net income from continuing operations was $39 million, or $0.99 per diluted share, compared to $39 million, or $0.79 per diluted share, in the second quarter of 2022, an increase of 25% on a per share basis
Division Results
ODP Business Solutions Division
Leading B2B distribution solutions provider serving small, medium and enterprise level companies with an annual trailing-twelve-month revenue in excess of $4 billion
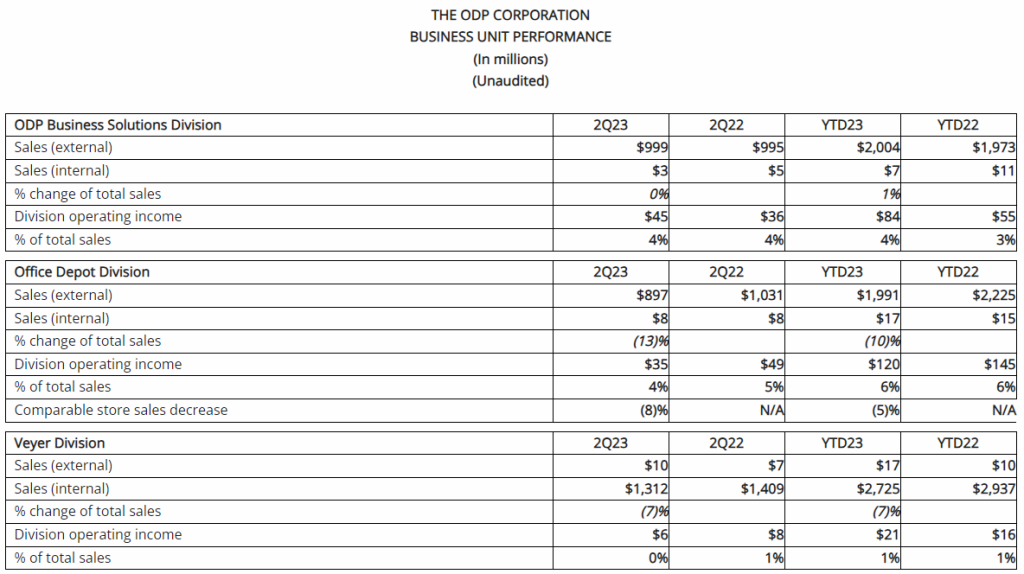
- Reported sales were $1.0 billion in the second quarter of 2023, flat compared to the same period last year, as return to the office trends and flexible pricing strategies were offset by higher levels of unemployment and other macroeconomic factors
- Drove strong sales in paper and adjacency categories, including furniture, cleaning and breakroom supplies, and copy and print services
- Total adjacency category sales, including cleaning and breakroom, furniture, technology, and copy and print, were 44% of total ODP Business Solutions’ sales
- Continued strong pipeline and signed renewed business in excess of $100 million in customer agreements
- Operating income was $45 million in the second quarter of 2023, up 25% over the same period last year, related primarily to higher gross margins. As a percentage of sales, operating income margin was 4.5%, up 100 basis points compared to the same period last year
Office Depot Division
Leading provider of retail consumer and small business products and services distributed via Office Depot and OfficeMax retail locations and an award-winning eCommerce presence
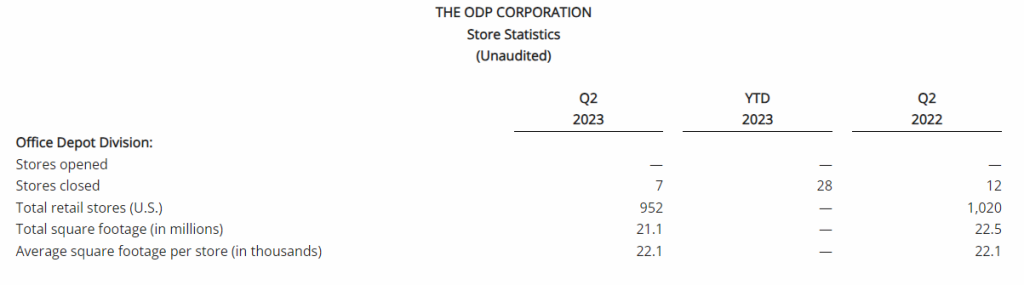
- Reported sales were $0.9 billion in the second quarter of 2023, down 13% compared to the prior year period partially due to 68 fewer retail outlets in service associated with planned store closures, as well as lower demand relative to last year in certain product categories and lower online sales. The Company closed 7 retail stores in the quarter and had 952 stores at quarter end. Sales were down approximately 8% on a comparable store basis
- Store traffic and demand relative to last year was negatively impacted by the recovery from the pandemic as a greater percentage of customers returned to the office, as well as weaker macroeconomic activity and higher unemployment
- Operating income was $35 million in the second quarter of 2023, compared to operating income of $49 million during the same period last year. As a percentage of sales, operating income was 4%, or down approximately 90 basis points compared to the same period last year. This result was primarily driven by the flow through impact from lower sales and impacts related to inflation
Veyer Division
Veyer is a supply chain, distribution, procurement and global sourcing operation, supporting Office Depot and ODP Business Solutions, as well as other third-party customers. Assets and capabilities of Veyer include approximately 9 million square feet of infrastructure; ~100 facilities (distribution centers, cross-docks, and direct import centers); a large private fleet of vehicles; and next-day delivery to 98.5% of US population
- In the second quarter of 2023, Veyer provided strong support for its internal customers, ODP Business Solutions and Office Depot, as well as for its third-party customers, generating sales of $1.3 billion
- Operating income was $6 million in the second quarter of 2023, down from $8 million in the prior year period related to lower sales in Office Depot
- In the quarter relative to last year, sales and EBITDA generated from third party customers was up nearly 62% and over 141%, respectively, resulting in sales of approximately $10 million and EBITDA of $3 million in the quarter
Varis Division
Varis is a tech-enabled B2B indirect procurement marketplace launched in the fourth quarter of 2022, which provides buyers and suppliers a seamless way to transact through the platform’s consumer-like buying experience and advanced spend management tools
- Successfully launched the platform in the fourth quarter of 2022; onboarding new customers, incorporating feedback, and adding new features to the platform
- Varis generated revenues in the quarter of $2 million, an increase of $1 million compared to the second quarter of 2022
- Operating loss was $14 million, compared to an operating loss of $16 million in the second quarter of 2022, primarily driven by lower employee related costs and as the division continued to invest in its business and worked to onboard customers
Share Repurchases
The Company continued to execute under its previously announced $1 billion share repurchase authorization, available through year-end 2025. During the second quarter of 2023, the Company repurchased 724 thousand shares for $31 million. Since the inception of the authorization beginning in November 2022, the Company has repurchased approximately 8.3 million shares for $387 million.
The number of shares to be repurchased in the future and the timing of such transactions will depend on a variety of factors, including market conditions, regulatory requirements, and other corporate considerations. The current authorization could be suspended or discontinued at any time as determined by the Board of Directors.
Balance Sheet and Cash Flow
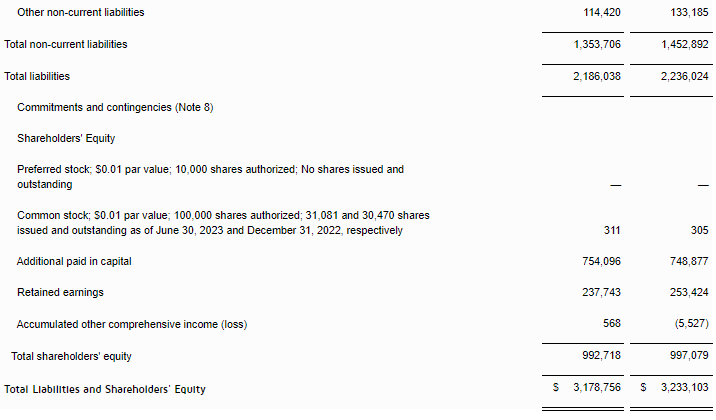
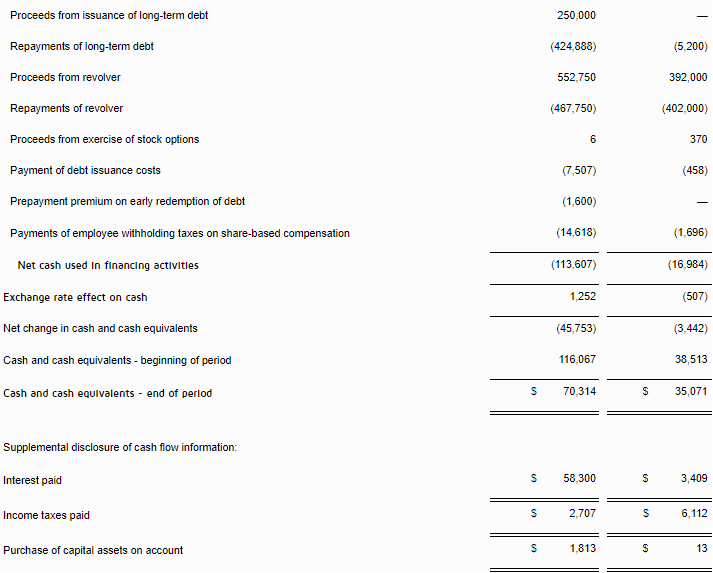
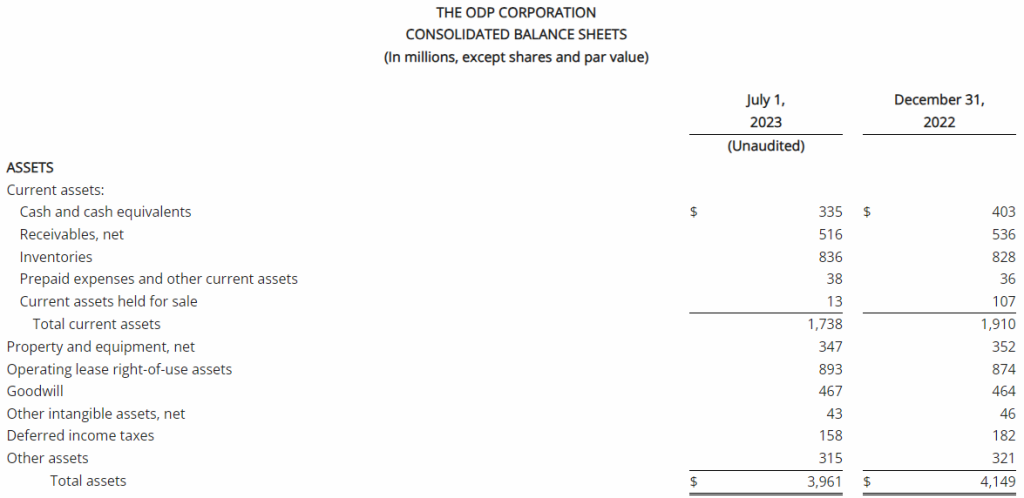
As of July 1, 2023, ODP had total available liquidity of approximately $1.1 billion, consisting of $335 million in cash and cash equivalents and $811 million of available credit under the Third Amended Credit Agreement. Total debt was $181 million.
For the second quarter of 2023, cash used by operating activities of continuing operations was $8 million, which included $1 million in restructuring and other spend, compared to cash used by operating activities of continuing operations of $114 million in the second quarter of the prior year, which included $14 million in restructuring and other spend. The year-over-year improvement in operating cash flow largely related to stronger operating results, prudent inventory management, and timing of certain working capital items.
Capital expenditures in the second quarter of 2023 were $23 million versus $21 million in the prior year period, reflecting continuing growth investments in the Company’s digital transformation, distribution network, and eCommerce capabilities. Adjusted Free Cash outflow(3) was $30 million in the second quarter of 2023, a significant improvement compared to $121 million outflow in the prior year period.
“I would like to thank our entire team for their continued efforts on carefully managing inventory and other working capital items, which resulted in significantly stronger year-over-year cash flow in the quarter,” said Anthony Scaglione, executive vice president and chief financial officer of The ODP Corporation. “As we move into the second half of the year, we will maintain our disciplined approach and focus on managing operating costs, maximizing cash flow in our business, and optimizing our capital allocation plan,” Scaglione added.
Updated 2023 Expectations
“We remain cautiously optimistic about the second half of the year and are excited about the opportunity to continue driving operational excellence and delivering strong value for our shareholders,” said Smith. “While we recognize that the challenging macroeconomic environment is causing somewhat sluggish consumer activity and market disruptions, we’re enthusiastic about our strong position and are focused on driving the assets we control to deliver long-term profitable growth. Through executing along our three horizons strategy, driving our four business unit model, and remaining focused on prudently deploying capital to maximize shareholder value, we’re on a path to unlocking ODP’s potential, creating a compelling value proposition for all of our stakeholders.”
The Company’s full year guidance for 2023 included in this release includes non-GAAP measures, such as adjusted EBITDA, Adjusted Operating Income, Adjusted Earnings per Share and Adjusted Free Cash Flow. These measures exclude charges or credits not indicative of core operations, which may include but not be limited to merger integration expenses, restructuring charges, acquisition-related costs, executive transition costs, asset impairments and other significant items that currently cannot be predicted without unreasonable efforts. The exact amount of these charges or credits are not currently determinable but may be significant. Accordingly, the Company is unable to provide equivalent GAAP measures or reconciliations from GAAP to non-GAAP for these financial measures without unreasonable effort.
The Company is updating its full year guidance for 2023 as follows:
| Previous 2023 Guidance | Updated 2023 Guidance | |
| Sales | $8.0 – $8.4 billion | Revised to approximately $8 billion |
| Adjusted EBITDA | $400 – $430 million | Affirmed |
| Adjusted Operating Income | $270 – $300 million | Affirmed |
| Adjusted Earnings per Share(*) | $4.50 – $5.10 per share | Revised to $5.00 – $5.30 per share |
| Adjusted Free Cash Flow(**) | $200 – $230 million | Affirmed |
| Capital Expenditures | $100 – $120 million | Affirmed |
| *Adjusted Earnings per Share (EPS) guidance for 2023 excludes potential discrete (tax) items that may affect quarter to quarter fluctuations and includes expected impact from share repurchases | ||
| **Adjusted Free Cash Flow is defined as cash flows from operating activities less capital expenditures excluding cash charges associated with the Company’s Maximize B2B Restructuring and expenses incurred in connection with our previously planned separation of the consumer business and re-alignment | ||
“We delivered solid performance in the first half of the year and remain in a strong capital position with our low-cost business model mindset,” said Scaglione. “While we’re cautious on the state of the consumer and general macroeconomic conditions, our continued focus on operational excellence has us well positioned to continue driving solid results for the balance of the year. Our updated guidance assumes stabilization in overall economic trends in the second half of 2023 and reflects our expectations for revenue trends given first half performance, confirming the low end of our previous full-year revenue guidance range, while reaffirming all other operating metrics and increasing our earnings per share guidance given our strong performance to date, lower than expected interest and tax expense, and continued share buyback activity,” Scaglione added.
The ODP Corporation will webcast a call with financial analysts and investors on August 9, 2023, at 9:00 am Eastern Time, which will be accessible to the media and the general public. To listen to the conference call via webcast, please visit The ODP Corporation’s Investor Relations website at investor.theodpcorp.com. A replay of the webcast will be available approximately two hours following the event.
| (1) | As presented throughout this release, adjusted results represent non-GAAP financial measures and exclude charges or credits not indicative of core operations and the tax effect of these items, which may include but not be limited to merger integration, restructuring, acquisition costs, and asset impairments. Reconciliations from GAAP to non-GAAP financial measures can be found in this release as well as on the Company’s Investor Relations website at investor.theodpcorp.com. | |
| (2) | As used in this release, Free Cash Flow is defined as cash flows from operating activities less capital expenditures. Free Cash Flow is a non-GAAP financial measure and reconciliations from GAAP financial measures can be found in this release as well as on the Company’s Investor Relations website at investor.theodpcorp.com. | |
| (3) | As used in this release, Adjusted Free Cash Flow is defined as Free Cash Flow excluding cash charges associated with the Company’s Maximize B2B Restructuring, and expenses incurred in connection with our previously planned separation of the consumer business and re-alignment. Adjusted Free Cash Flow is a non-GAAP financial measure and reconciliations from GAAP financial measures can be found in this release as well as on the Company’s Investor Relations website at investor.theodpcorp.com. |
About The ODP Corporation
The ODP Corporation (NASDAQ:ODP) is a leading provider of products, services, and technology solutions through an integrated business-to-business (B2B) distribution platform and omni-channel presence, which includes world-class supply chain and distribution operations, dedicated sales professionals, a B2B digital procurement solution, online presence, and a network of Office Depot and OfficeMax retail stores. Through its operating companies Office Depot, LLC; ODP Business Solutions, LLC; Veyer, LLC; and Varis, Inc, The ODP Corporation empowers every business, professional, and consumer to achieve more every day. For more information, visit theodpcorp.com.
ODP and ODP Business Solutions are trademarks of ODP Business Solutions, LLC. Office Depot is a trademark of The Office Club, LLC. OfficeMax is a trademark of OMX, Inc. Veyer is a trademark of Veyer, LLC. Varis is a trademark of Varis, Inc. Grand&Toy is a trademark of Grand & Toy, LLC in Canada. ©2023 Office Depot, LLC. All rights reserved. Any other product or company names mentioned herein are the trademarks of their respective owners.
FORWARD LOOKING STATEMENTS
This communication may contain forward-looking statements within the meaning of the Private Securities Litigation Reform Act of 1995. These statements or disclosures may discuss goals, intentions and expectations as to future trends, plans, events, results of operations, cash flow or financial condition, the potential impacts on our business due to the unknown severity and duration of the COVID-19 pandemic, or state other information relating to, among other things, the Company, based on current beliefs and assumptions made by, and information currently available to, management. Forward-looking statements generally will be accompanied by words such as “anticipate,” “believe,” “plan,” “could,” “estimate,” “expect,” “forecast,” “guidance,” “expectations”, “outlook,” “intend,” “may,” “possible,” “potential,” “predict,” “project,” “propose” or other similar words, phrases or expressions, or other variations of such words. These forward-looking statements are subject to various risks and uncertainties, many of which are outside of the Company’s control. There can be no assurances that the Company will realize these expectations or that these beliefs will prove correct, and therefore investors and stakeholders should not place undue reliance on such statements.
Factors that could cause actual results to differ materially from those in the forward-looking statements include, among other things, highly competitive office products market and failure to differentiate the Company from other office supply resellers or respond to decline in general office supplies sales or to shifting consumer demands; competitive pressures on the Company’s sales and pricing; the risk that the Company is unable to transform the business into a service-driven, B2B platform that such a strategy will not result in the benefits anticipated; the risk that the Company will not be able to achieve the expected benefits of its strategic plans, including its strategic shift to maintain all of its businesses under common ownership; the risk that the Company may not be able to realize the anticipated benefits of acquisitions due to unforeseen liabilities, future capital expenditures, expenses, indebtedness and the unanticipated loss of key customers or the inability to achieve expected revenues, synergies, cost savings or financial performance; the risk that the Company is unable to successfully maintain a relevant omni-channel experience for its customers; the risk that the Company is unable to execute the Maximize B2B Restructuring Plan successfully or that such plan will not result in the benefits anticipated; failure to effectively manage the Company’s real estate portfolio; loss of business with government entities, purchasing consortiums, and sole- or limited- source distribution arrangements; failure to attract and retain qualified personnel, including employees in stores, service centers, distribution centers, field and corporate offices and executive management, and the inability to keep supply of skills and resources in balance with customer demand; failure to execute effective advertising efforts and maintain the Company’s reputation and brand at a high level; disruptions in computer systems, including delivery of technology services; breach of information technology systems affecting reputation, business partner and customer relationships and operations and resulting in high costs and lost revenue; unanticipated downturns in business relationships with customers or terms with the suppliers, third-party vendors and business partners; disruption of global sourcing activities, evolving foreign trade policy (including tariffs imposed on certain foreign made goods); exclusive Office Depot branded products are subject to additional product, supply chain and legal risks; product safety and quality concerns of manufacturers’ branded products and services and Office Depot private branded products; covenants in the credit facility; general disruption in the credit markets; incurrence of significant impairment charges; retained responsibility for liabilities of acquired companies; fluctuation in quarterly operating results due to seasonality of the Company’s business; changes in tax laws in jurisdictions where the Company operates; increases in wage and benefit costs and changes in labor regulations; changes in the regulatory environment, legal compliance risks and violations of the U.S. Foreign Corrupt Practices Act and other worldwide anti-bribery laws; volatility in the Company’s common stock price; changes in or the elimination of the payment of cash dividends on Company common stock; macroeconomic conditions such as higher interest rates and future declines in business or consumer spending; increases in fuel and other commodity prices and the cost of material, energy and other production costs, or unexpected costs that cannot be recouped in product pricing; unexpected claims, charges, litigation, dispute resolutions or settlement expenses; catastrophic events, including the impact of weather events on the Company’s business; the discouragement of lawsuits by shareholders against the Company and its directors and officers as a result of the exclusive forum selection of the Court of Chancery, the federal district court for the District of Delaware or other Delaware state courts by the Company as the sole and exclusive forum for such lawsuits; and the impact of the COVID-19 pandemic on the Company’s business. The foregoing list of factors is not exhaustive. Investors and shareholders should carefully consider the foregoing factors and the other risks and uncertainties described in the Company’s Annual Reports on Form 10-K, Quarterly Reports on Form 10-Q, and Current Reports on Form 8-K filed with the U.S. Securities and Exchange Commission. The Company does not assume any obligation to update or revise any forward-looking statements.


THE ODP CORPORATION
GAAP to Non-GAAP Reconciliations
(Unaudited)
We report our results in accordance with accounting principles generally accepted in the United States (“GAAP”). We also review certain financial measures excluding impacts of transactions that are not related to our core operations (“non-GAAP”). Management believes that the presentation of these non-GAAP financial measures enhances the ability of its investors to analyze trends in its business and provides a means to compare periods that may be affected by various items that might obscure trends or developments in its business. Management uses both GAAP and non-GAAP measures to assist in making business decisions and assessing overall performance. Non-GAAP measures help to evaluate programs and activities that are intended to attract and satisfy customers, separate from expenses and credits directly associated with Merger, restructuring, and certain similar items. Certain non-GAAP measures are also used for short and long-term incentive programs.
Our measurement of these non-GAAP financial measures may be different from similarly titled financial measures used by others and therefore may not be comparable. These non-GAAP financial measures should not be considered superior to the GAAP measures, but only to clarify some information and assist the reader. We have included reconciliations of this information to the most comparable GAAP measures in the tables included within this material.
Free cash flow is a non-GAAP measure, which we define as cash flows from operating activities less capital expenditures. We believe that free cash flow is an important indicator that provides additional perspective on our ability to generate cash to fund our strategy and expand our distribution network. Adjusted free cash flow is also a non-GAAP measure, which we define as free cash flow excluding cash charges associated with the Company’s Maximize B2B Restructuring, and the previously planned separation of the consumer business and re-alignment.
(In millions, except per share amounts)


View source version on businesswire.com: https://www.businesswire.com/news/home/20230809992062/en/
Tim Perrott
Investor Relations
561-438-4629
[email protected]
Source: The ODP Corporation