SASKATOON, Saskatchewan, Canada, September 1, 2023 – MustGrow Biologics Corp. (TSXV: MGRO) (OTC: MGROF) (FRA: 0C0) (the “Company” or “MustGrow”), today announced that the board of directors of the Company authorized and approved the grant of a total of 612,757 deferred share units (“DSUs”) and 177,035 restricted share units (“RSUs”) to certain directors, officers, and consultants of the Company, effective August 31, 2023. This grant of DSUs and RSUs is made pursuant to the Company’s Omnibus Equity Incentive Plan (the “Plan”).
The RSUs will vest on March 28, 2024. Once vested, each RSU will entitle the recipient to receive one common share in the capital of the Company or a cash payment equivalent thereof at the discretion of the Company. The DSUs will vest in accordance with the terms of the Plan immediately upon grant. Settlement of the DSUs will occur when a holder ceases to be a director, officer or employee of the Company or any of its affiliates, as applicable. On settlement, each DSU will entitle the recipient to receive one common share in the capital of the Company or a cash payment equivalent thereof at the discretion of the Company.
———
About MustGrow
MustGrow is an agriculture biotech company developing organic biocontrol, soil amendment and biofertility products by harnessing the natural defense mechanism and organic materials of the mustard plant to sustainably protect the global food supply and help farmers feed the world. MustGrow and its leading global partners — Janssen PMP (pharmaceutical division of Johnson & Johnson), Bayer, Sumitomo Corporation, and Univar Solutions’ NexusBioAg — are developing mustard-based organic solutions to potentially replace harmful synthetic chemicals. Concurrently, with new formulations derived from food-grade mustard, the Company is pursuing the adoption and use of its technology in the soil amendment and biofertily markets. Over 150 independent tests have been completed, validating MustGrow’s safe and effective approach to crop and food protection and yield enhancements. Pending regulatory approval, MustGrow’s patented liquid products could be applied through injection, standard drip or spray equipment, improving functionality and performance features. Now a platform technology, MustGrow and its global partners are pursuing applications in several different industries from preplant soil treatment and weed control, to postharvest disease control and food preservation, to soil amendment and biofertility. MustGrow has approximately 50.1 million basic common shares issued and outstanding and 56.3 million shares fully diluted. For further details, please visit www.mustgrow.ca.
This release does not constitute an offer for sale of, nor a solicitation for offers to buy, any securities in the United States.
Neither the TSXV, nor their Regulation Services Provider (as that term is defined in the policies of the TSXV), nor the OTC Markets has approved the contents of this release or accepts responsibility for the adequacy or accuracy of this release.
Toronto, August 31, 2023 – Eskay Mining Corp. (“Eskay” or the “Company”) (TSX-V:ESK) (OTCQX: ESKYF) (Frankfurt:KN7)(WKN:A0YDPM) is pleased to announce it has recently drilled significant intervals of stockwork and/or massive sulfide mineralization at four new targets as part of its 2023 diamond drill campaign at its 100% controlled Consolidated Eskay Gold Project in the Golden Triangle of British Columbia. Precious metal-rich volcanogenic massive sulfide (“VMS”) deposits are the focus of Eskay’s exploration.
As of this news release, Eskay Mining has drilled approximately 4,300m of its planned 6,500m 2023 diamond drill campaign. In Company news releases dated May 18 and July 27, 2023, seven new targets were discussed as subjects of this year’s exploration campaign: Tarn Lake, Maroon Cliffs, Hexagon-Mercury, Storie Creek, Cumberland, Scarlet Knob-Bruce Glacier and TV South (Figure 1). Drilling at Tarn Lake, Scarlet Knob-Bruce Glacier, Hexagon-Mercury and Cumberland have yielded significant intercepts of stockwork and/or massive sulfide mineralization. Results are summarized below:
Cumberland: This target is situated approximately five km south of the TV deposit, subject of substantial drilling over the past three seasons. No appreciable work has been conducted in this area for at least twenty years. A current total of five drill holes have been completed by Eskay Mining this season, each intercepting seafloor-proximal stockwork and massive sulfide mineralization (Figures 3 and 4) over core lengths of approximately 25 to 85 meters. Spot XRF analyses indicates these intercepts are highly elevated in silver, copper, lead, zinc, arsenic, antimony and tellurium. Gold analysis by XRF is unreliable. This VMS deposit appears to strike NNW and dips moderately steeply to the east. Its stratigraphic position is believed to be in the Upper Hazelton Group at a level similar to the Eskay Creek deposit located approximately 20 km north. Like TV, Cumberland is situated on the eastern limb of the Eskay Anticline. The Company has one additional hole planned at Cumberland to follow up on this exciting new discovery.
Scarlet Knob-Bruce Glacier: This target is situated along the eastern side of the toe of Bruce Glacier in an area where spot rock chip sampling returned several Au- and Ag-bearing assays, including one with 56 gpt Au last season. To date, four drill holes have probed the westward dipping succession of volcanic rocks in search of the paleo-sea floor exhalative position of the VMS system. All four holes have encountered significant intervals of 20-50m of intense stockwork mineralization followed by mudstone thought to represent the overlapping paleo-sea floor strata (Figure 5). Like Cumberland, spot XRF analyses indicates this stockwork mineralization is highly elevated in silver, copper, lead, zinc, arsenic, and antimony. Mineralization is believed to be hosted in the lower part of the Hazelton Formation. Further drilling will be conducted in an area approximately 200 m north of holes drilled to date near a newly discovered outcrop of base-metal-rich VMS mineralization (Figure 6). This exciting newly discovered massive sulfide mineralization is thought to be at or very close to the paleo-sea floor position.
Tarn Lake: The Tarn-Lake target is situated on the west side of Bruce Glacier and saw limited drilling in 2022 that yielded encouraging precious metal results. Three holes completed to date have encountered sulfide stockwork mineralization ranging from 30-130m in length, much longer than recorded in drilling in 2022. Spot XRF analyses indicates this stockwork mineralization is highly elevated in silver, copper, lead, zinc, arsenic, and antimony. Mineralization is thought to be hosted by rocks in the lower part of the Hazelton Formation near a paleo-sea floor position much like Scarlet-Knob-Bruce Glacier to the east. One additional hole is being drilled at this exciting discovery this year.
Hexagon-Mercury: Targeting at Hexagon-Mercury, situated on the western flank of the Eskay Anticline approximately 9 km south of Eskay Creek mine, has been driven by geophysical anomalies interpreted by Riaz Mirza of Simcoe Geoscience. The first of two drill holes completed to date yielded an intercept of over 100m of appreciable stockwork sulfide mineralization hosted by volcanic rock thought to be part of the lower Hazelton Group.Spot XRF analyses indicate this stockwork is moderately to strongly anomalous in arsenic and other pathfinder elements. Eskay Mining is contemplating following up this discovery with further drilling this season.
The last target to be drill tested this season is Storie Creek, an as yet undrilled area situated just 3.5 km SSE of the Eskay Creek mine (Figure 2). Recent geologic interpretation by Eskay Mining’s team discussed in a Company news release dated July 27, 2023 indicates that uppermost Hazelton Group strata including the Contact Mudstone sub-crops underneath the NE-trending Storie Creek drainage and dips gently northwestward underneath a veneer of post-mineral Bowser Lake Formation sedimentary rocks. Extensive gossanous outcrops of Upper Hazelton Formation rocks were discovered along the eastern side of Storie Creek over a strike length of at least 4 km. Gossan forms from weathering of sulfides that may be associated with mineralization. Upon review of historic soil data dating back to the early 1990’s, Eskay’s geologic team has identified two areas where high silver-in-soil values occur, an indication that the Storie Creek gossanous outcrops are likely associated with mineralization. Two drill holes are planned at Storie Creek beginning in a few days.
One hole completed at TV South failed to encounter significant mineralization, however favorable volcanic host-rocks and VMS-related alteration were observed in drill core. Subsequent field discoveries of sulfide rich outcrops in areas nearby suggest this hole was drilled in an unfavorable orientation and that further exploration work is warranted at TV South. Two drill holes completed at the Maroon Cliffs target failed to encounter appreciable mineralization.
Drilling at the Consolidated Eskay Project is expected to finish by mid-September. Assays from the first holes of the 2023 program are expected back late September.
Dr. Quinton Hennigh, P. Geo., a Director of the Company and its technical adviser, a qualified person as defined by National Instrument 43-101, has reviewed and approved the technical contents of this news release.
About Eskay Mining Corp:
Eskay Mining Corp (TSX-V:ESK) is a TSX Venture Exchange listed company, headquartered in Toronto, Ontario. Eskay is an exploration company focused on the exploration and development of precious and base metals along the Eskay rift in a highly prolific region of northwest British Columbia known as the “Golden Triangle,” 70km northwest of Stewart, BC. The Company currently holds mineral tenures in this area comprised of 177 claims (52,600 hectares).
All material information on the Company may be found on its website at www.eskaymining.com and on SEDAR at www.sedar.com.
Neither the TSX Venture Exchange nor its Regulation Services Provider (as that term is defined in the policies of the TSX Venture Exchange) accepts responsibility for the adequacy or accuracy of this release.
Forward-Looking Statements: This Press Release contains forward-looking statements that involve risks and uncertainties, which may cause actual results to differ materially from the statements made. When used in this document, the words “may”, “would”, “could”, “will”, “intend”, “plan”, “anticipate”, “believe”, “estimate”, “expect” and similar expressions are intended to identify forward-looking statements. Such statements reflect our current views with respect to future events and are subject to risks and uncertainties. Many factors could cause our actual results to differ materially from the statements made, including those factors discussed in filings made by us with the Canadian securities regulatory authorities. Should one or more of these risks and uncertainties, such as actual results of current exploration programs, the general risks associated with the mining industry, the price of gold and other metals, currency and interest rate fluctuations, increased competition and general economic and market factors, occur or should assumptions underlying the forward looking statements prove incorrect, actual results may vary materially from those described herein as intended, planned, anticipated, or expected. We do not intend and do not assume any obligation to update these forward-looking statements, except as required by law. Shareholders are cautioned not to put undue reliance on such forward-looking statements.
(Figure 1. Plan view of Eskay Mining’s land holdings at Consolidate Eskay Gold Project. The blue line indicates the position of the cross section in Figure 2.)
(Figure 2. Cross-sectional interpretation of the geology of the corridor extending from Eskay Creek mine in the northwest to Scarlet Knob in the southeast. See Figure 1 for location. View is to the northeast and field of view is approximately 8 km. At Eskay Creek, mineralization occurs in and around three horizons, all at one time sea floor positions, the Contact Mudstone, Lower Mudstone and Even Lower Mudstone, belonging to the Hazelton Group. Storie Creek and the region extending approximately 2 km to the northwest has strong potential to host these same three stratigraphic horizons making this a uniquely prospective target. At Tarn Lake, Bruce Glacier and Scarlet Knob, the lowest sea floor position is the focus of exploration.)
(Figure 3. Seafloor-proximal sulfide mineralization in drill hole CBL23-28. Stockwork sulfide mineralization infills the host pillow andesite breccia, and transitions to semi-massive replacement-style mineralization just below the paleoseafloor position. Seafloor-hosted sulfide mineralization is massive, and is associated with barite breccia. This style of mineralization and alteration is consistent with a seafloor position. All styles of sulfide mineralization intercepted at Cumberland are highly polymetallic with abundant pyrite, sphalerite, galena, chalcopyrite, arsenopyrite and Ag-sulfosalt minerals. The Au pathfinder elements mercury and tellurium are highly enriched at Cumberland as determined by handheld XRF analyses.)
(Figure 4. Seafloor-proximal sulfide mineralization in drill hole CBL23-29. Stockwork mineralization was intercepted as deep as 120 m in this hole, and transitions to semi-massive replacement-style mineralization hosted by pillow andesite and associated with barite alteration. Immediately overlying the pillow andesite is massive sulfide infilling barite breccia. This style of mineralization and alteration is consistent with a seafloor position. All styles of sulfide mineralization intercepted at Cumberland are highly polymetallic with abundant pyrite, sphalerite, galena, chalcopyrite, arsenopyrite and Ag-sulfosalt minerals. The Au pathfinder elements mercury and tellurium are highly enriched at Cumberland as determined by handheld XRF analyses.)
(Figure 5. The paleoseafloor position at Scarlet Knob intercepted by drill hole SKN23-01 is characterized by intensely silicified rhyolite that hosts sulfide stockwork mineralization. Immediately overlying the rhyolite is an unaltered mudstone that contains large blobs of Ag-bearing sulfide minerals. The asymmetric alteration between the rhyolite and the mudstone is a key indicator of the seafloor position in VMS systems. Identification of the seafloor horizon in drill core enabled our team to locate the same stratigraphic position along strike approximately 200 m to the north of SKN23-01.)
(Figure 6. The gossan outlined in green in the top image delineates the zone of semi-massive to massive sulfide identified by our field team (note the two geologists for scale). The image at bottom shows one of several samples of massive polymetallic sulfide collected along the trend of mineralization. Galena, pyrite, and chalcopyrite are the dominant sulfide minerals along this trend.)
Company to Provide Updates on Multiple Phase 2 Clinical Trials
for GEO-CM04S1 and Gedeptin®
ATLANTA, GA, August 31, 2023 – GeoVax Labs, Inc. (Nasdaq: GOVX), a biotechnology company developing immunotherapies and vaccines against cancers and infectious diseases, today announced that it will present a company overview and host investor meetings during the H.C. Wainwright 25th Annual Global Investment Conference being held September 11-13, 2023 in New York City.
Presentation Details:
Presenter: David Dodd, Chairman & CEO
Date/Time: 2:30pm ET, September 11, 2023
Location: Lotte New York Palace Hotel, New York, NY
Webcast: A webcast of the presentation will be available here:
About GeoVax
GeoVax Labs, Inc. is a clinical-stage biotechnology company developing novel therapies and vaccines for solid tumor cancers and many of the world’s most threatening infectious diseases. The company’s lead program in oncology is a novel oncolytic solid tumor gene-directed therapy, Gedeptin®, presently in a multicenter Phase 1/2 clinical trial for advanced head and neck cancers. GeoVax’s lead infectious disease candidate is GEO-CM04S1, a next-generation COVID-19 vaccine targeting high-risk immunocompromised patient populations. Currently in three Phase 2 clinical trials, GEO-CM04S1 is being evaluated as a primary vaccine for immunocompromised patients such as those suffering from hematologic cancers and other patient populations for whom the current authorized COVID-19 vaccines are insufficient, and as a booster vaccine in patients with chronic lymphocytic leukemia (CLL). In addition, GEO-CM04S1 is in a Phase 2 clinical trial evaluating the vaccine as a more robust, durable COVID-19 booster among healthy patients who previously received the mRNA vaccines. GeoVax has a leadership team who have driven significant value creation across multiple life science companies over the past several decades. For more information, visit our website: www.geovax.com.
Contact:
Last updated: 31 August 2023 13:05
Created: 31 August 2023 14:20
Hits: 9
Company to Provide Updates on Multiple Phase 2 Clinical Trials
for GEO-CM04S1 and Gedeptin®
ATLANTA, GA, August 31, 2023 – GeoVax Labs, Inc. (Nasdaq: GOVX), a biotechnology company developing immunotherapies and vaccines against cancers and infectious diseases, today announced that it will present a company overview and host investor meetings during the H.C. Wainwright 25th Annual Global Investment Conference being held September 11-13, 2023 in New York City.
Presentation Details:
Presenter: David Dodd, Chairman & CEO
Date/Time: 2:30pm ET, September 11, 2023
Location: Lotte New York Palace Hotel, New York, NY
Webcast: A webcast of the presentation will be available here:
About GeoVax
GeoVax Labs, Inc. is a clinical-stage biotechnology company developing novel therapies and vaccines for solid tumor cancers and many of the world’s most threatening infectious diseases. The company’s lead program in oncology is a novel oncolytic solid tumor gene-directed therapy, Gedeptin®, presently in a multicenter Phase 1/2 clinical trial for advanced head and neck cancers. GeoVax’s lead infectious disease candidate is GEO-CM04S1, a next-generation COVID-19 vaccine targeting high-risk immunocompromised patient populations. Currently in three Phase 2 clinical trials, GEO-CM04S1 is being evaluated as a primary vaccine for immunocompromised patients such as those suffering from hematologic cancers and other patient populations for whom the current authorized COVID-19 vaccines are insufficient, and as a booster vaccine in patients with chronic lymphocytic leukemia (CLL). In addition, GEO-CM04S1 is in a Phase 2 clinical trial evaluating the vaccine as a more robust, durable COVID-19 booster among healthy patients who previously received the mRNA vaccines. GeoVax has a leadership team who have driven significant value creation across multiple life science companies over the past several decades. For more information, visit our website: www.geovax.com.
Iconic Dessert Duo Bring Cookie and Ice Cream Concept to Happy Valley
LOS ANGELES, Aug. 31, 2023 (GLOBE NEWSWIRE) — FAT (Fresh. Authentic. Tasty.) Brands Inc., parent company of Great American Cookies, Marble Slab Creamery and 15 other restaurant concepts, announces the opening of a co-branded Great American Cookies and Marble Slab Creamery location in Happy Valley, Oregon. Situated in Clackamas County, the new store marks the first Pacific Northwest location for both brands.
“We are thrilled to introduce our co-branded Great American Cookies and Marble Slab Creamery concept to the Pacific Northwest for the first time,” said Allison Lauenstein, President of the QSR Division at FAT Brands, Inc. “Both brands are known worldwide for crafting mouthwatering freshly made sweets, including Cookie Cakes, Cookies and Ice Cream that bring joy to our customers. With this opening marking the first in the region, we’re excited to create an unparalleled dessert experience that will resonate with the Happy Valley community and residents in the greater Portland area.”
For nearly 40 years, Marble Slab Creamery has been an innovator in the ice cream space, dreaming up the frozen slab technique and offering homemade, small-batch ice cream with free unlimited mix-ins, shakes in a variety of flavors, and ice cream cakes.
Since 1977, Great American Cookies has baked up a reputation for not only being the creator of the Original Cookie Cake, but also for its famous chocolate chip cookie recipe. Other craveable menu items include brownies and Double Doozies™, made with delectable icing sandwiched between two cookies.
The co-branded Great American Cookies and Marble Slab Creamery is located at 13200 SE 172nd Ave., Suite 148, Happy Valley, Ore., 97086, and is open Monday through Sunday from 10:00 a.m. to 8:00 p.m. For more information on Great American Cookies, visit www.greatamericancookies.com. For more information on Marble Slab Creamery, visit www.marbleslab.com.
About FAT (Fresh. Authentic. Tasty.) Brands
FAT Brands (NASDAQ: FAT) is a leading global franchising company that strategically acquires, markets, and develops fast casual, quick-service, casual dining, and polished casual dining concepts around the world. The Company currently owns 17 restaurant brands: Round Table Pizza, Fatburger, Marble Slab Creamery, Johnny Rockets, Fazoli’s, Twin Peaks, Great American Cookies, Hot Dog on a Stick, Buffalo’s Cafe & Express, Hurricane Grill & Wings, Pretzelmaker, Elevation Burger, Native Grill & Wings, Yalla Mediterranean and Ponderosa and Bonanza Steakhouses, and franchises and owns over 2,300 units worldwide. For more information on FAT Brands, please visit www.fatbrands.com.
About Great American Cookies
Founded on a family chocolate chip cookie recipe in 1977, Great American Cookies believes that pure, simple delight is part of living a full life. Serving the Original Cookie Cake, fresh baked cookies in a variety of flavors, brownies, and Double Doozies™, we promise to treat you to bites of bliss that prove how sweet life can be. With more than 400 bakeries across the country and internationally in Bahrain, Guam, Saudi Arabia, and treats available to ship right to your door, the sweet spot is always close to home. For more information, visit www.greatamericancookies.com.
About Marble Slab Creamery
Since dreaming up the frozen slab technique and serving fresh homemade, small-batch Ice Cream in-store since 1983, Marble Slab Creamery has always known how to dream big. We sprinkle our customers with imagination and promise to inspire with infinite Ice Cream possibilities to feed your curiosity and capture cravings. With our always free mix-in philosophy, delicious Ice Cream and Shakes in a variety of flavors, hand-rolled waffle cones, and Ice Cream Cakes, imagination has no limits. Today, Marble Slab Creamery is enjoyed by consumers across the globe with locations in Bahrain, Canada, Kuwait, Saudi Arabia, Guam, Puerto Rico, and the United States. For more information, visit www.marbleslab.com.
MCLEAN, Va., Aug. 30, 2023 /PRNewswire/ — V2X, Inc., (NYSE: VVX), a leading provider of critical mission solutions and support to defense clients globally, announced that company management will address the Jefferies Industrials Conference, on Wednesday, September 6, at 4:30 p.m. Eastern time.
V2X builds smart solutions designed to integrate physical and digital infrastructure – from base to battlefield – by aligning people, actions, and outputs. Formed by the merger of Vectrus and Vertex, we bring a combined 120 years of successful mission support. Our lifecycle solutions improve security, streamline logistics, and enhance readiness.
The Company delivers a comprehensive suite of integrated solutions across the operations and logistics, aerospace, training, and technology markets to national security, defense, civilian and international clients. Our global team of approximately 15,000 employees brings innovation to every point in the mission lifecycle, from preparation to operations, to sustainment, as it tackles the most complex challenges with agility, grit, and dedication.
Contact Information
Investor Contact Mike Smith, CFA Vice President, Treasury, Corporate Development and Investor Relations IR@goV2X.com 571-337-3862
Media Contact Angelica Spanos Deoudes Senior Media Strategist Communications@goV2X.com 571-338-5195
Reports Fiscal Year 2023 Revenue of $2.0 Billion and a Net Loss of $44.7 Million, which Net Loss Includes an After-Tax, Non-Cash Charge of $57.8 Million Associated with the Third Quarter Goodwill and Intangible Asset Impairment Charge
Fiscal Year 2023 Adjusted Net Income1 was $13.4 million, or $0.21 Per Share, Compared with Adjusted Net Income1 of $32.9 Million, or $0.50 Per Diluted Share, in the Prior Year Period
Generates Adjusted EBITDA1 of $91.2 Million During Fiscal Year 2023, as the Fourth Quarter Adjusted EBITDA Loss1 Improves by $10.2 Million to $6.6 Million
Reports Fiscal Year 2023 Free Cash Flow1 of $70.7 Million
Issues Fiscal Year 2024 Outlook
(1) Refer to “Definitions of Non-GAAP Financial Measures” and the tables attached at the end of this press release for reconciliation of non-GAAP results to applicable GAAP results.)
JERICHO, N.Y.–(BUSINESS WIRE)– 1-800-FLOWERS.COM, Inc. (NASDAQ: FLWS), a leading provider of gifts designed to help inspire customers to give more, connect more, and build more and better relationships, today reported results for its fiscal 2023 fourth quarter and full year ended July 2, 2023.
Fiscal 2023 Fourth Quarter Highlights
Total consolidated revenues decreased 17.9% to $398.8 million, compared with total consolidated revenues of $485.9 million in the prior year period, which included a 53rd week. Excluding the impact of the 53rd week in the prior year period, revenues declined 14.8%.
Gross profit margin increased 340 basis points to 37.1%, compared with 33.7% in the prior year period. This continues the trend of improving gross margin since the fiscal first quarter led by improvements across the Company’s three business segments, which benefited from lower ocean freight costs, the Company’s strategic pricing initiatives, and a decline in certain commodity costs.
Operating expenses declined $18.7 million, or 9.8%, from $190.7 million in the prior year period to $172.0 million. On a percentage basis, operating expenses increased to 43.1% of sales, compared with 39.3% in the prior year period, primarily due to sales deleverage and the performance of our non-qualified deferred compensation plan, which was partially mitigated by marketing efficiencies.
Net loss for the quarter was $22.5 million, or ($0.35) per share, compared with a net loss of $22.3 million, or ($0.34) per share, in the prior year period. Net loss and net loss per share in the current year period were impacted by the tax treatment of the impairment charge recorded during the fiscal third quarter. Adjusted net loss1 was $17.8 million, or ($0.28) per share, compared with an adjusted net loss1 of $21.8 million, or ($0.34) per share, in the prior year period.
Adjusted EBITDA1 for the quarter was a loss of $6.6 million, improving $10.2 million, as compared with an adjusted EBITDA1 loss of $16.8 million in the prior year period.
Fiscal Year 2023 Highlights
Total consolidated revenues decreased 8.6% to $2.02 billion, compared with total consolidated revenues of $2.21 billion in the prior year period, which included a 53rd week. Excluding the impact of the 53rd week in the prior year period, revenues declined 7.9%.
Gross profit margin increased 30 basis points to 37.5%, compared with 37.2% in the prior year period. After declining 720 basis points during the fiscal first quarter on significantly increased costs for labor, shipping, and commodities, gross profit margin increased 90 basis points during the second quarter, 80 basis points during the third quarter, and 340 basis points during the fourth quarter, as compared with the prior year periods, benefiting from lower ocean freight costs combined with the Company’s strategic pricing initiatives.
Operating expenses increased $12.9 million from the prior year period, including a $64.6 million non-cash goodwill and intangible assets impairment charge that was recorded during the fiscal third quarter. Excluding the impact of this charge, operating expenses declined $51.7 million or 6.6%, compared with the prior year period. Operating expenses as percent of sales, excluding the third quarter impairment charge noted above, increased 80 basis points to 36.1%, compared with 35.3% in the prior year period, primarily due to sales deleverage, which was partially mitigated by marketing efficiencies.
Net loss for the fiscal year was $44.7 million, or ($0.69) per share, which includes an after-tax non-cash goodwill and intangible assets impairment charge of $57.8 million, or ($0.89) per share, compared with net income of $29.6 million, or $0.45 per diluted share, in the prior year period. Adjusted net income1 was $13.4 million, or $0.21 per share, compared with adjusted net income1 of $32.9 million, or $0.50 per diluted share, in the prior year period.
Adjusted EBITDA1 for the fiscal year was $91.2 million, as compared with $99.0 million in the prior year period, reflecting the significant improvement in adjusted EBITDA of $14.9 million in the second, third and fourth quarters, collectively, after the $22.7 million decline in the first quarter.
Generated Free Cash Flow1 of $70.7 million during fiscal 2023, an improvement of $131.9 million over the prior year.
Jim McCann, Chairman and Chief Executive Officer of 1-800-FLOWERS.COM, Inc., said “We successfully mitigated the impact of a softer sales environment during Fiscal 2023 through our expense optimization efforts coupled with the improvement in our gross margin. Simultaneously, we executed on our strategic initiatives to offer customers an expanding array of gift giving options across multiple price points, we invested in our technology platform to enhance the customer experience, and we expanded our product portfolio, both organically and through acquisitions, which positions us well as a premier gift giving destination once the broader consumer environment improves.”
McCann added, “As we look beyond the current horizon, we believe that the actions we have taken to enhance the customer experience, improve margins, and optimize expenses, combined with an improved consumer environment, will enable us to achieve our historical sales growth, gross profit margin and adjusted EBITDA margin rates.”
Segment Results The Company provides Fiscal 2023 fourth quarter and full year selected financial results for its Gourmet Foods and Gift Baskets, Consumer Floral and Gifts, and BloomNet segments in the tables attached to this release and as follows:
Gourmet Foods and Gift Baskets: Revenues for the quarter were $120.7 million, declining 18.7% compared with $148.4 million in the prior year period. Gross profit margin was 28.1%, compared with 23.2% percent in the prior year period. Segment contribution margin1 loss was $13.4 million, compared with segment contribution margin1 loss of $23.7 million in the prior year period. This primarily reflects the gross margin improvement combined with more efficient marketing spend.
For the full fiscal year, revenue in this segment decreased 3.9% to $965.2 million, compared with $1.0 billion in the prior year. Gross profit margin for the year was 34.9%, compared with 34.2% in the prior year. Segment contribution margin for the year, without the impairment charge, was $77.5 million, compared with $64.9 million in the prior year.
Consumer Floral & Gifts: Revenues for the quarter were $248.3 million, declining 17.0% compared with $299.0 million in the prior year period. Gross profit margin was 40.6%, compared with 38.0% percent in the prior year period. Segment contribution margin1 was $30.7 million, compared with segment contribution margin1 of $26.5 million in the prior year period. This primarily reflects gross profit margin improvement combined with marketing efficiencies that more than offset the revenue decline.
For the full fiscal year, revenues decreased 13.1% to $920.5 million, compared with $1.06 billion in the prior year. Gross profit margin was 39.5%, compared with 39.3% in the prior year. Segment contribution margin1 was $95.5 million, compared with $104.3 million in the prior year.
BloomNet: Revenues for the quarter decreased 22.1% to $30.0 million, compared with $38.5 million in the prior year period. Gross profit margin was 42.6%, compared with 39.6% in the prior year period, primarily reflecting lower ocean freight costs as well as product mix. Segment contribution margin1 was $7.4 million, compared with $10.0 million in the prior year period.
For the year, revenues decreased 8.6% to $133.2 million, compared with $145.7 million in the prior year. Gross profit margin was 42.7%, compared with 42.3% in the prior year. Segment contribution margin1 for the year was $37.2 million, compared with $42.5 million in the prior year.
Company Guidance For fiscal 2024, the Company expects revenues to remain pressured by a challenging consumer environment early in the year, but then rebound during the holiday period and into the second half of the fiscal year. The Company also expects continued improvement in gross margin. Additionally, the guidance assumes increased compensation expense, including the restoration of 100 percent bonus payout, compared with a partial payout in fiscal 2023.
As a result, the Company expects Fiscal 2024:
total revenues on a percentage basis to decline in the mid-single digits, as compared with the prior year;
adjusted EBITDA1 to be in a range of $95 million to $100 million; and
Free Cash Flow1 to be in a range of $60 million to $65 million.
Conference Call The Company will conduct a conference call to discuss the above details and attached financial results today, August 31, at 8:00 a.m. (ET). The conference call will be webcast from the Investors section of the Company’s website at www.1800flowersinc.com. A recording of the call will be posted on the Investors section of the Company’s website within two hours of the call’s completion. A telephonic replay of the call can be accessed beginning at 2:00 p.m. (ET) today through September 7, 2023, at: (US) 1-877-344-7529; (Canada) 855-669-9658; (International) 1-412-317-0088; enter conference ID #: 7782036.
Definitions of non-GAAP Financial Measures: We sometimes use financial measures derived from consolidated financial information, but not presented in our financial statements prepared in accordance with U.S. generally accepted accounting principles (“GAAP”). Certain of these are considered “non-GAAP financial measures” under the U.S. Securities and Exchange Commission rules. Non-GAAP financial measures referred to in this document are either labeled as “non-GAAP” or designated as such with a “1”. See below for definitions and the reasons why we use these non-GAAP financial measures. Where applicable, see the Selected Financial Information below for reconciliations of these non-GAAP measures to their most directly comparable GAAP financial measures. Reconciliations for forward-looking figures would require unreasonable efforts at this time because of the uncertainty and variability of the nature and amount of certain components of various necessary GAAP components, including, for example, those related to compensation, tax items, amortization or others that may arise during the year, and the Company’s management believes such reconciliations would imply a degree of precision that would be confusing or misleading to investors. For the same reasons, the Company is unable to address the probable significance of the unavailable information. The lack of such reconciling information should be considered when assessing the impact of such disclosures.
EBITDA and Adjusted EBITDA: We define EBITDA as net income (loss) before interest, taxes, depreciation, and amortization. Adjusted EBITDA is defined as EBITDA adjusted for the impact of stock-based compensation, Non-Qualified Plan Investment appreciation/depreciation, and for certain items affecting period-to-period comparability. See Selected Financial Information for details on how EBITDA and Adjusted EBITDA were calculated for each period presented. The Company presents EBITDA and Adjusted EBITDA because it considers such information meaningful supplemental measures of its performance and believes such information is frequently used by the investment community in the evaluation of similarly situated companies. The Company uses EBITDA and Adjusted EBITDA as factors to determine the total amount of incentive compensation available to be awarded to executive officers and other employees. The Company’s credit agreement uses EBITDA and Adjusted EBITDA to determine its interest rate and to measure compliance with certain covenants. EBITDA and Adjusted EBITDA are also used by the Company to evaluate and price potential acquisition candidates. EBITDA and Adjusted EBITDA have limitations as analytical tools and should not be considered in isolation or as a substitute for analysis of the Company’s results as reported under GAAP. Some of the limitations are: (a) EBITDA and Adjusted EBITDA do not reflect changes in, or cash requirements for, the Company’s working capital needs; (b) EBITDA and Adjusted EBITDA do not reflect the significant interest expense, or the cash requirements necessary to service interest or principal payments, on the Company’s debts; and (c) although depreciation and amortization are non-cash charges, the assets being depreciated and amortized may have to be replaced in the future and EBITDA does not reflect any cash requirements for such capital expenditures. EBITDA and Adjusted EBITDA should only be used on a supplemental basis combined with GAAP results when evaluating the Company’s performance.
Segment Contribution Margin and Adjusted Segment Contribution Margin We define Segment Contribution Margin as earnings before interest, taxes, depreciation, and amortization, before the allocation of corporate overhead expenses. Adjusted Contribution Margin is defined as Contribution Margin adjusted for certain items affecting period-to-period comparability. See Selected Financial Information for details on how Segment Contribution Margin and Adjusted Segment Contribution Margin were calculated for each period presented. When viewed together with our GAAP results, we believe Segment Contribution Margin and Adjusted Segment Contribution Margin provide management and users of the financial statements meaningful information about the performance of our business segments. Segment Contribution Margin and Adjusted Segment Contribution Margin are used in addition to and in conjunction with results presented in accordance with GAAP and should not be relied upon to the exclusion of GAAP financial measures. The material limitation associated with the use of Segment Contribution Margin and Adjusted Segment Contribution Margin is that they are an incomplete measure of profitability as they do not include all operating expenses or non-operating income and expenses. Management compensates for this limitation when using these measures by looking at other GAAP measures, such as Operating Income and Net Income.
Adjusted Net Income (Loss) and Adjusted or Comparable Net Income (Loss) Per Common Share: We define Adjusted Net Income (Loss) and Adjusted or Comparable Net Income (Loss) Per Common Share as Net Income (Loss) and Net Income (Loss) Per Common Share adjusted for certain items affecting period-to-period comparability. See Selected Financial Information below for details on how Adjusted Net Income (Loss) Per Common Share and Adjusted or Comparable Net Income (Loss) Per Common Share were calculated for each period presented. We believe that Adjusted Net Income (Loss) and Adjusted or Comparable Net Income (Loss) Per Common Share are meaningful measures because they increase the comparability of period-to-period results. Since these are not measures of performance calculated in accordance with GAAP, they should not be considered in isolation of, or as a substitute for, GAAP Net Income (Loss) and Net Income (Loss) Per Common share, as indicators of operating performance and they may not be comparable to similarly titled measures employed by other companies.
Free Cash Flow: We define Free Cash Flow as net cash provided by operating activities less capital expenditures. The Company considers Free Cash Flow to be a liquidity measure that provides useful information to management and investors about the amount of cash generated by the business after the purchases of fixed assets, which can then be used to, among other things, invest in the Company’s business, make strategic acquisitions, strengthen the balance sheet, and repurchase stock or retire debt. Free Cash Flow is a liquidity measure that is frequently used by the investment community in the evaluation of similarly situated companies. Since Free Cash Flow is not a measure of performance calculated in accordance with GAAP, it should not be considered in isolation or as a substitute for analysis of the Company’s results as reported under GAAP. A limitation of the utility of Free Cash Flow as a measure of financial performance is that it does not represent the total increase or decrease in the Company’s cash balance for the period.
About 1-800-FLOWERS.COM, Inc. 1-800-FLOWERS.COM, Inc. is a leading provider of gifts designed to help inspire customers to give more, connect more, and build more and better relationships. The Company’s e-commerce business platform features an all-star family of brands, including: 1-800-Flowers.com®, 1-800-Baskets.com®, Cheryl’s Cookies®, Harry & David®, PersonalizationMall.com®, Shari’s Berries®, FruitBouquets.com®, Things Remembered®, Moose Munch®, The Popcorn Factory®, Wolferman’s Bakery®, Vital Choice®, and Simply Chocolate®. Through the Celebrations Passport® loyalty program, which provides members with free standard shipping and no service charge across our portfolio of brands, 1-800-FLOWERS.COM, Inc. strives to deepen relationships with customers. The Company also operates BloomNet®, an international floral and gift industry service provider offering a broad-range of products and services designed to help members grow their businesses profitably; Napco℠, a resource for floral gifts and seasonal décor; DesignPac Gifts, LLC, a manufacturer of gift baskets and towers; and Alice’s Table®, a lifestyle business offering fully digital floral, culinary and other experiences to guests across the country. 1-800-FLOWERS.COM, Inc. was recognized among the top 5 on the National Retail Federation’s 2021 Hot 25 Retailers list, which ranks the nation’s fastest-growing retail companies, and was named to the Fortune 1000 list in 2022. Shares in 1-800-FLOWERS.COM, Inc. are traded on the NASDAQ Global Select Market, ticker symbol: FLWS. For more information, visit 1800flowersinc.com or follow @1800FLOWERSInc on Twitter.
FLWS–COMP FLWS-FN
Special Note Regarding Forward Looking Statements: This press release contains forward-looking statements within the meaning of the Private Securities Litigation Reform Act of 1995. These forward-looking statements represent the Company’s current expectations or beliefs concerning future events and can generally be identified using statements that include words such as “estimate,” “expects,” “project,” “believe,” “anticipate,” “intend,” “plan,” “foresee,” “forecast,” “likely,” “will,” “target” or similar words or phrases. These forward-looking statements are subject to risks, uncertainties, and other factors, many of which are outside of the Company’s control, which could cause actual results to differ materially from the results expressed or implied in the forward-looking statements, including, but not limited to, statements regarding the Company’s ability to achieve its guidance for the full Fiscal year; the Company’s ability to leverage its operating platform and reduce its operating expense ratio; its ability to sell through existing inventories; its ability to successfully integrate acquired businesses and assets; its ability to successfully execute its strategic initiatives; its ability to cost effectively acquire and retain customers; the outcome of contingencies, including legal proceedings in the normal course of business; its ability to compete against existing and new competitors; its ability to manage expenses associated with sales and marketing and necessary general and administrative and technology investments; its ability to reduce promotional activities and achieve more efficient marketing programs; and general consumer sentiment and industry and economic conditions that may affect levels of discretionary customer purchases of the Company’s products. The Company undertakes no obligation to publicly update any of the forward-looking statements, whether because of new information, future events or otherwise, made in this release or in any of its SEC filings. Consequently, you should not consider any such list to be a complete set of all potential risks and uncertainties. For a more detailed description of these and other risk factors, refer to the Company’s SEC filings, including the Company’s Annual Reports on Form 10-K and its Quarterly Reports on Form 10-Q.
Note: The following tables are an integral part of this press release without which the information presented in this press release should be considered incomplete.
1-800-FLOWERS.COM, Inc. and SubsidiariesCondensed Consolidated Balance Sheets(in thousands)
July 2, 2023
July 3, 2022
(unaudited)
Assets
Current assets:
Cash and cash equivalents
$
126,807
$
31,465
Trade receivables, net
20,419
23,812
Inventories
191,334
247,563
Prepaid and other
34,583
45,398
Total current assets
373,143
348,238
Property, plant and equipment, net
234,569
236,481
Operating lease right-of-use assets
124,715
129,390
Goodwill
153,376
213,287
Other intangibles, net
139,888
145,568
Other assets
25,739
21,927
Total assets
$
1,051,430
$
1,094,891
Liabilities and Stockholders’ Equity
Current liabilities:
Accounts payable
$
52,588
$
57,386
Accrued expenses
141,914
175,392
Current maturities of long-term debt
10,000
20,000
Current portion of long-term operating lease liabilities
15,759
12,919
Total current liabilities
220,261
265,697
Long-term debt, net
186,391
142,497
Long-term operating lease liabilities
117,330
123,662
Deferred tax liabilities, net
31,134
35,742
Other liabilities
24,471
17,884
Total liabilities
579,587
585,482
Total stockholders’ equity
471,843
509,409
Total liabilities and stockholders’ equity
$
1,051,430
$
1,094,891
1-800-FLOWERS.COM, Inc. and SubsidiariesSelected Financial InformationConsolidated Statements of Operations(in thousands, except for per share data)(unaudited)
Three Months Ended
Years Ended
July 2,2023
July 3,2022
July 2,2023
July 3,2022
Net revenues:
E-Commerce
$
357,489
$
433,978
$
1,744,622
$
1,934,648
Other
41,317
51,914
273,231
273,237
Total net revenues
398,806
485,892
2,017,853
2,207,885
Cost of revenues
250,944
322,209
1,260,327
1,386,147
Gross profit
147,862
163,683
757,526
821,738
Operating expenses:
Marketing and sales
110,763
138,866
500,840
571,661
Technology and development
16,162
15,192
60,691
56,561
General and administrative
31,672
23,846
112,747
102,337
Depreciation and amortization
13,397
12,827
53,673
49,078
Goodwill and intangible impairment
–
–
64,586
–
Total operating expenses
171,994
190,731
792,537
779,637
Operating income (loss)
(24,132
)
(27,048
)
(35,011
)
42,101
Interest expense, net
2,270
1,190
10,946
5,667
Other expense (income), net
(1,669
)
4,378
805
5,332
Income (loss) before income taxes
(24,733
)
(32,616
)
(46,762
)
31,102
Income tax (benefit) expense
(2,186
)
(10,366
)
(2,060
)
1,492
Net income (loss)
$
(22,547
)
$
(22,250
)
$
(44,702
)
$
29,610
Basic net income (loss) per common share
$
(0.35
)
$
(0.34
)
$
(0.69
)
$
0.46
Diluted net income (loss) per common share
$
(0.35
)
$
(0.34
)
$
(0.69
)
$
0.45
Weighted average shares used in the calculation of net income (loss) per common share:
Basic
64,773
64,583
64,688
64,977
Diluted
64,773
64,583
64,688
65,617
1-800-FLOWERS.COM, Inc. and SubsidiariesSelected Financial InformationConsolidated Statements of Cash Flows(in thousands)(unaudited)
Years Ended
July 2, 2023
July 3, 2022
Operating activities:
Net income (loss)
$
(44,702
)
$
29,610
Adjustments to reconcile net income (loss) to net cash provided by operating activities:
Goodwill and intangible asset impairment
64,586
–
Depreciation and amortization
53,673
49,078
Amortization of deferred financing costs
1,834
1,269
Deferred income taxes
(4,608
)
1,579
Bad debt expense
3,991
(411
)
Stock-based compensation
8,334
7,947
Other non-cash items
95
3,194
Changes in operating items:
Trade receivables
(597
)
(2,452
)
Inventories
57,591
(85,047
)
Prepaid and other
12,554
6,731
Accounts payable and accrued expenses
(38,623
)
(6,595
)
Other assets and liabilities
1,223
286
Net cash provided by operating activities
115,351
5,189
Investing activities:
Acquisitions, net of cash acquired
(6,151
)
(21,280
)
Capital expenditures, net of non-cash expenditures
(44,646
)
(66,408
)
Purchase of equity investments
(32
)
(2,000
)
Net cash used in investing activities
(50,829
)
(89,688
)
Financing activities:
Acquisition of treasury stock
(1,239
)
(38,171
)
Proceeds from exercise of employee stock options
–
846
Proceeds from bank borrowings
395,900
125,000
Repayment of notes payable and bank borrowings
(360,900
)
(145,000
)
Debt issuance cost
(2,941
)
(284
)
Net cash provided by (used in) financing activities
30,820
(57,609
)
Net change in cash and cash equivalents
95,342
(142,108
)
Cash and cash equivalents:
Beginning of period
31,465
173,573
End of period
$
126,807
$
31,465
1-800-FLOWERS.COM, Inc. and SubsidiariesSelected Financial Information – Category Information(dollars in thousands) (unaudited)
Three Months Ended
July 2, 2023
July 3, 2022
% Change
Net revenues:
Consumer Floral & Gifts
$
248,262
$
299,015
-17.0
%
BloomNet
29,996
38,490
-22.1
%
Gourmet Foods & Gift Baskets
120,669
148,442
-18.7
%
Corporate
223
44
406.8
%
Intercompany eliminations
(344
)
(99
)
-247.5
%
Total net revenues
$
398,806
$
485,892
-17.9
%
Gross profit:
Consumer Floral & Gifts
$
100,832
$
113,688
-11.3
%
40.6
%
38.0
%
BloomNet
12,793
15,237
-16.0
%
42.6
%
39.6
%
Gourmet Foods & Gift Baskets
33,862
34,418
-1.6
%
28.1
%
23.2
%
Corporate
375
340
10.3
%
168.2
%
772.7
%
Total gross profit
$
147,862
$
163,683
-9.7
%
37.1
%
33.7
%
EBITDA (non-GAAP):
Segment Contribution Margin (non-GAAP) (a):
Consumer Floral & Gifts
$
30,703
$
26,450
16.1
%
BloomNet
7,350
9,985
-26.4
%
Gourmet Foods & Gift Baskets
(13,418
)
(23,674
)
43.3
%
Segment Contribution Margin Subtotal
24,635
12,761
93.0
%
Corporate (b)
(35,370
)
(26,982
)
-31.1
%
EBITDA (non-GAAP)
(10,735
)
(14,221
)
24.5
%
Add: Stock-based compensation
2,393
1,144
109.2
%
Add: Compensation charge related to NQ Plan Investment Appreciation (Depreciation)
1,726
(3,694
)
146.7
%
Adjusted EBITDA (non-GAAP)
$
(6,616
)
$
(16,771
)
60.6
%
1-800-FLOWERS.COM, Inc. and SubsidiariesSelected Financial Information – Category Information(dollars in thousands) (unaudited)
Years Ended
July 2, 2023
Goodwill and Intangible Impairment
Things Remembered Transaction Costs
As Adjusted (non-GAAP) July 2, 2023
July 3, 2022
Vital Choice and Alice’s Table Transaction Costs
Litigation Settlement
As Adjusted (non-GAAP) July 3, 2022
% Change
Net revenues:
Consumer Floral & Gifts
$
920,510
$
–
$
–
$
920,510
$
1,059,570
$
–
$
–
$
1,059,570
-13.1
%
BloomNet
133,183
133,183
145,702
145,702
-8.6
%
Gourmet Foods & Gift Baskets
965,191
965,191
1,004,272
1,004,272
-3.9
%
Corporate
375
375
201
201
86.6
%
Intercompany eliminations
(1,406
)
(1,406
)
(1,860
)
(1,860
)
24.4
%
Total net revenues
$
2,017,853
$
–
$
–
$
2,017,853
$
2,207,885
$
–
$
–
$
2,207,885
-8.6
%
Gross profit:
Consumer Floral & Gifts
$
363,342
$
–
$
–
$
363,342
$
416,591
$
–
$
–
$
416,591
-12.8
%
39.5
%
39.5
%
39.3
%
39.3
%
BloomNet
56,879
56,879
61,562
61,562
-7.6
%
42.7
%
42.7
%
42.3
%
42.3
%
Gourmet Foods & Gift Baskets
336,764
336,764
343,163
343,163
-1.9
%
34.9
%
34.9
%
34.2
%
34.2
%
Corporate
541
541
422
422
28.2
%
144.3
%
144.3
%
210.0
%
210.0
%
Total gross profit
$
757,526
$
–
$
–
$
757,526
$
821,738
$
–
$
–
$
821,738
-7.8
%
37.5
%
–
–
37.5
%
37.2
%
–
–
37.2
%
EBITDA (non-GAAP):
Segment Contribution Margin (non-GAAP) (a):
Consumer Floral & Gifts
$
95,535
$
–
$
–
$
95,535
$
104,319
$
–
$
–
$
104,319
-8.4
%
BloomNet
37,197
37,197
42,515
42,515
-12.5
%
Gourmet Foods & Gift Baskets
12,895
64,586
77,481
62,021
2,900
64,921
19.3
%
Segment Contribution Margin Subtotal
145,627
64,586
–
210,213
208,855
–
2,900
211,755
-0.7
%
Corporate (b)
(126,965
)
444
(126,521
)
(117,676
)
540
(117,136
)
-8.0
%
EBITDA (non-GAAP)
18,662
64,586
444
83,692
91,179
540
2,900
94,619
-11.5
%
Add: Stock-based compensation
8,334
8,334
7,947
7,947
4.9
%
Add: Compensation charge related to NQ Plan Investment (Depreciation) Appreciation
(822
)
(822
)
(3,583
)
(3,583
)
77.1
%
Adjusted EBITDA (non-GAAP)
$
26,174
$
64,586
$
444
$
91,204
$
95,543
$
540
$
2,900
$
98,983
-7.9
%
1-800-FLOWERS.COM, Inc. and SubsidiariesSelected Financial Information (in thousands) (unaudited)
Reconciliation of net income (loss) to adjusted net income (loss) (non-GAAP):
Three Months Ended
Years Ended
July 2, 2023
July 3, 2022
July 2, 2023
July 3, 2022
Net income (loss)
$
(22,547
)
$
(22,250
)
$
(44,702
)
$
29,610
Adjustments to reconcile net income (loss) to adjusted net income (loss) (non-GAAP)
Add: Transaction costs
–
–
444
540
Add: Litigation settlement
–
–
–
2,900
Add: Goodwill and Intangibles Impairment
–
–
64,586
–
Deduct: Income tax effect on adjustments
4,710
476
(6,899
)
(165
)
Adjusted net income (loss) (non-GAAP)
$
(17,837
)
$
(21,774
)
$
13,429
$
32,885
Basic and diluted net income (loss) per common share
Basic
$
(0.35
)
$
(0.34
)
$
(0.69
)
$
0.46
Diluted
$
(0.35
)
$
(0.34
)
$
(0.69
)
$
0.45
Basic and diluted adjusted net income (loss) per common share (non-GAAP)
Basic
$
(0.28
)
$
(0.34
)
$
0.21
$
0.51
Diluted
$
(0.28
)
$
(0.34
)
$
0.21
$
0.50
Weighted average shares used in the calculation of basic and diluted net income (loss) and adjusted net income (loss) per common share
Basic
64,773
64,583
64,688
64,977
Diluted
64,773
64,583
64,688
65,617
1-800-FLOWERS.COM, Inc. and SubsidiariesSelected Financial Information (in thousands) (unaudited)
Reconciliation of net income (loss) to adjusted EBITDA (non-GAAP):
Three Months Ended
Years Ended
July 2, 2023
July 3, 2022
July 2, 2023
July 3, 2022
Net income (loss)
$
(22,547
)
$
(22,250
)
$
(44,702
)
$
29,610
Add: Interest expense and other, net
601
5,568
11,751
10,999
Add: Depreciation and amortization
13,397
12,827
53,673
49,078
Add: Income tax expense (benefit)
(2,186
)
(10,366
)
(2,060
)
1,492
EBITDA
(10,735
)
(14,221
)
18,662
91,179
Add: Stock-based compensation
2,393
1,144
8,334
7,947
Add: Compensation charge related to NQ plan investment appreciation (depreciation)
1,726
(3,694
)
(822
)
(3,583
)
Add: Goodwill and Intangible Impairment
–
–
64,586
–
Add: Transaction costs
–
–
444
540
Add: Litigation settlement
–
–
–
2,900
Adjusted EBITDA
$
(6,616
)
$
(16,771
)
$
91,204
$
98,983
(a) Segment performance is measured based on segment contribution margin or segment Adjusted EBITDA, reflecting only the direct controllable revenue and operating expenses of the segments, both of which are non-GAAP measurements. As such, management’s measure of profitability for these segments does not include the effect of corporate overhead, described above, depreciation and amortization, other income (net), and other items that we do not consider indicative of our core operating performance.
(b) Corporate expenses consist of the Company’s enterprise shared service cost centers, and include, among other items, Information Technology, Human Resources, Accounting and Finance, Legal, Executive and Customer Service Center functions, as well as Stock-Based Compensation. In order to leverage the Company’s infrastructure, these functions are operated under a centralized management platform, providing support services throughout the organization. The costs of these functions, other than those of the Customer Service Center, which are allocated directly to the above categories based upon usage, are included within corporate expenses as they are not directly allocable to a specific segment.
Company Teams Up with Customers To Support More Than 900 Title I Public Schools
BOCA RATON, Fla.–(BUSINESS WIRE)–Aug. 30, 2023– Office Depot today announced that nearly $1.7 million was raised leveraging its retail footprint to help more than 900 Title I public schools get brand new school supplies, classroom furniture, tech and more, just in time for the new school year.
The company partnered with Round It Up America® to enable every Office Depot and OfficeMax store to raise funds to support a Title I public elementary, middle or high school in the store’s local community. As result of this program, nearly $1.7 million was raised from April through June of this year. Stores will continue to support the same local schools through December to help them restock and refresh the supplies they need, well after the start of the new school year.
Some local beneficiary schools will have the chance to participate in free VIP school shopping events to pick up furniture, supplies and more, to help create more comfortable and productive learning environments for students. Others will create wish lists detailing the items they need most, which will then be delivered to them at the school or available for pick up at their local Office Depot or OfficeMax store.
“We’re proud to host this education donation drive in our Office Depot and OfficeMax stores to help connect teachers and staff at Title I schools with the additional resources they need,” said Kevin Moffitt, executive vice president of The ODP Corporation and president of Office Depot. “Thanks to our customers’ generous support of this program, extra supplies, new classroom furniture, tech and more will be directed to hundreds of schools to help encourage a successful new school year.”
The program is an integral part of Office Depot’s Imagine Success™ platform, created to help teachers, parents, students, home office workers and small business owners alike fuel their passions, power their potential and achieve their goals.
Start Proud!® Program
The company also helps to support education through The ODP Corporation’s Start Proud!® program, and recently announced that over $2.5 million worth of school supplies and equipment would be provided to students and teachers at Title I public elementary schools across the country.
Give Back to Schools Program
And students, parents and teachers who shop online at officedepot.com or in Office Depot and OfficeMax stores can help to support the local school of their choice with any qualifying purchase. Shoppers can simply provide the name or Give Back To Schools ID number of their desired school at checkout (in store or online) and their designated school will receive 5% back in credits for free supplies, through the Give Back to Schools program.
Office Depot, LLC, an operating company of The ODP Corporation, is a leading specialty retailer providing innovative products and services delivered through a fully integrated omnichannel platform of Office Depot and OfficeMax retail stores and an award-winning online presence, OfficeDepot.com, to support the productivity and organization of its small business, home office and education clients. Office Depot is committed to enabling its clients’ success, strengthening local communities and providing equal opportunities for all. For more information, visit officedepot.com, download the Office Depot app on your iPhone or Android and follow @officedepot on Facebook, Twitter, Instagram and TikTok.
Office Depot is a trademark of The Office Club, LLC. OfficeMax is a trademark of OMX, Inc. ODP and ODP Business Solutions are trademarks of ODP Business Solutions, LLC. Veyer is a trademark of Veyer, LLC. Varis is a trademark of Varis, Inc. Any other product or company names mentioned herein are the trademarks of their respective owners.
Net income totaled $9.3 million, or $0.30 per diluted share; non-GAAP net income totaled $10.2 million, or $0.33 per diluted share
Balance sheet strengthens, with cash and cash equivalents of $48.5 million, no debt, and year-over-year inventories down 22.4%
FORT WAYNE, Ind., Aug. 30, 2023 (GLOBE NEWSWIRE) — Vera Bradley, Inc. (Nasdaq: VRA) today announced its financial results for the second quarter and six months ended July 29, 2023.
In this release, Vera Bradley, Inc. or “the Company” refers to the entire enterprise and includes both the Vera Bradley and Pura Vida brands. Vera Bradley on a stand-alone basis refers to the Vera Bradley brand.
Second Quarter Comments
Jackie Ardrey, Chief Executive Officer of the Company, noted, “Our transformational efforts continue to bear fruit and are the result of the hard work of our associates across the country. We are very pleased with the meaningful year-over-year improvement in second quarter earnings, driven by significant gross margin expansion and successful expense reduction efforts. During the quarter, we carefully managed our debt-free balance sheet, adding to our cash position while continuing to strategically improve our inventory position.
“One of our key goals this year is to stabilize revenues. We continue to make progress on that front, with second quarter consolidated revenues of $128.2 million only modestly below last year.”
“Total second quarter revenues for the Vera Bradley brand were down 1.2% from last year,” Ardrey commented. “Vera Bradley Direct revenue declines resulted from store closures over the last year, while we saw a small comparable store gain in our full line stores. The successful return of the Vera Bradley Annual Outlet Sale offset weakness we experienced in our factory outlet stores in addition to compensating for the elimination of one online outlet sale during the quarter. The remainder of our e-commerce sales continued to perform well. Lastly, Vera Bradley Indirect revenues were up slightly to last year.
“Pura Vida year-over-year sales declined 3.6%, primarily related to a shortfall in wholesale revenues, which we believe will improve in the second half of the year. Store sales remained strong, and we began to realize the benefits of changes in our performance-based marketing program.
“In general, at both brands, customers have responded enthusiastically to our collaborations and to our product offerings when they are innovative and trend-right, even as they have been more selective in their discretionary spending in light of the current macro environment.”
Ardrey continued, “We are taking strategic actions to stabilize and steadily grow Pura Vida’s revenues and to reverse the trends in Vera Bradley’s factory outlet stores through a thorough, multi-pronged approach, including potential pricing adjustments and targeted marketing initiatives aimed to drive traffic and average order size. Our team is focused on generating long-term revenue increases, expanding gross margin, and ensuring strong financial discipline and cost control, which we expect will drive long-term profitable growth.”
Ardrey added, “We continue to make meaningful progress on Project Restoration, focusing on four key pillars of the business for each brand – Consumer, Brand, Product, and Channel. Through the first half of Fiscal 2024, we have progressed as expected. We anticipate execution of Project Restoration will drive this long-term profitable growth and deliver value to our shareholders.”
Summary of Financial Performance for the Second Quarter
Consolidated net revenues totaled $128.2 million compared to $130.4 million in the prior year second quarter ended July 30, 2022.
For the current year second quarter, Vera Bradley, Inc.’s consolidated net income totaled $9.3 million, or $0.30 per diluted share. These results included $0.9 million of net after tax charges, comprised of $0.6 million for the amortization of definite-lived intangible assets, $0.2 million of consulting fees primarily associated with strategic initiatives, and $0.1 million of severance charges. On a non-GAAP basis, Vera Bradley, Inc.’s consolidated second quarter net income totaled $10.2 million, or $0.33 per diluted share.
For the prior year second quarter, Vera Bradley, Inc.’s consolidated net loss totaled ($29.8) million, or ($0.95) per diluted share. These results included $32.2 million of net after tax charges, comprised of $18.2 million of Pura Vida goodwill and intangible asset impairment charges, $4.7 million of inventory adjustments associated with the exit of certain technology products and the write-off of excess mask inventory, $4.7 million of severance charges and other employee costs, $2.3 million of consulting fees associated with cost savings initiatives and CEO search, $0.9 million of purchase order cancellation fees for spring 2023 goods, $0.6 million of store impairment charges, $0.5 million of intangible asset amortization, and $0.3 million of goodMRKT exit costs. On a non-GAAP basis, Vera Bradley, Inc.’s prior year consolidated second quarter net income totaled $2.4 million, or $0.08 per diluted share.
Summary of Financial Performance for the Six Months
Consolidated net revenues totaled $222.5 million for the current year six months ended July 29, 2023, compared to $228.8 million in the prior year six month period ended July 30, 2022.
For the current year six months, Vera Bradley, Inc.’s consolidated net income totaled $4.6 million, or $0.15 per diluted share. These results included $3.0 million of net after tax charges, comprised of $1.5 million of severance charges, $1.1 million for the amortization of definite-lived intangible assets, and $0.4 million of consulting and professional fees primarily associated with strategic initiatives. On a non-GAAP basis, Vera Bradley, Inc.’s consolidated net income for the six months totaled $7.6 million, or $0.24 per diluted share.
For the prior year six months, Vera Bradley, Inc.’s consolidated net loss totaled ($36.7) million, or ($1.15) per diluted share. These results included $33.1 million of net after tax charges, comprised of $18.2 million of Pura Vida goodwill and intangible asset impairment charges, $4.7 million of inventory adjustments associated with the exit of certain technology products and the write-off of excess mask inventory, $4.7 million of severance charges and other employee costs, $2.4 million of consulting fees associated with cost savings initiatives and CEO search, $1.0 million of store and right-of-use asset impairment charges, $0.9 million of purchase order cancellation fees for spring 2023 goods, $0.9 million of intangible asset amortization, and $0.3 million of goodMRKT exit costs. On a non-GAAP basis, Vera Bradley, Inc.’s prior year consolidated net loss for the six months totaled ($3.6) million, or ($0.11) per diluted share.
Non-GAAP Numbers
The current year non-GAAP second quarter and six-month income statement numbers referenced below exclude the previously outlined severance charges, intangible asset amortization, and consulting and professional fees. The prior year non-GAAP second quarter and six-month income statement numbers referenced below exclude the previously outlined goodwill and intangible asset impairment charges, inventory adjustments, severance charges and other employee costs, consulting fees, store and right-of-use asset impairment charges, purchase order cancellation fees, intangible asset amortization, and goodMRKT exit costs.
Second Quarter Details
Current year second quarter Vera Bradley Direct segment revenues totaled $85.7 million, a 1.5% decrease from $87.0 million in the prior year second quarter. Comparable sales declined 5.3% in the second quarter, primarily driven by weakness in the factory outlet channel. The Company permanently closed 19 full-line and two factory outlet stores and opened three factory outlet stores over the last twelve months. This year, the Direct segment revenues included sales from the Vera Bradley Annual Outlet sale, which was not held last year.
Vera Bradley Indirect segment revenues totaled $17.4 million, a 0.2% increase over $17.3 million in the prior year second quarter.
Pura Vida segment revenues totaled $25.1 million, a 3.6% decrease from $26.0 million in the prior year, reflecting a decline in sales to wholesale accounts and a modest decline in ecommerce sales, partially offset by new store growth resulting in non-comparable retail store sales.
Second quarter consolidated gross profit totaled $72.0 million, or 56.2% of net revenues, compared to $60.5 million, or 46.4% of net revenues, in the prior year. On a non-GAAP basis, prior year gross profit totaled $67.8 million, or 52.0% of net revenues. The current year gross profit rate compared to the prior year non-GAAP rate was favorably impacted by lower year-over-year inbound and outbound freight expense and the sell-through of previously-reserved inventory, partially offset by an increase in promotional activity. Prior year gross profit was materially impacted by high inbound and outbound freight expense and deleverage of overhead costs.
Second quarter consolidated SG&A expense totaled $59.4 million, or 46.3% of net revenues, compared to $74.0 million, or 56.8% of net revenues, in the prior year. On a non-GAAP basis, consolidated SG&A expense totaled $58.3 million, or 45.5% of net revenues, compared to $64.0 million, or 49.1% of net revenues, in the prior year. Vera Bradley’s current year non-GAAP SG&A expenses were lower than the prior year primarily due to Company-wide cost reduction initiatives across various areas of the enterprise.
The Company’s second quarter consolidated operating income totaled $12.9 million, or 10.0% of net revenues, compared to an operating loss of ($42.8) million, or (32.8%) of net revenues, in the prior year second quarter. On a non-GAAP basis, the Company’s current year consolidated operating income totaled $14.0 million, or 10.9% of net revenues, compared to $3.9 million, or 3.0% of net revenues, in the prior year.
By segment:
Vera Bradley Direct operating income was $20.6 million, or 24.1% of Direct net revenues, compared to $10.0 million, or 11.5% of Direct net revenues, in the prior year. On a non-GAAP basis, prior year Direct operating income totaled $16.2 million, or 18.6% of Direct revenues.
Vera Bradley Indirect operating income was $6.2 million, or 35.7% of Indirect net revenues, compared to $3.9 million, or 22.6% of Indirect net revenues, in the prior year. On a non-GAAP basis, prior year Indirect operating income totaled $4.9 million, or 28.4% of Indirect net revenues.
Pura Vida’s operating income was $4.0 million, or 15.9% of Pura Vida net revenues, compared to an operating loss of ($28.5) million, or (109.6%) of Pura Vida net revenues, in the prior year. On a non-GAAP basis, Pura Vida’s operating income was $4.8 million, or 19.2% of Pura Vida net revenues, compared to $2.6 million, or 9.8% of Pura Vida net revenues, in the prior year.
Details for the Six Months
Vera Bradley Direct segment revenues for the current year six-month period totaled $144.6 million, a 2.7% decrease from $148.6 million in the prior year. Comparable sales declined 4.5% for the six months. This year, the Direct segment revenues included sales from the Vera Bradley Annual Outlet sale, which was not held last year.
Vera Bradley Indirect segment revenues for the six months totaled $32.7 million, a 4.6% decrease from $34.3 million last year. Prior year revenues reflected a large one-time key account order that was not repeated in the current year.
Pura Vida segment revenues totaled $45.2 million, a 1.5% decrease from $45.9 million in the prior year, reflecting a decline in sales to wholesale accounts and a modest decline in ecommerce sales, partially offset by new store growth resulting in non-comparable retail store sales.
Consolidated gross profit for the six months totaled $123.8 million, or 55.6% of net revenues, compared to $113.0 million, or 49.4% of net revenues, in the prior year. On a non-GAAP basis, prior year gross profit totaled $120.3 million, or 52.6% of net revenues. The current year gross profit rate compared to the prior year non-GAAP rate was favorably impacted by lower year-over-year inbound and outbound freight expense and the sell-through of previously-reserved inventory, partially offset by an increase in promotional activity.
For the six months, consolidated SG&A expense totaled $117.9 million, or 53.0% of net revenues, compared to $135.0 million, or 59.0% of net revenues, in the prior year. On a non-GAAP basis, current year consolidated SG&A expense totaled $113.9 million, or 51.2% of net revenues, compared to $123.4 million, or 53.9% of net revenues, in the prior year. Vera Bradley’s current year non-GAAP SG&A expenses were lower than the prior year primarily due Company-wide cost reduction initiatives across various areas of the enterprise.
For the six months, the Company’s consolidated operating income totaled $6.5 million, 2.9% of net revenues, compared to an operating loss of ($51.1) million, or (22.3%) of net revenues, in the prior year six-month period. On a non-GAAP basis, the Company’s current year consolidated operating income was $10.5 million, or 4.7% of net revenues, compared to an operating loss of ($2.9) million, or (1.2%) of net revenues, in the prior year.
By segment:
Vera Bradley Direct operating income was $28.0 million, or 19.3% million of Direct net revenues, compared to $15.5 million, or 10.5% of Direct net revenues, in the prior year. On a non-GAAP basis, current year Direct operating income was $28.3 million, or 19.6% of Direct net revenues, compared to $21.7 million, or 14.6% of Direct net revenues, in the prior year.
Vera Bradley Indirect operating income was $10.9 million, or 33.3% of Indirect net revenues, compared to $9.4 million, or 27.4% of Indirect net revenues, in the prior year. On a non-GAAP basis, prior year Indirect operating income totaled $10.4 million, or 30.3% of Indirect net revenues.
Pura Vida’s operating income was $5.6 million, or 12.3% of Pura Vida net revenues, compared to an operating loss of ($27.5) million, or (59.9%) of Pura Vida net revenues, in the prior year. On a non-GAAP basis, Pura Vida’s operating income was $7.1 million, or 15.7% of Pura Vida net revenues, compared to $4.4 million, or 9.5% of Pura Vida net revenues, in the prior year.
Balance Sheet
Net capital spending for the six months ended July 29, 2023 totaled $1.7 million compared to $4.4 million in the prior year.
Cash and cash equivalents as of July 29, 2023 totaled $48.5 million compared to $38.3 million at the end of last year’s second quarter. The Company had no borrowings on its $75 million asset-based lending (“ABL”) facility at quarter end.
Subsequent to quarter end, the Company completed renegotiation of its ABL agreement, and the modifications, among other things, convert the interest calculation from LIBOR (London Interbank Offer Rate) to SOFR (Secured Overnight Financing Rate) as well as enhance the Company’s future ability to expand the ABL if necessary. Management believes that its access to liquidity and capital is sufficient to address needs in the foreseeable future.
Total quarter-end inventory was $139.3 million, compared to $179.6 million at the end of the second quarter last year.
During the second quarter, the Company repurchased approximately $683,000 of its common stock (120,220 shares at an average price of $5.68), bringing the total repurchased for the six months to approximately $1.4 million (248,320 shares at an average price of $5.70). The Company has $26.3 million remaining under its $50.0 million repurchase authorization that expires in December 2024.
Forward Outlook
Management is updating certain components of guidance for the fiscal year ending February 3, 2024 (“Fiscal 2024”) based on first half performance, Company initiatives underway, and current macroeconomic trends and expectations. The Company has narrowed the guidance range for diluted earnings per share.
Excluding net revenues, all forward-looking guidance numbers referenced below are non-GAAP. The prior year income statement numbers exclude the previously disclosed charges for goodwill and intangible asset impairment; net inventory and purchase order-related adjustments; severance, retention, and stock-based retirement compensation; consulting and professional fees primarily associated with cost savings initiatives, the CEO search, and strategic initiatives; amortization of definite-lived intangible assets; store and right-of-use asset impairment charges; new CEO sign-on bonus and relocation; and goodMRKT exit costs. Current year guidance excludes any similar charges.
For Fiscal 2024, the Company’s updated expectations are as follows:
Consolidated net revenues of $490 to $500 million. Net revenues totaled $500.0 million in Fiscal 2023.
A consolidated gross profit percentage of 53.0% to 53.8% compared to 51.4% in Fiscal 2023. The Fiscal 2024 gross profit rate is expected to be favorably impacted by lower year-over-year freight expense, cost reduction initiatives, and the sell-through of previously-reserved inventory, partially offset by an increase in promotional activity.
Consolidated SG&A expense of $237 to $243 million compared to $245.3 million in Fiscal 2023. An expected decline in SG&A expense is being driven by Company-wide cost reduction initiatives, partially offset by restoring short-term and long-term incentive compensation to more normalized levels and incremental marketing investment intended to accelerate customer file growth.
Consolidated operating income of $24 to $28 million compared to $12.3 million in Fiscal 2023.
Free cash flow of between $40 and $45 million compared to a cash usage of $21.7 million in Fiscal 2023.
Consolidated diluted EPS of $0.57 to $0.65 based on diluted weighted-average shares outstanding of approximately 31.0 million and an effective tax rate of approximately 28%. Diluted EPS totaled $0.24 last year.
Net capital spending of approximately $5 million compared to $8.2 million in the prior year, reflecting investments associated with new Vera Bradley factory outlet stores and technology and logistics enhancements.
Disclosure Regarding Non-GAAP Measures
The Company’s management does not, nor does it suggest that investors should, consider the supplemental non-GAAP financial measures in isolation from, or as a substitute for, financial information prepared in accordance with accounting principles generally accepted in the United States (“GAAP”). Further, the non-GAAP measures utilized by the Company may be unique to the Company, as they may be different from non-GAAP measures used by other companies.
The Company believes that the non-GAAP measures presented in this earnings release, including free cash flow (cash usage); gross profit; selling, general, and administrative expenses; operating income (loss); net income (loss); net income (loss) attributable and available to Vera Bradley, Inc.; and diluted net income (loss) per share available to Vera Bradley, Inc. common shareholders, along with the associated percentages of net revenues, are helpful to investors because they allow for a more direct comparison of the Company’s year-over-year performance and are consistent with management’s evaluation of business performance. A reconciliation of the non-GAAP measures to the most directly comparable GAAP measures can be found in the Company’s supplemental schedules included in this earnings release.
Call Information
A conference call to discuss results for the second quarter is scheduled for today, Wednesday, August 30, 2023, at 9:30 a.m. Eastern Time. A broadcast of the call will be available via Vera Bradley’s Investor Relations section of its website, www.verabradley.com. Alternatively, interested parties may dial into the call at (888) 394-8218, and enter the access code 1990839. A replay will be available shortly after the conclusion of the call and remain available through September 13, 2023. To access the recording, listeners should dial (844) 512-2921, and enter the access code 1990839.
About Vera Bradley, Inc.
Vera Bradley, Inc. operates two unique lifestyle brands – Vera Bradley and Pura Vida. Vera Bradley and Pura Vida are complementary businesses, both with devoted, emotionally-connected, and multi-generational female customer bases; alignment as casual, comfortable, affordable, and fun brands; positioning as “gifting” and socially-connected brands; strong, entrepreneurial cultures; a keen focus on community, charity, and social consciousness; multi-channel distribution strategies; and talented leadership teams aligned and committed to the long-term success of their brands.
Vera Bradley, based in Fort Wayne, Indiana, is a leading designer of women’s handbags, luggage and other travel items, fashion and home accessories, and unique gifts. Founded in 1982 by friends Barbara Bradley Baekgaard and Patricia R. Miller, the brand is known for its innovative designs, iconic patterns, and brilliant colors that inspire and connect women unlike any other brand in the global marketplace.
In July 2019, Vera Bradley, Inc. acquired a 75% interest in Creative Genius, Inc., which also operates under the name Pura Vida Bracelets (“Pura Vida”). Pura Vida, based in La Jolla, California, is a digitally native, highly-engaging lifestyle brand founded in 2010 by friends Paul Goodman and Griffin Thall. Pura Vida has a differentiated and expanding offering of bracelets, jewelry, and other lifestyle accessories. The Company acquired the remaining 25% of Pura Vida in January 2023.
The Company has three reportable segments: Vera Bradley Direct (“VB Direct”), Vera Bradley Indirect (“VB Indirect”), and Pura Vida. The VB Direct business consists of sales of Vera Bradley products through Vera Bradley Full-Line and Factory Outlet stores in the United States, www.verabradley.com, Vera Bradley’s online outlet site, and the Vera Bradley annual outlet sale in Fort Wayne, Indiana. The VB Indirect business consists of sales of Vera Bradley products to approximately 1,700 specialty retail locations throughout the United States, as well as select department stores, national accounts, third party e-commerce sites, and third-party inventory liquidators, and royalties recognized through licensing agreements related to the Vera Bradley brand. The Pura Vida segment consists of sales of Pura Vida products through the Pura Vida websites, www.puravidabracelets.com, www.puravidabracelets.ca, and www.puravidabracelets.eu; through the distribution of its products to wholesale retailers and department stores; and through its Pura Vida retail stores.
Website Information
We routinely post important information for investors on our website www.verabradley.com in the “Investor Relations” section. We intend to use this webpage as a means of disclosing material, non-public information and for complying with our disclosure obligations under Regulation FD. Accordingly, investors should monitor the Investor Relations section of our website, in addition to following our press releases, SEC filings, public conference calls, presentations and webcasts. The information contained on, or that may be accessed through, our webpage is not incorporated by reference into, and is not a part of, this document.
Investors and other interested parties may also access the Company’s most recent Corporate Responsibility and Sustainability Report outlining its ESG (Environmental, Social, and Governance) initiatives at https://verabradley.com/pages/corporate-responsibility.
Vera Bradley Safe Harbor Statement
Certain statements in this release are “forward-looking statements” made pursuant to the safe-harbor provisions of the Private Securities Litigation Reform Act of 1995. Such forward-looking statements reflect the Company’s current expectations or beliefs concerning future events and are subject to various risks and uncertainties that may cause actual results to differ materially from those that we expected, including: possible adverse changes in general economic conditions and their impact on consumer confidence and spending; possible inability to predict and respond in a timely manner to changes in consumer demand; possible loss of key management or design associates or inability to attract and retain the talent required for our business; possible inability to maintain and enhance our brands; possible inability to successfully implement the Company’s long-term strategic plans; possible inability to successfully open new stores, close targeted stores, and/or operate current stores as planned; incremental tariffs or adverse changes in the cost of raw materials and labor used to manufacture our products; possible adverse effects resulting from a significant disruption in our distribution facilities; or business disruption caused by pandemics. Risks, uncertainties, and assumptions also include the possibility that Pura Vida acquisition benefits may not materialize as expected and that Pura Vida’s business may not perform as expected. More information on potential factors that could affect the Company’s financial results is included from time to time in the “Risk Factors” and “Management’s Discussion and Analysis of Financial Condition and Results of Operations” sections of the Company’s public reports filed with the SEC, including the Company’s Form 10-K for the fiscal year ended January 28, 2023. We undertake no obligation to publicly update or revise any forward-looking statement. Financial schedules are attached to this release.
Liabilities, Redeemable Noncontrolling Interest, and Shareholders’ Equity
Current liabilities:
Accounts payable
$
21,605
$
20,350
$
43,722
Accrued employment costs
12,965
14,312
16,018
Short-term operating lease liabilities
19,587
19,714
19,768
Other accrued liabilities
13,496
12,723
21,526
Income taxes payable
528
558
374
Total current liabilities
68,181
67,657
101,408
Long-term operating lease liabilities
66,718
74,664
84,015
Other long-term liabilities
82
90
157
Total liabilities
134,981
142,411
185,580
Redeemable noncontrolling interest
–
10,712
23,491
Shareholders’ equity:
Additional paid-in-capital
111,663
109,718
107,941
Retained earnings
279,204
274,629
297,623
Accumulated other comprehensive loss
(69
)
(105
)
(135
)
Treasury stock
(134,279
)
(132,864
)
(131,279
)
Total shareholders’ equity of Vera Bradley, Inc.
256,519
251,378
274,150
Total liabilities, redeemable noncontrolling interest, and shareholders’ equity
$
391,500
$
404,501
$
483,221
Vera Bradley, Inc.
Condensed Consolidated Statements of Operations
(in thousands, except per share amounts)
(unaudited)
Thirteen Weeks Ended
Twenty-Six Weeks Ended
July 29, 2023
July 30, 2022
July 29, 2023
July 30, 2022
Net revenues
$
128,172
$
130,371
$
222,534
$
228,830
Cost of sales
56,156
69,854
98,769
115,799
Gross profit
72,016
60,517
123,765
113,031
Selling, general, and administrative expenses
59,405
74,042
117,911
134,956
Impairment of goodwill and intangible assets
–
29,338
–
29,338
Other income, net
260
42
631
209
Operating income (loss)
12,871
(42,821
)
6,485
(51,054
)
Interest expense, net
12
36
44
76
Income (loss) before income taxes
12,859
(42,857
)
6,441
(51,130
)
Income tax expense (benefit)
3,605
(5,956
)
1,866
(7,519
)
Net income (loss)
9,254
(36,901
)
4,575
(43,611
)
Less: Net loss attributable to redeemable noncontrolling interest
–
(7,134
)
–
(6,870
)
Net income (loss) attributable to Vera Bradley, Inc.
$
9,254
$
(29,767
)
$
4,575
$
(36,741
)
Basic weighted-average shares outstanding
30,901
31,429
30,847
32,051
Diluted weighted-average shares outstanding
31,139
31,429
31,208
32,051
Basic net income (loss) per share available to Vera Bradley, Inc. common shareholders
$
0.30
$
(0.95
)
$
0.15
$
(1.15
)
Diluted net income (loss) per share available to Vera Bradley, Inc. common shareholders
$
0.30
$
(0.95
)
$
0.15
$
(1.15
)
Vera Bradley, Inc.
Condensed Consolidated Statements of Cash Flows
(in thousands)
(unaudited)
Twenty-Six Weeks Ended
July 29, 2023
July 30, 2022
Cash flows from operating activities
Net income (loss)
$
4,575
$
(43,611
)
Adjustments to reconcile net income (loss) to net cash provided by (used in) operating activities:
Depreciation of property, plant, and equipment
4,070
4,371
Amortization of operating right-of-use assets
10,501
10,621
Goodwill and intangible asset impairment
–
29,338
Other impairment charges
–
1,351
Amortization of intangible assets
1,458
1,537
Provision for doubtful accounts
17
(119
)
Stock-based compensation
1,601
1,444
Deferred income taxes
2,102
(5,419
)
Other non-cash loss, net
40
–
Changes in assets and liabilities:
Accounts receivable
(1,856
)
(4,793
)
Inventories
2,974
(34,676
)
Prepaid expenses and other assets
1,107
348
Accounts payable
1,403
12,759
Income taxes
(899
)
4,652
Operating lease liabilities, net
(10,552
)
(12,910
)
Accrued and other liabilities
(566
)
7,989
Net cash provided by (used in) operating activities
15,975
(27,118
)
Cash flows from investing activities
Purchases of property, plant, and equipment
(1,727
)
(4,391
)
Cash paid for business acquisition
(10,000
)
–
Net cash used in investing activities
(11,727
)
(4,391
)
Cash flows from financing activities
Tax withholdings for equity compensation
(942
)
(1,410
)
Repurchase of common stock
(1,415
)
(16,477
)
Distributions to redeemable noncontrolling interest
–
(613
)
Net cash used in financing activities
(2,357
)
(18,500
)
Effect of exchange rate changes on cash and cash equivalents
36
(106
)
Net increase (decrease) in cash and cash equivalents
$
1,927
$
(50,115
)
Cash and cash equivalents, beginning of period
46,595
88,436
Cash and cash equivalents, end of period
$
48,522
$
38,321
Vera Bradley, Inc.
Second Quarter Fiscal 2024
GAAP to Non-GAAP Reconciliation Thirteen Weeks Ended July 29, 2023
(in thousands, except per share amounts)
(unaudited)
Thirteen Weeks Ended
As Reported
Other Items
Non-GAAP (Excluding Items)
Gross profit
$
72,016
$
–
$
72,016
Selling, general, and administrative expenses
59,405
1,101
1
58,304
Operating income (loss)
12,871
(1,101
)
13,972
Income (loss) before income taxes
12,859
(1,101
)
13,960
Income tax expense (benefit)
3,605
(157
)
2
3,762
Net income (loss)
9,254
(944
)
10,198
Less: Net loss attributable to redeemable noncontrolling interest
–
–
–
Net income (loss) attributable to Vera Bradley, Inc.
9,254
(944
)
10,198
Diluted net income (loss) per share available to Vera Bradley, Inc. common shareholders
$
0.30
$
(0.03
)
$
0.33
Vera Bradley Direct segment operating income
$
20,621
$
–
$
20,621
Vera Bradley Indirect segment operating income
$
6,204
$
–
$
6,204
Pura Vida segment operating income (loss)
$
4,000
$
(808
)
3
$
4,808
Unallocated corporate expenses
$
(17,954
)
$
(293
)
4
$
(17,661
)
1Items include $729 for the amortization of definite-lived intangible assets; $293 for certain professional fees and consulting fees associated with strategic initiatives; and $79 for severance charges
2Related to the tax impact of the items mentioned above
3Related to $729 for the amortization of definite-lived intangible assets and $79 for severance charges
4Related to certain professional fees and consulting fees for strategic initiatives
Vera Bradley, Inc.
Second Quarter Fiscal 2023
GAAP to Non-GAAP Reconciliation Thirteen Weeks Ended July 30, 2022
(in thousands, except per share amounts)
(unaudited)
Thirteen Weeks Ended
As Reported
Other Items
Non-GAAP (Excluding Items)
Gross profit (loss)
$
60,517
$
(7,276
)
1
$
67,793
Selling, general, and administrative expenses
74,042
10,076
2
63,966
Impairment of goodwill and intangible assets
29,338
29,338
–
Operating (loss) income
(42,821
)
(46,690
)
3,869
(Loss) Income before income taxes
(42,857
)
(46,690
)
3,833
Income tax (benefit) expense
(5,956
)
(6,760
)
3
804
Net (loss) income
(36,901
)
(39,930
)
3,029
Less: Net (loss) income attributable to redeemable noncontrolling interest
(7,134
)
(7,771
)
637
Net (loss) income attributable to Vera Bradley, Inc.
(29,767
)
(32,159
)
2,392
Diluted net (loss) income per share available to Vera Bradley, Inc. common shareholders
$
(0.95
)
$
(1.02
)
$
0.08
Vera Bradley Direct segment operating income (loss)
$
10,044
$
(6,173
)
4
$
16,217
Vera Bradley Indirect segment operating income (loss)
$
3,918
$
(994
)
5
$
4,912
Pura Vida segment operating (loss) income
$
(28,534
)
$
(31,085
)
6
$
2,551
Unallocated corporate expenses
$
(28,249
)
$
(8,438
)
7
$
(19,811
)
1Items include $6,142 for inventory adjustments associated with the exit of certain technology products and the goodMRKT brand, as well as excess mask products and $1,134 for PO cancellation fees
2Items include $5,714 for severance charges; $2,755 for consulting fees associated with cost savings initiatives and CEO search; $768 for the amortization of definite-lived intangible assets; $759 for store impairment charges; and $80 for goodMRKT brand exit costs
3Related to the tax impact of the charges mentioned above, as well as goodwill and intangible asset impairment charges
4Related to $5,097 related to an allocation for certain inventory adjustments and PO cancellation fees; $759 for store impairment charges; $302 for goodMRKT brand exit costs; and $15 for severance charges
5Related to an allocation for certain inventory adjustments and PO cancellation fees
6Related to $29,338 of goodwill and intangible asset impairment charges; $963 for inventory adjustments associated with mask products; $768 for the amortization of definite-lived intangible assets; and $16 for severance charges
7Related to $5,683 for severance charges and $2,755 for consulting fees associated with cost savings initiatives and CEO search
Vera Bradley, Inc.
GAAP to Non-GAAP Reconciliation Twenty-Six Weeks Ended July 29, 2023
(in thousands, except per share amounts)
(unaudited)
Twenty-Six Weeks Ended
As Reported
Other Items
Non-GAAP (Excluding Items)
Gross profit
$
123,765
$
–
$
123,765
Selling, general, and administrative expenses
117,911
4,001
1
113,910
Operating income (loss)
6,485
(4,001
)
10,486
Income (loss) before income taxes
6,441
(4,001
)
10,442
Income tax expense (benefit)
1,866
(1,013
)
2
2,879
Net income (loss)
4,575
(2,988
)
7,563
Less: Net loss attributable to redeemable noncontrolling interest
–
–
–
Net income (loss) attributable to Vera Bradley, Inc.
4,575
(2,988
)
7,563
Diluted net income (loss) per share available to Vera Bradley, Inc. common shareholders
$
0.15
$
(0.10
)
$
0.24
Vera Bradley Direct segment operating income (loss)
$
27,961
$
(342
)
3
$
28,303
Vera Bradley Indirect segment operating income
$
10,910
$
–
$
10,910
Pura Vida segment operating income (loss)
$
5,562
$
(1,537
)
4
$
7,099
Unallocated corporate expenses
$
(37,948
)
$
(2,122
)
5
$
(35,826
)
1Items include $2,068 for severance charges; $1,458 for the amortization of definite-lived intangible assets; and $475 for certain professional fees and consulting fees associated with strategic initiatives
2Related to the tax impact of the items mentioned above
3Related to severance charges
4Related to $1,458 for the amortization of definite-lived intangible assets and $79 for severance charges
5Items include $1,647 for severance charges and $475 associated with certain professional fees and consulting fees for strategic initiatives
Vera Bradley, Inc.
GAAP to Non-GAAP Reconciliation Twenty-Six Weeks Ended July 30, 2022
(in thousands, except per share amounts)
(unaudited)
Twenty-Six Weeks Ended
As Reported
Other Items
Non-GAAP (Excluding Items)
Gross profit (loss)
$
113,031
$
(7,276
)
1
$
120,307
Selling, general, and administrative expenses
134,956
11,587
2
123,369
Impairment of goodwill and intangible assets
29,338
29,338
–
Operating loss
(51,054
)
(48,201
)
(2,853
)
Loss before income taxes
(51,130
)
(48,201
)
(2,929
)
Income tax benefit
(7,519
)
(7,135
)
3
(384
)
Net loss
(43,611
)
(41,066
)
(2,545
)
Less: Net (loss) income attributable to redeemable noncontrolling interest
(6,870
)
(7,963
)
1,093
Net loss attributable to Vera Bradley, Inc.
(36,741
)
(33,103
)
(3,638
)
Diluted net loss per share available to Vera Bradley, Inc. common shareholders
$
(1.15
)
$
(1.03
)
$
(0.11
)
Vera Bradley Direct segment operating income (loss)
$
15,547
$
(6,173
)
4
$
21,720
Vera Bradley Indirect segment operating income (loss)
$
9,397
$
(994
)
5
$
10,391
Pura Vida segment operating (loss) income
$
(27,478
)
$
(31,854
)
6
$
4,376
Unallocated corporate expenses
$
(48,520
)
$
(9,180
)
7
$
(39,340
)
1Items include $6,142 for inventory adjustments associated with the exit of certain technology products and the goodMRKT brand, as well as excess mask products and $1,134 for PO cancellation fees
2Items include $5,714 for severance charges; $2,905 for consulting fees associated with cost savings initiatives and CEO search; $1,537 for the amortization of definite-lived intangible assets; $1,351 for store and right-of-use asset impairment charges; and $80 for goodMRKT brand exit costs
3Related to the tax impact of the charges mentioned above, as well as goodwill and intangible asset impairment charges
4Related to $5,097 related to an allocation for certain inventory adjustments and PO cancellation fees; $759 for store impairment charges; $302 for goodMRKT brand exit costs; and $15 for severance charges
5Related to an allocation for certain inventory adjustments and PO cancellation fees
6Related to $29,338 of goodwill and intangible asset impairment charges; $963 for inventory adjustments associated with mask products; $1,537 for the amortization of definite-lived intangible assets; and $16 for severance charges
7Related to $5,683 for severance charges; $2,905 for consulting fees associated with cost savings initiatives and CEO search; and $592 for a right-of-use asset impairment charge
RICHMOND, Va.–(BUSINESS WIRE)– Bowlero Corp. (NYSE: BOWL) (“Bowlero” or the “Company”), the global leader in bowling entertainment, will report financial results for the fourth quarter and full year 2023 on Monday, September 11, 2023 before the U.S. stock market opens. Management will discuss the results via webcast at 10:00 AM ET on the same day.
The live webcast, replay and results presentation will be available in the Events & Presentations section of the Bowlero Investor Relations website at https://ir.bowlerocorp.com/overview/default.aspx.
About Bowlero Corp.
Bowlero Corp. is the global leader in bowling entertainment, media, and events. With more than 325 bowling centers across North America, Bowlero Corp. serves more than 30 million guests each year through a family of brands that includes Bowlero and AMF. In 2019, Bowlero Corp. acquired the Professional Bowlers Association, the major league of bowling, which boasts thousands of members and millions of fans across the globe. For more information on Bowlero Corp., please visit BowleroCorp.com.
Company to Provide Updates on Multiple Phase 2 Clinical Trials
for its Next-Generation COVID-19 Vaccine and Cancer Immunotherapy Programs
ATLANTA, GA, August 29, 2023 – GeoVax Labs, Inc. (Nasdaq: GOVX), a biotechnology company developing immunotherapies and vaccines against cancers and infectious diseases, is pleased to announce that it has been invited to present at the Emerging Growth Conference on September 6, 2023. This live, interactive online event will give existing shareholders and the investment community the opportunity to interact with the Company’s Chairman and CEO, David Dodd, in real time.
Please register here to ensure you are able to attend the conference and receive any updates that are released.
Following his presentation, Mr. Dodd will open the floor for questions. Please submit your questions in advance to Questions@EmergingGrowth.com or ask your questions during the event and Mr. Dodd will do his best to get through as many of them as possible.
About the Emerging Growth Conference
The Emerging Growth Conference is an effective way for public companies to present and communicate their new products, services and other major announcements to the investment community. The conference focus and coverage includes companies in a wide range of growth sectors, with strong management teams, innovative products & services, focused strategy, execution, and the overall potential for long term growth. Its audience includes potentially tens of thousands of individual and institutional investors, as well as investment advisors and analysts. All sessions are conducted through video webcasts and take place in the Eastern time zone.
About GeoVax
GeoVax Labs, Inc. is a clinical-stage biotechnology company developing novel therapies and vaccines for solid tumor cancers and many of the world’s most threatening infectious diseases. The company’s lead program in oncology is a novel oncolytic solid tumor gene-directed therapy, Gedeptin®, presently in a multicenter Phase 1/2 clinical trial for advanced head and neck cancers. GeoVax’s lead infectious disease candidate is GEO-CM04S1, a next-generation COVID-19 vaccine targeting high-risk immunocompromised patient populations. Currently in three Phase 2 clinical trials, GEO-CM04S1 is being evaluated as a primary vaccine for immunocompromised patients such as those suffering from hematologic cancers and other patient populations for whom the current authorized COVID-19 vaccines are insufficient, and as a booster vaccine in patients with chronic lymphocytic leukemia (CLL). In addition, GEO-CM04S1 is in a Phase 2 clinical trial evaluating the vaccine as a more robust, durable COVID-19 booster among healthy patients who previously received the mRNA vaccines. GeoVax has a leadership team who have driven significant value creation across multiple life science companies over the past several decades. For more information, visit our website: www.geovax.com.
Original CookieCakeFranchiseExpands Florida Footprint
LOS ANGELES, Aug. 29, 2023 (GLOBE NEWSWIRE) — Great American Cookies, the Original Cookie Cake franchise, announces its return to the Orlando market with a new location. Situated in the Orlando International Premium Outlets, the latest store marks another successful Nestlé® Toll House® Café by Chip® conversion by FAT Brands, the parent company of Great American Cookies. The cookie chain has plans to continue its growth in Orlando with new locations set to open later this year.
“We are beyond excited for Great American Cookies to re-enter the Orlando market and offer our signature Cookie Cakes and Cookies to the community once again,” said Allison Lauenstein, President of the QSR Division at FAT Brands Inc. “Our brand has a rich history of creating memorable moments with our freshly baked CookieCakes, and we can’t wait to continue that tradition in Orlando.”
Since 1977, Great American Cookies has baked up a reputation for not only being the creator of the Original Cookie Cake, but also for its famous chocolate chip cookie recipe. Other craveable menu items include Brownies and Double Doozies™, delectable icing sandwiched between two cookies.
The new Great American Cookies Orlando store is located at 4955 International Dr., Unit 1C 02, Orlando, FL. 32819, and is open Monday through Sunday, 11 a.m. to 8 p.m.
About FAT (Fresh. Authentic. Tasty.) Brands FAT Brands (NASDAQ: FAT) is a leading global franchising company that strategically acquires, markets, and develops fast casual, quick-service, casual dining, and polished casual dining concepts around the world. The Company currently owns 17 restaurant brands: Round Table Pizza, Fatburger, Marble Slab Creamery, Johnny Rockets, Fazoli’s, Twin Peaks, Great American Cookies, Hot Dog on a Stick, Buffalo’s Cafe & Express, Hurricane Grill & Wings, Pretzelmaker, Elevation Burger, Native Grill & Wings, Yalla Mediterranean and Ponderosa and Bonanza Steakhouses, and franchises and owns over 2,300 units worldwide. For more information on FAT Brands, please visit www.fatbrands.com.
About Great American Cookies Founded on a family chocolate chip cookie recipe in 1977, Great American Cookies believes that pure, simple delight is part of living a full life. Serving the Original Cookie Cake, fresh baked cookies in a variety of flavors, brownies, and Double Doozies™, we promise to treat you to bites of bliss that prove how sweet life can be. With 400 bakeries across the country and internationally in Bahrain, Guam, Saudi Arabia, and treats available to ship right to your door, the sweet spot is always close to home. For more information, visit www.greatamericancookies.com.
HOUSTON, Aug. 29, 2023 /PRNewswire/ — Direct Digital Holdings, Inc. (Nasdaq: DRCT) (“Direct Digital Holdings” or the “Company”), a leading advertising and marketing technology platform operating through its companies Colossus Media, LLC (“Colossus SSP”), Huddled Masses LLC (“Huddled Masses”) and Orange142, LLC (“Orange142”), today announced that the Company has commenced an offer to purchase (the “Offer”) all of its outstanding publicly traded warrants (the “Warrants”) to purchase shares of its Class A common stock, par value $0.001 per share, at a purchase price of $1.20 in cash, without interest. The purpose of the Offer is to reduce the number of shares of Class A common stock that would become outstanding upon the exercise of Warrants, thus simplifying, and providing investors and potential investors with greater certainty as to, Direct Digital Holdings’ capital structure.
Direct Digital Holdings is also soliciting consents (the “Consent Solicitation”) to amend the Warrant Agreement, dated as of February 15, 2022 (the “Warrant Agreement”), by and between Direct Digital Holdings and Equiniti Trust Company, LLC (formerly American Stock Transfer & Trust Company, LLC (the “Transfer Agent”), which governs all of the Warrants, to permit Direct Digital Holdings to redeem each outstanding Warrant for $0.35 in cash, without interest, which is approximately 71% less than the price applicable to the Offer (such amendment, the “Warrant Amendment”). Pursuant to the terms of the Warrant Agreement, the adoption of the Warrant Amendment will require the consent of holders of at least a majority of the outstanding Warrants. In order to tender the Warrants in the Offer and receive $1.20 in cash for each of their Warrants, holders of the Warrants are required to consent to the Warrant Amendment. The Offer will be open until one minute after 11:59 p.m., Eastern Time, on September 26, 2023, unless extended or earlier terminated by Direct Digital Holdings (the “Expiration Date”). Tendered Warrants may be withdrawn by holders at any time prior to the Expiration Date. The Company’s obligation to complete the Offer is conditioned on the tender of more than 50% of the outstanding Warrants.
The Offer and Consent Solicitation are being made pursuant to an Offer to Purchase dated August 29, 2023, and Schedule TO, dated August 29, 2023, each of which will be filed with the Securities and Exchange Commission (“SEC”) and more fully set forth the terms and conditions of the Offer and Consent Solicitation.
The Company’s Class A common stock and Warrants are listed on The Nasdaq Stock Market LLC under the symbols “DRCT” and “DRCTW,” respectively. As of August 29, 2023, a total of 3,217,800 Warrants were outstanding.
Stifel, Nicolaus & Company, Incorporated has been appointed as the Dealer Manager for the Offer and Consent Solicitation, D.F. King, Co., Inc. (“D.F. King”) has been appointed as the Information Agent for the Offer and Consent Solicitation, and Equiniti Trust Company, LLC has been appointed as the Depositary for the Offer and Consent Solicitation. All questions concerning tender procedures and requests for additional copies of the offer materials, including the letter of transmittal and consent should be directed to D.F. King.
Important Additional Information Has Been Filed with the SEC
Copies of the Schedule TO and Offer to Purchase will be available free of charge at the website of the SEC at www.sec.gov. Requests for documents may also be directed to D.F. King at (866) 796-1290 (toll-free) or drct@dfking.com.
This announcement is for informational purposes only and shall not constitute an offer to purchase or a solicitation of an offer to sell the Warrants. The Offer and Consent Solicitation are being made only through the Schedule TO and Offer to Purchase, and the complete terms and conditions of the Offer and Consent Solicitation are set forth in the Schedule TO and Offer to Purchase.
Holders of the Warrants are urged to read the Schedule TO and Offer to Purchase carefully before making any decision with respect to the Offer and Consent Solicitation because they contain important information, including the various terms of, and conditions to, the Offer and Consent Solicitation.
None of Direct Digital Holdings, any of its management or its board of directors, or the Dealer Manager or the Information Agent or Depositary or any other person makes any recommendation as to whether or not Warrant holders should tender Warrants for exchange in the Offer or consent to the Warrant Amendment in the Consent Solicitation. Warrant holders must make their own decision as to whether to tender their Warrants and, if so, how many Warrants to tender.
About Direct Digital Holdings
Direct Digital Holdings (Nasdaq: DRCT), owner of operating companies Colossus SSP, Huddled Masses, and Orange 142, brings state-of-the-art sell- and buy-side advertising platforms together under one umbrella company. Direct Digital Holdings’ sell-side platform, Colossus SSP, offers advertisers of all sizes extensive reach within general market and multicultural media properties. The Company’s subsidiaries Huddled Masses and Orange142 deliver significant ROI for middle market advertisers by providing data-optimized programmatic solutions at scale for businesses in sectors that range from energy to healthcare to travel to financial services. Direct Digital Holdings’ sell- and buy-side solutions manage on average over 136,000 clients monthly, generating approximately 250 billion impressions per month across display, CTV, in-app and other media channels.
Forward Looking Statements
This press release may contain forward-looking statements within the meaning of federal securities laws, including the Private Securities Litigation Reform Act of 1995, Section 27A of the Securities Act of 1933, as amended, and Section 21E of the Securities Exchange Act of 1934, as amended, and which are subject to certain risks, trends and uncertainties.
As used below, “we,” “us,” and “our” refer to the Company. We use words such as “could,” “would,” “may,” “might,” “will,” “expect,” “likely,” “believe,” “continue,” “anticipate,” “estimate,” “intend,” “plan,” “project” and other similar expressions to identify forward-looking statements, but not all forward-looking statements include these words. All statements contained in this press release that do not relate to matters of historical fact should be considered forward-looking statements.
All of our forward-looking statements involve estimates and uncertainties that could cause actual results to differ materially from those expressed in or implied by the forward-looking statements. Our forward-looking statements are based on assumptions that we have made in light of our industry experience and our perceptions of historical trends, current conditions, expected future developments and other factors we believe are appropriate under the circumstances. Although we believe that these forward-looking statements are based on reasonable assumptions, many factors could affect our actual operating and financial performance and cause our performance to differ materially from the performance expressed in or implied by the forward-looking statements, including, but not limited to: our dependence on the overall demand for advertising, which could be influenced by economic downturns; any slow-down or unanticipated development in the market for programmatic advertising campaigns; the effects of health epidemics; operational and performance issues with our platform, whether real or perceived, including a failure to respond to technological changes or to upgrade our technology systems; any significant inadvertent disclosure or breach of confidential and/or personal information we hold, or of the security of our or our customers’, suppliers’ or other partners’ computer systems; any unavailability or non-performance of the non-proprietary technology, software, products and services that we use; unfavorable publicity and negative public perception about our industry, particularly concerns regarding data privacy and security relating to our industry’s technology and practices, and any perceived failure to comply with laws and industry self-regulation; restrictions on the use of third-party “cookies,” mobile device IDs or other tracking technologies, which could diminish our platform’s effectiveness; any inability to compete in our intensely competitive market; any significant fluctuations caused by our high customer concentration; our limited operating history, which could result in our past results not being indicative of future operating performance; any violation of legal and regulatory requirements or any misconduct by our employees, subcontractors, agents or business partners; any strain on our resources, diversion of our management’s attention or impact on our ability to attract and retain qualified board members as a result of being a public company; our dependence, as a holding company, on receiving distributions from Direct Digital Holdings, LLC to pay our taxes, expenses and dividends; the satisfaction of the conditions to the Offer, including the minimum tender condition; and other factors and assumptions discussed in the “Risk Factors,” “Management’s Discussion and Analysis of Financial Conditions and Results of Operations” and other sections of our filings with the Securities and Exchange Commission that we make from time to time. Should one or more of these risks or uncertainties materialize or should any of these assumptions prove to be incorrect, our actual operating and financial performance may vary in material respects from the performance projected in these forward-looking statements. Further, any forward-looking statement speaks only as of the date on which it is made, and except as required by law, we undertake no obligation to update any forward-looking statement contained in this press release to reflect events or circumstances after the date on which it is made or to reflect the occurrence of anticipated or unanticipated events or circumstances, and we claim the protection of the safe harbor for forward-looking statements contained in the Private Securities Litigation Reform Act of 1995.
TORONTO–(BUSINESS WIRE)– Largo Inc. (“Largo” or the “Company”) (TSX: LGO) (NASDAQ: LGO) today announces that its Board of Directors (the “Board”) has initiated a review and evaluation of strategic alternatives with the intent to unlock and fully maximize the value of Largo Clean Energy Corp. (“LCE”).
The comprehensive review and evaluation process will include consideration of a full range of strategic, business, and financial alternatives, including, but not limited to, evaluating and completing financing transactions at the LCE subsidiary level, mergers and acquisitions of LCE with other battery companies and partnership opportunities with well-established energy system producers who are interested in entering the vanadium battery sector with the unique elements that Largo offers to this industry.
Daniel Tellechea, Interim CEO and Director of Largo commented: “Largo is commencing a comprehensive and thorough review of strategic alternatives to accelerate and enhance the distinctive value proposition LCE presents for vanadium batteries and the long duration energy storage sector. We believe several strategic opportunities exist in the market today that would benefit from LCE’s unique characteristics, and a formal process for comparing these alternatives is expected to deliver maximum value for all shareholders in a timely manner. These characteristics include: i) LCE’s access to the innovative Largo Physical Vanadium Corp. (“LPV”) (TSXV:VAND, OTCQX:VANAF) structure, which is expected to significantly reduce vanadium battery costs for customers, ii) LCE’s U.S.-based manufacturing capabilities, which may be eligible for significant fiscal incentives, grants and benefits, and iii) LCE’s patented vanadium flow battery stack technology and electrolyte purification technology.”
He continued: “We believe the strategic review process announced today could also accelerate the prospects for deployment of vanadium units owned by LPV in batteries, which we consider provides a major improvement in the cost-competitiveness of LCE against other battery technologies and other vanadium flow battery competitors. With the start of this process underway, the Company also remains committed to delivering on its set targets for the year in a safe and responsible manner.”
There can be no assurance that this process will result in any specific strategic plan or financial transaction and the Company does not plan to provide updates on the status of the review unless there are material developments to report.
Gallatin Capital LLC (“Gallatin”) is advising on securities transactions and Castle Grove Capital, LLC (“Castle Grove Capital”) is providing consulting services in support of the strategic review and evaluation process. Inquiries regarding the process may be directed to Myron Manternach, a registered representative of Gallatin and the President of Castle Grove Capital.
About Largo
Largo has a long and successful history as one of the world’s preferred vanadium companies through the supply of its VPURE™ and VPURE+™ products, which are sourced from one of the world’s highest-grade vanadium deposits at the Company’s Maracás Menchen Mine in Brazil. Aiming to enhance value creation at Largo, the Company is in the process of implementing an ilmenite concentrate plant using feedstock sourced from its existing operations in addition to advancing its U.S.-based clean energy division with its VCHARGE vanadium batteries. Largo’s VCHARGE vanadium batteries contain a variety of innovations, enabling an efficient, safe and ESG-aligned long duration solution that is fully recyclable at the end of its 25+ year lifespan. Producing some of the world’s highest quality vanadium, Largo’s strategic business plan is based on two pillars: 1.) leading vanadium supplier with an outlined growth plan and 2.) U.S.-based energy storage business to support a low carbon future.
Largo’s common shares trade on the Nasdaq Stock Market and on the Toronto Stock Exchange under the symbol “LGO”. For more information on the Company, please visit www.largoinc.com.
Cautionary Statement on Forward-looking Information:
This press release contains forward-looking information under applicable securities legislation, (“forward-looking information”). Forward‐looking information in this press release includes, but is not limited to, statements with respect to LCE’s strategic review, the expectation that the strategic review will deliver maximum value for all shareholders, the timeliness of the strategic review, access to LPV’s structure, the ability to reduce vanadium battery costs for customers, eligibility for fiscal incentives, grants and benefits, the deployment of vanadium units and other benefits that may arise from the strategic review and/or LPV. Forward-looking information can be identified by the use of forward-looking terminology such as “plans”, “expects” or “does not expect”, “is expected”, “budget”, “scheduled”, “estimates”, “forecasts”, “intends”, “anticipates” or “does not anticipate”, or “believes”, or variations of such words and phrases or statements that certain actions, events or results “may”, “could”, “would”, “might” or “will be taken”, “occur” or “be achieved”. All information contained in this news release, other than statements of current and historical fact, is forward looking information.
Forward-looking information is subject to known and unknown risks, uncertainties and other factors that may cause the actual results, level of activity, performance or achievements to be materially different from those expressed or implied by such forward-looking information, including but not limited to those risks described in the annual information form of Largo and in its public documents filed on www.sedarplus.caand www.sec.govfrom time to time. Such risks and uncertainties include, without limitation: the ability to obtain, in a timely manner, all necessary regulatory, stock exchange, shareholder and other third-party approvals to consummate any transactions contemplated by the strategic review; the risk of any disruptions to the Company’s business and operations; competition; conflict in eastern Europe; changes in interest rates, inflation, foreign exchange rates, and the other risks involved in the mining and long-term battery storage industries and capital markets. Forward-looking information are based on the opinions and estimates of management as of the date such statements are made. Although management of Largo has attempted to identify important factors that could cause actual results to differ materially from those contained in forward-looking information, there may be other factors that cause results not to be as anticipated, estimated or intended. There can be no assurance that such statements will prove to be accurate, as actual results and future events could differ materially from those anticipated in such statements. Accordingly, readers should not place undue reliance on Forward-looking information. Largo does not undertake to update any forward-looking information, except in accordance with applicable securities laws. Readers should also review the risks and uncertainties sections of Largo’s annual and interim MD&A which also apply.
Trademarks are owned by Largo Inc.
For further information, please contact:
Investor Relations Alex Guthrie Senior Manager, External Relations +1.416.861.9778 aguthrie@largoinc.com

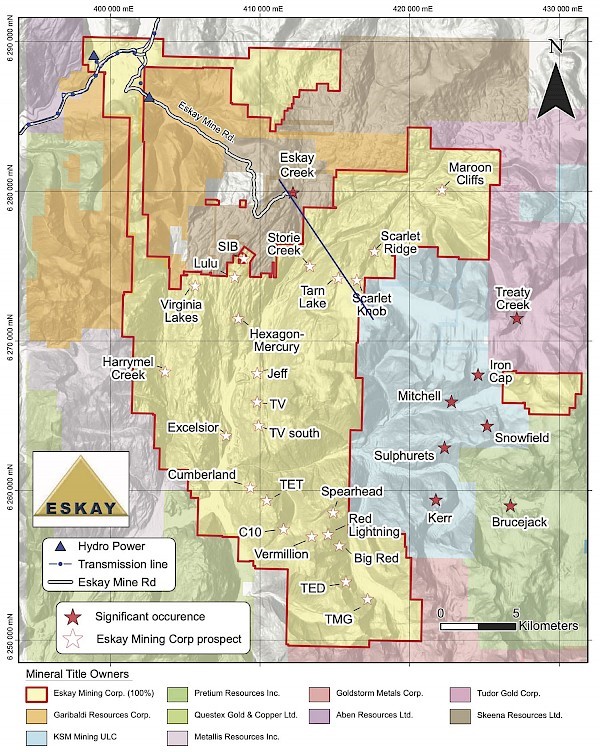
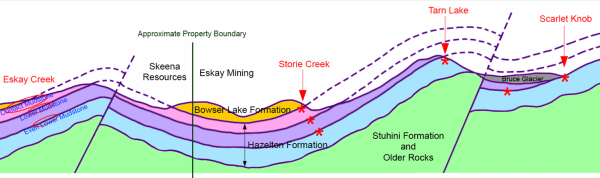
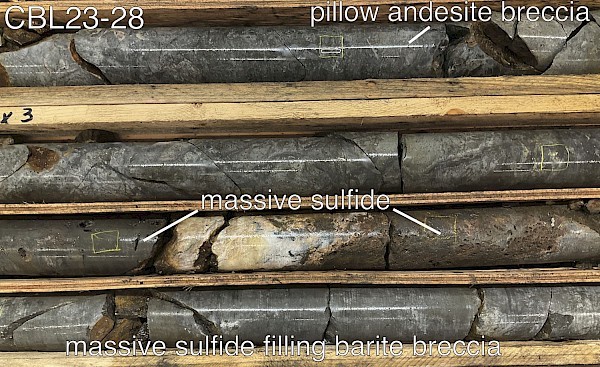

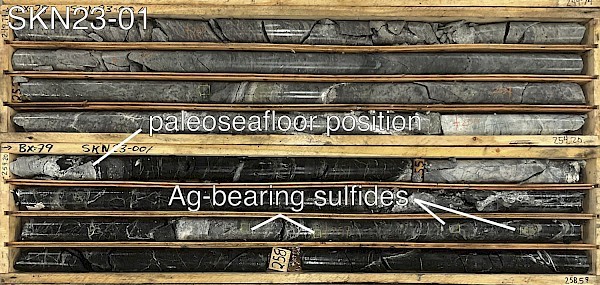


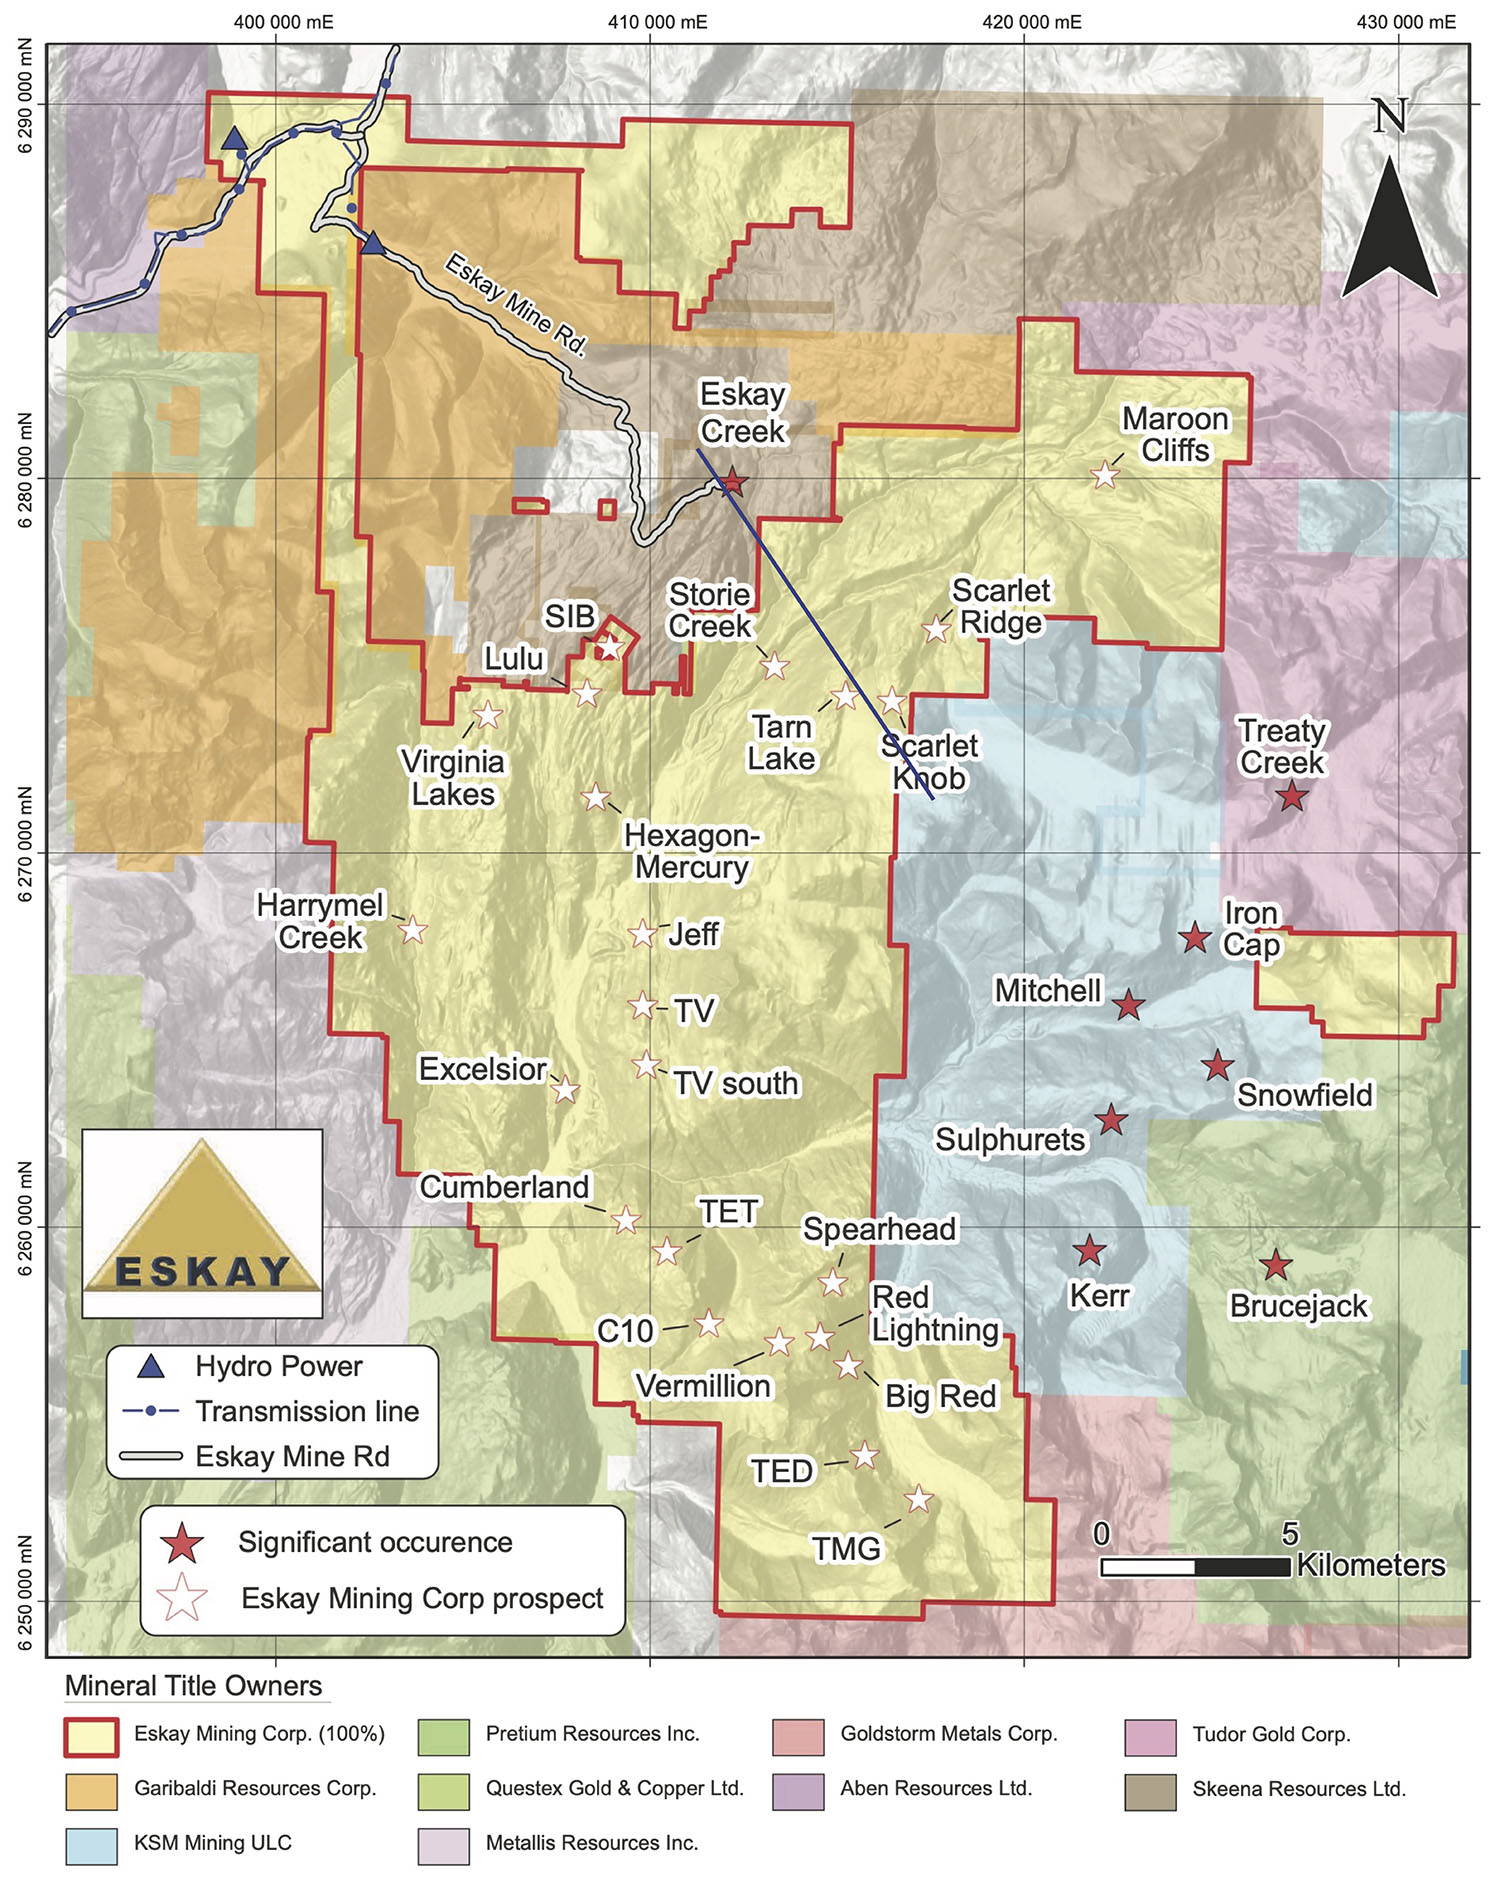
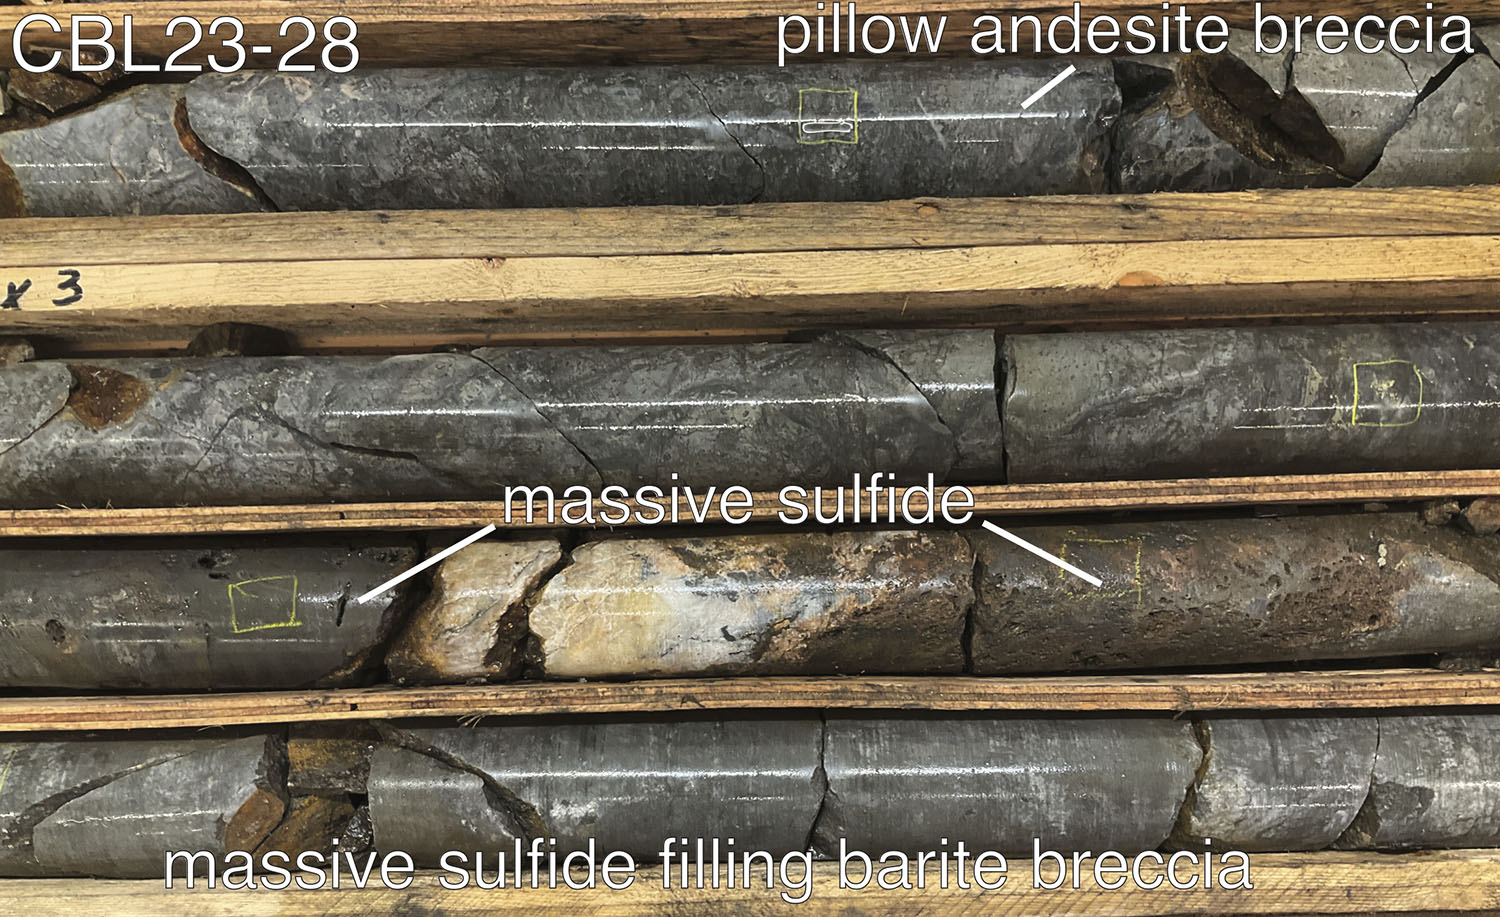
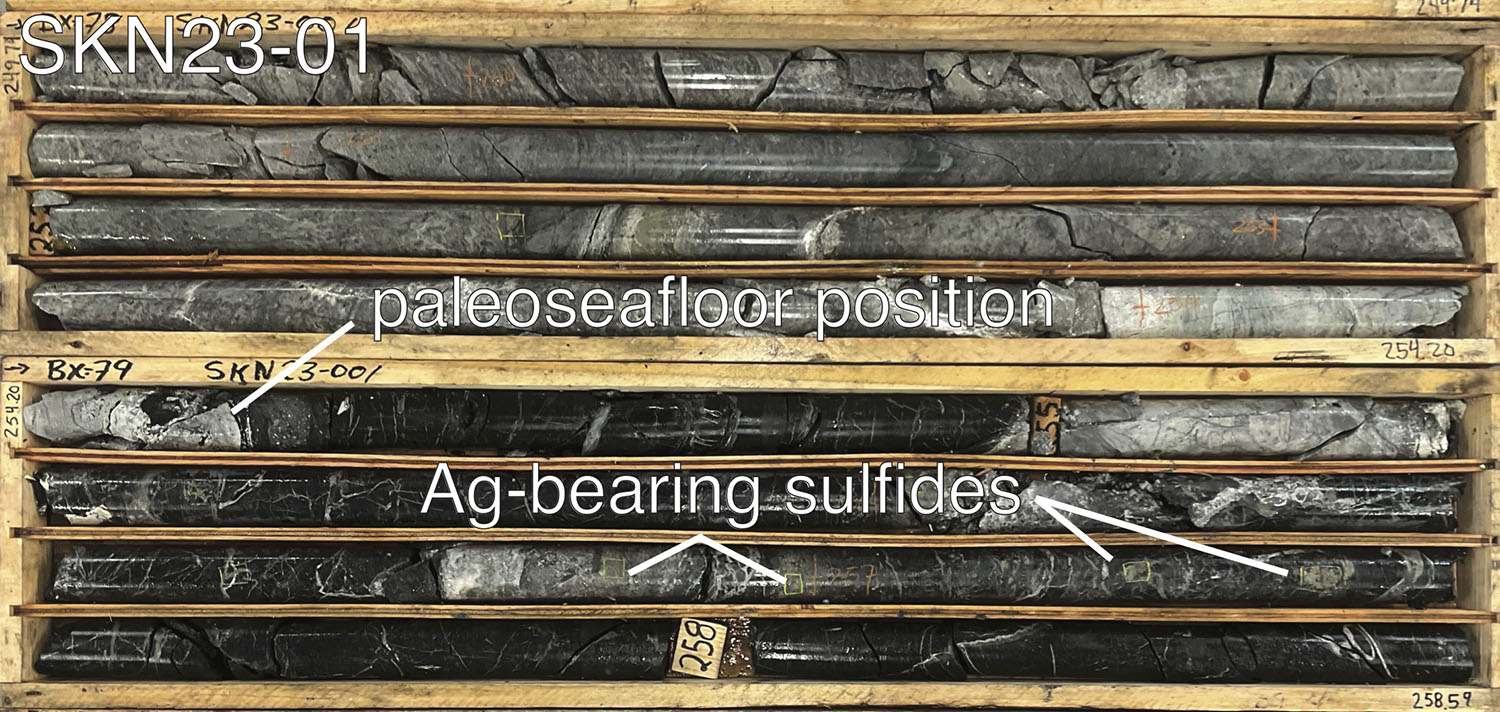