Transocean Ltd. (NYSE: RIG), a leading international provider of offshore contract drilling services, announced today that it has entered into a definitive agreement to acquire Valaris Limited (NYSE: VAL) in an all-stock transaction valued at approximately $5.8 billion. The transaction creates one of the largest and most diversified offshore drilling companies in the world, with a pro forma enterprise value of approximately $17 billion.
Under the terms of the agreement, Valaris shareholders will receive a fixed exchange ratio of 15.235 shares of Transocean stock for each Valaris common share. Based on the companies’ closing prices on February 6, 2026, Transocean shareholders will own approximately 53% of the combined company on a fully diluted basis, with Valaris shareholders owning the remaining 47%.
A Strategic Combination of Premium Offshore Assets
Transocean is widely recognized for operating the highest-specification floating offshore drilling fleet in the world, with a strong focus on ultra-deepwater and harsh-environment drilling. The company currently owns or operates a fleet of 27 mobile offshore drilling units, including 20 ultra-deepwater floaters and seven harsh-environment floaters.
Valaris brings complementary strengths, operating a high-quality fleet of ultra-deepwater drillships, versatile semisubmersibles, and modern shallow-water jackups. With operations spanning nearly every major offshore basin globally, Valaris has established itself as an industry leader across all water depths and geographies, emphasizing safety, operational excellence, and technological innovation.
On a pro forma basis, the combined company will own 73 rigs, including 33 ultra-deepwater drillships, nine semisubmersibles, and 31 modern jackups, significantly expanding its ability to serve customers in deepwater, harsh-environment, and shallow-water markets worldwide.
Financial and Operational Benefits
The transaction is expected to deliver substantial financial and operational benefits. The combined company will have an industry-leading contract backlog of approximately $10 billion, enhancing cash flow visibility and providing a strong foundation for long-term planning.
Transocean has identified more than $200 million in incremental cost synergies related to the transaction, additive to its ongoing cost-reduction program, which is expected to reduce costs by more than $250 million in aggregate through 2026. Management expects the stronger pro forma cash flow to accelerate debt reduction, targeting a leverage ratio of approximately 1.5x within 24 months of closing.
“This transaction creates a very attractive investment in the offshore drilling industry, differentiated by the best fleet, proven people, leading technologies, and unequalled customer service,” said Keelan Adamson, Transocean’s President and Chief Executive Officer. “The powerful combination is well-timed to capitalize on an emerging, multi-year offshore drilling upcycle.”
The combined company is expected to have an estimated pro forma market capitalization of approximately $12.3 billion, improved trading liquidity, and a stronger capital markets profile, potentially enabling broader equity index inclusion.
Leadership and Transaction Structure
Following the close of the transaction, Transocean’s senior management team will continue to lead the combined company, with Keelan Adamson serving as Chief Executive Officer. Jeremy Thigpen will assume the role of Executive Chairman of the Board. The board will consist of nine current Transocean directors and two current Valaris directors.
Transocean will remain incorporated in Switzerland, with its primary administrative office in Houston. Valaris Limited is a Bermuda exempted company, and the transaction will be completed through a court-approved scheme of arrangement under Bermuda’s Companies Act.
The transaction has been unanimously approved by the boards of directors of both companies and is expected to close in the second half of 2026, subject to regulatory approvals, customary closing conditions, and approval by shareholders of both companies. Shareholder support agreements have already been secured from Perestroika AS, which owns approximately 9% of Transocean’s outstanding shares, and from Famatown Finance Limited and Oak Hill Advisors, which collectively own approximately 18% of Valaris’ outstanding shares.
Industry Context and Recent Trends
The offshore drilling industry has been undergoing a period of consolidation following years of financial stress, bankruptcies, and asset rationalization. In recent years, the number of offshore drillers operating globally has declined sharply, leaving a smaller group of companies with increasingly high-quality fleets.
At the same time, energy producers have become more disciplined with capital spending, prioritizing returns over aggressive production growth. This has favored offshore projects with long reserve lives and lower decline rates, particularly in deepwater basins such as the Gulf of Mexico, Brazil, and offshore West Africa.
Oilfield service providers, including offshore drillers, have increasingly pursued mergers to improve scale, reduce costs, and enhance pricing power amid ongoing operational and pricing pressures. As available high-specification rigs remain constrained, leading contractors have been better positioned to benefit from improving dayrates and utilization.
Against this backdrop, the Transocean–Valaris combination reflects a broader industry trend toward creating larger, financially stronger players capable of supporting complex offshore developments while delivering improved returns to shareholders.
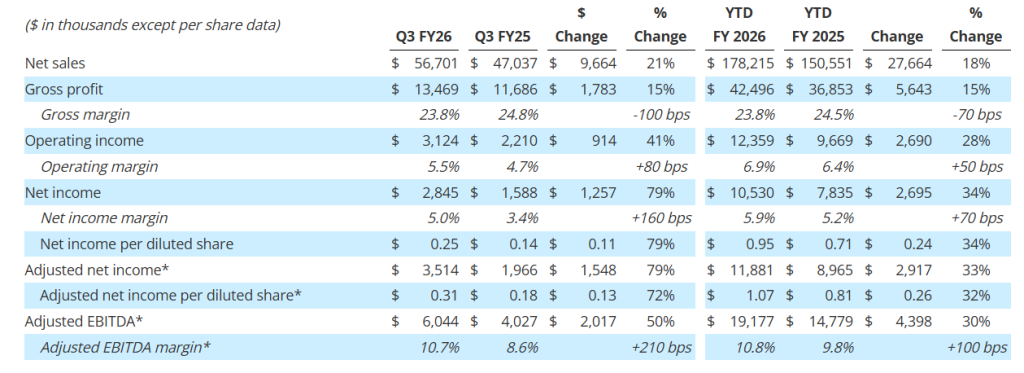
Gross profit increased 15% to $13.5 million; Gross profit margin was 23.8%
Net income per diluted share increased 79% to $0.25; adjusted net income per diluted share1 increased 72% to $0.31
Adjusted EBITDA1 increased 50% to $6.0 million; Adjusted EBITDA margin1 was 10.7%
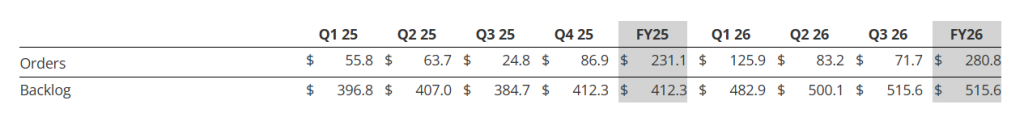
Orders2 were $71.7 million; Book-to-Bill ratio2 of 1.3x and record backlog2 of $515.6 million
Strong balance sheet with no debt, $22.3 million in cash, and access to $43.0 million under its revolving credit facility at quarter end to support growth initiatives
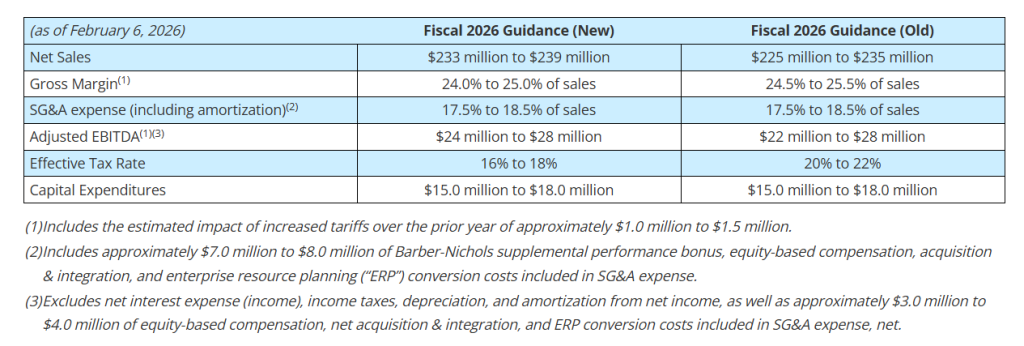
Updating and increasing full year fiscal 2026 guidance; Remain on track to reach strategic goal of 8% to 10% annual organic revenue growth and low to mid-teen Adjusted EBITDA margins1 by fiscal 2027
BATAVIA, N.Y.–(BUSINESS WIRE)– Graham Corporation (NYSE: GHM) (“GHM” or the “Company”), a global leader in the design and manufacture of mission critical fluid, power, heat transfer, vacuum, and advanced mixing technologies for the Defense, Energy & Process, and Space industries, today reported financial results for its third quarter for the fiscal year ending March 31, 2026 (“fiscal 2026”).
Graham’s President and Chief Executive Officer, Matthew J. Malone stated, “Our third quarter results reflect continued strong, disciplined execution across the organization as we progress through the back half of fiscal 2026. Revenue growth and profitability were driven by solid performance across our end markets and supported by a record backlog, which provides meaningful visibility into future demand. Activity in our Defense market remains robust, while the Energy & Process and Space markets continue to perform in line with our expectations.”
Mr. Malone continued, “As we move through the remainder of the fiscal year, we remain focused on disciplined execution, operational efficiency, and advancing strategic initiatives that strengthen our competitive position. We continue to invest in automation, advanced testing, and new technical capabilities that enhance productivity and support margin expansion. In addition, the recent acquisition of FlackTek in January 2026 meaningfully expands our technology portfolio and further positions Graham to deliver differentiated, mission-critical solutions to our core end markets.”
1Adjusted net income per diluted share, Adjusted EBITDA, and Adjusted EBITDA margin are non-GAAP measures. See attached tables and other information for important disclosures regarding Graham’s use of these non-GAAP measures. 2Orders, backlog, and book-to-bill ratio are key performance metrics. See “Key Performance Indicators” below for important disclosures regarding Graham’s use of these metrics.
Third Quarter Fiscal 2026 Performance Review
(All comparisons are with the same prior-year period unless noted otherwise.)
*Graham believes that, when used in conjunction with measures prepared in accordance with U.S. generally accepted accounting principles (“GAAP”), adjusted net income, adjusted net income per diluted share, adjusted EBITDA, and adjusted EBITDA margin, which are non-GAAP measures, help in the understanding of its operating performance. See attached tables and other information provided at the end of this press release for important disclosures regarding Graham’s use of these non-GAAP measures.
Quarterly net sales of $56.7 million increased 21%, or $9.7 million over the prior year reflecting our diversified revenue base. Sales to the Defense market contributed $8.3 million to growth primarily due to the timing of project milestones, new programs, and growth in existing programs. Sales to the Energy & Process market increased $2.1 million or 13% over the prior year driven by Aftermarket sales, as well as continued momentum in our New Energy markets and in particular small modular reactors (“SMRs”). Aftermarket sales to the Energy & Process and Defense markets totaled $10.8 million for the quarter, 11% above the prior year. See supplemental data for a further breakdown of sales by market and region.
Gross profit for the quarter increased $1.8 million, or 15%, to $13.5 million compared to the prior-year period of $11.7 million. As a percentage of sales, gross profit margin decreased 100 basis points to 23.8%, compared to the third quarter of fiscal 2025. This decrease in gross profit margin reflects the mix of sales during the third quarter of fiscal 2026, and a higher level of material receipts which carry lower profit margins. Additionally, the third quarter and the first nine months of fiscal 2025 gross profit benefited $0.3 million and $1.5 million, respectively, from a grant received in the prior year from the BlueForge Alliance to reimburse the Company for the cost of its defense welder training programs in Batavia, which did not repeat in fiscal year 2026. For the first nine months of fiscal 2026, we estimate the impact of tariffs on our consolidated financial statements to be approximately $1.0 million compared to the prior year and was immaterial for the third quarter of fiscal 2026. For the full fiscal 2026, we now expect the potential impact of tariffs to be between an incremental $1.0 to $1.5 million compared to the prior year.
Selling, general and administrative expense (“SG&A”), including intangible amortization, totaled $10.6 million, an increase of $0.9 million compared with the prior year due to the investments being made in operations, employees, and technology, higher acquisition and integration costs due to the Xdot and FlackTek acquisitions, as well as higher performance-based compensation due to Graham’s increased profitability, which was partially offset by a reversal of bad debt reserves. As a percentage of sales, SG&A, including amortization of 18.6%, decreased 200 basis points compared to the prior year period, reflecting the higher level of sales during the quarter, as well as our continued financial discipline.
Cash Management and Balance Sheet
Cash provided by operating activities totaled $4.8 million for the quarter ended December 31, 2025. As of December 31, 2025, cash and cash equivalents were $22.3 million.
Capital expenditures, net for the third quarter fiscal 2026 were $2.2 million, focused on capacity expansion, increasing capabilities, and productivity improvements.
The Company had no debt outstanding as of December 31, 2025, with $43.0 million available on its revolving credit facility after taking into account outstanding letters of credit.
Orders, Backlog, and Book-to-Bill Ratio
See supplemental data filed with the Securities and Exchange Commission on Form 8-K and provided on the Company’s website for a further breakdown of orders and backlog by market. See “Key Performance Indicators” below for important disclosures regarding Graham’s use of these metrics ($ in millions).
Orders for the third quarter of fiscal 2026 were $71.7 million. This increase was primarily in the Defense and Space markets, which continue to exhibit strong tail-winds. Energy & Process orders were consistent with prior year levels, as strong demand in New Energy offset weaker Aftermarket orders. Total Aftermarket orders for the third quarter of fiscal 2026 decreased $5.2 million to $8.0 million from the record levels of the prior year.
Note that our orders tend to be lumpy given the nature of our business (i.e. large capital projects) and in particular, orders to the Defense industry, which span multiple years and can be significantly larger in size.
Backlog at quarter end was a record $515.6 million, a 34% increase over the prior-year period, driven by strong bookings including contributions from Xdot of $0.5 million, primarily in the Defense and Space markets. For the quarter, the Company achieved a book-to bill ratio of 1.3x. Approximately 35% to 40% of orders currently in backlog are expected to be converted to sales in the next twelve months, another 25% to 30% are expected to convert to sales within one to two years, and the remaining beyond two years. Approximately 85% of our backlog as of December 31, 2025, was to the Defense industry, which provides stability and visibility to our business.
FlackTek Acquisition
On January 23, 2026, subsequent to the end of the third quarter, Graham acquired FlackTek Manufacturing, LLC and FlackTek Sales, LLC (collectively, “FlackTek”). The acquisition establishes advanced mixing and materials processing as a third core technology platform for Graham, complementing its existing vacuum, heat transfer, and turbomachinery capabilities and further aligning with the Company’s Defense, Energy & Process, and Space end markets.
Under the terms of the transaction, Graham acquired 100% of the equity of FlackTek for a purchase price of $35.0 million, comprised of 85% cash and 15% using 75,818 shares of Graham’s common stock, along with the potential to earn an additional $25 million in future performance-based cash earnouts over four years beginning in fiscal year 2027, based upon achieving progressively increasing adjusted EBITDA performance targets. The base purchase price represents approximately 12x FlackTek’s projected adjusted EBITDA for 2026. The transaction was funded through a combination of cash on-hand and borrowings under the Company’s revolving credit facility.
In connection with the acquisition, Graham amended its revolving credit agreement with Wells Fargo Bank, National Association, increasing the borrowing limit from $50 million to $80 million. Following the closing of the transaction, the Company’s pro forma leverage ratio is approximately 1.2x.
Fiscal 2026 Outlook
Based upon the results for the first nine months of fiscal 2026, our expectations for the remainder of the fiscal year, and inclusive of the acquisition of FlackTek and Xdot, Graham is updating its full year fiscal 2026 guidance as follows:
Graham’s Chief Financial Officer, Christopher J. Thome, said, “We are pleased with our performance through the first nine months of fiscal 2026 and continue to see strong demand across most of the markets we serve. Reflecting this momentum, including the contribution from the FlackTek acquisition, we are increasing our full-year fiscal 2026 guidance.
Mr. Thome continued, “After the acquisition of FlackTek, our balance sheet remains strong with low leverage, a modest amount of debt of $20 million, and increased capacity under our line of credit. We believe this increased capacity, along with our strong operating cash flow, provides us ample liquidity to continue to execute our capital allocation strategy and future growth.”
Webcast and Conference Call
GHM’s management will host a conference call and live webcast on February 6, 2026, at 11:00 a.m. Eastern Time (“ET”) to review its financial results as well as its strategy and outlook. The review will be accompanied by a slide presentation, which will be made available immediately prior to the conference call on GHM’s investor relations website.
A question-and-answer session will follow the formal presentation. GHM’s conference call can be accessed by calling (201)-689-8560. Alternatively, the webcast can be monitored from the events section of GHM’s investor relations website.
A telephonic replay will be available from 3:00 p.m. ET today through Friday, February 13, 2026. To listen to the archived call, dial (412) 317-6671 and enter conference ID number 13757532 or access the webcast replay via the Company’s website at ir.grahamcorp.com, where a transcript will also be posted once available.
About Graham Corporation
Graham is a global leader in the design and manufacture of mission critical fluid, power, heat transfer, vacuum, and advanced mixing technologies for the Defense, Energy & Process, and Space industries. Graham Corporation and its family of global brands are built upon world-renowned engineering expertise, proprietary technologies, as well as its responsive and flexible service and the unsurpassed quality customers have come to expect from the Company’s products and systems. Graham Corporation routinely posts news and other important information on its website, grahamcorp.com, where additional information on Graham Corporation and its businesses can be found.
NEW ALBANY, Ohio, Feb. 06, 2026 (GLOBE NEWSWIRE) — Commercial Vehicle Group (the “Company” or “CVG”) (NASDAQ: CVGI), a diversified industrial products and services company, today announced that its Board of Directors (“Board”) appointed Ari Levy of Lakeview Investment Group (“Lakeview”) as an independent director. Lakeview owns approximately 8.9% of the outstanding shares of the Company. In connection with Mr. Levy’s appointment, the Board was expanded to 7 members. Mr. Levy will serve on the Board’s Nominating, Governance and Sustainability, and Audit Committees.
Mr. Levy is the founder, President, and Chief Investment Officer of Lakeview Investment Group, a Chicago based Investment Manager focused on the public markets. Mr. Levy was the President of Levy Acquisition Corp, a NASDAQ listed acquisition vehicle, and subsequently served on the Board of the resulting public company, Del Taco, until it was acquired by Jack in the Box in early 2022. Ari holds a B.A. in International Relations from Stanford University.
“We are excited to welcome Ari to the Board,” said William Johnson, Chair of the Board of Directors. “His background and experience as a founder, operator, and investor will be valuable assets as we look to drive long-term value creation.”
“I am thrilled to join the CVG Board of Directors,” Ari Levy said. “I look forward to working alongside my fellow board members to help guide the Company into the future and maximize value for all stakeholders.”
Mr. Levy will stand for re-election at the Company’s 2026 Annual Meeting of Stockholders.
In connection with the appointment of Mr. Levy to the Board, the Company and Lakeview entered into a support agreement that contains customary standstill provisions.
Company Contact Andy Cheung Chief Financial Officer CVG IR@cvgrp.com
Investor Relations Contact Ross Collins or Nathan Skown Alpha IR Group CVGI@alpha-ir.com
About CVG
CVG is a global provider of systems, assemblies and components to the global commercial vehicle market and the electric vehicle market. We deliver real solutions to complex design, engineering and manufacturing problems while creating positive change for our customers, industries and communities we serve. Information about the Company and its products is available on the internet at www.cvgrp.com.
Conduent Incorporated (Nasdaq: CNDT), a global technology-driven business solutions and services company, plans to report its fourth-quarter and full-year 2025 financial results on Thursday, February 12 before market open. Management will present the results during a conference call and webcast at 9:00 a.m. ET.
The call will be available by live audiocast along with the news release and online presentation slides at https://investor.conduent.com/ .
The conference call will also be available by calling 877-407-4019 toll free. If requested, the conference ID is 13758159.
The international dial-in is +1 201-689-8337. The international conference ID is also 13758159.
A recording of the conference call will be available by calling 877-660-6853 after the conference call concludes. The access ID for the recording is 13758159.
The call recording will be available until February 26, 2026.
We look forward to your participation.
About Conduent Conduent delivers digital business solutions and services spanning the commercial, government and transportation spectrum – creating valuable outcomes for its clients and the millions of people who count on them. The Company leverages cloud computing, artificial intelligence, machine learning, automation and advanced analytics to deliver mission-critical solutions. Through a dedicated global team of approximately 53,000 associates, process expertise and advanced technologies, Conduent’s solutions and services digitally transform its clients’ operations to enhance customer experiences, improve performance, increase efficiencies and reduce costs. Conduent adds momentum to its clients’ missions in many ways including disbursing approximately $85 billion in government payments annually, enabling 2.3 billion customer service interactions annually, empowering millions of employees through HR services every year and processing nearly 13 million tolling transactions every day. Learn more at www.conduent.com .
Trademarks Conduent is a trademark of Conduent Incorporated in the United States and/or other countries. Other names may be trademarks of their respective owners.
The New SkyPlug Dedicated Brand Page for SKYX’s Product on HomeDepot.com Supports Product Education, Awareness, and Scalable Growth
Company Anticipates Significant Growth for its Turbo Heater and Ceiling Fan Models in Home Depot Channel During 2026
Launch Expands SKYX’s Retail Footprint and Positions the Company for Increased Consumer Reach in 2026
The Ceiling Fan and Space Heater Categories Represent a Multi-Billion-Dollar Annual Market in North America
MIAMI, Feb. 06, 2026 (GLOBE NEWSWIRE) — SKYX Platforms Corp. (NASDAQ: SKYX) (d/b/a SKYX Technologies) (the “Company” or “SKYX”), a highly disruptive smart home platform technology company with over 100 pending and issued patents globally and 60 lighting and home décor websites, with a mission to make homes and buildings become safe and smart as the new standard, today announced the launch of its newly patented all-in-one ceiling plug & play SKYFAN & Turbo Heater at Home Depot, including a new dedicated SkyPlug branding page for SKYX’s SKYFAN & Turbo Heater and its plug & play products on HomeDepot.com.
The Home Depot Turbo Heater launch, including the launch of SKYX’s new SkyPlug branding page on HomeDepot.com, is expected to support increased visibility, consumer education, and demand throughout fiscal year 2026, as the Company continues to grow its market penetration in both professional and retail segments.
The new branding page is designed to highlight SKYX’s advanced plug & play technologies, showcase its expanding product portfolio, and provide consumers with a centralized destination to learn about SKYX’s safety-driven installation-friendly for smart-home and lighting products.
The SKYFAN & Turbo Heater combines a ceiling fan with an integrated turbo heater, offering an alternative to traditional portable space heaters by moving heating and airflow to the ceiling, improving safety, efficiency, and space utilization. The product is designed for year-round use, addressing both heating and cooling needs across residential and light commercial settings.
In response to early demand and retailer engagement, SKYX expects to continue to expand variations, finishes, and additional SKUs of the Turbo Heater Ceiling Fan to serve both residential and commercial markets while production is underway through SKYX’s manufacturing partners.
For a link to the SKYX’s New Branding Page at Home Depot: Click Here
To view a video of SKYX’s turbo heater ceiling fan Click here
Lenny Sokolow, CEO of SKYX Platforms Corp., stated:
“Launching the SKYFAN & Turbo Heater at world leading home improvement retailer Home Depot with a new dedicated brand page marks an important step in scaling our product sales. Home Depot’s footprint and digital platform give us direct access to a broad customer base, supporting product discovery, education, and conversion. We believe this launch positions the Company for significant growth while expanding our market penetration.”
About SKYX Platforms Corp.
SKYX Platforms Corp. (NASDAQ: SKYX) is a technology platform company focused on making homes and buildings safe, advanced, and smart as the new standard. As electricity is present in every home and building, SKYX is developing disruptive plug & play technologies designed to modernize traditional electrical infrastructure while improving safety, functionality, and ease of use.
The Company holds over 100 issued and pending U.S. and global patents and owns 60 lighting and home décor websites serving both retail and professional markets. SKYX’s platform emphasizes high-quality design, simplicity, and enhanced safety, with applications intended for every room in residential, commercial, hospitality, and institutional buildings worldwide.
SKYX’s technologies support recurring revenue opportunities through product interchangeability, upgrades, AI-enabled services, monitoring, and subscriptions. The Company follows a “razor-and-blades” model, anchored by its advanced ceiling electrical outlet platform and an expanding portfolio of plug & play smart home products, including lighting, recessed and down lights, emergency and exit signage, ceiling fans, chandeliers, indoor and outdoor fixtures, and themed lighting solutions. Its plug & play technology enables rapid installation in high-rise buildings and hotels, reducing deployment timelines from months to days.
SKYX estimates its U.S. total addressable market at approximately $500 billion, with more than 4.2 billion ceiling applications in the U.S. alone. Revenue streams are expected to include product sales, licensing, royalties, subscriptions, monitoring services, and the sale of global country rights.
Certain statements made in this press release are not based on historical facts but are forward-looking statements. These statements can be identified by the use of forward-looking terminology such as “aim,” “anticipate,” “believe,” “can,” “could,” “continue,” “estimate,” “expect,” “evaluate,” “forecast,” “guidance,” “intend,” “likely,” “may,” “might,” “objective,” “ongoing,” “outlook,” “plan,” “potential,” “predict,” “probable,” “project,” “seek,” “should,” “target,” “view,” “will,” or “would,” or the negative thereof or other variations thereon or comparable terminology, although not all forward-looking statements contain these words. These statements reflect the Company’s reasonable judgment with respect to future events and are subject to risks, uncertainties and other factors, many of which have outcomes difficult to predict and may be outside our control, that could cause actual results or outcomes to differ materially from those in the forward-looking statements. Such risks and uncertainties include statements relating to the Company’s ability to successfully launch, commercialize, develop additional features and achieve market acceptance of its products and technologies and integrate its products and technologies with third-party platforms or technologies; the Company’s efforts and ability to drive the adoption of its products and technologies as a standard feature, including their use in homes, hotels, offices and cruise ships; the Company’s ability to capture market share; the Company’s estimates of its potential addressable market and demand for its products and technologies; the Company’s ability to raise additional capital to support its operations as needed, which may not be available on acceptable terms or at all; the Company’s ability to continue as a going concern; the Company’s ability to execute on any sales and licensing or other strategic opportunities; the possibility that any of the Company’s products will become National Electrical Code (NEC)-code or otherwise code mandatory in any jurisdiction, or that any of the Company’s current or future products or technologies will be adopted by any state, country, or municipality, within any specific timeframe or at all; risks arising from mergers, acquisitions, joint ventures and other collaborations; the Company’s ability to attract and retain key executives and qualified personnel; guidance provided by management, which may differ from the Company’s actual operating results; the potential impact of unstable market and economic conditions on the Company’s business, financial condition, and stock price; and other risks and uncertainties described in the Company’s filings with the Securities and Exchange Commission, including its periodic reports on Form 10-K and Form 10-Q. There can be no assurance as to any of the foregoing matters. Any forward-looking statement speaks only as of the date of this press release, and the Company undertakes no obligation to update or revise any forward-looking statements, whether as a result of new information, future events or otherwise, except as required by U.S. federal securities laws.
NEW YORK, February 6, 2026 /PRNewswire/ — Bit Digital, Inc. (Nasdaq: BTBT) (“Bit Digital” or the “Company”) today announced its monthly Ethereum (“ETH”) treasury and staking metrics for the month of January 2026:
Key Highlights for January 2026
As of January 31, 2026, the Company held approximately 155,239.4[1] ETH.
Based on a closing ETH price of approximately $2,449, as of January 31, 2026, the market value of the Company’s ETH holdings was approximately $380.2 million.
The Company’s total average ETH acquisition price for all holdings was approximately $3,045 as of January 31, 2026.
The Company’s total staked ETH was ~138,266, or ~89% of its total holdings, as of January 31, 2026.
Staking operations generated approximately 344.0 ETH in rewards during the period, representing an annualized yield of approximately 2.9%.
Bit Digital shares outstanding were 324,202,059 as of January 31, 2026.
The Company maintains ownership of approximately 27.0 million WhiteFiber (WYFI) shares with a market value of approximately $527.6 million as of January 31, 2026. On January 28, 2026, Bit Digital reaffirmed its long-term investment in WhiteFiber and confirmed that it will not sell any of its WhiteFiber shares in any secondary offering or other discretionary disposition during 2026.
About Bit Digital Bit Digital (NASDAQ: BTBT) is a Strategic Asset Company (SAC) focused on active participation in Ethereum infrastructure and controlling equity exposure to AI/HPC infrastructure through its majority ownership stake in WhiteFiber (NASDAQ: WYFI). The Company purchases and stakes ETH to generate protocol-native yield and participates directly in the Ethereum network. Bit Digital allocates capital with a focus on long-duration, foundational infrastructure and disciplined balance sheet management. For additional information, please contact ir@bit-digital.com or follow us on LinkedIn or X.
Investor Notice Investing in our securities involves a high degree of risk. Before making an investment decision, you should carefully consider the risks, uncertainties and forward-looking statements described under “Risk Factors” in Item 1A of our Annual Report on Form 10-K for the year ended December 31, 2024 (Annual Report) and any subsequently filed Quarterly Reports on Form 10-Q and any Current Reports on Form 8-K. If any material risk was to occur, our business, financial condition or results of operations would likely suffer. In that event, the value of our securities could decline and you could lose part or all of your investment. The risks and uncertainties we describe are not the only ones facing us. Additional risks not presently known to us or that we currently deem immaterial may also impair our business operations. In addition, our past financial performance may not be a reliable indicator of future performance, and historical trends should not be used to anticipate results in the future. See “Safe Harbor Statement” below.
Safe Harbor Statement This press release may contain certain “forward-looking statements” relating to the business of Bit Digital, Inc., and its subsidiary companies. All statements, other than statements of historical fact included herein are “forward-looking statements.” These forward-looking statements are often identified by the use of forward-looking terminology such as “believes,” “expects,” or similar expressions, involving known and unknown risks and uncertainties. Although the Company believes that the expectations reflected in these forward-looking statements are reasonable, they do involve assumptions, risks and uncertainties, and these expectations may prove to be incorrect. Investors should not place undue reliance on these forward-looking statements, which speak only as of the date of this press release. The Company’s actual results could differ materially from those anticipated in these forward-looking statements as a result of a variety of factors, including those discussed in the Company’s periodic reports that are filed with the Securities and Exchange Commission and available on its website at http://www.sec.gov. All forward-looking statements attributable to the Company or persons acting on its behalf are expressly qualified in their entirety by these factors. Other than as required under the securities laws, the Company does not assume a duty to update these forward-looking statements.
[1] Includes approximately 15,236.4 ETH and ETH-equivalents held in an externally managed fund.
Consumer sentiment in the United States showed a modest rebound in February, reaching its highest level since last August, according to the University of Michigan’s Index of Consumer Sentiment. The reading came in at 57.3, up 1.6 points from January, surpassing economists’ expectations of a decline to 55. While this represents an encouraging short-term improvement, sentiment remains significantly below last year’s highs, reflecting ongoing concerns about inflation, job security, and long-term economic stability.
Compared with February 2025, when sentiment stood at 64.7, the index is down 11.4%, and roughly 20% below the peak levels recorded last year. Joanne Hsu, director of surveys of consumers at the University of Michigan, emphasized that “recent monthly increases have been small — well under the margin of error — and the overall level of sentiment remains very low from a historical perspective.” According to Hsu, Americans continue to worry about the erosion of personal finances due to high prices and the elevated risk of job loss.
The February report highlights mixed signals from the labor market. Jobless claims came in higher than expected this week, suggesting some near-term labor market pressures. Yet, data from Challenger, Gray & Christmas show that December job cuts were at their lowest level since 2023. Official jobs data from the Bureau of Labor Statistics (BLS) is scheduled for release on February 11, after delays caused by a partial government shutdown, which had postponed the initial report.
Inflation expectations also showed improvement in February. Survey respondents now anticipate a 3.5% increase in prices over the next year, down from 4% previously. This is the lowest expected inflation since January 2025, though it remains above the pre-pandemic range of roughly 2.3% to 3%. The BLS is set to release its latest inflation report on February 13, which will provide further clarity on the trajectory of price growth.
Interestingly, consumer sentiment appears increasingly tied to exposure to financial markets. Those with the largest stock portfolios reported surging confidence, while sentiment among households without stock holdings stagnated at historically low levels. Hsu noted that this divergence underscores the unequal impact of financial markets on Americans’ perceptions of the economy.
The survey also reflected nuanced changes in economic expectations. Modest improvements were reported in consumers’ assessments of current personal finances and buying conditions for durable goods, but these were offset by a slight decline in expectations for long-run business conditions. Overall, the February data presents a picture of cautious optimism: consumers are slightly more confident than in recent months, yet significant economic anxieties remain.
As Americans navigate high prices and labor market uncertainties, the path forward for consumer confidence remains fragile. Analysts will be closely watching upcoming jobs and inflation reports for further signals, particularly as financial market volatility and global economic pressures continue to influence sentiment. For now, February’s reading offers a small but notable lift in confidence, reminding policymakers and businesses alike that while the recovery is underway, it remains uneven across different segments of the population.
The GEO Group, Inc. (NYSE: GEO) is a leading diversified government service provider, specializing in design, financing, development, and support services for secure facilities, processing centers, and community reentry centers in the United States, Australia, South Africa, and the United Kingdom. GEO’s diversified services include enhanced in-custody rehabilitation and post-release support through the award-winning GEO Continuum of Care®, secure transportation, electronic monitoring, community-based programs, and correctional health and mental health care. GEO’s worldwide operations include the ownership and/or delivery of support services for 103 facilities totaling approximately 83,000 beds, including idle facilities and projects under development, with a workforce of up to approximately 18,000 employees.
Joe Gomes, CFA, Managing Director, Equity Research Analyst, Generalist , Noble Capital Markets, Inc.
Refer to the full report for the price target, fundamental analysis, and rating.
Environment. The current operating environment remains charged, as evidenced by the daily news. Nonetheless, we would point out that a key platform of the Trump Administration remains illegal immigration, and we do not expect that to change. Funding remains available under The One Big Beautiful Bill. And, historically, enforcement operations remain ongoing even in the face of a government shutdown.
Less New Awards Than Anticipated. The pace of new awards has been less than we had expected over the past few months. Whether this is just a temporary pause due to the significant number of new awards in 2025, the most recent new contract for GEO was the December skip tracing services contract worth up to $121 million of revenue over a two year period.
Equity Research is available at no cost to Registered users of Channelchek. Not a Member? Click ‘Join’ to join the Channelchek Community. There is no cost to register, and we never collect credit card information.
This Company Sponsored Research is provided by Noble Capital Markets, Inc., a FINRA and S.E.C. registered broker-dealer (B/D).
*Analyst certification and important disclosures included in the full report. NOTE: investment decisions should not be based upon the content of this research summary. Proper due diligence is required before making any investment decision.
Patrick McCann, CFA, Research Analyst, Noble Capital Markets, Inc.
Michael Kupinski, Director of Research, Equity Research Analyst, Digital, Media & Technology , Noble Capital Markets, Inc.
Refer to the full report for the price target, fundamental analysis, and rating.
Fiscal Q2 results. SelectQuote reported fiscal Q2 revenue of $537.1 million, above our $520.0 million estimate, driven by stronger-than-expected Senior performance. Adj. EBITDA of $84.7 million exceeded our $82.0 million forecast, reflecting near-record 39% adj. EBITDA margins in Senior that more than offset pharmacy reimbursement pressure.
Medicare Advantage headwinds. Management cited pressure from a large national carrier’s decision to reduce strategic marketing spend across all channels. We believe this reflects a deliberate effort to moderate enrollment growth and protect plan profitability following above-trend member additions, rather than any deterioration in underlying demand.
Equity Research is available at no cost to Registered users of Channelchek. Not a Member? Click ‘Join’ to join the Channelchek Community. There is no cost to register, and we never collect credit card information.
This Company Sponsored Research is provided by Noble Capital Markets, Inc., a FINRA and S.E.C. registered broker-dealer (B/D).
*Analyst certification and important disclosures included in the full report. NOTE: investment decisions should not be based upon the content of this research summary. Proper due diligence is required before making any investment decision.
InPlay Oil is a junior oil and gas exploration and production company with operations in Alberta focused on light oil production. The company operates long-lived, low-decline properties with drilling development and enhanced oil recovery potential as well as undeveloped lands with exploration possibilities. The common shares of InPlay trade on the Toronto Stock Exchange under the symbol IPO and the OTCQX Exchange under the symbol IPOOF.
Mark Reichman, Managing Director, Equity Research Analyst, Natural Resources, Noble Capital Markets, Inc.
Hans Baldau, Associate Analyst, Noble Capital Markets, Inc.
Refer to the full report for the price target, fundamental analysis, and rating.
Bond offering details. InPlay announced a senior unsecured bond issuance in Israel for up to 550 million New Israeli Shekels (NIS), or approximately C$241 million. Three amortization payments of 6% of the principal amount of the bonds will be due on December 15 of 2027, 2028, and 2029, and the fourth and last amortization payment of the remaining 82% will be due on December 15, 2030. The offering is expected to close on or around February 12, 2026, subject to certain conditions.
Expanding capital market access. Beyond the financing itself, we view the transaction as a strategic expansion of InPlay’s funding base outside of Canada. InPlay received interest from over 40 institutional investors in the oversubscribed offering and, to date, has accepted tenders for NIS 550 million of the bonds. The transaction further strengthens InPlay’s diversified financing sources while reducing its overall cost of capital.
Equity Research is available at no cost to Registered users of Channelchek. Not a Member? Click ‘Join’ to join the Channelchek Community. There is no cost to register, and we never collect credit card information.
This Company Sponsored Research is provided by Noble Capital Markets, Inc., a FINRA and S.E.C. registered broker-dealer (B/D).
*Analyst certification and important disclosures included in the full report. NOTE: investment decisions should not be based upon the content of this research summary. Proper due diligence is required before making any investment decision.
Bitcoin has clawed its way back above the $65,000 mark, offering a brief sense of relief after a punishing selloff that has put the cryptocurrency on track for its steepest weekly decline since late 2022. The rebound comes amid signs that a broader rout in global technology stocks may be stabilizing, easing pressure on risk assets that had been aggressively sold across markets.
Despite the bounce, the damage has already been done. Bitcoin is still down nearly 14% on the week, reflecting how quickly sentiment has shifted after months of fragility in digital asset markets. Prices earlier dipped close to $60,000, a level that rattled traders who had grown accustomed to sharp rallies fueled by optimism around artificial intelligence, crypto-friendly political rhetoric, and expanding institutional participation.
The current downturn highlights how closely bitcoin has become linked to the wider tech and macro trade. As leveraged positions in equities, precious metals, and cryptocurrencies were unwound, bitcoin was swept up in the selloff. What was once marketed as a hedge against traditional markets is again behaving like a high-beta risk asset, moving in step with broader shifts in investor appetite for risk.
Ethereum has followed a similar path. While ether has rebounded toward $1,900, it remains deep in the red for the week and significantly lower year-to-date. The weakness across major tokens underscores the broader cooling of enthusiasm toward crypto after last year’s explosive rally ended abruptly.
Since peaking in early October, the total crypto market has shed roughly $2 trillion in value, according to industry data. More than half of that decline has occurred in just the past month, as investors reassess assumptions that prices would continue climbing without interruption. Analysts point to excessive leverage and crowded positioning as key contributors to the speed and severity of the pullback.
Another headwind has come from U.S. spot bitcoin exchange-traded funds, which have seen sustained outflows in recent months. Billions of dollars have exited these products since November, signaling that institutional investors are reducing exposure rather than stepping in to buy the dip. That shift has removed a major source of support that previously helped absorb selling pressure.
Still, some market participants caution against interpreting the move toward $60,000 as a sign that crypto’s long-term story is broken. Instead, they argue the pullback reflects a normalization process after speculative narratives ran ahead of fundamentals. In this view, the current volatility is forcing traders to confront real risk management rather than relying on momentum alone.
Whether bitcoin’s recovery above $65,000 marks the beginning of a more durable rebound remains uncertain. Much will depend on broader market conditions, particularly the trajectory of equities and interest rates. For now, bitcoin’s price action serves as a reminder that even the most popular digital assets are not immune to sharp corrections—and that conviction is tested most when volatility returns.
Kodiak Gas Services, Inc. (NYSE: KGS) announced it has entered into a definitive agreement to acquire Distributed Power Solutions, LLC (DPS) in a transaction valued at approximately $675 million, marking a strategic expansion beyond traditional contract compression into the rapidly growing distributed power market. The acquisition, which includes $575 million in cash and roughly $100 million in Kodiak equity, is expected to close in early April 2026, subject to regulatory approvals and customary conditions.
DPS is a leading provider of turnkey, scalable, and highly reliable distributed power solutions, serving customers across energy, industrial, and digital infrastructure end markets. Its fleet includes approximately 384 megawatts of modern generation capacity powered by Caterpillar reciprocating engines and turbines, positioning it as a premium platform in a market increasingly constrained by grid limitations.
The strategic rationale for the deal centers on strong operational and commercial synergies. Kodiak brings deep expertise in operating and maintaining large-horsepower equipment, supported by more than 700 Caterpillar-certified technicians, advanced fleet monitoring systems, and embedded maintenance processes. Management expects these capabilities to enhance the reliability and uptime of DPS’s generation assets while supporting future fleet expansion.
Financially, the acquisition is expected to be immediately accretive to earnings and discretionary cash flow per share. The transaction values DPS at approximately 7.4x estimated 2026 adjusted EBITDA, a compelling multiple given the business’s contracted revenue profile and exposure to high-growth end markets. Notably, DPS has secured long-term contracts, including roughly 100 megawatts serving a large data center operator with demonstrated 99.9% reliability for over a year.
The deal also expands Kodiak’s customer reach. While the company has historically focused on upstream and midstream oil and gas customers, DPS adds exposure to digital infrastructure clients, including data centers increasingly adopting “bring-your-own-power” solutions. With power grid constraints intensifying and data center demand accelerating, distributed power is emerging as a primary, long-term energy solution rather than a temporary backup option.
Kodiak President and CEO Mickey McKee described distributed power as a natural extension of the company’s core competencies, noting that the acquisition enhances Kodiak’s ability to deliver critical energy infrastructure while opening new avenues for growth. DPS President Scott Milligan echoed that sentiment, highlighting the cultural alignment between the two companies and the opportunity to scale DPS’s high-quality fleet on a larger operational platform.
From a strategic perspective, the transaction positions Kodiak at the intersection of energy reliability and digital growth. As data centers, industrial users, and energy customers seek faster deployment and greater control over power supply, the combined Kodiak-DPS platform is well positioned to meet rising demand.
With an experienced management team joining Kodiak and a strong backlog of contracted cash flows, the acquisition represents a meaningful step in Kodiak’s evolution from a pure-play compression provider into a broader provider of mission-critical energy infrastructure solutions.
STAMFORD, Conn.–(BUSINESS WIRE)– Information Services Group (ISG) (Nasdaq: III), a global AI-centered technology research and advisory firm, said today it will release its fourth-quarter financial results on Thursday, March 5, 2026, at approximately 4:15 p.m., U.S. Eastern Time.
The firm will host a conference call with investors and industry analysts at 9 a.m., U.S. Eastern Time, the following day, Friday, March 6. Dial-in details are as follows:
The dial-in number for U.S. participants is +1 (800) 715-9871.
International participants should call +1 (646) 307-1963.
The security code to access the call is 6145572.
Participants are requested to dial in at least five minutes before the scheduled start time.
A recording of the conference call will be accessible on ISG’s investor relations page for approximately four weeks following the call.
About ISG
ISG (Nasdaq: III) is a global AI-centered technology research and advisory firm. A trusted partner to more than 900 clients, including 75 of the world’s top 100 enterprises, ISG is a long-time leader in technology and business services that is now at the forefront of leveraging AI to help organizations achieve operational excellence and faster growth. The firm, founded in 2006, is known for its proprietary market data, in-depth knowledge of provider ecosystems, and the expertise of its 1,600 professionals worldwide working together to help clients maximize the value of their technology investments.