Release – Kratos Reports Fourth Quarter and Full Year 2024 Financial Results

Research News and Market Data on KTOS

February 26, 2025 at 4:00 PM EST

PDF Version

           Full Year 2024 Revenues of $1.136 Billion Reflect 9.6 Percent Growth and 9.1 Percent Organic Growth, Respectively, Over Full Year 2023 Revenues of $1.037 Billion

Full Year 2024 Unmanned Systems Revenues of $270.5 Million Reflect 27.5 Percent Growth and 25.1 Percent Organic Growth Over Full Year 2023 Revenues of $212.2 Million

Full Year 2024 KGS Revenues of $865.8 Million Reflect 5.0 Percent Organic Growth of $40.9 Million Over Full Year 2023 Revenues of $824.9 Million

Full Year 2024 Net Income of $16.3 Million and GAAP EPS of $0.11 Per Share

Fourth Quarter 2024 Revenues of $283.1 Million Reflect 3.4 Percent Growth Over Fourth Quarter 2023 Revenues of $273.8 Million

Fourth Quarter 2024 Cash Flow Generated from Operations and Free Cash Flow of $45.6 million and $32.0 million, Respectively

Fourth Quarter 2024 Consolidated Book to Bill Ratio of 1.5 to 1 and Bookings of $434.2 Million

Last Twelve Months Ended December 29, 2024 Consolidated Book to Bill Ratio of 1.2 to 1 and Bookings of $1.354 Billion

2025 Financial Forecast Includes 10 Percent Organic Revenue Growth and 2026 Initial Revenue Growth Forecast of 13 to 15 Percent over 2025 Forecast Based on Recent Program Awards

SAN DIEGO, Feb. 26, 2025 (GLOBE NEWSWIRE) — Kratos Defense & Security Solutions, Inc. (Nasdaq: KTOS), a Technology Company in the Defense, National Security and Commercial Markets, today reported its fourth quarter 2024 financial results, including Revenues of $283.1 million, Operating Income of $3.0 million, Net Income attributable to Kratos of $3.9 million, Adjusted EBITDA of $25.2 million and a consolidated book to bill ratio of 1.5 to 1.0.

Fourth quarter 2024 Net Income and Operating Income includes non-cash stock compensation expense of $6.8 million, Company-funded Research and Development (R&D) expense of $10.6 million, including efforts in our Space, Satellite, Unmanned Systems and Microwave Electronic businesses, and expense to accrue $3.2 million related to an employee benefit plan assumed by the Company in an acquisition completed in 2011.

Kratos reported fourth quarter 2024 GAAP Net Income attributable to Kratos of $3.9 million and GAAP Net Income per share of $0.03, compared to GAAP Net Income attributable to Kratos of $2.4 million and GAAP Net Income per share of $0.02, for the fourth quarter of 2023. Adjusted earnings per share (EPS) was $0.13 for the fourth quarter of 2024, compared to $0.12 for the fourth quarter of 2023.

Fourth quarter 2024 Revenues of $283.1 million increased $9.3 million, reflecting 3.4 percent organic growth from fourth quarter 2023 Revenues of $273.8 million. Organic revenue growth was reported in both our Unmanned Systems and KGS segments, with KGS growth including increased revenues in Kratos Turbine Technologies, Defense Rocket Systems, Microwave Products, and C5ISR, offset by the previously reported and expected decline of approximately $16.1 million in the Space and Satellite business, including the industry related impact from OEM delays in the manufacture and delivery of software defined satellites.

Fourth quarter 2024 Cash Flow Generated from Operations was $45.6 million, primarily reflecting the receipt of accelerated favorable customer milestone payments, and increases in deferred revenues or customer advanced payments to $76.3 million at the end of the fourth quarter of 2024, up from $61.9 million at the end of the third quarter of 2024. Free Cash Flow Generated from Operations for the Fourth Quarter of 2024 was $32.0 million after funding of $13.6 million of capital expenditures.

For the fourth quarter of 2024, Kratos’ Unmanned Systems (KUS) segment generated Revenues of $61.1 million and organic revenue growth of 10.3 percent, as compared to $55.4 million in the fourth quarter of 2023, primarily reflecting increased target drone sales. KUS’s Operating Loss was $0.7 million in the fourth quarter of 2024, compared to Operating Income of $1.0 million in the fourth quarter of 2023. KUS’s Adjusted EBITDA for the fourth quarter of 2024 was $2.6 million, compared to $4.0 million for the fourth quarter 2023, reflecting revenue mix, the impact of increased material and subcontractor costs on multi-year fixed price contracts and increased R&D costs.

KUS’s book-to-bill ratio for the fourth quarter of 2024 was 1.3 to 1.0 and 1.2 to 1.0 for the twelve months ended December 29, 2024, with bookings of $82.4 million for the three months ended December 29, 2024, and bookings of $326.8 million for the twelve months ended December 29, 2024. Total backlog for KUS at the end of the fourth quarter of 2024 was $295.2 million compared to $273.9 million at the end of the third quarter of 2024 and $239.0 million at the end of the fourth quarter of 2023.

For the fourth quarter of 2024, Kratos’ Government Solutions (KGS) segment Revenues of $222.0 million increased from Revenues of $218.4 million in the fourth quarter of 2023, reflecting a 1.6 percent growth and organic growth rate. The increased Revenues includes organic revenue growth in our Turbine Technologies, C5ISR, Defense Rocket Support and Microwave Products businesses of $19.7 million, offset by the previously reported and expected decline of approximately $16.1 million in the Space and Satellite business.

KGS reported Operating Income of $11.0 million in the fourth quarter of 2024 compared to $17.5 million in the fourth quarter of 2023, primarily reflecting the mix in revenues and resources as well as the expense to accrue $3.2 million in the fourth quarter of 2024 related to a benefit plan assumed by the Company in a previous acquisition. Fourth quarter 2024 KGS Adjusted EBITDA was $22.6 million, compared to fourth quarter 2023 KGS Adjusted EBITDA of $25.1 million, primarily reflecting the mix in revenues and resources.

KGS reported a book-to-bill ratio of 1.6 to 1.0 for the fourth quarter of 2024, a book to bill ratio of 1.2 to 1.0 for the last twelve months ended December 29, 2024 and bookings of $351.8 million and $1.028 billion for the three and last twelve months ended December 29, 2024, respectively. KGS’s total backlog at the end of the fourth quarter of 2024 was $1.150 billion, as compared to $1.020 billion at the end of the third quarter of 2024, and $988.0 million at the end of the fourth quarter of 2023.

Kratos reported consolidated bookings of $434.2 million and a book-to-bill ratio of 1.5 to 1.0 for the fourth quarter of 2024, and consolidated bookings of $1.354 billion and a book-to-bill ratio of 1.2 to 1.0 for the last twelve months ended December 29, 2024. Consolidated backlog was $1.445 billion on December 29, 2024, as compared to $1.294 billion at September 29, 2024 and $1.227 billion on December 31, 2023. Kratos’ bid and proposal pipeline was $12.4 billion at December 29, 2024, as compared to $11.0 billion at December 31, 2023. Backlog at December 29, 2024 included funded backlog of $1.090 billion and unfunded backlog of $355.0 million.

Full Year 2024 Results

Kratos reported its full year 2024 financial results, including Revenues of $1.136 billion, Operating Income of $29.0 million, Net Income attributable to Kratos of $16.3 million, Adjusted EBITDA of $105.7 million and a consolidated book to bill ratio of 1.2 to 1.0.

Included in the full year 2024 Net Income and Operating Income is non-cash stock compensation expense of $29.8 million, Company-funded Research and Development (R&D) expense of $40.3 million, including ongoing development efforts in our Space and Satellite Communications business to develop our first to market, virtual, software-based OpenSpace command & control (C2), telemetry tracking & control (TT&C) and other ground system solutions and ongoing development efforts in our Unmanned Systems and Microwave Products businesses, and an expense to accrue $3.2 million related to an employee benefit plan assumed by the Company in an acquisition completed in 2011.

Kratos reported full year 2024 GAAP Net Income of $16.3 million and GAAP Net Income per share of $0.11, compared to a GAAP Net Loss attributable to Kratos of $8.9 million and a GAAP Net Loss per share of $0.07, for the full year 2023. Adjusted earnings per share (EPS) was $0.49 for the full year 2024, compared to $0.42 for the full year 2023.

Full year 2024 Revenues of $1.136 billion increased $99.2 million, reflecting 9.6 percent growth and 9.1 percent organic growth, including the impact of the Sierra Technical Services, Inc. (STS) acquisition on a pro forma basis as if acquired at the beginning of 2023, respectively, from full year 2023 Revenues of $1.037 billion. Full year 2024 Cash Flow Generated from Operations was $49.7 million, including the receipt of accelerated favorable customer milestone payments, offset partially by working capital uses including increases in inventories, prepaid assets and investments in other assets and reduction of deferred revenues or advanced customer payments. Free Cash Flow Used in Operations was $8.5 million after funding of $58.2 million of capital expenditures. Full year 2024 capital expenditures were elevated due primarily to the manufacture of the two production lots of Valkyries prior to contract award to meet anticipated customer orders and requirements and due to investments related to the expansion and addition of production facilities.

For full year 2024, KUS generated Revenues of $270.5 million, as compared to $212.2 million in the full year 2023, reflecting 27.5 percent growth and 25.1 percent organic growth, including the impact of the STS acquisition on a pro forma basis as if acquired at the beginning of 2023, primarily reflecting increased domestic and international drone activity. KUS’s Operating Income was $2.9 million in full year 2024 compared to $4.2 million in full year 2023. KUS’s Adjusted EBITDA for full year 2024 was $16.3 million, compared to full year 2023 Adjusted EBITDA of $14.8 million, reflecting the increased volume partially offset by increased material and subcontractor costs on multi-year fixed price contracts and increased R&D costs.

For full year 2024, KGS Revenues of $865.8 million increased $40.9 million, reflecting 5.0 percent organic growth from Revenues of $824.9 million in full year 2023. The increased Revenues includes organic revenue growth in our Turbine Technologies, C5ISR, Microwave Products, Defense Rocket Support and Training Solutions businesses aggregating $88.7 million, offset by a reduction of $47.8 million in offset by the Space and Satellite business described previously.

KGS reported operating income of $56.6 million in full year 2024 compared to $52.7 million in full year 2023, primarily reflecting the increased revenue volume. Full year 2024 KGS Adjusted EBITDA was $89.4 million, compared to full year 2023 KGS Adjusted EBITDA of $80.6 million, primarily reflecting the increased revenue.

Eric DeMarco, Kratos’ President and CEO, said, “Kratos’ full year 2024 and fourth quarter demonstrated once again that we can significantly organically grow the business, and make sizable internally funded investments, positioning the Company for accelerating future growth, while also generating significant, positive operating cash flow. We have recently received several large new program and contract awards, including in the hypersonic, target drone, jet engine, rocket, and satellite system areas, enabling us to increase our expected revenue growth rate for 2026 to a range of 13 percent to 15 percent above our current 2025 financial forecast that we provided today, which includes 10 percent growth over 2024. Kratos’ fourth quarter 1.5 to 1.0 book to bill ratio and our $12.4 Billion opportunity pipeline also provides confidence in our expected accelerating future growth trajectory, with increased margins.”

Mr. DeMarco continued, “The Trump Administration has increased emphasis on reducing cost, rapidly fielding new technology and systems and getting more for less, all which are and have been pillars of Kratos’ Mission. At Kratos, “Affordability is a Technology” and “Better is the Enemy of Good Enough Ready to Field Today”, as represented in our Erinyes, Dark Fury and other hypersonic vehicles, our Zeus, Oriole and other rocket systems, and our jet drones, jet engines and propulsion systems. We believe Kratos’ alignment with the new Administration’s objectives will be recognized in increased bookings, increased expected future growth rates and increased future profitability, including as based on recent meetings and discussions with certain of our customers.”

Mr. DeMarco concluded, “After decades of focus on fighting terrorism and asymmetric warfare, the United States has begun a generational rebuild of its industrial base and the ability to deter and defeat Nation State adversaries. The Axis of Resistance and the threat to the U.S. and its Allies is real, and Kratos is a key element of the proven Peace through Overwhelming Strength approach to Global Security and stability. As a result, we expect a future, multiyear, up and to the right organic growth trajectory with increased margins and profitability, and Kratos making the necessary investments in, among other things, property, plant, and equipment, to successfully execute for our customers and country.”

Financial Guidance

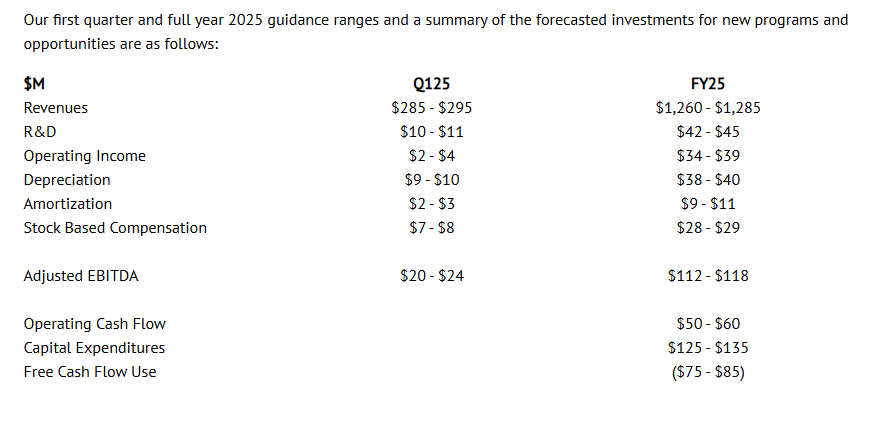
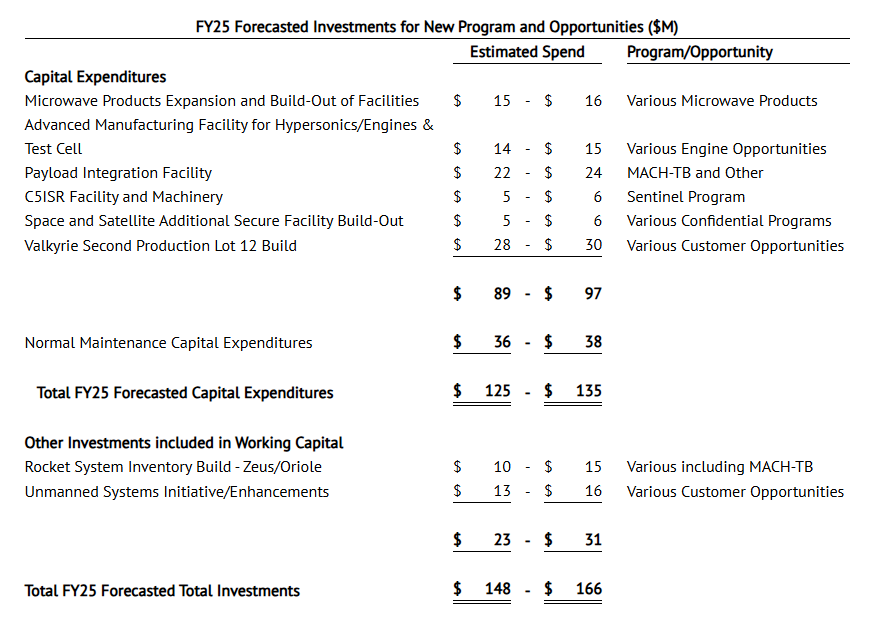
We are providing our initial 2025 first quarter and full year 2025 financial guidance range, which includes our assumptions, including as related to: current forecasted business mix, employee sourcing, hiring and retention; manufacturing, production and supply chain disruptions; parts shortages and related continued significant cost and price increases in each of these areas, that are impacting the industry and Kratos. Additionally, a U.S. Government budget was not passed by October 1, 2024, the beginning of Federal Fiscal Year 2025, and as a result, Kratos and others in our industry are operating under a Continuing Resolution Authorization (CRA), which currently expires March 14, 2025, under which no new contracts and no increases in existing contracts production or funding, among other stipulations, is permitted. If the current CRA is not resolved by March 14, 2025, the industry and Kratos will have operated under CRAs, without a DoD Budget, for approximately 12 of the previous 18 months. Kratos has a number of new and existing programs and contracts which are directly being impacted by the current CRA. Kratos’ 2025 financial forecast and guidance provided today assumes that the current CRA will be resolved by March 14, 2025, and that a U.S. Federal and DoD budget which includes no unexpected funding cuts impacting our business occurs. If the current CRA goes substantially beyond the existing March 14, 2025 date, or if there are significant reductions or changes to programs, contracts or initiatives that Kratos is or expects to be involved with, we will evaluate Kratos’ 2025 and future financial forecasts at that time, based on the existing facts, circumstances and expectations and make any adjustments required.

Kratos’ 2025 financial forecast and guidance includes elevated investments for capital expenditures for property, plant and equipment, including the expansion of our manufacturing and production facilities and related inventory builds in our Rocket Systems and Hypersonic businesses, primarily related to the recent MACH-TB 2.0 contract award, the continued manufacture of two production lots of Valkyries prior to contract award, to meet anticipated customer orders and requirements, the expansion and build-out of the Company’s Microwave Products production facilities, the expansion and build-out of our small jet engine production and test cell facilities, and the build-out of additional secure facilities for our federal secured space communications business, in accordance with contract and customer requirements. Kratos’ operating cash flow guidance also assumes certain investments in our rocket systems and unmanned systems businesses.

Management will discuss the Company’s financial results, on a conference call beginning at 2:00 p.m. Pacific (5:00 p.m. Eastern) today. The call will be available at www.kratosdefense.com. Participants may register for the call using this Online Form. Upon registration, all telephone participants will receive the dial-in number along with a unique PIN that can be used to access the call. For those who cannot access the live broadcast, a replay will be available on Kratos’ website.

About Kratos Defense & Security Solutions

Kratos Defense & Security Solutions, Inc. (NASDAQ: KTOS) is a technology, products, system and software company addressing the defense, national security, and commercial markets.  Kratos makes true internally funded research, development, capital and other investments, to rapidly develop, produce and field solutions that address our customers’ mission critical needs and requirements.  At Kratos, affordability is a technology, and we seek to utilize proven, leading edge approaches and technology, not unproven bleeding edge approaches or technology, with Kratos’ approach designed to reduce cost, schedule and risk, enabling us to be first to market with cost effective solutions.  We believe that Kratos is known as an innovative disruptive change agent in the industry, a company that is an expert in designing products and systems up front for successful rapid, large quantity, low cost future manufacturing which is a value add competitive differentiator for our large traditional prime system integrator partners and also to our government and commercial customers.  Kratos intends to pursue program and contract opportunities as the prime or lead contractor when we believe that our probability of win (PWin) is high and any investment required by Kratos is within our capital resource comfort level. We intend to partner and team with a large, traditional system integrator when our assessment of PWin is greater or required investment is beyond Kratos’ comfort level. Kratos’ primary business areas include virtualized ground systems for satellites and space vehicles including software for command & control (C2) and telemetry, tracking and control (TT&C), jet powered unmanned aerial drone systems, hypersonic vehicles and rocket systems, propulsion systems for drones, missiles, loitering munitions, supersonic systems, space craft and launch systems, C5ISR and microwave electronic products for missile, radar, missile defense, space, satellite, counter UAS, directed energy, communication and other systems, and virtual & augmented reality training systems for the warfighter.  For more information, visit www.KratosDefense.com

Notice Regarding ForwardLooking Statements
This news release contains certain forward-looking statements that involve risks and uncertainties, including, without limitation, express or implied statements concerning the Company’s expectations regarding its future financial performance, including the Company’s expectations for its first quarter and full year 2025 revenues, 2026 revenue growth rates and expected contributors to 2026 projected revenue growth, organic revenue growth rates, R&D, operating income (loss), depreciation, amortization, stock based compensation expense, and Adjusted EBITDA, and full year 2025 operating cash flow, capital expenditures and other investments, and free cash flow, the Company’s future growth trajectory and ability to achieve improved revenue mix and profit in certain of its business segments and the expected timing of such improved revenue mix and profit, including the Company’s ability to achieve sustained year over year increasing revenues, profitability and cash flow, the Company’s expectation of ramp on projects and that investments in its business, including Company funded R&D expenses and ongoing development efforts, will result in an increase in the Company’s market share and total addressable market and position the Company for significant future organic growth, profitability, cash flow and an increase in shareholder value, the Company’s bid and proposal pipeline and backlog, including the Company’s ability to timely execute on its backlog, demand for its products and services, including the Company’s alignment with today’s National Security requirements and the positioning of its C5ISR and other businesses, planned 2025 investments, including in the tactical drone and satellite areas, and the related potential for additional growth in 2025 and beyond, ability to successfully compete and expected new customer awards, including the magnitude and timing of funding and the future opportunity associated with such awards, including in the target and tactical drone and satellite communication areas, performance of key contracts and programs, including the timing of production and demonstration related to certain of the Company’s contracts and control (TT&C) product offerings, the impact of the Company’s restructuring efforts and cost reduction measures, including its ability to improve profitability and cash flow in certain business units as a result of these actions and to achieve financial leverage on fixed administrative costs, the ability of the Company’s advanced purchases of inventory to mitigate supply chain disruptions and the timing of converting these investments to cash through the sales process, benefits to be realized from the Company’s net operating loss carry forwards, the availability and timing of government funding for the Company’s offerings, including the strength of the future funding environment, the short-term delays that may occur as a result of Continuing Resolutions or delays in U.S. Department of Defense (DoD) budget approvals, timing of LRIP and full rate production related to the Company’s unmanned aerial target system offerings, as well as the level of recurring revenues expected to be generated by these programs once they achieve full rate production, market and industry developments, and any unforeseen risks associated with any public health crisis, supply chain disruptions, availability of an experienced skilled workforce, inflation and increased costs, risks related to potential cybersecurity events or disruptions of our information technology systems, and delays in our financial projections, industry, business and operations, including projected growth. Such statements are only predictions, and the Company’s actual results may differ materially from the results expressed or implied by these statements. Investors are cautioned not to place undue reliance on any such forward-looking statements. All such forward-looking statements speak only as of the date they are made, and the Company undertakes no obligation to update or revise these statements, whether as a result of new information, future events or otherwise. Factors that may cause the Company’s results to differ include, but are not limited to: risks to our business and financial results related to the reductions and other spending constraints imposed on the U.S. Government and our other customers, including as a result of sequestration and extended continuing resolutions, the Federal budget deficit and Federal government shut-downs; risks of adverse regulatory action or litigation; risks associated with debt leverage; risks that our cost-cutting initiatives will not provide the anticipated benefits; risks that changes, cutbacks or delays in spending by the DoD may occur, which could cause delays or cancellations of key government contracts; risks of delays to or the cancellation of our projects as a result of protest actions submitted by our competitors; risks that changes may occur in Federal government (or other applicable) procurement laws, regulations, policies and budgets; risks of the availability of government funding for the Company’s products and services due to performance, cost growth, or other factors, changes in government and customer priorities and requirements (including cost-cutting initiatives, the potential deferral of awards, terminations or reduction of expenditures to respond to the priorities of Congress and the Administration, or budgetary cuts resulting from Congressional committee recommendations or automatic sequestration under the Budget Control Act of 2011, as amended); risks that the unmanned aerial systems and unmanned ground sensor markets do not experience significant growth; risks that products we have developed or will develop will become programs of record; risks that we cannot expand our customer base or that our products do not achieve broad acceptance which could impact our ability to achieve our anticipated level of growth; risks of increases in the Federal government initiatives related to in-sourcing; risks related to security breaches, including cyber security attacks and threats or other significant disruptions of our information systems, facilities and infrastructures; risks related to our compliance with applicable contracting and procurement laws, regulations and standards; risks related to the new DoD Cybersecurity Maturity Model Certification; risks relating to the ongoing conflict in Ukraine and the Israeli-Palestinian military conflict; risks to our business in Israel; risks related to contract performance; risks related to failure of our products or services; risks associated with our subcontractors’ or suppliers’ failure to perform their contractual obligations, including the appearance of counterfeit or corrupt parts in our products; changes in the competitive environment (including as a result of bid protests); failure to successfully integrate acquired operations and compete in the marketplace, which could reduce revenues and profit margins; risks that potential future goodwill impairments will adversely affect our operating results; risks that anticipated tax benefits will not be realized in accordance with our expectations; risks that a change in ownership of our stock could cause further limitation to the future utilization of our net operating losses; risks that we may be required to record valuation allowances on our net operating losses which could adversely impact our profitability and financial condition; risks that the current economic environment will adversely impact our business, including with respect to our ability to recruit and retain sufficient numbers of qualified personnel to execute on our programs and contracts, as well as expected contract awards and risks related to increasing interest rates and risks related to the interest rate swap contract to hedge Term SOFR associated with the Company’s Term Loan A; currently unforeseen risks associated with any public health crisis, and risks related to natural disasters or severe weather. These and other risk factors are more fully discussed in the Company’s Annual Report on Form 10-K for the period ended December 29, 2024, and in our other filings made with the Securities and Exchange Commission.

Note Regarding Use of Non-GAAP Financial Measures and Other Performance Metrics
This news release contains non-GAAP financial measures, including organic revenue growth rates, Adjusted EPS (computed using income from continuing operations before income taxes, excluding income (loss) from discontinued operations, excluding income (loss) attributable to non-controlling interest, excluding depreciation, amortization of intangible assets, amortization of capitalized contract and development costs, stock-based compensation expense, acquisition and restructuring related items and other, which includes, but is not limited to, legal related items, non-recoverable rates and costs, and foreign transaction gains and losses, less the estimated impact to income taxes) and Adjusted EBITDA (which includes net income (loss) attributable to noncontrolling interest and excludes, among other things, losses and gains from discontinued operations, acquisition and restructuring related items, stock compensation expense, foreign transaction gains and losses, and the associated margin rates). Additional non-GAAP financial measures include Free Cash Flow from Operations computed as Cash Flow from Operations less Capital Expenditures plus proceeds from sale of assets and Adjusted EBITDA related to our KUS and KGS businesses. Kratos believes this information is useful to investors because it provides a basis for measuring the Company’s available capital resources, the actual and forecasted operating performance of the Company’s business and the Company’s cash flow, excluding non-recurring items and non-cash items that would normally be included in the most directly comparable measures calculated and presented in accordance with GAAP. The Company’s management uses these non-GAAP financial measures, along with the most directly comparable GAAP financial measures, in evaluating the Company’s actual and forecasted operating performance, capital resources and cash flow. Non-GAAP financial measures should not be considered in isolation from, or as a substitute for, financial information presented in compliance with GAAP, and investors should carefully evaluate the Company’s financial results calculated in accordance with GAAP and reconciliations to those financial results. In addition, non-GAAP financial measures as reported by the Company may not be comparable to similarly titled amounts reported by other companies. As appropriate, the most directly comparable GAAP financial measures and information reconciling these non-GAAP financial measures to the Company’s financial results prepared in accordance with GAAP are included in this news release.

Another Performance Metric the Company believes is a key performance indicator in our industry is our Book to Bill Ratio as it provides investors with a measure of the amount of bookings or contract awards as compared to the amount of revenues that have been recorded during the period and provides an indicator of how much of the Company’s backlog is being burned or utilized in a certain period. The Book to Bill Ratio is computed as the number of bookings or contract awards in the period divided by the revenues recorded for the same period. The Company believes that the rolling or last twelve months’ Book to Bill Ratio is meaningful since the timing of quarter-to-quarter bookings can vary.

Press Contact:
Claire Burghoff
claire.burghoff@kratosdefense.com 

Investor Information:
877-934-4687
investor@kratosdefense.com

View Full Release Here.

Release – MAIA Biotechnology Announces Design for Expansion of THIO-101 Phase 2 Trial in Advanced Non-Small Cell Lung Cancer

Research News and Market Data on MAIA

February 26, 2025 8:47am EST Download as PDF

  • Expansion study to enroll patients in the U.S. and select countries in Europe and Asia
  • Multiple milestones attainable for 2025

CHICAGO–(BUSINESS WIRE)– MAIA Biotechnology, Inc., (NYSE American: MAIA) (“MAIA,” the “Company”), a clinical-stage biopharmaceutical company developing targeted immunotherapies for cancer, today announced the trial design for the expansion of its THIO-101 pivotal Phase 2 trial in non-small cell lung cancer (NSCLC). Following successful outcomes to date in THIO-101, the expansion of the study will assess overall response rates (ORR) in advanced NSCLC patients receiving third line (3L) therapy who were resistant to previous checkpoint inhibitor treatments (CPI) and chemotherapy.

The THIO-101 study in 3L will enroll up to 48 patients with two arms: Arm 1, continuing the evaluation of THIO sequenced with Libtayo® (cemiplimab); and Arm 2, evaluating THIO as a monotherapy, to further gain experience of THIO in the contribution of components. Treatment cycles for patients in both arms will administer THIO on 3 consecutive days, followed by immune activation on day 4. Arm 1 will administer Libtayo on day 5. The Company plans to enroll an additional 100 patients for the registration phase of the trial. MAIA expects to conduct the trials in the U.S. and select countries in Europe and Asia.

MAIA recently announced an amended clinical supply agreement with Regeneron to include the expansion portion of THIO-101. Under terms of the amended agreement, MAIA continues to sponsor THIO-101 and Regeneron will provide Libtayo for the treatment of all patients including the additional patients in the expansion and potentially, the registration studies.

“We are excited to start the expansion arm of our THIO-101 trial which is designed to determine overall response rates in third line NSCLC. We expect to have new patients enrolled in the coming weeks,” said Vlad Vitoc, M.D., CEO of MAIA. “Through THIO-101 to date, THIO has delivered unprecedented disease control, response, and survival results. Continued efficacy and safety data generated by our study could support an FDA NDA submission directly, particularly as we plan to seek an accelerated approval of THIO in the U.S.

“We have multiple milestones that we believe are attainable for 2025 and we look forward to keeping our shareholders and investors well informed of our progress on value creation,” Dr. Vitoc added.

As of January 15, 2025, data indicated that Median Overall Survival (OS) in third-line treatment was reached at 16.9 months, with a 95% confidence interval (CI) lower bound of 12.5 months and a 99% CI lower bound of 10.8 months). The treatment has been generally well-tolerated to date in this heavily pre-treated population1.

________________________________
1Details on safety can be found on the previously announced SITC 2024 presentation available on MAIA’s website.
 

About THIO
THIO (6-thio-dG or 6-thio-2’-deoxyguanosine) is a first-in-class investigational telomere-targeting agent currently in clinical development to evaluate its activity in Non-Small Cell Lung Cancer (NSCLC). Telomeres, along with the enzyme telomerase, play a fundamental role in the survival of cancer cells and their resistance to current therapies. The modified nucleotide 6-thio-2’-deoxyguanosine (THIO) induces telomerase-dependent telomeric DNA modification, DNA damage responses, and selective cancer cell death. THIO-damaged telomeric fragments accumulate in cytosolic micronuclei and activates both innate (cGAS/STING) and adaptive (T-cell) immune responses. The sequential treatment with THIO followed by PD-(L)1 inhibitors resulted in profound and persistent tumor regression in advanced, in vivo cancer models by induction of cancer type–specific immune memory. THIO is presently developed as a second or later line of treatment for NSCLC for patients that have progressed beyond the standard-of-care regimen of existing checkpoint inhibitors.

About THIO-101, a Phase 2 Clinical Trial
THIO-101 is a multicenter, open-label, dose finding Phase 2 clinical trial. It is the first trial designed to evaluate THIO’s anti-tumor activity when followed by PD-(L)1 inhibition. The trial is testing the hypothesis that low doses of THIO administered prior to cemiplimab (Libtayo®) will enhance and prolong immune response in patients with advanced NSCLC who previously did not respond or developed resistance and progressed after first-line treatment regimen containing another checkpoint inhibitor. The trial design has two primary objectives: (1) to evaluate the safety and tolerability of THIO administered as an anticancer compound and a priming immune activator (2) to assess the clinical efficacy of THIO using Overall Response Rate (ORR) as the primary clinical endpoint. Treatment with THIO followed by cemiplimab (Libtayo) has been generally well-tolerated to date in a heavily pre-treated population. For more information on this Phase II trial, please visit ClinicalTrials.gov using the identifier NCT05208944.

About MAIA Biotechnology, Inc.
MAIA is a targeted therapy, immuno-oncology company focused on the development and commercialization of potential first-in-class drugs with novel mechanisms of action that are intended to meaningfully improve and extend the lives of people with cancer. Our lead program is THIO, a potential first-in-class cancer telomere targeting agent in clinical development for the treatment of NSCLC patients with telomerase-positive cancer cells. For more information, please visit www.maiabiotech.com.

Forward Looking Statements
MAIA cautions that all statements, other than statements of historical facts contained in this press release, are forward-looking statements. Forward-looking statements are subject to known and unknown risks, uncertainties, and other factors that may cause our or our industry’s actual results, levels or activity, performance or achievements to be materially different from those anticipated by such statements. The use of words such as “may,” “might,” “will,” “should,” “could,” “expect,” “plan,” “anticipate,” “believe,” “estimate,” “project,” “intend,” “future,” “potential,” or “continue,” and other similar expressions are intended to identify forward looking statements. However, the absence of these words does not mean that statements are not forward-looking. For example, all statements we make regarding (i) the initiation, timing, cost, progress and results of our preclinical and clinical studies and our research and development programs, (ii) our ability to advance product candidates into, and successfully complete, clinical studies, (iii) the timing or likelihood of regulatory filings and approvals, (iv) our ability to develop, manufacture and commercialize our product candidates and to improve the manufacturing process, (v) the rate and degree of market acceptance of our product candidates, (vi) the size and growth potential of the markets for our product candidates and our ability to serve those markets, and (vii) our expectations regarding our ability to obtain and maintain intellectual property protection for our product candidates, are forward looking. All forward-looking statements are based on current estimates, assumptions and expectations by our management that, although we believe to be reasonable, are inherently uncertain. Any forward-looking statement expressing an expectation or belief as to future events is expressed in good faith and believed to be reasonable at the time such forward-looking statement is made. However, these statements are not guarantees of future events and are subject to risks and uncertainties and other factors beyond our control that may cause actual results to differ materially from those expressed in any forward-looking statement. Any forward-looking statement speaks only as of the date on which it was made. We undertake no obligation to publicly update or revise any forward-looking statement, whether as a result of new information, future events or otherwise, except as required by law. In this release, unless the context requires otherwise, “MAIA,” “Company,” “we,” “our,” and “us” refers to MAIA Biotechnology, Inc. and its subsidiaries.

Investor Relations Contact
+1 (872) 270-3518
ir@maiabiotech.com

Source: MAIA Biotechnology, Inc.

Released February 26, 2025

Release – V2X to Provide Mission-Critical Aviation Support to the FBI under $100 Million Contract

V2X (PRNewsfoto/V2X, Inc.)

Research News and Market Data on VVX

February 26, 2025

Download(opens in new window)

RESTON, Va., Feb. 26, 2025 /PRNewswire/ — V2X (NYSE: VVX) Inc., announces its award of a $100 million contract to provide aviation maintenance and support services for the Federal Bureau of Investigation’s (FBI) Critical Incident Response Group. Under this contract, V2X will deliver mission-critical aviation resources that enable the FBI to conduct intelligence gathering, investigate operations, and law-enforcement activities.

V2X will support the FBI’s specialized aviation fleet by providing field-level maintenance, special mission equipment sustainment, training, and administrative services. These capabilities ensure that FBI aircraft remain fully mission-ready to meet evolving operational demands.

“This contract underscores V2X’s expertise in delivering agile aviation solutions in support of national security,” said Vinny Caputo, Senior Vice President of Aerospace Systems at V2X. “We are proud to provide the FBI with the aviation resources needed to execute their mission anytime, anywhere—ensuring operational readiness when it matters most.”

The indefinite-delivery, indefinite-quantity contract includes a five-year ordering period, with four 12-month options. V2X will operate at multiple locations across the United States, reinforcing the company’s commitment to delivering agile, global aviation support in service of national security.

About V2X
V2X builds innovative solutions that integrate physical and digital environments by aligning people, actions, and technology. V2X is embedded in all elements of a critical mission’s lifecycle to enhance readiness, optimize resource management, and boost security. The company provides innovation spanning national security, defense, civilian, and international markets. With a global team of approximately 16,000 professionals, V2X enables mission success by injecting AI and machine learning capabilities to meet today’s toughest challenges across all operational domains.

Investor Contact 
Mike Smith, CFA
Vice President, Treasury, Corporate Development and Investor Relations
IR@goV2X.com
719-637-5773

Media Contact
Angelica Spanos Deoudes
Senior Director, Marketing and Communications  
Angelica.Deoudes@goV2X.com
571-338-5195

Cision View original content to download multimedia:https://www.prnewswire.com/news-releases/v2x-to-provide-mission-critical-aviation-support-to-the-fbi-under-100-million-contract-302385744.html

SOURCE V2X, Inc.

Release – The ODP Corporation Announces Fourth Quarter and Full Year 2024 Results

Research News and Market Data on ODP

PDF Version

Fourth Quarter Revenue of $1.6 Billion with GAAP EPS of $0.36; Adjusted EPS of $0.66

Announced Milestone Agreement with Leading Hospitality Management Company Becoming Key Supplier and Distribution Partner — A Key Step in Expanding Beyond Office Supplies

Launches “Optimize for Growth” Plan to Accelerate Revenue Growth in B2B Industry Segments

BOCA RATON, Fla.–(BUSINESS WIRE)–Feb. 26, 2025– The ODP Corporation (“ODP,” or the “Company”) (NASDAQ:ODP), a leading provider of products, services, and technology solutions to businesses and consumers, today announced results for the fourth quarter and full year ended December 28, 2024.

Fourth Quarter 2024 Summary(1)(3)

  • Total reported sales of $1.6 billion, down 10% versus the prior year period on a reported basis. The decrease in reported sales is largely related to lower sales in its Office Depot Division, primarily due to 47 fewer retail locations in service compared to the previous year and reduced retail and online consumer traffic, as well as lower sales in its ODP Business Solutions Division
  • GAAP operating income of $20 million and net income from continuing operations of $11 million, or $0.36 per diluted share, versus $52 million and $39 million, respectively, or $1.02 per diluted share, in the prior year period
  • Adjusted operating income of $32 million, compared to $57 million in the fourth quarter of 2023; adjusted EBITDA of $58 million, compared to $83 million in the fourth quarter of 2023
  • Adjusted net income from continuing operations of $20 million, or adjusted diluted earnings per share from continuing operations of $0.66, versus $43 million or $1.13, respectively, in the prior year period
  • Operating cash flow from continuing operations of $34 million and adjusted free cash flow of $(57) million, versus $71 million and $48 million, respectively, in the prior year period
  • Repurchased 1.4 million shares at a cost of $43 million in the fourth quarter of 2024
  • $644 million of total available liquidity including $166 million in cash and cash equivalents at quarter end

Full Year 2024 Summary

  • Total reported sales of $7.0 billion, versus $7.8 billion in the prior year
  • GAAP operating income of $163 million and net income from continuing operations of $106 million, or $3.08 per diluted share, versus $330 million and net income from continuing operations of $247 million, or $6.22 per diluted share, respectively, in the prior year
  • Adjusted operating income of $173 million, compared to $351 million in 2023; adjusted EBITDA of $268 million, compared to $459 million in 2023. Adjusted operating income in 2024 excludes $70 million of income related to legal matter monetization where the Company is engaged in legal proceedings as a plaintiff
  • Adjusted net income from continuing operations of $114 million, or adjusted diluted earnings per share from continuing operations of $3.30, versus $263 million or $6.61, respectively, in the prior year. Adjusted net income from continuing operations in 2024 excludes $70 million of income or $51 million of income, net of tax related to legal matter monetization where the Company is engaged in legal proceedings as a plaintiff
  • Operating cash flow from continuing operations of $159 million and adjusted free cash flow of $33 million, versus $360 million and $288 million, respectively in the prior year
  • Repurchased 8 million shares for $300 million in 2024

“We made significant progress in our B2B pivot during the year, strengthening ODP’s position to drive sustainable profitable growth in the future,” said Gerry Smith, chief executive officer of The ODP Corporation. “Our core strengths in supply chain, procurement, and distribution have continued to provide a meaningful competitive advantage, resulting in recent major new business wins across both our traditional market segments and in new higher-growth industry sectors. Building on our recent success and our core competencies, we are intensifying our focus on the growing potential within the B2B marketplace.”

“We’re now positioned to pursue growth in a new industry segment, recently signing a transformative contract with a major hotel management company that establishes ODP as a preferred supplier in the expanding $16 billion hospitality industry. This landmark agreement is a key step in expanding beyond office supplies and represents a true inflection point in our business, enabling us to strategically expand into growing industry segments where our core competencies resonate. When combined with adjacent industry segments, this represents a compelling $60 billion market opportunity for ODP to showcase its next-day delivery capabilities, exceptional customer service, and extensive national supply chain network to a growing customer base,” Smith continued.

“Our recent progress has the potential to reshape our business trajectory in the future after what has been a challenging period for our industry,” said Smith. “While we achieved our revised guidance for the year, our performance in 2024 was impacted by weak macroeconomic trends, subdued business and consumer activity, and effects from severe weather in the second half of the year. However, we remain competitively strong and, in addition to the landmark hospitality agreement, we continue to secure major new business wins, including signing one of the largest multi-year B2B contracts in our history and successfully launching strategic warehousing and fulfillment services to support one of the world’s leading social media-driven e-commerce platforms.”

“Building on these accomplishments, we are announcing our ‘Optimize for Growth’ plan,” Smith continued. “This plan capitalizes on our core strengths—including a robust B2B infrastructure, supply chain assets, strong distribution network, and loyal customer base—to expand and accelerate growth in the B2B distribution and 3PL market segments while reducing our retail exposure and associated obligations. Supporting our strategy, we are realigning our organization, refining product assortments, and reallocating capital to prioritize growth in the B2B marketplace. At the same time, we will suspend growth investments in our retail segment and continue to optimize our store footprint to better align with our long-term strategy. That said, we remain committed to supporting and providing an exceptional service experience at our active retail locations.”

“As we look ahead to 2025, our strategic priority remains centered on capturing the numerous opportunities in the B2B marketplace and pursuing growth in new industry segments. Although transformational progress takes time to fully materialize and macroeconomic conditions continue to present near-term challenges, we are confident in the strength of our strategy and steadfast in our commitment to delivering sustained, long-term value for our shareholders. We look forward to providing updates on our progress and offering deeper insights into our long-term growth plans in the quarters ahead,” Smith concluded.

Consolidated Results

Reported (GAAP) Results

Total reported sales for the fourth quarter of 2024 were $1.6 billion, a decrease of 10% compared with the same period last year, driven primarily by lower sales in both its consumer and business-to-business (B2B) divisions. Lower sales in its consumer division, Office Depot, was primarily due to lower retail and online consumer traffic and lower average order volumes, as well as 47 fewer stores in service compared to last year related to planned store closures. Sales at ODP Business Solutions Division were lower compared to last year, largely driven by macroeconomic factors causing reduced spending among business customers and fewer transactions. Meanwhile, Veyer continued to provide strong logistics support for the ODP Business Solutions and Office Depot Divisions on lower internal sales volume, and continued to execute across its growth strategy, delivering supply chain and procurement solutions to third-party customers and driving increases in external revenue.

The Company reported GAAP operating income of $20 million in the fourth quarter of 2024, down compared to GAAP operating income of $52 million in the prior year period. Operating results in the fourth quarter of 2024 included $12 million of charges primarily related to non-cash asset impairments of operating lease right-of-use (ROU) assets associated with the Company’s retail store locations. Net income from continuing operations was $11 million, or $0.36 per diluted share in the fourth quarter of 2024, down compared to net income from continuing operations of $39 million, or $1.02 per diluted share in the fourth quarter of 2023.

Adjusted (non-GAAP) Results(1)

Adjusted results for the fourth quarter of 2024 exclude charges and credits totaling $12 million as described above and the associated tax impacts.

  • Fourth quarter 2024 adjusted EBITDA was $58 million compared to $83 million in the prior year period. This included depreciation and amortization of $24 million in both the fourth quarter of 2024 and 2023
  • Fourth quarter 2024 adjusted operating income was $32 million, down compared to $57 million in the fourth quarter of 2023
  • Fourth quarter 2024 adjusted net income from continuing operations was $20 million, or $0.66 per diluted share, compared to $43 million, or $1.13 per diluted share, in the fourth quarter of 2023, a decrease of 42% on a per share basis

Division Results

ODP Business Solutions Division

Leading B2B distribution solutions provider serving small, medium and enterprise level companies with an annual trailing-twelve-month revenue of $3.6 billion.

  • Reported sales were $827 million in the fourth quarter of 2024, down 9% compared to the same period last year. The decrease in sales was related primarily to weaker macroeconomic conditions, a more cautious business spending environment, lower sales conversion, fewer customers, and the foreign exchange impact from a weaker Canadian dollar
  • Total adjacency category sales, including cleaning and breakroom, furniture, technology, and copy and print, were 44% of total ODP Business Solutions’ sales, flat with the prior year
  • Executed initiatives to convert strong pipeline of potential new business and implemented several initiatives to regain top-line traction, including progress on initiating service for one of the largest contracts in Company history, potentially generating up to $1.5 billion in revenue over a 10-year period
  • Remained competitively strong and made significant progress on establishing presence in new industry segments. Signed milestone agreement with leading hospitality management company becoming a key supplier and distribution partner, positioning ODP to expand in the growing $16 billion hospitality marketplace
  • Expected revenue generation from recent new business wins expected to ramp up in future quarters
  • Operating income was $25 million in the fourth quarter of 2024, down compared to $34 million in the same period last year on a reported basis. As a percentage of sales, operating income margin was 3%, down 70 basis points compared to the same period last year

Office Depot Division

Leading provider of retail consumer and small business products and services distributed via Office Depot and OfficeMax retail locations and eCommerce presence.

  • Reported sales were $784 million in the fourth quarter of 2024, down 13% compared to the prior year. Lower sales were partially driven by 47 fewer retail locations in service associated with planned store closures, as well as lower demand relative to last year in major product categories, lower average order volume, and lower online sales. The Company closed 16 retail stores in the quarter and had 869 stores at quarter end. Sales were down 8% on a comparable store basis
  • Store and online traffic were lower year over year due to macroeconomic factors causing weak consumer activity as well as the lingering effect of severe weather in major markets where we operate
  • Operating income was $30 million in the fourth quarter of 2024, compared to operating income of $43 million during the same period last year on a reported basis, driven primarily by the flow through impact from lower sales. As a percentage of sales, operating income was 4%, down 100 basis points compared to the same period last year

Veyer Division

Nationwide supply chain, distribution, procurement and global sourcing operation supporting Office Depot and ODP Business Solutions, as well as third-party customers. Veyer’s assets and capabilities include 8 million square feet of infrastructure through a network of distribution centers, cross-docks, and other facilities throughout the United States; a global sourcing presence in Asia; a large private fleet of vehicles; and business next-day delivery capabilities to 98.5% of US population.

  • In the fourth quarter of 2024, Veyer provided support for its internal customers, ODP Business Solutions and Office Depot, as well as its third-party customers, generating reported sales of $1.1 billion
  • Reported operating loss was $2 million in the fourth quarter of 2024, compared to operating income of $3 million in the prior year period driven by the flow through impact of lower sales to internal customers partially offset by services to third-party customers
  • Launched supply chain services for one of the world’s largest social media-focused e-commerce companies to deliver warehousing and fulfillment services for their online sales
  • In the fourth quarter of 2024, sales generated from third-party customers increased by 150% compared to the same period last year, resulting in sales of $20 million. EBITDA generated from third-party customers was $1 million in the quarter, lower compared to EBITDA of $3 million in the prior year period, driven largely by Veyer’s investment in resources to support the launch of services for new customer additions

Share Repurchases in 2024

During fiscal year 2024, the Company continued to execute under its previously announced $1 billion share repurchase authorization valid through March 31, 2027. During the fourth quarter of 2024, the Company repurchased approximately 1.4 million shares at a cost of $43 million.

“Throughout the year, we invested in our business while returning $300 million to shareholders through share repurchases in 2024,” said Adam Haggard, senior vice president and co-chief financial officer of The ODP Corporation. “Looking ahead to 2025, we plan to prioritize capital allocation toward our core business over share repurchases, focusing on high-return B2B growth opportunities that we believe will drive sustainable, long-term value for our shareholders.”

The number of shares to be repurchased under the authorization in the future and the timing of such transactions will depend on a variety of factors, including market conditions, regulatory requirements, and other corporate considerations. The share repurchase authorization could be suspended or discontinued at any time as determined by the Board of Directors.

Balance Sheet and Cash Flow

As of December 28, 2024, ODP had total available liquidity of approximately $644 million, consisting of $166 million in cash and cash equivalents and $478 million of available credit under the Fourth Amended Credit Agreement. Total debt was $279 million.

For the fourth quarter of 2024, cash provided by operating activities of continuing operations was $34 million, which included $70 million related to legal matter monetization where the Company is engaged in legal proceedings as a plaintiff, partially offset by $4 million in restructuring spend. This compared to cash provided by operating activities of continuing operations of $71 million in the fourth quarter of the prior year, which included $2 million in restructuring spend. The year-over-year change in operating cash flow is primarily related to lower sales and the timing of investments in working capital related to new business wins.

Capital expenditures were $25 million in both the fourth quarter of 2024 and 2023, reflecting continued growth investments in the Company’s digital transformation, distribution network, and eCommerce capabilities. Adjusted Free Cash Flow(3) was $(57) million in the fourth quarter of 2024, compared to $48 million in the prior year period.

Milestone Agreement with Premier Hospitality Company

Subsequent to the quarter end, the Company announced a major milestone agreement in its B2B evolution as its subsidiary, ODP Business Solutions, entered into a key new partnership with one of the world’s largest hotel management organizations becoming a preferred provider for Operating Supplies & Equipment (“OS&E”). Through this agreement, ODP Business Solutions will become a distribution partner to reliably support the recurring in-room hotel supply needs necessary to run operations, reset rooms between guests, and exceed their customers’ expectations. This product expansion and strategic partnership reflects ODP Business Solutions’ continued evolution beyond office supplies and highlights the Company’s ability to leverage its capabilities and offerings to elevate the experience to businesses in the hospitality, healthcare and adjacent sectors.

“Optimize for Growth” B2B Revenue Acceleration Plan

After a comprehensive review of its business units and in light of recent new business successes, including its recent entry into the hospitality industry, the Company announced its “Optimize for Growth” restructuring plan. This initiative focuses on capitalizing on ODP’s core strengths — including its supply chain and procurement expertise, robust distribution network, and strong B2B customer base — to accelerate growth in the B2B distribution and third-party logistics (3PL) market segments, while reducing retail exposure and associated liabilities. The plan strategically realigns the Company’s organizational structure, product offerings, and go-to-market strategies to target high-growth opportunities in the B2B marketplace, while also expanding into new enterprise segments, including hospitality, healthcare, and adjacent sectors.

As part of the plan, ODP will prioritize investments in resources and infrastructure critical to its growth in the B2B sector, while reducing fixed costs associated with retail operations, including store and distribution center leases. Concurrently, the Company will suspend growth investments in its consumer and retail business as it continues to optimize its retail store footprint. Despite reduced retail growth investments, ODP remains firmly committed to supporting and providing an exceptional service experience at its active retail locations, ensuring that customers continue to receive the top-tier care they expect.

In connection with this plan, the Company expects to incur costs in the range of $185 million to $230 million, which we anticipate will generate approximately $380 million in EBITDA improvement and generate over $1.3 billion in total value over the multi-year life of the plan.

The ODP Corporation will webcast a call with financial analysts and investors on February 26, 2025, at 9:00 am Eastern Time, which will be accessible to the media and the general public. To listen to the conference call via webcast, please visit The ODP Corporation’s Investor Relations website at investor.theodpcorp.com. A replay of the webcast will be available approximately two hours following the event.

About The ODP Corporation

The ODP Corporation (NASDAQ:ODP) is a leading provider of products, services, and technology solutions through an integrated business-to-business (B2B) distribution platform and omni-channel presence, which includes supply chain and distribution operations, dedicated sales professionals, online presence, and a network of Office Depot and OfficeMax retail stores. Through its operating companies ODP Business Solutions, LLC; Office Depot, LLC; and Veyer, LLC, The ODP Corporation empowers every business, professional, and consumer to achieve more every day. For more information, visit theodpcorp.com.

ODP and ODP Business Solutions are trademarks of ODP Business Solutions, LLC. Office Depot is a trademark of The Office Club, LLC. OfficeMax is a trademark of OMX, Inc. Veyer is a trademark of Veyer, LLC. Grand&Toy is a trademark of Grand & Toy, LLC in Canada. ©2025 Office Depot, LLC. All rights reserved. Any other product or company names mentioned herein are the trademarks of their respective owners.

FORWARD LOOKING STATEMENTS

This communication may contain forward-looking statements within the meaning of the Private Securities Litigation Reform Act of 1995. These statements or disclosures may discuss goals, intentions and expectations as to future trends, plans, events, results of operations, cash flow or financial condition, or state other information relating to, among other things, the Company, based on current beliefs and assumptions made by, and information currently available to, management. Forward-looking statements generally will be accompanied by words such as “anticipate,” “believe,” “plan,” “could,” “estimate,” “expect,” “forecast,” “guidance,” “expectations”, “outlook,” “intend,” “may,” “possible,” “potential,” “predict,” “project,” “propose” or other similar words, phrases or expressions, or other variations of such words. These forward-looking statements are subject to various risks and uncertainties, many of which are outside of the Company’s control. There can be no assurances that the Company will realize these expectations or that these beliefs will prove correct, and therefore investors and stakeholders should not place undue reliance on such statements. Factors that could cause actual results to differ materially from those in the forward-looking statements include, among other things, highly competitive office products market and failure to differentiate the Company from other office supply resellers or respond to decline in general office supplies sales or to shifting consumer demands; competitive pressures on the Company’s sales and pricing; the risk that the Company is unable to transform the business into a service-driven, B2B platform or that such a strategy will not result in the benefits anticipated; the risk that the Company will not be able to achieve the expected benefits of its strategic plans, including charges and benefits related to Project Core and the Optimize for Growth Restructuring Plan; the risk that the Company may not be able to realize the anticipated benefits of acquisitions due to unforeseen liabilities, future capital expenditures, expenses, indebtedness and the unanticipated loss of key customers or the inability to achieve expected revenues, synergies, cost savings or financial performance; the risk that the Company is unable to successfully maintain a relevant omni-channel experience for its customers; the risk that the Company is unable to execute the Maximize B2B Restructuring Plan successfully or that such plan will not result in the benefits anticipated; failure to effectively manage the Company’s real estate portfolio; loss of business with government entities, purchasing consortiums, and sole- or limited- source distribution arrangements; failure to attract and retain qualified personnel, including employees in stores, service centers, distribution centers, field and corporate offices and executive management, and the inability to keep supply of skills and resources in balance with customer demand; failure to execute effective advertising efforts and maintain the Company’s reputation and brand at a high level; disruptions in computer systems, including delivery of technology services; breach of information technology systems affecting reputation, business partner and customer relationships and operations and resulting in high costs and lost revenue; unanticipated downturns in business relationships with customers or terms with the suppliers, third-party vendors and business partners; disruption of global sourcing activities, evolving foreign trade policy (including tariffs imposed on certain foreign made goods); exclusive Office Depot branded products are subject to additional product, supply chain and legal risks; product safety and quality concerns of manufacturers’ branded products and services and Office Depot private branded products; covenants in the credit facility; general disruption in the credit markets; incurrence of significant impairment charges; retained responsibility for liabilities of acquired companies; fluctuation in quarterly operating results due to seasonality of the Company’s business; changes in tax laws in jurisdictions where the Company operates; increases in wage and benefit costs and changes in labor regulations; changes in the regulatory environment, legal compliance risks and violations of the U.S. Foreign Corrupt Practices Act and other worldwide anti-bribery laws; volatility in the Company’s common stock price; changes in or the elimination of the payment of cash dividends on Company common stock; macroeconomic conditions such as higher interest rates and future declines in business or consumer spending; increases in fuel and other commodity prices and the cost of material, energy and other production costs, or unexpected costs that cannot be recouped in product pricing; unexpected claims, charges, litigation, dispute resolutions or settlement expenses; catastrophic events, including the impact of weather events on the Company’s business; the discouragement of lawsuits by shareholders against the Company and its directors and officers as a result of the exclusive forum selection of the Court of Chancery, the federal district court for the District of Delaware or other Delaware state courts by the Company as the sole and exclusive forum for such lawsuits; and the impact of the COVID-19 pandemic on the Company’s business. The foregoing list of factors is not exhaustive. Investors and shareholders should carefully consider the foregoing factors and the other risks and uncertainties described in the Company’s Annual Reports on Form 10-K, Quarterly Reports on Form 10-Q, and Current Reports on Form 8-K filed with the U.S. Securities and Exchange Commission. The Company does not assume any obligation to update or revise any forward-looking statements.

View Full Release Here.

Tim Perrott
Investor Relations
561-438-4629
Tim.Perrott@theodpcorp.com

Source: The ODP Corporation

Release – Perfect Corp. Reports Unaudited Financial Results for the Three Months and Full Year Ended December 31, 2024

Research News and Market Data on PERF

February 26, 2025

NEW YORK–(BUSINESS WIRE)– Perfect Corp. (NYSE: PERF) (“Perfect” or the “Company”), a global leader in providing artificial intelligence (“AI”) and augmented reality (“AR”) Software-as-a-Service (“SaaS”) solutions to beauty and fashion industries, today announced its unaudited financial results for the three months and the full year ended December 31, 2024.

Highlights for the Three Months Ended December 31, 2024

  • Total revenuewas $15.9 million for the three months ended December 31, 2024, compared to $14.1 million in the same period of 2023, an increase of 12.4%. The increase was primarily due to growth momentum in the revenue of AI- and AR- cloud solutions and mobile app subscriptions.
  • Gross profitwas $11.8 million for the three months ended December 31, 2024, compared with $11.5 million in the same period of 2023, an increase of 2.5%.
  • Net income was $1.1 million for the three months ended December 31, 2024, compared to a net income of $1.4 million during the same period of 2023, a decrease of 21.8%.
  • Adjusted net income (non-IFRS)1was $2.3 million for the three months ended December 31, 2024, compared to adjusted net income (non-IFRS) of $2.1 million in the same period of 2023, an increase of 8.2%.
  • Operating cash flowwas $3.3 million in the fourth quarter of 2024, compared to $3.1 million in the same period of 2023, an increase of 3.4%.
  • The Company’s YouCam mobile beauty app and web active subscribers grew by 14.3% year-over-year, reaching a record high of over 1 million active subscribers as of end of 2024.
  • As of December 31, 2024, the Company’s cumulative customer base included 732 brand clients, with over 822,000 digital stock keeping units (“SKUs”) for makeup, haircare, skincare, eyewear, watches and jewelry products, compared to 708 brand clients and over 806,000 digital SKUs as of September 30, 2024. The number of Key Customers2of the Company remained stable at 151, as of both December 31, 2024, compared and September 30, 2024 due to the stability of our enterprise business.

Highlights for the Year Ended December 31, 2024

  • Total revenuewas $60.2 million for the year ended December 31, 2024, compared to $53.5 million in the same period of 2023, an increase of 12.5%.
  • Gross profitwas $46.9 million for the year ended December 31, 2024, compared with $43.1 million in the same period of 2023, an increase of 8.9%.
  • Net incomewas $5.0 million for the year ended December 31, 2024, compared to a net income of $5.4 million during the same period of 2023, a decrease of 7.3%.
  • Adjusted net income (non-IFRS)was $8.3 million for the year ended December 31, 2024, compared to adjusted net income (non-IFRS) of $7.0 million in the same period of 2023, an increase of 18.6%.
  • Operating cash flowwas $13.0 million for the year ended December 31, 2024, compared to $13.6 million in the same period of 2023, a decrease of 4.2%.

Ms. Alice H. Chang, the Founder, Chairwoman, and Chief Executive Officer of Perfect commented, “We are pleased to report solid double-digit growth, positive net income, healthy cash flow, and a strong balance sheet for 2024, fully meeting our previous guidance. This remarkable performance is a testament to our team’s resilience and the visionary leadership of our management. By capitalizing on market opportunities and expanding our total addressable market, we are not only attracting new clients but also laying the foundation for sustained long-term growth. Our commitment to innovation ensures that we will continue to deliver cutting-edge solutions that meet evolving market demands. With a comprehensive strategy in place, we are excited about the future and confident in our ability to create ongoing value for all our stakeholders.”

Financial Results for the Three Months Ended December 31, 2024 and for the Full Year 2024

Revenue

Total revenue was $15.9 million for the three months ended December 31, 2024, compared to $14.1 million in the same period of 2023, an increase of 12.4%. Full-year revenue was $60.2 million in 2024, compared to $53.5 million in 2023, an increase of 12.5%.

  • AI- and AR- cloud solutions and subscription revenue was $15.1 million for the three months ended December 31, 2024, compared to $12.0 million in the same period of 2023, an increase of 25.4%. Full-year AI- and AR- cloud solutions and subscription revenue was $53.8 million in 2024, compared with $44.8 million in 2023, an increase of 20.2%. The double digit growth was driven by the robust momentum in the growth of YouCam mobile beauty app subscription, stable demand for the Company’s online virtual product try-on solutions from brand customers, and the growing popularity among consumers of Generative AI technologies and AI editing features for photos and videos. The Company’s YouCam mobile beauty app and web active subscribers grew by 14.3% year-over-year, once again reaching a record high of over 1 million active subscribers as of the end of the fourth quarter of 2024. This increase reflected the sustained demand in the Company’s YouCam mobile beauty app services from subscribers and users.
  • Licensing revenue was $0.5 million for the three months ended December 31, 2024, compared to $1.8 million in the same period of 2023, a decrease of 72.2%. Full year licensing revenue was $5.2 million for 2024, compared with $7.5 million for 2023, a decrease of 30.8%. The Company anticipates that this legacy non-recurring revenue will become increasingly immaterial as it continues to prioritize enhancing its market leadership in offering AI- and AR-based SaaS subscription solutions for brands and customers.

Gross Profit

Gross profit was $11.8 million for the three months ended December 31, 2024, compared with $11.5 million in the same period of 2023, an increase of 2.5%. Despite the increase in gross profit, our gross margin decreased to 74.1% for the three months ended December 31, 2024, from 81.3% in the same period of 2023. Full-year gross profit was $46.9 million in 2024, compared with $43.1 million in 2023, an increase of 8.9%. Full-year 2024 gross margin slightly decreased to 78.0% in 2024 from 80.6% in 2023. The decrease in gross margin was primarily due to the increase in third-party payment processing fees paid to digital distribution partners, such as Google and Apple, due to the steady growth in our YouCam mobile app subscription revenue.

Total Operating Expenses

Total operating expenses were $12.2 million for the three months ended December 31, 2024, compared with $12.7 million in the same period of 2023, a decrease of 3.6%. The decrease was primarily due to declines in research and development (“R&D”) expenses and general and administrative (“G&A”) expenses in the fourth quarter of 2024. Full-year total operating expenses were $50.1 million in 2024, compared with $48.8 million in 2023, an increase of 2.7%. The increase was primarily due to increases in sales and marketing expenses and R&D expenses, which were mostly offset by a decrease in general and administrative expenses.

  • Sales and marketing expenseswere $6.9 million for the three months ended December 31, 2024, compared to $6.7 million during the same period of 2023, an increase of 3.6%. Full-year sales and marketing expenses were $28.2 million for 2024, compared to $25.7 million in 2023, an increase of 9.7%. This increase was primarily due to an increase in marketing events and advertising expenses related to our mobile apps and cloud computing
  • Research and development expenseswere $2.8 million for the three months ended December 31, 2024, compared to $3.0 million during the same period of 2023, a decrease of 8.3%. The decrease primarily resulted from streamlining of certain R&D processes and optimizing expenses. Full-year R&D expenses were $12.0 million for 2024, compared to $11.5 million in 2023, an increase of 4.7%. The increases resulted from increases in R&D headcount and related personnel costs.
  • General and administrative expenseswere $1.8 million for the three months ended December 31, 2024, compared to $3.0 million during the same period of 2023, a significant decrease of 41.0%. Full-year G&A expenses were $8.5 million for 2024, compared to $11.6 million in 2023, a decrease of 26.6%. The significant decrease was primarily due to reduced corporate insurance premium and external professional service fees.

Net Income

Net income was $1.1 million for the three months ended December 31, 2024, compared to a $1.4 million during the same period of 2023. Full-year net income was $5.0 million for 2024, compared to $5.4 million for 2023. The positive net income was supported by our steady revenue growth and effective cost control.

Adjusted Net Income (Non-IFRS)

Adjusted net income was $2.3 million for the three months ended December 31, 2024, compared to $2.1 million in the same period of 2023, an increase of 8.2%. Full-year adjusted net income was $8.3 million for 2024, compared to $7.0 million for 2023.

Liquidity and Capital Resource

As of December 31, 2024, the Company’s cash and cash equivalents remained stable at $127.1 million (or $165.9 million when including money market funds of $2.7 million and 6-month time deposits of $36.0 million, which are classified as current financial assets at fair value through profit or loss and current financial assets at amortized cost under IFRS), compared to $127.2 million as of September 30, 2024 (or $163.2 million when including time deposits).

The Company had a positive operating cash flow of $3.3 million in the fourth quarter of 2024, compared to $3.1 million in the same period of 2023. The Company had a positive operating cash flow of $13.0 million in the full year of 2024, compared to $13.6 million in 2023. The Company continues to invest in growth while maintaining a healthy cash reserve to support business operations underscoring the Company’s operational health and sustainability.

Recent Developments

As previously announced by the Company, on December 23, 2024, Perfect entered into an agreement with Farfetch, a leading global marketplace for the luxury fashion industry, pursuant to which Perfect agreed to acquire 100% of the equity interests in Wannaby Inc. (“Wannaby”), which is a pioneer in augmented reality and computer vision technologies, specializing in virtual try-on solutions for the fashion industry.

On January 8, 2025, Perfect completed the acquisition Wannaby. Wannaby is now a wholly-owned subsidiary of Perfect.

Business Outlook for 2025

Based on the growth momentum in both YouCam mobile apps and web subscriptions and enterprise SaaS solution demands, the Company anticipates a year-over-year total revenue growth rate of 13% to 14.5% for 2025, compared to 2024.

Note that this forecast is based on the Company’s current assessment of the market and operational conditions, and that these factors are subject to change.

Conference Call Information

The Company’s management will hold an earnings conference call at 7:30 p.m. Eastern Time on February 26, 2025 (7:30 a.m. Taipei Time on February 27, 2025) to discuss the financial results. For participants who wish to join the call, please complete online registration using the link provided below in advance of the conference call. Upon registering, each participant will receive a participant dial-in number and a unique access PIN, which can be used to join the conference call.

Registration Link: https://registrations.events/direct/Q4I516303

A live and archived webcast of the conference call will also be available at the Company’s investor relations website at https://ir.perfectcorp.com.

About Perfect Corp.

Founded in 2015, Perfect Corp. is a beautiful AI Company and global leader in enterprise SaaS solutions. As an innovative powerhouse in using artificial intelligence (AI) to transform the beauty and fashion industries, Perfect empowers major beauty, skincare, fashion, jewelry, and watch brands and by providing consumers with omnichannel shopping experiences through augmented reality (AR) product try-ons and AI-powered skin diagnostics. With cutting-edge technologies such as Generative AI, real-time facial and hand 3D AR rendering and cloud solutions, Perfect enables personalized, enjoyable, and engaging shopping journey. In addition, Perfect also operates a family of YouCam consumer apps for photo, video and camera users, centered on unleashing creativity with AI-driven features for creation, beautification and enhancement. With the help of technologies, Perfect helps brands elevate customer engagement, increase conversion rates, and propel sales growth. Throughout this journey, Perfect maintains its unwavering commitment to environmental sustainability and fulfilling social responsibilities. For more information, visit https://ir.perfectcorp.com/.

Forward-Looking Statements

This communication contains forward-looking statements within the meaning of Section 27A of the U.S. Securities Act of 1933, as amended, or the Securities Act, and Section 21E of the U.S. Securities Exchange Act of 1934, as amended, or the Exchange Act, that are based on beliefs and assumptions and on information currently available to Perfect. In some cases, you can identify forward-looking statements by the following words: “may,” “will,” “could,” “would,” “should,” “expect,” “intend,” “plan,” “anticipate,” “believe,” “estimate,” “predict,” “project,” “potential,” “continue,” “ongoing,” “target,” “seek” or the negative or plural of these words, or other similar expressions that are predictions or indicate future events or prospects, although not all forward-looking statements contain these words. Any statements that refer to expectations, projections or other characterizations of future events or circumstances, including strategies or plans, are also forward-looking statements. These statements involve risks, uncertainties and other factors that may cause actual results, levels of activity, performance or achievements to be materially different from those expressed or implied by these forward-looking statements. These statements are based on Perfect’s reasonable expectations and beliefs concerning future events and involve risks and uncertainties that may cause actual results to differ materially from current expectations. These factors are difficult to predict accurately and may be beyond Perfect’s control. Forward-looking statements in this communication or elsewhere speak only as of the date made. New uncertainties and risks arise from time to time, and it is impossible for Perfect to predict these events or how they may affect Perfect. In addition, risks and uncertainties are described in Perfect’s filings with the Securities and Exchange Commission. These filings may identify and address other important risks and uncertainties that could cause actual events and results to differ materially from those contained in the forward-looking statements. Perfect cannot assure you that the forward-looking statements in this communication will prove to be accurate. There may be additional risks that Perfect presently does not know or that Perfect currently does not believe are immaterial that could also cause actual results to differ from those contained in the forward-looking statements. In light of the significant uncertainties in these forward-looking statements, you should not regard these statements as a representation or warranty by Perfect, its directors, officers or employees or any other person that Perfect will achieve its objectives and plans in any specified time frame, or at all. Except as required by applicable law, Perfect does not have any duty to, and does not intend to, update or revise the forward-looking statements in this communication or elsewhere after the date of this communication. You should, therefore, not rely on these forward-looking statements as representing the views of Perfect as of any date subsequent to the date of this communication.

Use of Non-IFRS Financial Measures

This press release and accompanying tables contain certain non-IFRS financial measures, including adjusted net income, as supplemental metrics in reviewing and assessing Perfect’s operating performance and formulating its business plan. Perfect defined these non-IFRS financial measures as follows:

Adjusted net income (loss) is defined as net income (loss) excluding one-off transaction costs3 , non-cash equity-based compensation, and non-cash valuation (gain)/loss of financial liabilities. Starting from the first quarter of 2024, we no longer exclude foreign exchange gain (loss) from adjusted net income (loss). As we transitioned to using the U.S. dollar as the functional currency for certain subsidiaries in 2023, our foreign exchange gains (losses), which historically have predominantly been unrealized, have not been material since 2023. For a reconciliation of adjusted net income (loss) to net income (loss), see the reconciliation table included elsewhere in this press release.

Non-IFRS financial measures are not defined under IFRS and are not presented in accordance with IFRS. Non-IFRS financial measures have limitations as analytical tools, which possibly do not reflect all items of expense that affect our operations. Share-based compensation expenses have been and may continue to be incurred in our business and are not reflected in the presentation of the non-IFRS financial measures. In addition, the non-IFRS financial measures Perfect uses may differ from the non-IFRS measures used by other companies, including peer companies, and therefore their comparability may be limited. The presentation of these non-IFRS financial measures is not intended to be considered in isolation from or as a substitute for the financial information prepared and presented in accordance with IFRS. The items excluded from our adjusted net income are not driven by core results of operations and render comparison of IFRS financial measures with prior periods less meaningful. We believe adjusted net income provides useful information to investors and others in understanding and evaluating our results of operations, as well as providing a useful measure for period-to-period comparisons of our business performance. Moreover, such non-IFRS measures are used by our management internally to make operating decisions, including those related to operating expenses, evaluate performance, and perform strategic planning and annual budgeting.

View Full Release Here.

Category: Investor Relations

Investor Relations Contact
Investor Relations, Perfect Corp.
Email: Investor_Relations@PerfectCorp.com

Source: Perfect Corp.

Travelzoo (TZOO) – Revenue Growth Expected to Significantly Ramp


Wednesday, February 26, 2025

Travelzoo® provides its 30 million members with exclusive offers and one-of-a-kind experiences personally reviewed by our deal experts around the globe. We have our finger on the pulse of outstanding travel, entertainment, and lifestyle experiences. We work in partnership with more than 5,000 top travel suppliers—our long-standing relationships give Travelzoo members access to irresistible deals.

Michael Kupinski, Director of Research, Equity Research Analyst, Digital, Media & Technology , Noble Capital Markets, Inc.

Jacob Mutchler, Research Associate, Noble Capital Markets, Inc.

Refer to the full report for the price target, fundamental analysis, and rating.

In line quarter. The company reported Q4 revenue and adj. EBITDA of $20.7 million and $5.4 million, both of which are in line with our estimates of $21.5 million and $5.1 million, respectively. The recent results were adversely affected by weakness in Europe, primarily Germany, which we believe is temporary. In our view, investors should focus on the improving fundamental trends likely beginning in the first quarter of 2025.

Europe lags, but appears temporary. The company’s North American segment had a solid quarter, while revenue was relatively flat compared to the prior year period, operating margins improved from 29% to 33%. Additionally, Jack’s Flight Club grew revenue and posted a positive operating income. Europe experienced a tough quarter, largely attributed to political uncertainty and advertising issues in Germany, which are not expected to continue.


Get the Full Report

Equity Research is available at no cost to Registered users of Channelchek. Not a Member? Click ‘Join’ to join the Channelchek Community. There is no cost to register, and we never collect credit card information.

This Company Sponsored Research is provided by Noble Capital Markets, Inc., a FINRA and S.E.C. registered broker-dealer (B/D).

*Analyst certification and important disclosures included in the full report. NOTE: investment decisions should not be based upon the content of this research summary. Proper due diligence is required before making any investment decision. 

Comstock (LODE) – Updating Estimates to Reflect the Reverse Split


Wednesday, February 26, 2025

Comstock (NYSE: LODE) innovates technologies that contribute to global decarbonization and circularity by efficiently converting under-utilized natural resources into renewable fuels and electrification products that contribute to balancing global uses and emissions of carbon. The Company intends to achieve exponential growth and extraordinary financial, natural, and social gains by building, owning, and operating a fleet of advanced carbon neutral extraction and refining facilities, by selling an array of complimentary process solutions and related services, and by licensing selected technologies to qualified strategic partners. To learn more, please visit www.comstock.inc.

Mark Reichman, Managing Director, Equity Research Analyst, Natural Resources, Noble Capital Markets, Inc.

Refer to the full report for the price target, fundamental analysis, and rating.

Reverse Split. Effective February 24, Comstock Inc. implemented a reverse split of its common stock at a ratio of 1-for-10, resulting in ~23.8 million shares outstanding. Comstock’s authorized number of shares of common stock remains 245.0 million. LODE shares began trading on a split-adjusted basis on February 25 and gained 5.6% to close at $3.05 per share.

Updating estimates. While we have made no changes to our 2024 estimates, we estimate first quarter 2025 weighted average shares outstanding of 154.5 million due to the timing of the reverse split. We have reduced our share count for the last three quarters of 2025 and project weighted average shares in 2025 to be 56.2 million. While our full year loss forecast of $22.0 million is unchanged, our earnings per loss estimate increased to $(0.39) from $(0.09).


Get the Full Report

Equity Research is available at no cost to Registered users of Channelchek. Not a Member? Click ‘Join’ to join the Channelchek Community. There is no cost to register, and we never collect credit card information.

This Company Sponsored Research is provided by Noble Capital Markets, Inc., a FINRA and S.E.C. registered broker-dealer (B/D).

*Analyst certification and important disclosures included in the full report. NOTE: investment decisions should not be based upon the content of this research summary. Proper due diligence is required before making any investment decision. 

GM Boosts Shareholder Returns with $6B Buyback and Dividend Hike

Key Points:
– GM announced a $6B share buyback and a 25% dividend increase to $0.15 per share
– Investors reacted positively, pushing GM stock up over 5% in morning trading
– Company maintains strong R&D spending of $8B+ while navigating potential tariff challenges

General Motors announced a significant boost to shareholder returns on Wednesday, unveiling a new $6 billion share repurchase program and increasing its quarterly dividend. The move comes just weeks after investors expressed disappointment when the automaker’s Q4 earnings call failed to include new capital return initiatives.

GM’s quarterly dividend will rise by $0.03 to $0.15 per share, marking the company’s first dividend increase since 2023. The $6 billion share repurchase authorization includes plans for a $2 billion accelerated share repurchase (ASR) program to be implemented in the near term.

Investors responded positively to the announcement, sending GM shares up more than 5% in morning trading to $49.22.

CEO Mary Barra emphasized the company’s strong execution across all three pillars of its capital allocation strategy. These include reinvesting for profitable growth, maintaining a strong investment-grade balance sheet, and returning capital to shareholders.

This latest buyback program follows GM’s previous $6 billion share repurchase plan and the $10 billion ASR program introduced in late 2023. The earlier initiatives coincided with a 33% dividend increase that took effect in January 2024.

During GM’s most recent earnings call, CFO Paul Jacobson had indicated the company would explore prudent ways to expand shareholder returns. In today’s announcement, he expressed confidence in the business plan and balance sheet strength, noting GM would remain agile in responding to potential policy changes.

Despite the increased focus on shareholder returns, GM confirmed its commitment to continued investment in its core business. The company expects 2025 capital spending to remain between $10-11 billion, including investments in battery manufacturing joint ventures. Research and product development spending is projected to exceed $8 billion for the year.

For fiscal 2025, GM has forecast profits between $13.7 billion and $15.7 billion, with diluted and adjusted earnings per share of $11-12. The company noted these projections don’t account for potential impacts from tariffs that might be implemented by the Trump administration on imported vehicles or parts.

While GM is clearly a large-cap stock, its shareholder-friendly actions could signal a broader trend that might eventually benefit small-cap stocks and the Russell 2000 index. Historically, when large corporations increase dividends and buybacks, it often reflects growing confidence in economic conditions that eventually filters down to smaller companies. The Russell 2000 has underperformed larger indices in recent years, but increased capital returns across the market could indicate improving liquidity conditions that typically benefit smaller firms more dramatically.

Additionally, GM’s ability to maintain robust capital returns while facing potential tariff challenges demonstrates corporate resilience that could reassure investors about smaller domestic manufacturers’ prospects. Many Russell 2000 companies are more domestically focused than their large-cap counterparts, potentially insulating them from international trade disruptions.

The shareholder return increases demonstrate GM’s financial strength despite ongoing challenges in the automotive industry, including electrification costs, competition, and potential trade policy changes. The company’s willingness to boost returns while maintaining substantial investments in future technologies suggests management’s confidence in its long-term business strategy.

As GM navigates the evolving automotive landscape, this balanced approach to capital allocation appears designed to keep both long-term investors and those seeking immediate returns satisfied while the company continues its transition toward an electric future.

Release – Bitcoin Depot Adds Another 11 BTC to its Treasury

Research News and Market Data on BTM

February 25, 2025 11:25 AM EST Download as PDF

ATLANTA, Feb. 25, 2025 (GLOBE NEWSWIRE) — Bitcoin Depot (NASDAQ: BTM) (“Bitcoin Depot” or the “Company”), a U.S.-based Bitcoin ATM operator and leading fintech company, today announced it has purchased an additional 11.1 Bitcoin as part of its treasury strategy, first announced in June of last year.

This purchase comes three weeks after the Company’s purchase of 51 Bitcoin earlier this month, bringing its total treasury holdings to 82.6 BTC.

“Adopting Bitcoin as part of our treasury strategy underscores our long-standing belief in Bitcoin as a significant financial asset and a store of value,” said Brandon Mintz, CEO of Bitcoin Depot. “We have always believed in providing easy access to Bitcoin for everyone, and this move reaffirms our confidence in Bitcoin’s potential for growth.”

About Bitcoin Depot
Bitcoin Depot Inc. (Nasdaq: BTM) was founded in 2016 with the mission to connect those who prefer to use cash to the broader, digital financial system. Bitcoin Depot provides its users with simple, efficient and intuitive means of converting cash into Bitcoin, which users can deploy in the payments, spending and investing space. Users can convert cash to bitcoin at Bitcoin Depot kiosks in 48 states and at thousands of name-brand retail locations in 29 states through its BDCheckout product. The Company has the largest market share in North America with over 8,400 kiosk locations as of February 25, 2025. Learn more at www.bitcoindepot.com.

Cautionary Statement Regarding Forward-Looking Statements
This press release and any oral statements made in connection herewith include “forward-looking statements” within the meaning of Section 27A of the Securities Act of 1933, as amended, and Section 21E of the Exchange Act of 1934, as amended. Forward-looking statements are any statements other than statements of historical fact, and include, but are not limited to, statements regarding the expectations of plans, business strategies, objectives and growth and anticipated financial and operational performance, including our growth strategy and ability to increase deployment of our products and services, our ability to strengthen our financial profile, and worldwide growth in the adoption and use of cryptocurrencies. These forward-looking statements are based on management’s current beliefs, based on currently available information, as to the outcome and timing of future events. Forward-looking statements are often identified by words such as “anticipate,” “appears,” “approximately,” “believe,” “continue,” “could,” “designed,” “effect,” “estimate,” “evaluate,” “expect,” “forecast,” “goal,” “initiative,” “intend,” “may,” “objective,” “outlook,“ ”plan,“ ”potential,“ ”priorities,“ ”project,“ ”pursue,“ ”seek,“ ”should,“ ”target,“ ”when,“ ”will,“ ”would,” or the negative of any of those words or similar expressions that predict or indicate future events or trends or that are not statements of historical matters, although not all forward-looking statements contain such identifying words. In making these statements, we rely upon assumptions and analysis based on our experience and perception of historical trends, current conditions, and expected future developments, as well as other factors we consider appropriate under the circumstances. We believe these judgments are reasonable, but these statements are not guarantees of any future events or financial results. These forward-looking statements are provided for illustrative purposes only and are not intended to serve as, and must not be relied on by any investor as, a guarantee, an assurance, a prediction or a definitive statement of fact or probability. Actual events and circumstances are difficult or impossible to predict and will differ from assumptions. Many actual events and circumstances are beyond our control.

These forward-looking statements are subject to a number of risks and uncertainties, including changes in domestic and foreign business, market, financial, political and legal conditions; failure to realize the anticipated benefits of the business combination; risks relating to the uncertainty of our projected financial information; future global, regional or local economic and market conditions; the development, effects and enforcement of laws and regulations; our ability to manage future growth; our ability to develop new products and services, bring them to market in a timely manner and make enhancements to our platform; the effects of competition on our future business; our ability to issue equity or equity-linked securities; the outcome of any potential litigation, government and regulatory proceedings, investigations and inquiries; and those factors described or referenced in filings with the Securities and Exchange Commission. If any of these risks materialize or our assumptions prove incorrect, actual results could differ materially from the results implied by these forward-looking statements. There may be additional risks that we do not presently know or that we currently believe are immaterial that could also cause actual results to differ from those contained in the forward-looking statements. In addition, forward-looking statements reflect our expectations, plans or forecasts of future events and views as of the date of this press release. We anticipate that subsequent events and developments will cause our assessments to change.

We caution readers not to place undue reliance on forward-looking statements. Forward-looking statements speak only as of the date they are made, and we undertake no obligation to update publicly or otherwise revise any forward-looking statements, whether as a result of new information, future events, or other factors that affect the subject of these statements, except where we are expressly required to do so by law. All written and oral forward-looking statements attributable to us are expressly qualified in their entirety by this cautionary statement.

Contacts:

Investors 
Cody Slach
Gateway Group, Inc. 
949-574-3860 
BTM@gateway-grp.com

Media 
Brenlyn Motlagh, Ryan Deloney 
Gateway Group, Inc.
949-574-3860 
BTM@gateway-grp.com

Primary Logo

Source: Bitcoin Depot Inc.

Released February 25, 2025

Release – GDEV Provides Clarification In Respect Of Previously Announced Special Cash Dividend

Research News and Market Data on GDEV

February 25, 2025 08:00 ET 

LIMASSOL, Cyprus, Feb. 25, 2025 (GLOBE NEWSWIRE) — GDEV Inc. (Nasdaq: GDEV), an international gaming and entertainment company (“GDEV” or the “Company”), today issued a clarification in respect of its previously announced one-time, nonrecurring special cash dividend of $3.31 per share, payable on March 11, 2025, to the Company’s shareholders of record as of the close of business on March 3, 2025. According to Nasdaq, the ex-dividend date for Nasdaq trading will be March 12, 2025.

Nasdaq Rule 11140(b)(2) provides that if the value of a cash dividend is 25% or greater than the value of the subject security, the ex-dividend date will be the first business day following the payable date. According to Nasdaq, the value of the subject security is based upon the closing bid price as of the last trading date before the public announcement of the cash dividend. The closing bid price of GDEV shares as of February 20, 2025, the last trading date before the Company’s public announcement of the special dividend, was $12.82.

On March 12, 2025, the ex-dividend date, Nasdaq will reset the opening trading price of GDEV’s ordinary shares to reflect the payment of the special dividend. While an investor generally needs to own the shares on the payable date to be entitled to the special dividend, investors should consult with their financial advisors as to their entitlement to the special dividend. The trading price for GDEV’s ordinary shares on the ex-dividend date is expected to be lower than the closing price on March 11, 2025, the last trading date before the ex-dividend date, to reflect the amount of the special dividend. On and after the ex-dividend date, purchasers of GDEV’s ordinary shares will have no right to receive the special dividend with respect to those newly purchased ordinary shares.

About GDEV Inc.
GDEV is a gaming and entertainment holding company, focused on development and growth of its franchise portfolio across various genres and platforms. With a diverse range of subsidiaries including Nexters and Cubic Games, among others, GDEV strives to create games that will inspire and engage millions of players for years to come. Its franchises, such as Hero Wars, Island Hoppers, Pixel Gun 3D and others have accumulated over 550 million installs and $2.5 billion of bookings worldwide. For more information, please visit www.gdev.inc.

Contacts:

Investor Relations
Roman Safiyulin | Chief Corporate Development Officer
investor@gdev.inc

Cautionary statement regarding forward-looking statements

Certain statements in this press release may constitute “forward-looking statements” for purposes of the federal securities laws. Such statements are based on current expectations that are subject to risks and uncertainties. In addition, any statements that refer to projections, forecasts or other characterizations of future events or circumstances, including any underlying assumptions, are forward-looking statements.

The forward-looking statements contained in this press release are based on the Company’s current expectations and beliefs concerning future developments and their potential effects on the Company. There can be no assurance that future developments affecting the Company will be those that the Company has anticipated. Forward-looking statements involve a number of risks, uncertainties (some of which are beyond the Company’s control) or other assumptions. You should carefully consider the risks and uncertainties described in the “Risk Factors” section of the Company’s 2023 Annual Report on Form 20-F, filed by the Company on April 29, 2024, and other documents filed by the Company from time to time with the SEC. Should one or more of these risks or uncertainties materialize, or should any of the Company’s assumptions prove incorrect, actual results may vary in material respects from those projected in these forward-looking statements. Forward-looking statements speak only as of the date they are made. Readers are cautioned not to put undue reliance on forward-looking statements, and the Company undertakes no obligation to update or revise any forward-looking statements, whether as a result of new information, future events or otherwise, except as may be required under applicable securities laws.

Release – FAT Brands to Announce Fourth Quarter and Full Year 2024 Financial Results On February 27, 2025

Primary Logo

Research News and Market Data on FAT

02/25/2025

Download(opens in new window)

LOS ANGELES, Feb. 25, 2025 (GLOBE NEWSWIRE) — FAT (Fresh. Authentic. Tasty.) Brands Inc. (NASDAQ: FAT) (“FAT Brands” or the “Company”), a leading global franchising company and parent company of iconic brands including Round Table Pizza, Fatburger, Johnny Rockets, Twin Peaks, Fazoli’s and 13 other restaurant concepts, today announced that the Company will host a conference call to review its fourth quarter and full year 2024 financial results on Thursday, February 27, 2025 at 4:30 PM ET. A press release with fourth quarter and full year 2024 financial results will be issued prior to the conference call that day.

The conference call can be accessed live over the phone by dialing 1-877-704-4453 from the U.S. or 1-201-389-0920 internationally. A replay will be available after the call until Thursday, March 20, 2025, and can be accessed by dialing 1-844-512-2921 from the U.S. or 1-412-317-6671 internationally. The passcode is 13751410. Hosting the call will be Andy Wiederhorn, Chairman, and Ken Kuick, Co-Chief Executive Officer and Chief Financial Officer.

The conference call will also be webcast live from the corporate website at www.fatbrands.com, under the “Investors” section. A replay of the webcast will be available through the corporate website shortly after the call has concluded.

About FAT (Fresh. Authentic. Tasty.) Brands

FAT Brands (NASDAQ: FAT) is a leading global franchising company that strategically acquires, markets, and develops fast casual, quick-service, casual dining, and polished casual dining concepts around the world. The Company currently owns 18 restaurant brands: Round Table Pizza, Fatburger, Marble Slab Creamery, Johnny Rockets, Fazoli’s, Twin Peaks, Great American Cookies, Smokey Bones, Hot Dog on a Stick, Buffalo’s Cafe & Express, Hurricane Grill & Wings, Pretzelmaker, Elevation Burger, Native Grill & Wings, Yalla Mediterranean and Ponderosa and Bonanza Steakhouses, and franchises and owns over 2,300 units worldwide. For more information on FAT Brands, please visit  www.fatbrands.com.

Investor Relations:
ICR
Michelle Michalski
IR-FATBrands@icrinc.com

Media Relations:

Erin Mandzik 
emandzik@fatbrands.com

###

Source: FAT Brands Inc.

Bitcoin Slips Below $90K as Crypto Market Faces Volatility

Key Points:
– Bitcoin fell below $90,000 for the first time since January, marking a nearly 20% decline from its all-time high.
– A $1.5 billion security breach at Bybit and ongoing macroeconomic uncertainty have contributed to the market selloff.
– Crypto-linked stocks like MicroStrategy and Coinbase have also seen significant declines as investor confidence wanes.

Bitcoin, the world’s largest cryptocurrency by market capitalization, tumbled below the $90,000 mark on Monday, extending a broader crypto market selloff. As of 10:57 AM EST, Bitcoin was trading at approximately $87,595, reflecting a 6.8% decline from the previous close. The leading digital asset has now fallen nearly 20% from its record high of $109,000 set in January.

The downturn has impacted the broader cryptocurrency market, with Ethereum (ETH) dropping 8.7% to $2,418 and other major altcoins like Solana (SOL) and Dogecoin (DOGE) posting losses of 7.9% and 8.8%, respectively.

Several factors have weighed on Bitcoin’s price, including macroeconomic uncertainty, regulatory concerns, and a major security breach. The broader financial markets have shown increased volatility, with the S&P 500 posting a three-day losing streak. Investors are wary of persistent inflation and the Federal Reserve’s policy stance, which has added to Bitcoin’s downward momentum.

Adding to the pressure, a $1.5 billion hack on Dubai-based cryptocurrency exchange Bybit last week has shaken investor confidence. Although Bybit reassured customers that their assets remained safe, the breach has reignited fears over crypto security vulnerabilities.

Regulatory uncertainty is also playing a role in market sentiment. The recent inauguration of President Donald Trump has introduced questions about the administration’s stance on cryptocurrency regulation. While Trump’s pro-business policies could favor crypto adoption, the lack of clear guidelines has created short-term uncertainty for investors.

The selloff has extended beyond digital assets, impacting crypto-related equities. Shares of MicroStrategy (MSTR), a major corporate holder of Bitcoin, fell 8.5%, while Coinbase Global (COIN) and Robinhood (HOOD) saw declines of 7% to 9%. The downturn in these stocks underscores Bitcoin’s influence on the broader financial market.

Market analysts remain divided on Bitcoin’s short-term outlook. Some believe the digital asset has not yet found its floor, with Geoffrey Kendrick, global head of digital assets research at Standard Chartered, predicting further declines into the “low $80Ks.”

Others see the price drop as a potential buying opportunity. Data from Kraken suggests an increase in the long-short ratio, indicating that traders are “buying the dip” in anticipation of a recovery. However, given the ongoing volatility, analysts urge investors to exercise caution before making any significant moves.

As Bitcoin navigates uncertain terrain, investors are watching macroeconomic developments, regulatory updates, and market liquidity for further signals. While the cryptocurrency has historically rebounded from sharp corrections, the current environment calls for prudent risk management.

For now, Bitcoin remains at a crossroads, and its next move will depend on whether confidence can be restored in the market.

Release – Travelzoo Reports Fourth Quarter 2024 Results

Travelzoo logo

Research News and Market Data on TZOO

Feb 25, 2025, 07:13 ET

NEW YORK, Feb. 25, 2025 /PRNewswire/ — Travelzoo® (NASDAQ: TZOO):

  • Revenue of $20.7 million, down 2% year-over-year
  • Consolidated operating profit of $4.9 million, up 8% year-over-year
  • Non-GAAP consolidated operating profit of $5.3 million
  • Cash flow from operations of $7.7 million
  • Earnings per share (EPS) of $0.26

Travelzoo, the club for travel enthusiasts, today announced financial results for the fourth quarter ended December 31, 2024. Consolidated revenue was $20.7 million, down 2% year-over-year. In constant currencies, revenue was $20.6 million. Travelzoo’s reported revenue consists of advertising revenues and commissions, derived from and generated in connection with purchases made by Travelzoo members, and membership fees.

Net income attributable to Travelzoo was $3.2 million for Q4 2024, or $0.26 per share, compared with $0.27 in the prior-year period. Net income attributable to Travelzoo from continuing operations was $3.2 million for Q4 2024, or $0.26 per share, compared with $0.24 in the prior-year period.

Non-GAAP operating profit was $5.3 million. Non-GAAP operating profit excludes amortization of intangibles ($93,000), stock option expenses ($0.4 million). Please refer to “Non-GAAP Financial Measures” and the tabular reconciliation below.

“We will continue to leverage Travelzoo’s global reach, trusted brand, and strong relationships with top travel suppliers to negotiate more Club Offers for Club Members,” said Holger Bartel, Travelzoo’s Global CEO. “Travelzoo members are affluent, active, and open to new experiences. We inspire travel enthusiasts to travel to places they never imagined they could. Travelzoo is the must-have membership for those who love to travel as much as we do.”

Cash Position
As of December 31, 2024, consolidated cash, cash equivalents and restricted cash were $17.7 million. Net cash provided by operations was $7.7 million.

Travelzoo North America
North America business segment revenue increased 1% year-over-year to $13.9 million. Operating profit for Q4 2024 was $4.6 million, or 33% of revenue, compared to operating profit of $4.0 million in the prior-year period.

Travelzoo Europe
Europe business segment revenue decreased 13% year-over-year to $5.4 million, caused primarily by fluctuations in Germany. In constant currencies, Europe business segment revenue was $5.3 million. Operating profit for Q4 2024 was $159,000, or 3% of revenue, compared to operating profit of $832,000 in the prior-year period.

Jack’s Flight Club
Jack’s Flight Club is a membership subscription service in which Travelzoo has a 60% ownership interest. As the number of premium subscribers continues to grow, revenue increased 19% year-over-year to $1.3 million. Jack’s Flight Club’s revenue from subscriptions is recognized ratably over the subscription period (quarterly, semi-annually, annually). Non-GAAP operating profit for Q4 2024 was $208,000. Non-GAAP operating profit excludes amortization of intangibles ($58,000) related to the acquisition of Travelzoo’s ownership interest in Jack’s Flight Club in 2020.

New Initiatives
New Initiatives business segment revenue, which includes Licensing and Travelzoo META, was $19,000. Operating loss for Q4 2024 was $36,000.

In June 2020, Travelzoo entered into a royalty-bearing licensing agreement with a local licensee in Japan for the exclusive use of Travelzoo’s brand, business model, and members in Japan. In August of 2020, Travelzoo entered into a royalty-bearing licensing agreement with a local licensee in Australia for the exclusive use of Travelzoo’s brand, business models, and members in Australia, New Zealand, and Singapore. Under these arrangements, Travelzoo’s existing members in Australia, Japan, New Zealand, and Singapore will continue to be owned by Travelzoo as the licensor. Travelzoo recorded $7,000 in licensing revenue from the licensee in Japan in Q4 2024. Travelzoo recorded $12,000 in licensing revenue from the licensee in Australia, New Zealand, and Singapore in Q4 2024. Licensing revenue is expected to increase in the future.

Reach
Travelzoo reaches 30 million travelers. This includes Jack’s Flight Club. Comparisons to prior periods are no longer meaningful due to strategic developments of the Travelzoo membership.

Discontinued Operations
In March 2020, Travelzoo decided to exit its Asia Pacific business and operate it as a licensing business going forward. Consequently, the Asia Pacific business has been classified as discontinued operations.

Income Taxes
A provision of $1.5 million for income taxes was recorded for Q4 2024, compared to an income tax expense of $1.6 million in the prior-year period. Travelzoo intends to utilize available net operating losses (NOLs) to largely offset its actual tax liability for 2024.

Share Repurchase Program
During Q4 2024, the Company repurchased 135,792 shares of its outstanding common stock.

Looking Ahead
For Q1 2025, we expect revenue to increase at a higher pace. The pro rata portion of membership fee revenue will already add 5% incremental growth this quarter. This percentage is expected to increase over subsequent quarters, as membership fee revenue is recognized ratably over the subscription period, we acquire new members, and more Legacy Members become Club Members. For the whole year, we expect substantially higher revenue growth. Over time, we expect profitability to further increase as recurring membership fee revenue will be recognized.

In 2024, we introduced a membership fee for Travelzoo. Legacy Members, who joined before 2024, were exempt from the fee during 2024. Legacy Members represent more than 95% of Travelzoo’s reach. In 2025, Legacy Members continue to receive certain travel offers. But Club Offers and new benefits are only available to Club Members. We generally see Legacy Members being excited to become Club Members.

Non-GAAP Financial Measures
Management calculates non-GAAP operating income when evaluating the financial performance of the business. Travelzoo’s calculation of non-GAAP operating income, also called “non-GAAP operating profit” in this press release and today’s earnings conference call, excludes the following items: amortization of intangibles, stock option expenses and severance-related expenses. This press release includes a table which reconciles GAAP operating income to the calculation of non-GAAP operating income. Non-GAAP operating income is not required by, or presented in accordance with, generally accepted accounting principles in the United States of America (“GAAP”). This information should be considered as supplemental in nature and should not be considered in isolation or as a substitute for the financial information prepared in accordance with GAAP. In addition, these non-GAAP financial measures may not be the same as similarly titled measures reported by other companies.

Conference Call
Travelzoo will host a conference call to discuss fourth quarter 2024 results today at 11:00 a.m. ET. Please visit http://ir.travelzoo.com/events-presentations to

  • download the management presentation (PDF format) to be discussed in the conference call
  • access the webcast

About Travelzoo
We, Travelzoo®, are the club for travel enthusiasts. We reach 30 million travelers. Club Members receive Club Offers personally reviewed by our deal experts around the globe. We have our finger on the pulse of outstanding travel, entertainment, and lifestyle experiences. We work in partnership with thousands of top travel suppliers—our long-standing relationships give us access to irresistible deals.

Certain statements contained in this press release that are not historical facts may be forward-looking statements within the meaning of Section 27A of the Securities Act of 1933 and Section 21E of the Securities and Exchange Act of 1934. These forward-looking statements may include, but are not limited to, statements about our plans, objectives, expectations, prospects and intentions, markets in which we participate and other statements contained in this press release that are not historical facts. When used in this press release, the words “expect”, “predict”, “project”, “anticipate”, “believe”, “estimate”, “intend”, “plan”, “seek” and similar expressions are generally intended to identify forward-looking statements. Because these forward-looking statements involve risks and uncertainties, there are important factors that could cause actual results to differ materially from those expressed or implied by these forward-looking statements, including changes in our plans, objectives, expectations, prospects and intentions and other factors discussed in our filings with the SEC. We cannot guarantee any future levels of activity, performance or achievements. Travelzoo undertakes no obligation to update forward-looking statements to reflect events or circumstances occurring after the date of this press release.

Investor Relations:
ir@travelzoo.com

SOURCE Travelzoo