Release – LODE: Comstock Fuels and SACL Executed Definitive Commercial Agreements

Research News and Market Data on LODE

Expands Licensing Agreement into Malaysia for SAF and Other Renewable Fuels

OKLAHOMA CITY, OKLAHOMA – JANUARY 30, 2025 – Comstock Inc. (NYSE: LODE) (“Comstock” and the “Company”) today announced the execution of definitive agreements between Comstock Fuels Corporation (“Comstock Fuels”) and SACL Pte. Limited (“SACL”), a Singapore-based renewable fuel project developer, under which Comstock Fuels and SACL signed an exclusive marketing agreement for Comstock Fuels’ advanced lignocellulosic biomass refining processes in Australia, New Zealand, Vietnam and Malaysia. The definitive agreements finalized all documentation and increase SACL’s territory to facilitate the financing, construction, and operation of additional SACL’s sites in Malaysia, adding to the four existing sites currently under development in Australia and Vietnam, now totaling over 400 million gallons of renewable fuel per dry metric ton of feedstock (on a gasoline gallon equivalent basis, or “GGE”).

Early Adopter License Terms

SACL and its stakeholders previously identified four qualified sites for the construction of four BioleumTM Refineries based on Comstock Fuels’ industry leading yields and decarbonizing impact, including (1) a 250,000 metric ton per year (“MTPY”) refinery located at Myamyn, near Portland, Victoria, Australia, (2) a 250,000 MTPY refinery located near Moree, New South Wales, Australia, (3) a 750,000 MTPY refinery located near Mackay, Queensland, Australia, and (4) a 750,000 MTPY Bioleum Refinery in Quang Tri Province, Vietnam. SACL also has sites under negotiations in New Zealand and Malaysia.

Under the terms of Comstock Fuels’ agreement with SACL, Comstock Fuels will contribute site specific technology rights in exchange for a 20% equity stake in each Bioleum Refinery, plus a royalty fee equal to 6% of each refinery’s sales of licensed products, and engineering fees equal to 6% of total construction costs. At least one of the Bioleum Refineries will initially start with a capacity of 75,000 MTPY prior to scaling-up to 250,000 MTPY or more, with early adopter royalty fees of 3% of sales and engineering fees equal to 3% of construction costs until scaling-up to 250,000 MTPY, with an initial upfront payment of $2,500,000 payable upon execution of each applicable site-specific license agreement for each refinery.

The four planned Bioleum Refineries will have an estimated total construction cost of over $4.0 billion and produce approximately 280 million gallons per year of gasoline, sustainable aviation fuel, and other renewable fuels from lignocellulosic biomass (on a gasoline gallon equivalent basis, or GGE), and about another 180 million GGE from vegetable oils, with over $3.0 billion per year in sales at current prices.

Best-in-Class Yield and Carbon Intensity

Comstock Fuels offers advanced lignocellulosic biomass refining solutions that produce market-leading yields of cellulosic ethanol, gasoline, renewable diesel, sustainable aviation fuel, and other renewable fuels at extremely low carbon intensities. The Comstock Fuels process generally involves: (1) digestion and fractionation of lignocellulosic biomass, (2) bioconversion of cellulose into Cellulosic Ethanol, (3) esterification of lignin and other derivatives into Bioleum Oil, (4) hydrodeoxygenation of Bioleum Oil into Hydrodeoxygenated Bioleum Oil, (5) refining of these extremely low carbon oils and fuels into ASTM compliant renewable fuels, and (6) gas-to-liquids emissions capture and fuel conversion. The first five of these processes are proven to produce up to 125 GGEs per dry metric ton of feedstock on a gasoline gallon equivalent basis, depending on feedstock, lignin content, site conditions, and other process parameters, with extremely low carbon intensity scores of 15.

Wide Open Market, Unprecedented Results

“Comstock Fuels’ breakthrough yields unlock an abundant, available and efficient feedstock source that enables extraordinary new opportunities for renewable fuels project developers, especially given the ongoing global surge in demand for sustainable aviation fuel,” said Garry Millar, SACL’s founder and director. “Comstock’s process uses reliable, available equipment and standard refining processes to convert woody and woody-like biomass, such as purpose grown eucalyptus and Hexas’ XanoGrass™ into renewable intermediates and fuels that leverage existing supply chains. We are pleased to have these definitive agreements completed, including the expansion into Malaysia, and we are looking forward to working with David and the expanded local team to develop our growing portfolio of projects.”

“SACL’s team has continued advancing and expanding their projects, and I look forward to meeting with Garry next week in Australia, as we collaborate and advance all of our mutual objectives in Asia,” stated David Winsness, president of Comstock Fuels. “The prospective site in New Zealand is truly outstanding.”

Comstock Fuels is concurrently executing on its own plans to build, own, and operate the first 75,000 MTPY demonstration scale facility in Oklahoma, followed by three additional 75,000 MTPY facilities, each of which would then be scaled-up to 1,000,000 MTPY commercial scale Bioleum refineries. Collectively, the first four planned U.S. facilities will produce more than 920 million GGE per year of renewable fuels, including about 560 million GGE from woody and woody-like biomass and another 360 million GGE from vegetable oils. Between SACL and our initial plans alone, Comstock Fuels is planning for over 1.38 billion GGE per year of initial renewable fuel production before considering all other licensees and projects in the commercial development pipeline.

About SACL Pte. Limited

SACL is a Singapore-based project development and management company that intends to develop renewable energy projects in Australia, New Zealand, and Vietnam. To learn more, please visit www.saclimited.com.

About Comstock Fuels Corporation

Comstock Fuels Corporation (“Comstock Fuels”) delivers advanced lignocellulosic biomass refining solutions that set industry benchmarks for production of cellulosic ethanol, gasoline, renewable diesel, sustainable aviation fuel (“SAF”), and other renewable Bioleum™ fuels, with extremely low carbon intensity scores of 15 and market-leading yields of up to 140 gallons per dry metric ton of feedstock (on a gasoline gallon equivalent basis, or “GGE”), depending on feedstock, site conditions, and other process parameters. Comstock Fuels additionally holds the exclusive rights to intellectual properties developed by Hexas Biomass Inc. (“Hexas”) for production of purpose grown energy crops in liquid fuels applications with proven yields exceeding 25 to 30 dry metric tons per acre per year. The combination of Comstock Fuels’ high yield Bioleum refining platform and Hexas’ high yield energy crops allows for the production of enough feedstock to produce upwards of 100 barrels of fuel per acre per year, effectively transforming marginal agricultural lands with regenerative practices into perpetual “drop-in sedimentary oilfields” with the potential to dramatically boost regional energy security and rural economies.

Comstock Fuels plans to contribute to domestic energy dominance by directly building, owning, and operating a network of Bioleum Refineries in the U.S. to produce about 200 million barrels of renewable fuel per year by 2035, starting with its planned first 400,000 barrel per year commercial demonstration facility in Oklahoma. Comstock Fuels also licenses its advanced feedstock and refining solutions to third parties for additional production in the U.S. and global markets, including several recently announced and other pending projects. To learn more, please visit www.comstockfuels.com.

About Comstock Inc.

Comstock Inc. (NYSE: LODE) innovates and commercializes technologies that are deployable across entire industries to contribute to energy abundance by efficiently extracting and converting under-utilized natural resources, such as waste and other forms of woody biomass into renewable fuels, and end-of-life electronics into recovered electrification metals. Comstock’s innovations group is also developing and using artificial intelligence technologies for advanced materials development and mineral discovery for sustainable mining. To learn more, please visit www.comstock.inc.

Comstock Social Media Policy

Comstock Inc. has used, and intends to continue using, its investor relations link and main website at www.comstock.inc in addition to its TwitterLinkedIn and YouTube accounts, as means of disclosing material non-public information and for complying with its disclosure obligations under Regulation FD.

Contacts

For investor inquiries:
RB Milestone Group LLC
Tel (203) 487-2759
ir@comstockinc.com

For media inquiries or questions:
Colby Korsun
Comstock Fuels Corporation
fuels@comstockinc.com

Forward-Looking Statements

This press release and any related calls or discussions may include forward-looking statements within the meaning of Section 27A of the Securities Act of 1933, as amended, and Section 21E of the Securities Exchange Act of 1934, as amended. All statements, other than statements of historical facts, are forward-looking statements. The words “believe,” “expect,” “anticipate,” “estimate,” “project,” “plan,” “should,” “intend,” “may,” “will,” “would,” “potential” and similar expressions identify forward-looking statements but are not the exclusive means of doing so. Forward-looking statements include statements about matters such as: future market conditions; future explorations or acquisitions; future changes in our research, development and exploration activities; future financial, natural, and social gains; future prices and sales of, and demand for, our products and services; land entitlements and uses; permits; production capacity and operations; operating and overhead costs; future capital expenditures and their impact on us; operational and management changes (including changes in the Board of Directors); changes in business strategies, planning and tactics; future employment and contributions of personnel, including consultants; future land and asset sales; investments, acquisitions, joint ventures, strategic alliances, business combinations, operational, tax, financial and restructuring initiatives, including the nature, timing and accounting for restructuring charges, derivative assets and liabilities and the impact thereof; contingencies; litigation, administrative or arbitration proceedings; environmental compliance and changes in the regulatory environment; offerings, limitations on sales or offering of equity or debt securities, including asset sales and associated costs; business opportunities, growth rates, future working capital, needs, revenues, variable costs, throughput rates, operating expenses, debt levels, cash flows, margins, taxes and earnings. These statements are based on assumptions and assessments made by our management in light of their experience and their perception of historical and current trends, current conditions, possible future developments and other factors they believe to be appropriate. Forward-looking statements are not guarantees, representations or warranties and are subject to risks and uncertainties, many of which are unforeseeable and beyond our control and could cause actual results, developments, and business decisions to differ materially from those contemplated by such forward-looking statements. Some of those risks and uncertainties include the risk factors set forth in our filings with the SEC and the following: adverse effects of climate changes or natural disasters; adverse effects of global or regional pandemic disease spread or other crises; global economic and capital market uncertainties; the speculative nature of gold or mineral exploration, and lithium, nickel and cobalt recycling, including risks of diminishing quantities or grades of qualified resources; operational or technical difficulties in connection with exploration, metal recycling, processing or mining activities; costs, hazards and uncertainties associated with precious and other metal based activities, including environmentally friendly and economically enhancing clean mining and processing technologies, precious metal exploration, resource development, economic feasibility assessment and cash generating mineral production; costs, hazards and uncertainties associated with metal recycling, processing or mining activities; contests over our title to properties; potential dilution to our stockholders from our stock issuances, recapitalization and balance sheet restructuring activities; potential inability to comply with applicable government regulations or law; adoption of or changes in legislation or regulations adversely affecting our businesses; permitting constraints or delays; challenges to, or potential inability to, achieve the benefits of business opportunities that may be presented to, or pursued by, us, including those involving battery technology and efficacy, quantum computing and generative artificial intelligence supported advanced materials development, development of cellulosic technology in bio-fuels and related material production; commercialization of cellulosic technology in bio-fuels and generative artificial intelligence development services; ability to successfully identify, finance, complete and integrate acquisitions, joint ventures, strategic alliances, business combinations, asset sales, and investments that we may be party to in the future; changes in the United States or other monetary or fiscal policies or regulations; interruptions in our production capabilities due to capital constraints; equipment failures; fluctuation of prices for gold or certain other commodities (such as silver, zinc, lithium, nickel, cobalt, cyanide, water, diesel, gasoline and alternative fuels and electricity); changes in generally accepted accounting principles; adverse effects of war, mass shooting, terrorism and geopolitical events; potential inability to implement our business strategies; potential inability to grow revenues; potential inability to attract and retain key personnel; interruptions in delivery of critical supplies, equipment and raw materials due to credit or other limitations imposed by vendors; assertion of claims, lawsuits and proceedings against us; potential inability to satisfy debt and lease obligations; potential inability to maintain an effective system of internal controls over financial reporting; potential inability or failure to timely file periodic reports with the Securities and Exchange Commission; potential inability to list our securities on any securities exchange or market or maintain the listing of our securities; and work stoppages or other labor difficulties. Occurrence of such events or circumstances could have a material adverse effect on our business, financial condition, results of operations or cash flows, or the market price of our securities. All subsequent written and oral forward-looking statements by or attributable to us or persons acting on our behalf are expressly qualified in their entirety by these factors. Except as may be required by securities or other law, we undertake no obligation to publicly update or revise any forward-looking statements, whether as a result of new information, future events, or otherwise. Neither this press release nor any related calls or discussions constitutes an offer to sell, the solicitation of an offer to buy or a recommendation with respect to any securities of the Company, the fund, or any other issuer.

Release – Conduent to Report Fourth-Quarter and Full-Year 2024 Financial Results on Feb. 12, 2025

Research News and Market Data on CNDT

January 30, 2025

Conduent Incorporated (Nasdaq: CNDT), a global technology-led business solutions and services company, plans to report its fourth-quarter and full-year 2024 financial results on Wednesday, February 12 before market open. Management will present the results during a conference call and webcast at 9:00 a.m. ET.

The call will be available by live audio cast along with the news release and online presentation slides at https://investor.conduent.com .

The conference call will also be available by calling 877-407-4019 toll free. If requested, the conference ID 13750544.

The international dial-in is +1 201-689-8337. The international conference ID is also 13750544.

A recording of the conference call will be available by calling 877-660-6853 three hours after the conference call concludes. The access ID for the recording is 13750544.

The call recording will be available until February 26, 2025.

We look forward to your participation.

About Conduent
Conduent delivers digital business solutions and services spanning the commercial, government and transportation spectrum – creating valuable outcomes for its clients and the millions of people who count on them. The Company leverages cloud computing, artificial intelligence, machine learning, automation and advanced analytics to deliver mission-critical solutions. Through a dedicated global team of approximately 55,000 associates, process expertise and advanced technologies, Conduent’s solutions and services digitally transform its clients’ operations to enhance customer experiences, improve performance, increase efficiencies and reduce costs. Conduent adds momentum to its clients’ missions in many ways including disbursing approximately $100 billion in government payments annually, enabling 2.3 billion customer service interactions annually, empowering millions of employees through HR services every year and processing nearly 13 million tolling transactions every day. Learn more at www.conduent.com .

Note: To receive RSS news feeds, visit www.news.conduent.com . For open commentary, industry perspectives and views, visit http://twitter.com/Conduent http://www.linkedin.com/company/conduent or http://www.facebook.com/Conduent .

Trademarks
Conduent is a trademark of Conduent Incorporated in the United States and/or other countries. Other names may be trademarks of their respective owners.

Media Contacts

Sean Collins

Conduent

Sean.Collins2@conduent.com

+1-310-497-9205

Giles Goodburn

Conduent

ir@conduent.com

+1-203-216-3546

1-800-Flowers.com (FLWS) – A Largely Self Inflicted Miss


Friday, January 31, 2025

For more than 45 years, 1-800-Flowers.com has offered truly original floral arrangements, plants and unique gifts to celebrate birthdays, anniversaries, everyday occasions, and seasonal holidays, and to deliver comfort during times of grief. Backed by a caring team obsessed with service, 1-800-Flowers.com provides customers thoughtful ways to express themselves and connect with the most important people in their lives. 1-800-Flowers.com is part of the 1-800-FLOWERS.COM, Inc. family of brands. Shares in 1-800-FLOWERS.COM, Inc. are traded on the NASDAQ Global Select Market, ticker symbol: FLWS.

Michael Kupinski, Director of Research, Equity Research Analyst, Digital, Media & Technology , Noble Capital Markets, Inc.

Jacob Mutchler, Research Associate, Noble Capital Markets, Inc.

Refer to the full report for the price target, fundamental analysis, and rating.

Fiscal Q2 Results. The company reported fiscal Q2 revenue and adj. EBITDA of $775.5 million and $116.3 million, both of which were lower than our estimates of $801.1 million and $124.7 million, respectively. Notably, an order management system (OMS) that was implemented in Q2 for Harry & David faced issues with complicated orders during periods of high volume. The OMS issue, which was resolved in the quarter, resulted in roughly $20 million of lost revenue and is largely to blame for the downside variance.

Strategic initiatives. Importantly, the company remains focused on reducing costs through increased automation, increasing investments in sales and marketing, and broadening its product offerings for its price-sensitive customers. Notably, management highlighted that the savings from its cost reduction efforts will largely fund its increased investment in sales and marketing in an effort to broaden its customer base.


Get the Full Report

Equity Research is available at no cost to Registered users of Channelchek. Not a Member? Click ‘Join’ to join the Channelchek Community. There is no cost to register, and we never collect credit card information.

This Company Sponsored Research is provided by Noble Capital Markets, Inc., a FINRA and S.E.C. registered broker-dealer (B/D).

*Analyst certification and important disclosures included in the full report. NOTE: investment decisions should not be based upon the content of this research summary. Proper due diligence is required before making any investment decision. 

FAT Brands (FAT) – Distribution of Twin Hospitality Shares Completed


Friday, January 31, 2025

FAT Brands (NASDAQ: FAT) is a leading global franchising company that strategically acquires, markets, and develops fast casual, quick-service, casual dining, and polished casual dining concepts around the world. The Company currently owns 17 restaurant brands: Round Table Pizza, Fatburger, Marble Slab Creamery, Johnny Rockets, Fazoli’s, Twin Peaks, Great American Cookies, Hot Dog on a Stick, Buffalo’s Cafe & Express, Hurricane Grill & Wings, Pretzelmaker, Elevation Burger, Native Grill & Wings, Yalla Mediterranean and Ponderosa and Bonanza Steakhouses, and franchises and owns over 2,300 units worldwide. For more information on FAT Brands, please visit www.fatbrands.com.

Joe Gomes, CFA, Managing Director, Equity Research Analyst, Generalist , Noble Capital Markets, Inc.

Joshua Zoepfel, Research Associate, Noble Capital Markets, Inc.

Refer to the full report for the price target, fundamental analysis, and rating.

Distribution. FAT Brands has completed the previously announced distribution of approximately 5.0% of the fully diluted shares of Class A common stock of Twin Hospitality Group Inc. to holders of Class A common stock and Class B common stock of FAT Brands. We believe the distribution of Twin Hospitality will begin to highlight the value of the assets FAT Brands has assembled.

Details. FAT Brands common stockholders received 0.1520207 shares of Twin Hospitality common stock for each share of Class A common stock or Class B common stock of the Company held. In total, FAT Brands distributed 2,659,412 shares of the Twin Hospitality Class A common stock. FAT Brands continues to hold 44,638,859 Class A Twin Hospitality shares and 2,870,000 Class B shares (or 100% of the outstanding B shares).


Get the Full Report

Equity Research is available at no cost to Registered users of Channelchek. Not a Member? Click ‘Join’ to join the Channelchek Community. There is no cost to register, and we never collect credit card information.

This Company Sponsored Research is provided by Noble Capital Markets, Inc., a FINRA and S.E.C. registered broker-dealer (B/D).

*Analyst certification and important disclosures included in the full report. NOTE: investment decisions should not be based upon the content of this research summary. Proper due diligence is required before making any investment decision. 

Planet Secures $230 Million Satellite Contract, Signaling Space Industry’s Continued Growth

Key Points:
– Planet secures $230 million contract for Pelican satellite constellation
– Company plans to deploy up to 32 advanced satellites with AI capabilities
– Stock has more than doubled in past 12 months, indicating growing market confidence

The satellite imagery and data analysis company Planet has made a significant stride in the commercial space sector, announcing a landmark $230 million contract for its next-generation Pelican satellite constellation. This deal represents not just a financial milestone for the company, but also signals the growing potential of space-based technologies and services in the global market.

Planet’s CEO Will Marshall described the contract as the company’s biggest deal ever, involving the construction of dedicated satellites for an undisclosed customer in the Asia-Pacific region. The multi-year agreement spans satellite construction and a five-year operational period, highlighting the increasing commercial demand for specialized satellite services.

The Pelican satellite project represents a strategic evolution for Planet, which currently operates over 200 satellites in orbit. The new constellation aims to deploy up to 32 high-powered satellites, featuring advanced artificial intelligence capabilities through Nvidia’s Jetson edge platform. This technological leap underscores the rapid innovation happening in the commercial space industry, where data processing and imagery capabilities are becoming increasingly sophisticated.

Investors have taken notice of Planet’s potential, with the company’s stock more than doubling over the past 12 months. Despite the challenges faced by space companies following the SPAC boom of 2021, Planet has demonstrated resilience and strategic positioning in a competitive market. The recent contract, coupled with a multiyear agreement with the European Space Agency, suggests growing confidence in the company’s technological capabilities and market potential.

The broader space industry continues to attract significant investment and attention, with private companies pushing the boundaries of satellite technology, earth observation, and data analytics. Planet’s approach of offering dedicated satellite services represents a novel business model that could reshape how organizations access and utilize space-based technologies.

The company’s strategy extends beyond simply launching satellites, focusing on creating adaptable spacecraft that can be tailored to specific customer needs. This approach has already been tested with the Tanager satellite product line, demonstrating Planet’s ability to deliver customized solutions for various sectors, including environmental monitoring and research.

Technological advancements are driving the space industry’s growth, with artificial intelligence, miniaturization, and improved data processing capabilities making satellite services more accessible and valuable. The Pelican satellites, featuring advanced AI integration, exemplify this trend of increasingly intelligent and responsive space technologies.

For investors and industry observers, Planet’s latest contract represents more than a single business deal. It symbolizes the expanding commercial potential of space technologies, the increasing value of earth observation data, and the continued innovation in a sector that promises to transform multiple industries from agriculture and environmental monitoring to defense and telecommunications.

Take a moment to take a look at Kratos Defense & Security Solutions, a company that is changing the way for the United States National Security related customers, allies and commercial enterprises.

Gold Surges to Historic High as Economic Uncertainties Mount

Key Points:
– Gold hits record $2,817/oz amid dollar weakness and trade policy concerns
– Trump’s proposed tariffs spark renewed interest in safe-haven assets
– Federal Reserve adopts cautious stance on rate cuts amid policy uncertainty

Gold prices reached an unprecedented peak of $2,817 per ounce, marking a 1.4% surge amid growing economic uncertainties and a weakening dollar. The precious metal’s rally reflects mounting investor concerns over President Trump’s proposed tariff measures and their potential impact on global trade relations.

The rally comes as traders digest Trump’s latest announcement of potential 25% tariffs on Mexico and Canada, along with hints of broader levies that could exceed previous Treasury estimates. This policy uncertainty, coupled with a softer dollar following the European Central Bank’s rate decision, has intensified the appeal of gold as a safe-haven asset.

The Federal Reserve’s recent “wait-and-see” stance, articulated by Chair Jerome Powell during the year’s first FOMC meeting, has added another layer of complexity to the market dynamics. While holding interest rates steady, the Fed expressed caution about rushing into rate cuts, particularly given the uncertain impact of the new administration’s economic policies.

Market strategists, including Phil Streible of Blue Line Futures, point to growing concerns about stagflation – a combination of rising inflation and declining growth – as a key driver behind gold’s attractiveness. The precious metal historically performs well in such economic conditions, making it an increasingly appealing hedge for investors.

The rally has sparked a notable shift in precious metals markets, with U.S. prices for both gold and silver commanding premiums over international benchmarks. Dealers and traders are accelerating efforts to secure inventory ahead of potential tariff implementation, further driving up domestic prices.

Beyond immediate trade concerns, the precious metal’s appeal is bolstered by persistent worries over growing U.S. debt levels. Many analysts anticipate continued strength in gold prices throughout 2025, supported by central banks’ efforts to diversify reserves and reduce dollar dependency.

The latest surge represents a significant milestone in gold’s historical trajectory, surpassing the previous record set in October. This breakthrough is particularly notable as it comes during a period of relative economic strength, suggesting that investors are increasingly viewing gold as both a hedge against uncertainty and a strategic asset class in diversified portfolios.

The current gold market dynamics echo historical patterns of price appreciation during periods of significant policy shifts and economic uncertainty. Historical data shows that gold has typically performed strongly during periods of trade tensions and currency fluctuations, with the metal gaining an average of 15% during similar periods of policy uncertainty in the past two decades

Market watchers are particularly focused on the Saturday deadline for Mexican and Canadian tariffs, which could trigger further volatility in precious metals markets and potentially drive gold to new records as investors seek safety amid economic policy shifts.

Take a moment to look at emerging gold mining companies by taking a look at Noble Capital Markets Research Analyst Mark Reichman’s coverage list.

U.S. Economy Shows Resilience with 2.3% Growth Despite Year-End Slowdown

Key Points:
– Consumer spending surged 4.2%, driving overall economic growth
– Full-year GDP growth of 2.8% in 2024 exceeded sustainable growth expectations
– Business investment declined for the first time in two years, signaling potential concerns

The U.S. economy demonstrated remarkable resilience in the final quarter of 2024, growing at a 2.3% annual rate despite expectations of a more significant slowdown. While this represents a deceleration from the third quarter’s 3.1% growth, the underlying data reveals a robust economic foundation driven primarily by extraordinary consumer spending.

American consumers, who represent approximately 70% of economic activity, flexed their financial muscle during the holiday season, with spending surging at a 4.2% rate – the highest increase in nearly two years and double the typical pace. This robust consumer behavior served as the primary engine of economic growth, offsetting challenges in other sectors.

The full-year GDP growth for 2024 registered an impressive 2.8%, surpassing economists’ expectations for sustainable growth rates. This performance caps off a remarkable three-year streak of strong economic expansion, following 2.9% growth in 2023 and 2.5% in 2022, highlighting the economy’s post-pandemic resilience.

However, the report wasn’t without its concerns. Business investment experienced its first decline in two years, pointing to ongoing challenges in the manufacturing sector. The growth in inventories also slowed significantly, subtracting nearly a full percentage point from the headline GDP figure. Additionally, inflation ticked up to 2.3% in the fourth quarter from 1.5% in the third quarter, potentially complicating the Federal Reserve’s interest rate decisions.

As the economy transitions under the Trump administration, businesses are weighing potential opportunities against risks. While proposed tax cuts and deregulation could accelerate growth, concerns about potential tariffs and trade retaliation loom over the business community. The Federal Reserve has adopted a cautious stance, putting interest rate cuts on hold as it assesses both inflation trends and the impact of new economic policies.

Government spending contributed positively to growth, rising at a 2.5% rate and adding 0.4 percentage points to GDP. Despite a surprising surge in December’s trade deficit, international trade had minimal impact on the overall GDP figures.

Market analysts are particularly focused on the sustainability of consumer spending patterns as we move into 2025. The robust holiday shopping season, while impressive, has raised questions about whether households can maintain this pace of expenditure, especially given the uptick in inflation and continued high interest rates. Some economists suggest that the strong spending could be partially attributed to consumers drawing down savings accumulated during the pandemic era, a trend that may not be sustainable in the long term.

The labor market’s continued strength remains a crucial factor in maintaining economic momentum. With unemployment rates staying near historic lows and wage growth remaining solid, the foundation for continued consumer spending appears stable. However, the manufacturing sector’s struggles and reduced business investment could eventually impact job creation in these sectors, presenting a potential headwind to the broader economy’s growth trajectory.

Looking ahead, economists project continued growth at or above 2% for 2025, though the exact trajectory will largely depend on policy decisions from the new administration and the Federal Reserve’s response to evolving economic conditions.

Release – Kelly Announces Fourth-Quarter and Full-Year 2024 Conference Call

Research News and Market Data on KELYA

TROY, Mich., Jan. 30, 2025 (GLOBE NEWSWIRE) — Kelly, a leading global specialty talent solutions provider, will release its fourth-quarter and full-year earnings before the market opens on Thursday, February 13, 2025. In conjunction with its earnings release, Kelly will publish a financial presentation and host a live webcast of a conference call with financial analysts at 9 a.m. ET on February 13 to review the results from the quarter and answer questions.

The presentation and a link to the live webcast will be accessible through the Company’s public website on the Investor Relations page under Events & Presentations. The webcast will be recorded, and a replay will be available within one hour of completion of the event through the same link as the live webcast.

About Kelly

Kelly Services, Inc. (Nasdaq: KELYA, KELYB) helps companies recruit and manage skilled workers and helps job seekers find great work. Since inventing the staffing industry in 1946, we have become experts in the many industries and local and global markets we serve. With a network of suppliers and partners around the world, we connect more than 500,000 people with work every year. Our suite of outsourcing and consulting services ensures companies have the people they need, when and where they are needed most. Headquartered in Troy, Michigan, we empower businesses and individuals to access limitless opportunities in industries such as science, engineering, technology, education, manufacturing, retail, finance, and energy. Revenue in 2023 was $4.8 billion. Learn more at kellyservices.com.

KLYA-FIN

Analyst & Media Contact:
Scott Thomas
(248) 251-7264
scott.thomas@kellyservices.com

Release – Aurania Commissions Environmental Impact Study in Corsica

Research News and Market Data on AUIAF

Toronto, Ontario–(Newsfile Corp. – January 29, 2025) – Aurania Resources Ltd. (TSXV: ARU) (OTCQB: AUIAF) (FSE: 20Q) (“Aurania” or the “Company”) announces that its subsidiary company, Corsica Ressources, has commissioned a French environmental engineering firm to undertake an environmental impact study at Nonza and Albo beaches in Corsica. The study commenced in early January by a bibliographic review, currently in progress.

The impact study is one part of the nickel beach placer project at the Nonza and Albo beaches. The goal of the study is to assess the terrestrial and marine environments of the beaches, identify any potential impact of the Company’s proposed activities, and identify and propose solutions to eliminate or mitigate them if necessary. Corsica Ressources is keen to develop this project whilst ensuring appropriate measures are taken to preserve the original status of the environment and the local population. This objective is facilitated by the unique nature of the beaches themselves.

During the operation of the Canari mine (1948-1965), waste rock was discharged into the sea. Over time, this material migrated to the areas of Albo and Nonza, resulting in a globally unique situation.

Albo and Nonza beaches are artificially created beaches composed of serpentinite debris and black sand, which contain high concentrations of magnetite and awaruite. Awaruite (Ni₃Fe) is a nickel-rich magnetic mineral found in meteorites and certain serpentinite formations. See link to October 3, 2024 press release announcing the opportunity/discovery of the nickel-rich beach sands.

Aurania’s Chairman, CEO, and President, Dr. Keith Barron, commented, “Europe needs responsible sources of key metals for its energy transition. Corsica can play a vital role in this transition without compromising its environment or identity. This innovative project, extracting nickel without chemicals, not only preserves the beauty of the beaches in Corsica but also ensures that local communities benefit economically. Aurania and its subsidiary, Corsica Ressources are fully committed to a development model that respects both nature and the people who depend on it.”

Cannot view this image? Visit: https://images.newsfilecorp.com/files/2477/238933_4b593e78442a5aa0_001.jpg

Figure 1: The beaches are composed mainly of serpentinite in the form of pebbles, gravel and sand (left photo). The magnetic fraction of the sand from Albo and Nonza contains awaruite, a high-grade nickel-containing mineral (right photo).

Because awaruite is magnetic, it can be extracted simply using a magnet and, in this form, it is the only nickel mineral found in the world that can be recovered without the use of chemicals. Corsica Ressources plans to extract the sand underwater using a suction dredge, and then separate the magnetic fraction with an electromagnet, leaving the non-magnetic sand and pebbles on the beach to ensure the natural preservation of the beaches. It must be emphasized that tests have shown that 98% of the awaruite is contained in the size fraction of less than 1 mm. The screening process being proposed at Nonza and Albo will return all sand material that is non-magnetic and greater than 1 mm back to the beach. There is only interest in the magnetic fraction of less than 1 mm in particle size. It has been erroneously reported that the Company will crush and process serpentinite pebbles. All pebbles will be rejected untouched in the plant and placed back on the beaches.

The entire process will take place underwater, preventing the dispersion of any residual material into the air. To eliminate any potential disruption on local roads, the Company plans to transport the extracted magnetic product by sea using barges This material will contain circa 40% Ni and be suitable for furnace feed for any of the seven stainless steel producers in France. However, the laboratory has established the feasibility to separate the material further into a nominally pure awaruite concentrate using flotation technology. It can then be synthesized into battery-grade nickel sulphate for the manufacture of EV batteries. If it is considered appropriate and economically feasible, the magnetic concentrate produced at Nonza will be shipped by barge to a remote warehouse facility for further processing.

Cannot view this image? Visit: https://images.newsfilecorp.com/files/2477/238933_4b593e78442a5aa0_002.jpg

Figure 2: The extraction of awaruite will be carried out by inexpensive and non-polluting mechanical and physical methods.

Environmental protection and preservation are key aspects of the project. Corsica Ressources also aims to consider local communities by preserving tourism activities by working only in off season and ensuring that local populations benefit from the project. These topics were discussed with local stakeholders well before announcing the intentions of the project in October 2024. Together, the Company has worked to secure an agreement with officials in Paris to ensure that any royalties would be distributed locally. Corsica Ressources continues to meet with local stakeholders to address concerns and find appropriate solutions to ensure that the project benefits everyone. When the results of the impact study are known, Corsica Ressources will organize information for stakeholders and the population.

Update on Activities in Ecuador

The IP geophysical survey at the Company’s Kuri-Yawi gold target was completed in late 2024. The purpose of the survey is to define targets for a drill program. The final report from GexplOre is pending and as soon as the final report is received, Aurania’s geologists will work to complete their review and interpretation of the data. Key findings are expected to be published next month (February).

About Aurania

Aurania is a mineral exploration company engaged in the identification, evaluation, acquisition, and exploration of mineral property interests, with a focus on precious metals and copper in South America. Its flagship asset, The Lost Cities – Cutucu Project, is located in the Jurassic Metallogenic Belt in the eastern foothills of the Andes mountain range of southeastern Ecuador.

Information on Aurania and technical reports are available at www.aurania.com and www.sedarplus.ca, as well as on Facebook at https://www.facebook.com/auranialtd/, Twitter at https://twitter.com/auranialtd, and LinkedIn at https://www.linkedin.com/company/aurania-resources-ltd-.

For further information, please contact:

Carolyn Muir
VP Corporate Development & Investor Relations
Aurania Resources Ltd.
(416) 367-3200
carolyn.muir@aurania.com

Neither the TSX Venture Exchange nor its Regulation Services Provider (as that term is defined in the policies of the TSX Venture Exchange) accepts responsibility for the adequacy or accuracy of this release.

Forward-Looking Statements

This news release contains forward-looking information as such term is defined in applicable securities laws, which relate to future events or future performance and reflect management’s current expectations and assumptions. The forward-looking information includes Aurania’s objectives, goals or future plans, statements, exploration results, potential mineralization, the tonnage and grade of mineralization which has the potential for economic extraction and processing, the merits and effectiveness of known process and recovery methods, the corporation’s portfolio, treasury, management team and enhanced capital markets profile, the estimation of mineral resources, exploration, timing of the commencement of operations, the Company’s teams being on track ahead of any drill program, the commencement of any drill program and estimates of market conditions. Such forward-looking statements reflect management’s current beliefs and are based on assumptions made by and information currently available to Aurania, including the assumption that, there will be no material adverse change in metal prices, all necessary consents, licenses, permits and approvals will be obtained, including various local government licenses and the market. Investors are cautioned that these forward-looking statements are neither promises nor guarantees and are subject to risks and uncertainties that may cause future results to differ materially from those expected. Risk factors that could cause actual results to differ materially from the results expressed or implied by the forward-looking information include, among other things: failure to identify mineral resources; failure to convert estimated mineral resources to reserves; the inability to complete a feasibility study which recommends a production decision; the preliminary nature of metallurgical test results; the inability to recover and process mineralization using known mining methods; the presence of deleterious mineralization or the inability to process mineralization in an environmentally acceptable manner; commodity prices, supply chain disruptions, restrictions on labour and workplace attendance and local and international travel; a failure to obtain or delays in obtaining the required regulatory licenses, permits, approvals and consents; an inability to access financing as needed; a general economic downturn, a volatile stock price, labour strikes, political unrest, changes in the mining regulatory regime governing Aurania; a failure to comply with environmental regulations; a weakening of market and industry reliance on precious metals and base metals; and those risks set out in the Company’s public documents filed on SEDAR+. Aurania cautions the reader that the above list of risk factors is not exhaustive. Although the Company believes that the assumptions and factors used in preparing the forward-looking information in this news release are reasonable, undue reliance should not be placed on such information, which only applies as of the date of this news release, and no assurance can be given that such events will occur in the disclosed time frames or at all. The Company disclaims any intention or obligation to update or revise any forward-looking information, whether as a result of new information, future events or otherwise, other than as required by law.

info

SOURCE: Aurania Resources Ltd.

Tech Titans’ Mixed Earnings Signal Complex AI and Cloud Computing Landscape

Key Points:
– Meta leads tech earnings with strong revenue growth while Microsoft disappoints on cloud outlook
– Tesla’s future product roadmap overshadows current quarter miss
– Semiconductor stocks show strength on AI-driven demand, led by Lam Research

The first month of 2025 has delivered a complex picture of the tech industry’s health, as major players reported mixed earnings results that highlighted both the promises and challenges in artificial intelligence and cloud computing. Meta Platforms emerged as a clear winner, with shares surging 4.5% after exceeding fourth-quarter revenue expectations, despite cautioning about potential headwinds in the first quarter of 2025.

In contrast, Microsoft faced investor skepticism, with shares dropping 4.7% following lower-than-expected growth projections for its crucial cloud computing division. This disappointment came despite the company’s continued investment in AI technology through its partnership with OpenAI.

Tesla’s earnings presentation painted a picture of ambitious future plans overshadowing current performance challenges. The electric vehicle maker’s stock managed to stay positive, rising 0.5%, after announcing plans for new, more affordable vehicles in early 2026 and the upcoming launch of a paid autonomous driving service. These forward-looking announcements helped investors look past quarterly results that fell short of Wall Street’s expectations.

The semiconductor sector showed remarkable resilience, with Lam Research leading the charge. The chip equipment manufacturer’s shares jumped 5.2% after providing an optimistic revenue forecast for the third quarter, driven by strong demand from AI-focused customers. This positive sentiment spread throughout the sector, lifting shares of Broadcom and Marvell Technology by 5.8% and 3.8% respectively.

The earnings season has highlighted a clear divide between companies successfully monetizing AI innovations and those still trying to navigate the transition. Communication services emerged as the strongest performing sector, largely driven by Meta’s strong showing, while technology stocks faced pressure from Microsoft’s disappointing outlook.

Adding to the market narrative, Chinese AI startup DeepSeek’s rapid rise has introduced new competitive dynamics in the AI space, raising concerns about potential pricing pressures in the sector. This development has forced investors to reassess their expectations for established U.S. AI leaders.

As Apple and Intel prepare to report their results, investors remain focused on how these tech giants are adapting to the evolving landscape of AI integration and cloud computing services. The mixed earnings results suggest that while the tech sector continues to drive innovation, success increasingly depends on executing specific AI and cloud strategies rather than broader market momentum.

Release – 1-800-FLOWERS.COM, Inc. Reports Fiscal 2025 Second Quarter Results

Research News and Market Data on FLWS

Jan 30, 2025

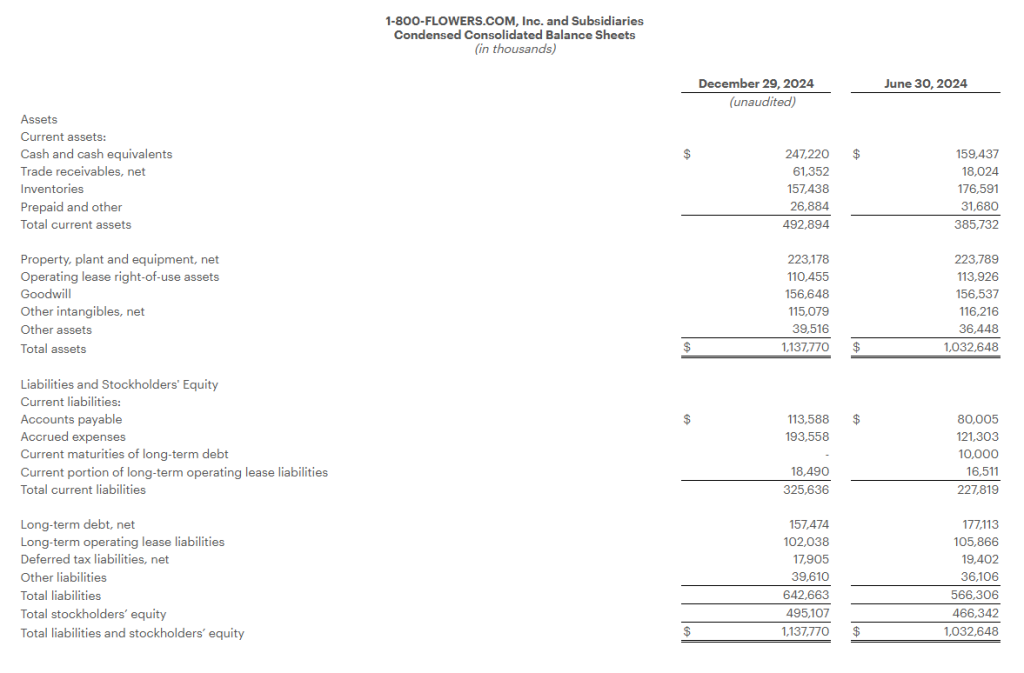
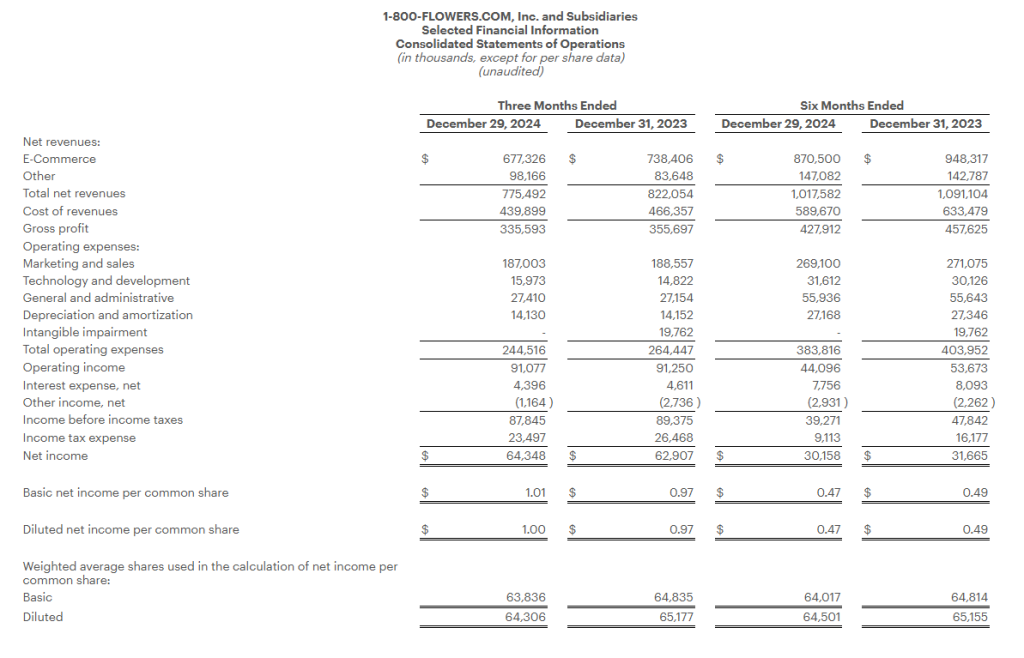
Generates Revenues of $775.5 million and Net Income of $64.3 million

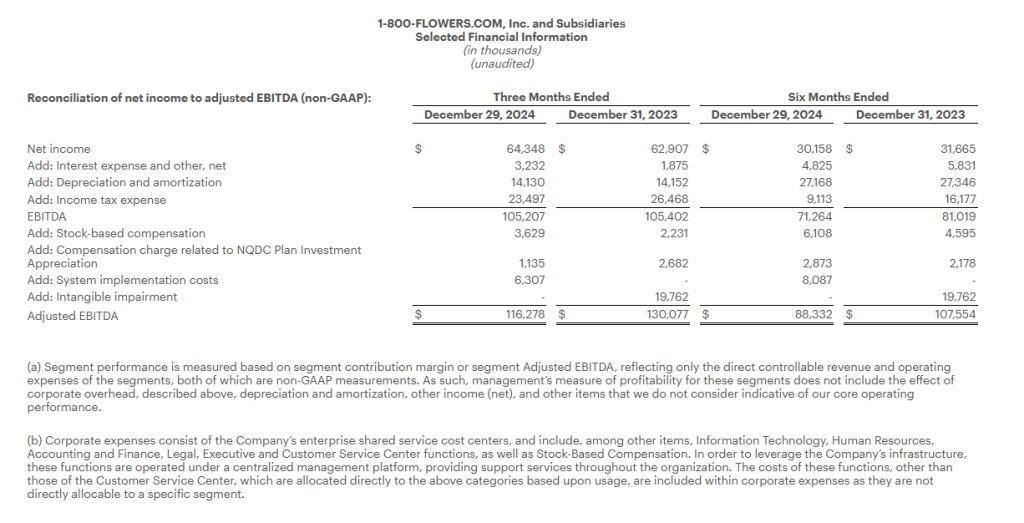
Reports Adjusted EBITDA(1) of $116.3 million

Updates Fiscal Year 2025 Outlook

(1) Refer to “Definitions of Non-GAAP Financial Measures” and the tables attached at the end of this press release for reconciliation of non-GAAP results to applicable GAAP results.

JERICHO, N.Y.–(BUSINESS WIRE)– 1-800-FLOWERS.COM, Inc. (NASDAQ: FLWS), a leading provider of gifts designed to help inspire customers to give more, connect more, and build more and better relationships, today reported results for its Fiscal 2025 second quarter ended December 29, 2024.

“Our second quarter revenue declined 5.7%, showing year-over-year improvement, but not at the pace that we had been anticipating,” said Jim McCann, Chairman and Chief Executive Officer of 1-800-FLOWERS.COM, Inc. “Our business experienced a softer than anticipated and highly promotional consumer environment, along with a pullback in corporate gifting orders, which were slightly offset by an improvement in our wholesale business. These trends were further exacerbated by issues with our new Harry & David order management system implementation.”

Mr. McCann continued, “Shifting patterns in consumer engagement have affected our performance. We are implementing actions to accelerate our Work Smarter efficiency initiatives that will in turn fund investments in our growth-oriented Relationship Innovation™ initiatives and marketing and sales strategies. As we focus on expanding our customer base, we see significant opportunities to leverage new technology to enhance engagement and build deeper relationships with our customers. We are confident that our dedicated team and innovative solutions will help us navigate these headwinds and emerge stronger.”

Fiscal 2025 Second Quarter Highlights

  • Total consolidated revenues decreased 5.7% to $775.5 million, as compared with the prior year period.
  • Gross profit margin of 43.3% was flat with the prior year period.
  • Operating expenses declined $19.9 million to $244.5 million, as compared with the prior year period. Excluding the impact of non-recurring charges in the current period associated with new systems implementation costs, impairment charges in the prior year period, as well as the impact of the Company’s non-qualified deferred compensation plan in both periods, operating expenses declined by $2.9 million to $239.1 million, as compared with the prior year period.
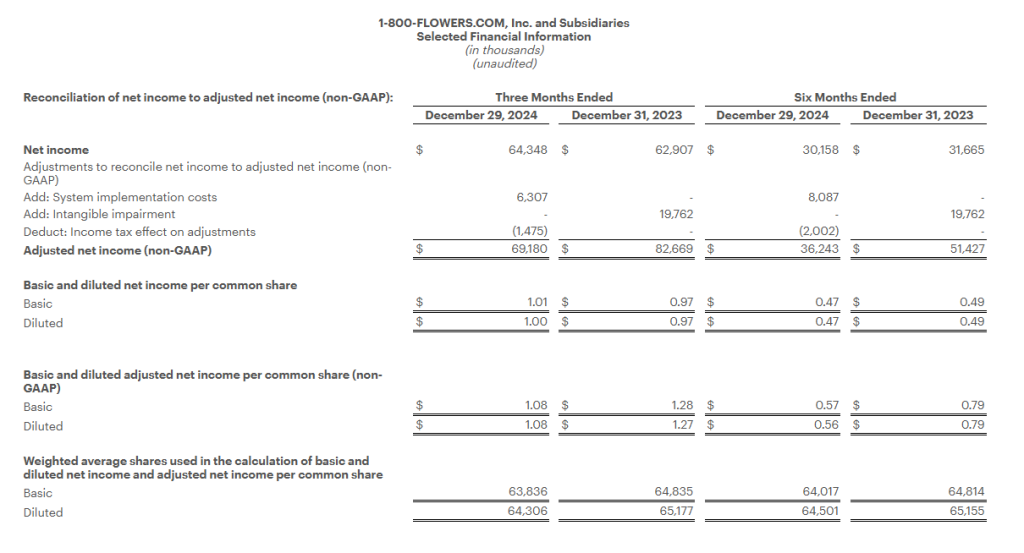
  • Net income for the quarter was $64.3 million, or $1.00 per diluted share, as compared with net income of $62.9 million, or $0.97 per diluted share in the prior year period.
  • Adjusted Net Income1 was $69.2 million, or $1.08 per diluted share, compared with an Adjusted Net Income1 of $82.7 million, or $1.27 per diluted share, in the prior year period.
  • Adjusted EBITDA1 for the quarter was $116.3 million, as compared with Adjusted EBITDA1 of $130.1 million in the prior year period.

Segment Results

The Company provides Fiscal 2025 second quarter financial results for its Gourmet Foods and Gift Baskets, Consumer Floral and Gifts, and BloomNet® segments in the tables attached to this release and as follows:

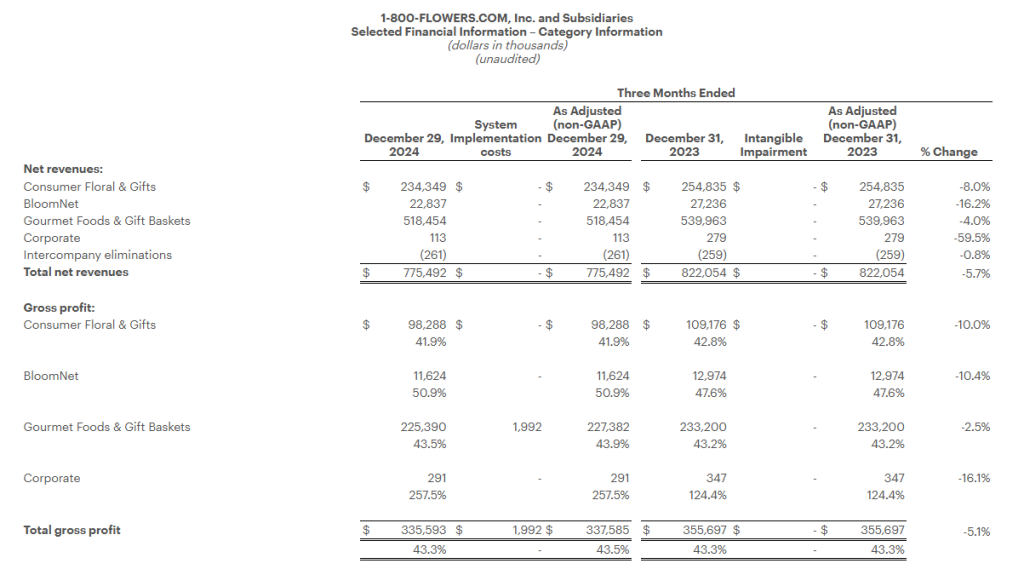
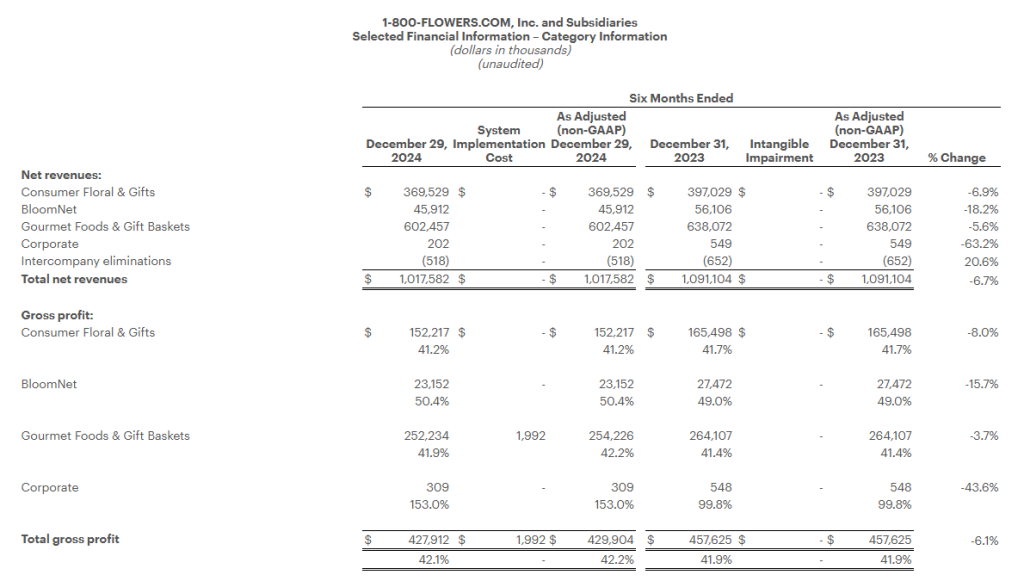
  • Gourmet Foods and Gift Baskets: Revenues for the quarter declined 4.0% to $518.5 million as compared with the prior year period. The Company estimates that the issues associated with the implementation of its new order management system resulted in lost revenue of approximately $20 million. Gross profit margin increased 30 basis points to 43.5%, benefiting from the Company’s inventory and labor optimization efforts that offset the incremental costs associated with the order management system issues. Excluding the impact of the systems implementation costs, adjusted segment contribution margin1 was $111.4 million, as compared with segment contribution margin1 of $118.2 million in the prior year period.
  • Consumer Floral & Gifts: Revenues for the quarter declined 8.0% to $234.3 million as compared with the prior year period. Gross profit margin decreased 90 basis points to 41.9%, primarily due to deleveraging on the sales decline and a promotional consumer environment. Segment contribution margin1 was $21.6 million, compared with adjusted segment contribution margin1 of $30.4 million in the prior year period, excluding the intangible impairment.
  • BloomNet: Revenues for the quarter declined 16.2% to $22.8 million as compared with the prior year period. Revenue and gross margin were impacted by the lower volume of lower margin orders processed by BloomNet. Gross profit margin increased 330 basis points to 50.9% due to lower florist rebates. Segment contribution margin1 was $7.5 million, compared with $9.1 million in the prior year period.

Company Guidance

Based on the Company’s performance during its fiscal second quarter, the Company is updating its Fiscal 2025 guidance as outlined below. The Company expects its revenue trends to improve as the fiscal year progresses, benefiting from its Relationship Innovation initiatives that have expanded the Company’s offerings, broadened price points and enhanced the user experience.

For Fiscal 2025, the company now expects:

  • total revenues to decline in the mid-single digits on a percentage basis, as compared with the prior year;
  • Adjusted EBITDA1 to be in a range of $65 million to $75 million; and
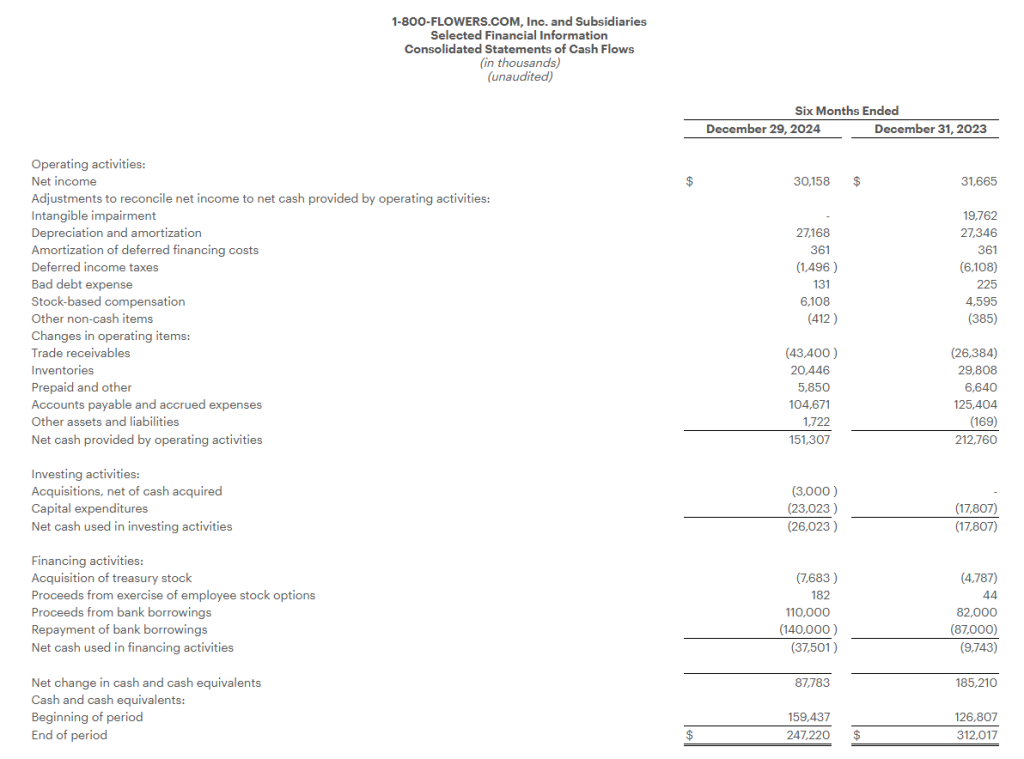
  • Free Cash Flow1 to be in a range of $25 million to $35 million.

Credit Agreement Amendment

The Company today announced that it has amended its credit agreement in order to provide more clarity and flexibility to the Company going forward.

Key changes effected by the amendment include revising the definition of Consolidated EBITDA, clarifying the application of optional term loan prepayments toward scheduled principal payments, and revising the definition of Consolidated Fixed Charges. Additional information can be found in the Company’s Form 8-K that was filed with the SEC this morning.

Conference Call

The Company will conduct a conference call to discuss the above details and attached financial results today, January 30, 2025, at 8:00 a.m. (ET). The conference call will be webcast from the Investors section of the Company’s website at www.1800flowersinc.com. A recording of the call will be posted on the Investors section of the Company’s website within two hours of the call’s completion. A telephonic replay of the call can be accessed beginning at 2:00 p.m. (ET) today through February 6, 2025, at: (US) 1-877-344-7529; (Canada) 855-669-9658; (International) 1-412-317-0088; enter conference ID #: 4981439.

Definitions of non-GAAP Financial Measures:

We sometimes use financial measures derived from consolidated financial information, but not presented in our financial statements prepared in accordance with U.S. generally accepted accounting principles (“GAAP”). Certain of these are considered “non-GAAP financial measures” under the U.S. Securities and Exchange Commission rules. Non-GAAP financial measures referred to in this document are either labeled as “non-GAAP” or designated as such with a “1”. See below for definitions and the reasons why we use these non-GAAP financial measures. Where applicable, see the Selected Financial Information below for reconciliations of these non-GAAP measures to their most directly comparable GAAP financial measures. Reconciliations for forward-looking figures would require unreasonable efforts at this time because of the uncertainty and variability of the nature and amount of certain components of various necessary GAAP components, including, for example, those related to compensation, tax items, amortization or others that may arise during the year, and the Company’s management believes such reconciliations would imply a degree of precision that would be confusing or misleading to investors. For the same reasons, the Company is unable to address the probable significance of the unavailable information. The lack of such reconciling information should be considered when assessing the impact of such disclosures.

EBITDA and Adjusted EBITDA:

We define EBITDA as net income (loss) before interest, taxes, depreciation, and amortization. Adjusted EBITDA is defined as EBITDA adjusted for the impact of stock-based compensation, Non-Qualified Deferred Compensation Plan (“NQDC”) Investment appreciation/depreciation, and for certain items affecting period-to-period comparability. See Selected Financial Information for details on how EBITDA and Adjusted EBITDA were calculated for each period presented. The Company presents EBITDA and Adjusted EBITDA because it considers such information meaningful supplemental measures of its performance and believes such information is frequently used by the investment community in the evaluation of similarly situated companies. The Company uses EBITDA and Adjusted EBITDA as factors to determine the total amount of incentive compensation available to be awarded to executive officers and other employees. The Company’s credit agreement uses EBITDA and Adjusted EBITDA to determine its interest rate and to measure compliance with certain covenants. EBITDA and Adjusted EBITDA are also used by the Company to evaluate and price potential acquisition candidates. EBITDA and Adjusted EBITDA have limitations as analytical tools and should not be considered in isolation or as a substitute for analysis of the Company’s results as reported under GAAP. Some of the limitations are: (a) EBITDA and Adjusted EBITDA do not reflect changes in, or cash requirements for, the Company’s working capital needs; (b) EBITDA and Adjusted EBITDA do not reflect the interest expense, or the cash requirements necessary to service interest or principal payments, on the Company’s debts; and (c) although depreciation and amortization are non-cash charges, the assets being depreciated and amortized may have to be replaced in the future and EBITDA does not reflect any cash requirements for such capital expenditures. EBITDA and Adjusted EBITDA should only be used on a supplemental basis combined with GAAP results when evaluating the Company’s performance.

Segment Contribution Margin and Adjusted Segment Contribution Margin

We define Segment Contribution Margin as earnings before interest, taxes, depreciation, and amortization, before the allocation of corporate overhead expenses. Adjusted Segment Contribution Margin is defined as Segment Contribution Margin adjusted for certain items affecting period-to-period comparability. See Selected Financial Information for details on how Segment Contribution Margin and Adjusted Segment Contribution Margin were calculated for each period presented. When viewed together with our GAAP results, we believe Segment Contribution Margin and Adjusted Segment Contribution Margin provide management and users of the financial statements meaningful information about the performance of our business segments. Segment Contribution Margin and Adjusted Segment Contribution Margin are used in addition to and in conjunction with results presented in accordance with GAAP and should not be relied upon to the exclusion of GAAP financial measures. The material limitation associated with the use of Segment Contribution Margin and Adjusted Segment Contribution Margin is that they are an incomplete measure of profitability as they do not include all operating expenses or non-operating income and expenses. Management compensates for this limitation when using these measures by looking at other GAAP measures, such as Operating Income and Net Income.

Adjusted Net Income (Loss) and Adjusted or Comparable Net Income (Loss) Per Common Share:

We define Adjusted Net Income (Loss) and Adjusted or Comparable Net Income (Loss) Per Common Share as Net Income (Loss) and Net Income (Loss) Per Common Share adjusted for certain items affecting period-to-period comparability. See Selected Financial Information below for details on how Adjusted Net Income (Loss) Per Common Share and Adjusted or Comparable Net Income (Loss) Per Common Share were calculated for each period presented. We believe that Adjusted Net Income (Loss) and Adjusted or Comparable Net Income (Loss) Per Common Share are meaningful measures because they increase the comparability of period-to-period results. Since these are not measures of performance calculated in accordance with GAAP, they should not be considered in isolation of, or as a substitute for, GAAP Net Income (Loss) and Net Income (Loss) Per Common Share, as indicators of operating performance and they may not be comparable to similarly titled measures employed by other companies.

Free Cash Flow:

We define Free Cash Flow as net cash provided by operating activities less capital expenditures. The Company considers Free Cash Flow to be a liquidity measure that provides useful information to management and investors about the amount of cash generated by the business after the purchases of fixed assets, which can then be used to, among other things, invest in the Company’s business, make strategic acquisitions, strengthen the balance sheet, and repurchase stock or retire debt. Free Cash Flow is a liquidity measure that is frequently used by the investment community in the evaluation of similarly situated companies. Since Free Cash Flow is not a measure of performance calculated in accordance with GAAP, it should not be considered in isolation or as a substitute for analysis of the Company’s results as reported under GAAP. A limitation of the utility of Free Cash Flow as a measure of financial performance is that it does not represent the total increase or decrease in the Company’s cash balance for the period.

About 1-800-FLOWERS.COM, Inc.

1-800-FLOWERS.COM, Inc. is a leading provider of gifts designed to help inspire customers to give more, connect more, and build more and better relationships. The Company’s e-commerce business platform features an all-star family of brands, including: 1-800-Flowers.com®, 1-800-Baskets.com®, CardIsle®, Cheryl’s Cookies®, Harry & David®, PersonalizationMall.com®, Shari’s Berries®, FruitBouquets.com®, Things Remembered®, Moose Munch®, The Popcorn Factory®, Wolferman’s Bakery®, Vital Choice®, Simply Chocolate® and Scharffen Berger®. Through the Celebrations Passport® loyalty program, which provides members with free standard shipping and no service charge on eligible products across our portfolio of brands, 1-800-FLOWERS.COM, Inc. strives to deepen relationships with customers. The Company also operates BloomNet®, an international floral and gift industry service provider offering a broad-range of products and services designed to help members grow their businesses profitably; Napco℠, a resource for floral gifts and seasonal décor; DesignPac Gifts, LLC, a manufacturer of gift baskets and towers; Alice’s Table®, a lifestyle business offering fully digital livestreaming and on demand floral, culinary and other experiences to guests across the country; and Card Isle®, an e-commerce greeting card service. 1-800-FLOWERS.COM, Inc. was recognized among America’s Most Trustworthy Companies by Newsweek for 2024. 1-800-FLOWERS.COM, Inc. was also recognized as one of America’s Most Admired Workplaces for 2025 by Newsweek and was named to the Fortune 1000 list in 2022. Shares in 1-800-FLOWERS.COM, Inc. are traded on the NASDAQ Global Select Market, ticker symbol: FLWS. For more information, visit 1800flowersinc.com.

FLWS–COMP
FLWS-FN

Special Note Regarding Forward Looking Statements:

This press release contains forward-looking statements within the meaning of the Private Securities Litigation Reform Act of 1995. These forward-looking statements represent the Company’s current expectations or beliefs concerning future events and can generally be identified using statements that include words such as “estimate,” “expects,” “project,” “believe,” “anticipate,” “intend,” “plan,” “foresee,” “forecast,” “likely,” “should,” “will,” “target” or similar words or phrases. These forward-looking statements are subject to risks, uncertainties, and other factors, many of which are outside of the Company’s control, which could cause actual results to differ materially from the results expressed or implied in the forward-looking statements, including, but not limited to, statements regarding the Company’s ability to achieve its guidance for the full Fiscal year; the Company’s ability to leverage its operating platform and reduce its operating expense ratio; its ability to successfully integrate acquired businesses and assets; its ability to successfully execute its strategic initiatives; its ability to cost effectively acquire and retain customers; the outcome of contingencies, including legal proceedings in the normal course of business; its ability to compete against existing and new competitors; its ability to manage expenses associated with sales and marketing and necessary general and administrative and technology investments; its ability to reduce promotional activities and achieve more efficient marketing programs; and general consumer sentiment and industry and economic conditions that may affect levels of discretionary customer purchases of the Company’s products. The Company undertakes no obligation to publicly update any of the forward-looking statements, whether because of new information, future events or otherwise, made in this release or in any of its SEC filings. Consequently, you should not consider any such list to be a complete set of all potential risks and uncertainties. For a more detailed description of these and other risk factors, refer to the Company’s SEC filings, including the Company’s Annual Reports on Form 10-K and its Quarterly Reports on Form 10-Q.

Note: The following tables are an integral part of this press release without which the information presented in this press release should be considered incomplete.

Investor Contact:

Andy Milevoj

amilevoj@1800flowers.com

Media Contact:

Cherie Gallarello

cgallarello@1800flowers.com

Source: 1-800-FLOWERS.COM, Inc.

Hemisphere Energy (HMENF) – Favorable 2025 Growth Outlook


Thursday, January 30, 2025

Mark Reichman, Managing Director, Equity Research Analyst, Natural Resources, Noble Capital Markets, Inc.

Hans Baldau, Research Associate, Noble Capital Markets, Inc.

Refer to the full report for the price target, fundamental analysis, and rating.

Updating estimates. We have increased our 2024 adjusted funds flow (AFF) and EPS estimates to C$45.4 million and $0.32, respectively, from C$43.5 million and $0.31 to reflect modestly higher operating earnings. AFF and EPS in the fourth quarter are estimated to be C$10.0 million and $0.06, respectively. We have also increased our 2025 AFF and EPS estimates to C$50.6 million and $0.37, respectively, from C$38.0 million and $0.27 to reflect higher average annual production of 3,900 boe/d compared to our prior estimate of 3,625 boe/d. Additionally, we increased our WTI crude oil price assumption to US$72.00 per barrel versus our prior estimate of US$70.00.


Get the Full Report

Equity Research is available at no cost to Registered users of Channelchek. Not a Member? Click ‘Join’ to join the Channelchek Community. There is no cost to register, and we never collect credit card information.

This Company Sponsored Research is provided by Noble Capital Markets, Inc., a FINRA and S.E.C. registered broker-dealer (B/D).

*Analyst certification and important disclosures included in the full report. NOTE: investment decisions should not be based upon the content of this research summary. Proper due diligence is required before making any investment decision. 

Release – Hemisphere Energy Provides Corporate Update, Declares Quarterly Dividend, and Announces 2025 Guidance

Research News and Market Data on HMENF

Vancouver, British Columbia–(Newsfile Corp. – January 29, 2025) – Hemisphere Energy Corporation (TSXV: HME) (OTCQX: HMENF) (“Hemisphere” or the “Company”) is pleased to provide a corporate update, announce the declaration of a quarterly dividend payment to shareholders, and deliver guidance for 2025.

Corporate Update

In 2024, Hemisphere achieved annual production growth of 10%, executed a $22 million capital expenditure program, and increased its positive year-end working capital position. The Company also returned over $0.22/share ($21.2 million) to shareholders in the form of dividends ($15.7 million) and share buybacks ($5.5 million), which represents an annualized 11.9% yield to shareholders based on Hemisphere’s market capitalization at December 31, 2024.

Hemisphere’s 2024 capital expenditure program grew production, added required infrastructure, and commenced testing a new resource play with an enhanced oil recovery (“EOR”) polymer pilot project. These investments were funded entirely by cash flow from the Company’s long-life reserve base and ultra-low production decline rates in the Atlee Buffalo oil assets, and have set up Hemisphere for continued growth in 2025.

Based on field estimates, production over the past two months (December 1, 2024 – January 27, 2025) has averaged approximately 3,800 boe/d (99% heavy oil) as new Atlee Buffalo wells were brought online through the fourth quarter of last year. With the addition of a new treater late in the quarter and upcoming injector conversions, these and other wells are expected to continue to be optimized during the first quarter of 2025 in Hemisphere’s flagship EOR polymer flood projects.

Balance sheet strength in 2024 allowed Hemisphere to invest in its pilot EOR project in the Marsden area of western Saskatchewan. The Company drilled 5 wells (3 production wells and 2 injection wells) and built facilities required to produce oil and inject polymer back into a known accumulation of oil that had been previously produced with vertical wells and abandoned, with the plans of rebuilding reservoir pressure and increasing the recovery factor of the oil-in-place from the pool. First injection commenced late in the third quarter of 2024 and Hemisphere is anticipating to see potential EOR response in mid-to-late 2025.

Quarterly Dividend

Hemisphere is pleased to announce that its Board of Directors has approved a quarterly cash dividend of $0.025 per common share in accordance with the Company’s dividend policy. The dividend will be paid on February 26, 2025 to shareholders of record as of the close of business on February 12, 2025. The dividend is designated as an eligible dividend for income tax purposes.

2025 Corporate Guidance

Hemisphere’s Board of Directors has approved a 2025 capital expenditure program of approximately $17 million, which is planned to be entirely funded by Hemisphere’s estimated 2025 adjusted funds flow1 (“AFF”) of $51 million and is anticipated to provide 15% annual production growth. The majority of capital will be allocated to drilling, optimization, and facility work, with approximately 10% allotted to exploration and land acquisition. Most of the planned capital expenditures are scheduled for the third quarter of 2025, providing Hemisphere with the flexibility to adjust plans subject to the commodity price environment.

After capital expenditures and asset retirement obligations (“ARO”), 2025 free funds flow1 (“FFF”) is estimated to be $34 million, of which approximately 30% is budgeted to be paid in quarterly base dividends as shown in the table below. The balance of cash will be used for discretionary purposes, which may include potential acceleration of other development or exploration projects, acquisitions, and additional return of capital to shareholders through Hemisphere’s normal course issuer bid (“NCIB”) program and/or special dividends. In 2024, two special dividends totaling $0.06/share ($5.7 million) were paid to shareholders in addition to Hemisphere’s base quarterly dividends of $0.10/share ($10 million), and share buybacks amounted to $0.06/share ($5.5 million), bringing total shareholder returns to $0.22/share ($21.2 million).

Management believes that the 2025 development plan provides stable production growth and consistent shareholder returns, with significant flexibility built in to allow for necessary adjustments based on changing political and commodity environments.

Highlights and assumptions of Hemisphere’s guidance at US$75/bbl WTI are as follows:

  • Average annual production of 3,900 boe/d (99% heavy oil), a 15% increase as compared to 2024
  • Average WTI price of US$75/bbl, with sensitivities shown at US$65/bbl and US$85/bbl
  • WCS differential of US$14.00/bbl and quality adjustment of $7.00/bbl
  • CAD/US FX of 1.43
  • Operating and transportation costs of $15.25/boe
  • Royalties and GORRs on gross revenue of 21% at US$75/bbl WTI, 19% at US$65/bbl WTI, and 23% at US$85/bbl WTI
  • Net G&A of $3.66/boe
  • Tax Costs of $8.10/boe at US$75/bbl WTI, $5.64/boe at US$65/bbl WTI, and $10.37/boe at US$85/bbl WTI

Notes:
(1) AFF, Capital Expenditures, and FFF (including per share amounts) are non-IFRS financial measures that are forward looking and do not have any standardized meaning under IFRS and therefore may not be comparable to similar measures presented by other entities. AFF per basic share and FFF per basic share are non-IFRS financial ratios that are forward looking and do not have any standardized meaning under IFRS and therefore may not be comparable to similar ratios presented by other entities and include non-IFRS financial measure components of AFF and FFF. See “Non-IFRS Measures“.
(2) See assumptions noted above within “2025 Corporate Guidance”.
(3) Using a 2025 weighted average of 97.4 million basic shares issued and outstanding.
(4) The amounts above do not include potential future purchases through the Company’s NCIB program or other discretionary uses of available funds.

About Hemisphere Energy Corporation

Hemisphere is a dividend-paying Canadian oil company focused on maximizing value-per-share growth with the sustainable development of its high netback, ultra-low decline conventional heavy oil assets through polymer flood enhanced recovery methods. Hemisphere trades on the TSX Venture Exchange as a Tier 1 issuer under the symbol “HME” and on the OTCQX Venture Marketplace under the symbol “HMENF”.

For further information, please visit the Company’s website at www.hemisphereenergy.ca to view its corporate presentation or contact:

Don Simmons, President & Chief Executive Officer
Telephone: (604) 685-9255
Email: info@hemisphereenergy.ca

Website: www.hemisphereenergy.ca

Forward-looking Statements

Certain statements included in this news release constitute forward-looking statements or forward-looking information (collectively, “forward-looking statements”) within the meaning of applicable securities legislation. Forward-looking statements are typically identified by words such as anticipate, continue, estimate, expect, forecast, may, will, project, could, plan, intend, should, believe, outlook, potential, target, and similar words suggesting future events or future performance. In particular, but without limiting the generality of the foregoing, this news release includes forward-looking statements regarding the record date and payment date for Hemisphere’s quarterly dividend; expectations for the continued optimization of certain wells during the first quarter of 2025 in Hemisphere’s flagship EOR polymer flood projects; expectations on timing for potential EOR responses for activities in the Marsden area of western Saskatchewan; that Hemisphere’s 2025 capital budget is planned to be entirely funded by Hemisphere’s estimated 2025 AFF and is anticipated to provide 15% annual production growth, including that the majority of capital will be allocated to drilling, optimization, and facility work, with approximately 10% allotted to exploration and land acquisition, as well as expectations for the timing of such expenditures; Hemisphere’s anticipation that approximately 30% of estimated $34 million in free funds flow will be paid in quarterly dividends with the balance of cash being used for discretionary purposes; the expected manner in which the Company’s 2025 capital budget will be spent, including the timing of such expenditures and any discretionary amounts, which may include potential acceleration of other development or exploration projects, acquisitions, and return of capital to shareholders through Hemisphere’s NCIB program and/or dividends, and the anticipated effects thereof, including as set forth under “2025 Corporate Guidance” and the Company’s dividend policy and the other matters and guidance set forth under “2025 Corporate Guidance”; and management’s belief that the 2025 development plan provides stable production growth and consistent shareholder returns, with significant flexibility built in to allow for necessary adjustments based on changing political and commodity environments.

Forward‐looking statements are based on a number of material factors, expectations or assumptions of Hemisphere which have been used to develop such statements and information, but which may prove to be incorrect. Although Hemisphere believes that the expectations reflected in such forward‐looking statements or information are reasonable, undue reliance should not be placed on forward‐looking statements because Hemisphere can give no assurance that such expectations will prove to be correct. In addition to other factors and assumptions which may be identified herein (including the assumptions noted in respect of “2025 Corporate Guidance”), assumptions have been made regarding, among other things: the current and go-forward oil price environment; that Hemisphere will continue to conduct its operations in a manner consistent with past operations; continued trade-agreements remain in place and no trade related disputes will develop, including tariffs on Canadian energy production to the United States will be applicable, that results from drilling and development activities are consistent with past operations; the quality of the reservoirs in which Hemisphere operates and continued performance from existing wells; the continued and timely development of infrastructure in areas of new production; inflationary pressure and related costs; that the Company’s dividend policy will remain the same and the Company will continue to be able to declare dividends; the accuracy of the estimates of Hemisphere’s reserve volumes; certain commodity price and other cost assumptions; continued availability of debt and equity financing and cash flow to fund Hemisphere’s current and future plans and expenditures; the impact of increasing competition; the general stability of the economic and political environment in which Hemisphere operates; the general continuance of current industry conditions; the timely receipt of any required regulatory approvals; the ability of Hemisphere to obtain qualified staff, equipment and services in a timely and cost efficient manner; drilling results; the ability of the operator of the projects in which Hemisphere has an interest in to operate the field in a safe, efficient and effective manner; the ability of Hemisphere to obtain financing on acceptable terms; field production rates and decline rates; the accuracy of the Company’s reservoir modelling; the ability to replace and expand oil and natural gas reserves through acquisition, development and exploration; the timing and cost of pipeline, storage and facility construction and expansion and the ability of Hemisphere to secure adequate product transportation; future commodity prices; currency, exchange and interest rates; regulatory framework regarding royalties, taxes and environmental matters in the jurisdictions in which Hemisphere operates; and the ability of Hemisphere to successfully market its oil and natural gas products.

The forward‐looking statements included in this news release are not guarantees of future performance and should not be unduly relied upon. Such information and statements, including the assumptions made in respect thereof, involve known and unknown risks, uncertainties and other factors that may cause actual results or events to defer materially from those anticipated in such forward‐looking statements including, without limitation: changes in commodity prices; regulatory risks, including penalties or other remedial actions, the ability of the Company to maintain legal title to its properties; changes in the demand for or supply of Hemisphere’s products, the early stage of development of some of the evaluated areas and zones; unanticipated operating results or production declines; results of Hemisphere’s waterflood operations; the ability of Hemisphere to, pending future events, return capital to shareholders as a result of any required third party approvals; changes in budgets; changes in tax or environmental laws, royalty rates or other regulatory matters; changes in development plans of Hemisphere or by third party operators of Hemisphere’s properties, increased debt levels or debt service requirements; inaccurate estimation of Hemisphere’s oil and gas reserve volumes; limited, unfavourable or a lack of access to capital markets; increased costs; a lack of adequate insurance coverage; the impact of competitors; and certain other risks detailed from time‐to‐time in Hemisphere’s public disclosure documents, (including, without limitation, those risks identified in this news release and in Hemisphere’s most recent Annual Information Form).

The forward‐looking statements contained in this news release speak only as of the date of this news release, and Hemisphere does not assume any obligation to publicly update or revise any of the included forward‐looking statements, whether as a result of new information, future events or otherwise, except as may be required by applicable securities laws.

Forward Looking Financial Information

This news release may contain future oriented financial information (“FOFI”) within the meaning of applicable securities laws, including with respect to the Company’s anticipated 2025 Free Funds Flow, Capital Expenditures and Adjusted Funds Flow (including where applicable per share amounts). The FOFI has been prepared by management to provide an outlook of the Company’s activities and results. The FOFI has been prepared based on a number of assumptions including the assumptions discussed and disclosed above, including in relation to “2025 Corporate Guidance” above and “Forward Looking Statements” above and that the Company is cash taxable in 2025. Readers are cautioned that the assumptions used in the preparation of such information, although considered reasonable at the time of preparation, may prove to be imprecise and, as such, undue reliance should not be placed on FOFI. The Company’s actual results, performance or achievement could differ materially from those expressed in, or implied by, these FOFI, or if any of them do so, what benefits the Company will derive therefrom. The Company has included the FOFI in order to provide readers with a more complete perspective on the Company’s future operations and such information may not be appropriate for other purposes. The Company disclaims any intention or obligation to update or revise any FOFI statements, whether as a result of new information, future events or otherwise, except as required by law.

Non-IFRS and Other Measures

This news release contains terms that are non-IFRS measures or ratios that are forward looking and commonly used in the oil and gas industry which are not defined by or calculated in accordance with International Financial Reporting Standards (“IFRS”), such as: (i) adjusted funds flow (ii) adjusted funds flow per basic share; (iii) capital expenditures; (iv) free funds flow; and (v) free funds flow per basic share. These terms should not be considered an alternative to, or more meaningful than the comparable IFRS measures (as determined in accordance with IFRS) which in the case of funds flow is cash provided by operating activities, in the case of adjusted funds flow (and adjusted funds flow per share) is cash provided by operating activities and in the case of capital expenditures is cash flow used in investing activities. There is no IFRS measure that is reasonably comparable to free funds flow. These measures are commonly used in the oil and gas industry and by Hemisphere to provide shareholders and potential investors with additional information regarding: (i) in the case of adjusted funds flow and free funds flow, the Company’s ability to generate the funds necessary to support future growth through capital investment and to repay any debt.

Hemisphere’s determination of these measures may not be comparable to that reported by other companies. Adjusted funds flow is calculated as cash generated by operating activities, before changes in non-cash working capital and adjusted for any decommissioning expenditures; Adjusted funds flow per share is calculated using the outstanding basic shares of the company as footnoted in the 2024 Corporate Guidance table; Free Funds Flow is calculated as Adjusted Funds Flow less capital expenditures; and Free funds flow per share is calculated using the outstanding basic shares of the company as footnoted in the 2025 Corporate Guidance table. The Company has provided additional information on how these measures are calculated, including a reconciliation of such measures to their comparable IFRS measure, in the Management’s Discussion and Analysis for the year ended December 31, 2023 and the interim period ended September 30, 2024, which are available under the Company’s SEDAR+ profile at www.sedarplus.ca.

In respect of any forward-looking non-IFRS measures, there is no significant difference between the non-GAAP financial measure that are forward-looking information and the equivalent historical non-GAAP financial measures.

In this news release, Hemisphere uses the term market capitalization at year-end. Hemisphere’s market capitalization was $178.2 million based on 97,389,735 shares outstanding and the Company’s closing price of $1.83 per share on December 31, 2024.

All amounts are expressed in Canadian dollars unless otherwise noted.

Oil and Gas Advisories

Any references in this news release to recent production rates (including as a result of recent waterflood activities) which may be considered to be initial rates and are useful in confirming the presence of hydrocarbons; however, such rates are not determinative of the rates at which such wells will continue production and decline thereafter and are not necessarily indicative of long-term performance or ultimate recovery. While encouraging, readers are cautioned not to place reliance on such rates in calculating the aggregate production for the Company. Such rates are based on field estimates and may be based on limited data available at this time.

A barrel of oil equivalent (“boe”) may be misleading, particularly if used in isolation. A boe conversion ratio of 6 Mcf:1 Bbl is based on an energy equivalency conversion method primarily applicable at the burner tip and does not represent a value equivalency at the wellhead. In addition, given that the value ratio based on the current price of crude oil as compared to natural gas is significantly different from the energy equivalency of 6:1, utilizing a conversion on a 6:1 basis may be misleading as an indication of value.

Definitions and Abbreviations

bblBarrelWTIWest Texas Intermediate
bbl/dbarrels per dayWCSWestern Canadian Select
$/bbldollar per barrelUS$United States Dollar
boebarrel of oil equivalent
boe/dbarrel of oil equivalent per dayIFRSInternational Financial Reporting Standards
$/boedollar per barrel of oil equivalentG&AGeneral and Administrative Costs

Neither the TSX Venture Exchange nor its Regulation Services Provider (as that term is defined in the policies of the TSX Venture Exchange) accepts responsibility for the adequacy or accuracy of this news release.info

SOURCE: Hemisphere Energy Corporation