
Research News and Market Data on SLQT09/13/2024
Fourth Quarter of Fiscal Year 2024 – Consolidated Earnings Highlights
- Revenue of $307.2 million
- Net loss of $31.0 million
- Adjusted EBITDA* of $14.4 million
Fiscal Year 2025 Guidance Ranges:
- Revenue expected in a range of $1.4 billion to $1.5 billion
- Net loss expected in a range of $42 million to $6 million
- Adjusted EBITDA* expected in a range of $90 million to $120 million
Fourth Quarter Fiscal Year 2024 – Segment Highlights
Senior
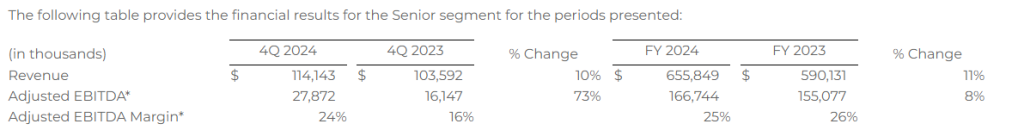
- Revenue of $114.1 million
- Adjusted EBITDA* of $27.9 million
- Approved Medicare Advantage policies of 107,272
Healthcare Services
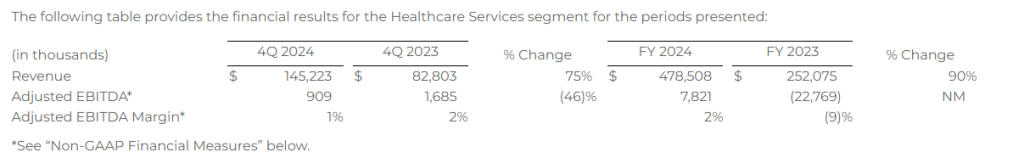
- Revenue of $145.2 million
- Adjusted EBITDA* of $0.9 million
- Approximately 82,000 SelectRx members
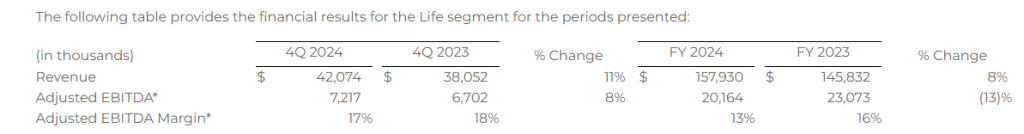
Life
- Revenue of $42.1 million
- Adjusted EBITDA* of $7.2 million
Auto & Home
- Revenue of $7.6 million
- Adjusted EBITDA* of $2.5 million
OVERLAND PARK, Kan.–(BUSINESS WIRE)– SelectQuote, Inc. (NYSE: SLQT) reported consolidated revenue for the fourth quarter of fiscal year 2024 of $307.2 million compared to consolidated revenue for the fourth quarter of fiscal year 2023 of $221.8 million. Consolidated net loss for the fourth quarter of fiscal year 2024 was $31.0 million compared to consolidated net loss for the fourth quarter of fiscal year 2023 of $47.8 million. Finally, consolidated Adjusted EBITDA* for the fourth quarter of fiscal year 2024 was $14.4 million compared to consolidated Adjusted EBITDA* for the fourth quarter of fiscal year 2023 of $(5.8) million.
Consolidated revenue for the fiscal year ended June 30, 2024, was $1.3 billion compared to consolidated revenue for the fiscal year ended June 30, 2023, of $1.0 billion. Consolidated net loss for the fiscal year ended June 30, 2024, was $34.1 million compared to consolidated net loss for the fiscal year ended June 30, 2023, of $58.5 million. Finally, consolidated Adjusted EBITDA* for the fiscal year ended June 30, 2024, was $117.0 million compared to consolidated Adjusted EBITDA* of $74.3 million for the fiscal year ended June 30, 2023.
SelectQuote Chief Executive Officer, Tim Danker, commented, “2024 was another successful and strong year for SelectQuote across both Senior Medicare Advantage distribution and our Healthcare Services business, driven by SelectRx. On a consolidated basis our fiscal year revenue and Adjusted EBITDA outperformed the midpoint of our original forecast by 17% and 26%, respectively. This marks the 10th consecutive quarter of outperformance versus our internal expectations, reaffirming our strategy to prioritize profitability and cash efficiency over volume growth. Revenue growth was driven primarily by 68% growth in SelectRx members and increasing utilization. Our profitability was driven by another strong year of execution in Senior, which achieved a 25% Adjusted EBITDA margin, similar to a very strong fiscal 2023. Additionally, our Healthcare Services segment achieved its 5th straight quarter of profitability ending the year with Adjusted EBITDA of $7.8 million, which compares to an Adjusted EBITDA loss of $22.8 million in fiscal 2023. Lastly, SelectQuote has signed a non-binding letter of intent to complete an initial commissions receivable securitization of approximately $100 million with certain of our term lenders. Provided this deal closes in the coming weeks, we believe this will be an important first step in our strategic imperative to optimizing our balance sheet capacity, lowering our funding costs, and extending our debt maturities.”
Mr. Danker continued, “SelectQuote’s unique healthcare information platform remains best positioned as a value creation conduit, efficiently connecting a large and growing population of Americans in need of coverage and care with the best providers, based on each of their distinct personal needs.”
Segment Results
We currently report on four segments: 1) Senior, 2) Healthcare Services, 3) Life, and 4) Auto & Home. The performance measures of the segments include total revenue and Adjusted EBITDA*. Costs of commissions and other services revenue, cost of goods sold-pharmacy revenue, marketing and advertising, selling, general, and administrative, and technical development operating expenses that are directly attributable to a segment are reported within the applicable segment. Indirect costs of revenue, marketing and advertising, selling, general, and administrative, and technical development operating expenses are allocated to each segment based on varying metrics such as headcount. Adjusted EBITDA is our segment profit measure to evaluate the operating performance of our business. We define Adjusted EBITDA as net loss plus: (i) interest expense, net; (ii) benefit for income taxes; (iii) depreciation and amortization; (iv) share-based compensation; (v) goodwill, long-lived asset, and intangible assets impairments; (vi) transaction costs; (vii) loss on disposal of property, equipment and software, net; and (viii) other non-recurring expenses and income. Adjusted EBITDA Margin is calculated as Adjusted EBITDA divided by revenue.
Senior
Financial Results
Operating Metrics
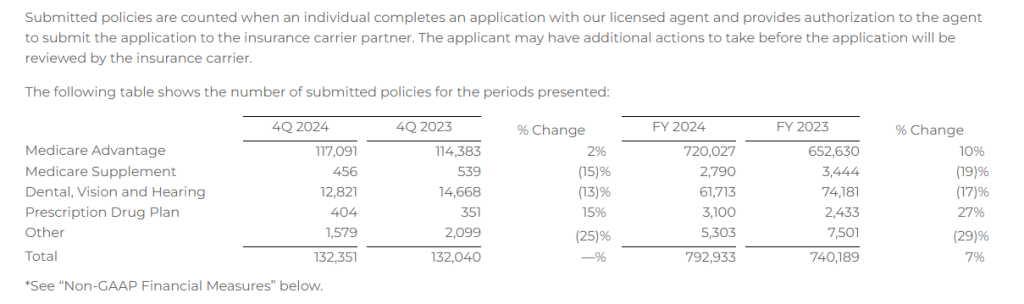
Submitted Policies
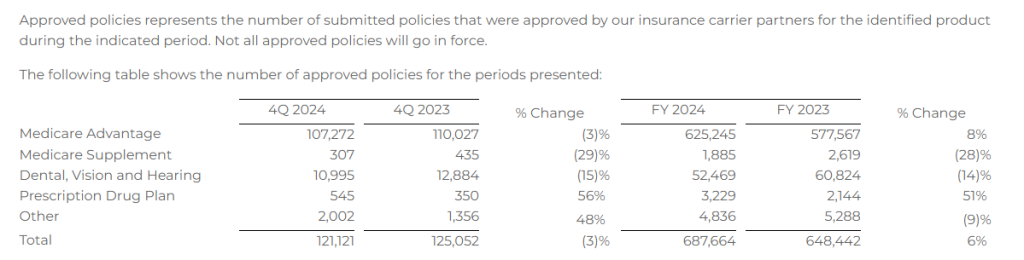
Approved Policies
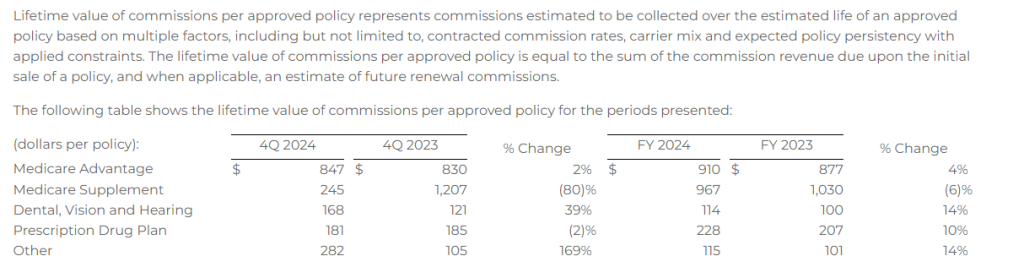
Lifetime Value of Commissions per Approved Policy
Healthcare Services
Financial Results
Operating Metrics
Members

Combined Senior and Healthcare Services – Consumer Per Unit Economics
The opportunity to leverage our existing database and distribution model to improve access to healthcare services for our consumers has created a need for us to review our key metrics related to our per unit economics. As we think about the revenue and expenses for Healthcare Services, we note that they are derived from the marketing acquisition costs associated with the sale of an MA or MS policy, some of which costs are allocated directly to Healthcare Services, and therefore determined that our per unit economics measure should include components from both Senior and Healthcare Services. See details of revenue and expense items included in the calculation below.
Combined Senior and Healthcare Services consumer per unit economics represents total MA and MS commissions; other product commissions; other revenues, including revenues from Healthcare Services; and operating expenses associated with Senior and Healthcare Services, each shown per number of approved MA and MS policies over a given time period. Management assesses the business on a per-unit basis to help ensure that the revenue opportunity associated with a successful policy sale is attractive relative to the marketing acquisition cost. Because not all acquired leads result in a successful policy sale, all per-policy metrics are based on approved policies, which is the measure that triggers revenue recognition.
The MA and MS commission per MA/MS policy represents the LTV for policies sold in the period. Other commission per MA/MS policy represents the LTV for other products sold in the period, including DVH prescription drug plan, and other products, which management views as additional commission revenue on our agents’ core function of MA/MS policy sales. Pharmacy revenue per MA/MS policy represents revenue from SelectRx, and other revenue per MA/MS policy represents revenue from Population Health, production bonuses, marketing development funds, lead generation revenue, and adjustments from the Company’s reassessment of its cohorts’ transaction prices. Total operating expenses per MA/MS policy represents all of the operating expenses within Senior and Healthcare Services. The revenue to customer acquisition cost (“CAC”) multiple represents total revenue as a multiple of total marketing acquisition cost, which represents the direct costs of acquiring leads. These costs are included in marketing and advertising expense within the total operating expenses per MA/MS policy.
The following table shows combined Senior and Healthcare Services consumer per unit economics for the periods presented. Based on the seasonality of Senior and the fluctuations between quarters, we believe that the most relevant view of per unit economics is on a rolling 12-month basis. All per MA/MS policy metrics below are based on the sum of approved MA/MS policies, as both products have similar commission profiles.
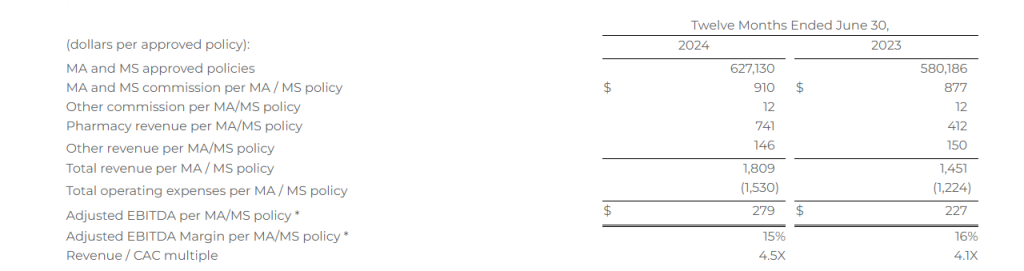
Total revenue per MA/MS policy increased 25% for the twelve months ended June 30, 2024, compared to the twelve months ended June 30, 2023, primarily due to the increase in pharmacy revenue. Total operating expenses per MA/MS policy increased 25% for the twelve months ended June 30, 2024, compared to the twelve months ended June 30, 2023, driven by an increase in cost of goods sold-pharmacy revenue for Healthcare Services due to the growth of the business, offset by a decrease in our marketing and advertising costs.
Life
Financial Results
The following table provides the financial results for the Life segment for the periods presented:
Operating Metrics
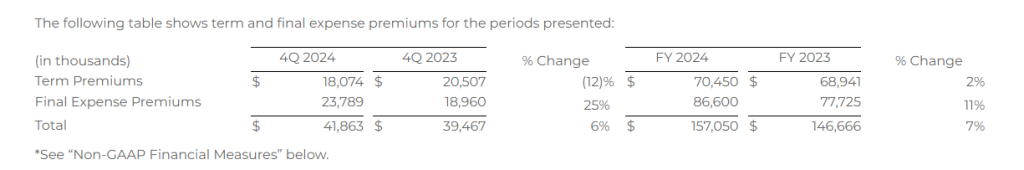
Life premium represents the total premium value for all policies that were approved by the relevant insurance carrier partner and for which the policy document was sent to the policyholder and payment information was received by the relevant insurance carrier partner during the indicated period. Because our commissions are earned based on a percentage of total premium, total premium volume for a given period is the key driver of revenue for our Life segment.
Auto & Home
Financial Results
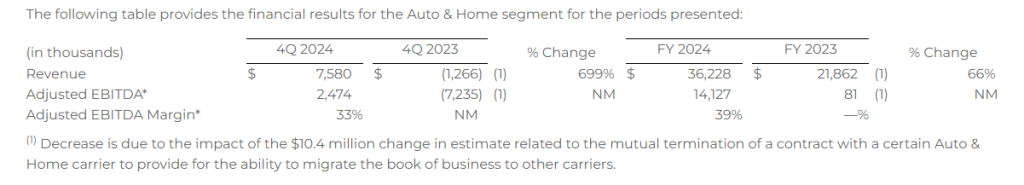
Operating Metrics
Auto & Home premium represents the total premium value of all new policies that were approved by our insurance carrier partners during the indicated period. Because our commissions are earned based on a percentage of total premium, total premium volume for a given period is the key driver of revenue for our Auto & Home segment.

Earnings Conference Call
SelectQuote, Inc. will host a conference call with the investment community on September 13, 2024, beginning at 8:30 a.m. ET. To register for this conference call, please use this link: https://www.netroadshow.com/events/login?show=7297aa9f&confId=70516 . After registering, a confirmation will be sent via email, including dial-in details and unique conference call codes for entry. Registration is open through the live call, but to ensure you are connected for the full call we suggest registering at least 10 minutes before the start of the call. The event will also be webcasted live via our investor relations website https://ir.selectquote.com/investor-home/default.aspx .
Non-GAAP Financial Measures
This release includes certain non-GAAP financial measures intended to supplement, not substitute for, comparable GAAP measures. To supplement our financial statements presented in accordance with GAAP and to provide investors with additional information regarding our GAAP financial results, we have presented in this release Adjusted EBITDA and Adjusted EBITDA Margin, which are non-GAAP financial measures. These non-GAAP financial measures are not based on any standardized methodology prescribed by GAAP and are not necessarily comparable to similarly titled measures presented by other companies. We define Adjusted EBITDA as net income (loss) before interest expense, income tax expense (benefit), depreciation and amortization, and certain add-backs for non-cash or non-recurring expenses, including restructuring and share-based compensation expenses. The most directly comparable GAAP measure is net income (loss). We define Adjusted EBITDA Margin as Adjusted EBITDA divided by revenue. The most directly comparable GAAP measure is net income margin. We monitor and have presented in this release Adjusted EBITDA and Adjusted EBITDA Margin because they are key measures used by our management and Board of Directors to understand and evaluate our operating performance, to establish budgets, and to develop operational goals for managing our business. In particular, we believe that excluding the impact of these expenses in calculating Adjusted EBITDA can provide a useful measure for period-to-period comparisons of our core operating performance. We believe that these non-GAAP financial measures help identify underlying trends in our business that could otherwise be masked by the effect of the expenses that we exclude in the calculations of these non-GAAP financial measures. Accordingly, we believe that these financial measures provide useful information to investors and others in understanding and evaluating our operating results, enhancing the overall understanding of our past performance and future prospects. Reconciliations of net income (loss) to Adjusted EBITDA are presented below beginning on page 13.
Forward Looking Statements
This release contains forward-looking statements. These forward-looking statements reflect our current views with respect to, among other things, future events and our financial performance. These statements are often, but not always, made through the use of words or phrases such as “may,” “should,” “could,” “predict,” “potential,” “believe,” “will likely result,” “expect,” “continue,” “will,” “anticipate,” “seek,” “estimate,” “intend,” “plan,” “projection,” “would” and “outlook,” or the negative version of those words or other comparable words or phrases of a future or forward-looking nature. These forward-looking statements are not historical facts, and are based on current expectations, estimates and projections about our industry, management’s beliefs and certain assumptions made by management, many of which, by their nature, are inherently uncertain and beyond our control. Accordingly, we caution you that any such forward-looking statements are not guarantees of future performance and are subject to risks, assumptions and uncertainties that are difficult to predict. Although we believe that the expectations reflected in these forward-looking statements are reasonable as of the date made, actual results may prove to be materially different from the results expressed or implied by the forward-looking statements.
There are or will be important factors that could cause our actual results to differ materially from those indicated in these forward-looking statements, including, but not limited to, the following: impacts of the COVID-19 pandemic and any other significant public health events; our reliance on a limited number of insurance carrier partners and any potential termination of those relationships or failure to develop new relationships; existing and future laws and regulations affecting the health insurance market; changes in health insurance products offered by our insurance carrier partners and the health insurance market generally; insurance carriers offering products and services directly to consumers; changes to commissions paid by insurance carriers and underwriting practices; competition with brokers, exclusively online brokers and carriers who opt to sell policies directly to consumers; competition from government-run health insurance exchanges; developments in the U.S. health insurance system; our dependence on revenue from carriers in our senior segment and downturns in the senior health as well as life, automotive and home insurance industries; our ability to develop new offerings and penetrate new vertical markets; risks from third-party products; failure to enroll individuals during the Medicare annual enrollment period; our ability to attract, integrate and retain qualified personnel; our dependence on lead providers and ability to compete for leads; failure to obtain and/or convert sales leads to actual sales of insurance policies; access to data from consumers and insurance carriers; accuracy of information provided from and to consumers during the insurance shopping process; cost-effective advertisement through internet search engines; ability to contact consumers and market products by telephone; global economic conditions, including inflation; disruption to operations as a result of future acquisitions; significant estimates and assumptions in the preparation of our financial statements; impairment of goodwill; our ability to regain and maintain compliance with NYSE listing standards; potential litigation and other legal proceedings or inquiries; our existing and future indebtedness; our ability to maintain compliance with our debt covenants; access to additional capital; failure to protect our intellectual property and our brand; fluctuations in our financial results caused by seasonality; accuracy and timeliness of commissions reports from insurance carriers; timing of insurance carriers’ approval and payment practices; factors that impact our estimate of the constrained lifetime value of commissions per policyholder; changes in accounting rules, tax legislation and other legislation; disruptions or failures of our technological infrastructure and platform; failure to maintain relationships with third-party service providers; cybersecurity breaches or other attacks involving our systems or those of our insurance carrier partners or third-party service providers; our ability to protect consumer information and other data; failure to market and sell Medicare plans effectively or in compliance with laws; and other factors related to our pharmacy business, including manufacturing or supply chain disruptions, access to and demand for prescription drugs, and regulatory changes or other industry developments that may affect our pharmacy operations. For a further discussion of these and other risk factors that could impact our future results and performance, see the section entitled “Risk Factors” in the most recent Annual Report on Form 10-K (the “Annual Report”) and subsequent periodic reports filed by us with the Securities and Exchange Commission. Accordingly, you should not place undue reliance on any such forward-looking statements. Any forward-looking statement speaks only as of the date on which it is made, and, except as otherwise required by law, we do not undertake any obligation to publicly update or review any forward-looking statement, whether as a result of new information, future developments or otherwise.
About SelectQuote:
Founded in 1985, SelectQuote (NYSE: SLQT) provides solutions that help consumers protect their most valuable assets: their families, health, and property. The company pioneered the model of providing unbiased comparisons from multiple, highly-rated insurance companies allowing consumers to choose the policy and terms that best meet their unique needs. Two foundational pillars underpin SelectQuote’s success: a strong force of highly-trained and skilled agents who provide a consultative needs analysis for every consumer, and proprietary technology that sources and routes high-quality leads.
With an ecosystem offering high touchpoints for consumers across Insurance, Medicare, Pharmacy, and Value-Based Care, the company now has four core business lines: SelectQuote Senior, SelectQuote Healthcare Services, SelectQuote Life, and SelectQuote Auto and Home. SelectQuote Senior serves the needs of a demographic that sees around 10,000 people turn 65 each day with a range of Medicare Advantage and Medicare Supplement plans. SelectQuote Healthcare Services is comprised of the SelectRx Pharmacy, a specialized medication management pharmacy, and Population Health which proactively connects its members with best-in-class healthcare services that fit each member’s unique healthcare needs. The platform improves health outcomes and lowers healthcare costs through proactive engagement and access to high-value healthcare solutions.
Investor Relations:
Sloan Bohlen
877-678-4083
investorrelations@selectquote.com
Media:
Matt Gunter
913-286-4931
matt.gunter@selectquote.com
Source: SelectQuote, Inc.