Alvopetro Energy Ltd.’s vision is to become a leading independent upstream and midstream operator in Brazil. Our strategy is to unlock the on-shore natural gas potential in the state of Bahia in Brazil, building off the development of our Caburé natural gas field and our strategic midstream infrastructure.
Michael Heim, Senior Vice President, Equity Research Analyst, Energy & Transportation, Noble Capital Markets, Inc.
Refer to the full report for the price target, fundamental analysis, and rating.
Alvopetro reported financial results for the quarter ended June 30, 2023 that were above our expectations. Results reflect a decline in production volume which had been preannounced through monthly production releases and thus expected. Realized gas prices were above expectations. Favorable results also reflect a decline in royalty rates. Royalty rates for natural gas production are based on Henry Hub natural gas prices, not realized gas sales prices. Henry Hub prices have been weak relative to realized gas prices resulting in a lower rate per boe produced.
Alvopetro is taking steps to replace production. The decline in production began in April and reflect higher nominations claimed by Alvopetro’s partner in the Cabure Field. Higher partner nominations will mean Alvopetro will own more of future production when prices are expected to be higher. Meanwhile, Alvopetro has accelerated drilling in fields in which it has a 100% ownership. We believe production from these wells will replace the production decline and even has the potential to double production levels in the next four years using internally generated cash.
Equity Research is available at no cost to Registered users of Channelchek. Not a Member? Click ‘Join’ to join the Channelchek Community. There is no cost to register, and we never collect credit card information.
This Company Sponsored Research is provided by Noble Capital Markets, Inc., a FINRA and S.E.C. registered broker-dealer (B/D).
*Analyst certification and important disclosures included in the full report. NOTE: investment decisions should not be based upon the content of this research summary. Proper due diligence is required before making any investment decision.
One Stop Systems, Inc. (OSS) designs and manufactures innovative AI Transportable edge computing modules and systems, including ruggedized servers, compute accelerators, expansion systems, flash storage arrays, and Ion Accelerator™ SAN, NAS, and data recording software for AI workflows. These products are used for AI data set capture, training, and large-scale inference in the defense, oil and gas, mining, autonomous vehicles, and rugged entertainment applications. OSS utilizes the power of PCI Express, the latest GPU accelerators and NVMe storage to build award-winning systems, including many industry firsts, for industrial OEMs and government customers. The company enables AI on the Fly® by bringing AI datacenter performance to ‘the edge,’ especially on mobile platforms, and by addressing the entire AI workflow, from high-speed data acquisition to deep learning, training, and inference. OSS products are available directly or through global distributors. For more information, go to www.onestopsystems.com.
Joe Gomes, Managing Director, Equity Research Analyst, Generalist , Noble Capital Markets, Inc.
Joshua Zoepfel, Research Associate, Noble Capital Markets, Inc.
Refer to the full report for the price target, fundamental analysis, and rating.
2Q23 Results. Revenue of $17.2 million, slightly below guidance and down 6% y-o-y, reflecting the continued runoff of the Disguise business. Higher operating expenses, including some one-time items, drove a net loss of $2.4 million, or a loss of $0.12/sh in the quarter, compared to net income of $322,822, or EPS of $0.02/sh per share last year. We had forecast a net loss of $415,700, or a loss of $0.02/sh. Adjusted EPS was $0.01 compared to $0.04 last year.
Delays and Departures. The decline in Disguise (substantially complete), delays in defense and commercial program orders, and the exit of an autonomous trucking client, a top 10 client in 2022, have combined to stall the momentum of OSS’ business. Revenue guidance for 3Q23 is $13.5 million, a level last seen in the first quarter of 2021.
Equity Research is available at no cost to Registered users of Channelchek. Not a Member? Click ‘Join’ to join the Channelchek Community. There is no cost to register, and we never collect credit card information.
This Company Sponsored Research is provided by Noble Capital Markets, Inc., a FINRA and S.E.C. registered broker-dealer (B/D).
*Analyst certification and important disclosures included in the full report. NOTE: investment decisions should not be based upon the content of this research summary. Proper due diligence is required before making any investment decision.
Onconova Therapeutics is a clinical-stage biopharmaceutical company focused on discovering and developing novel products for patients with cancer. The Company has proprietary targeted anti-cancer agents designed to disrupt specific cellular pathways that are important for cancer cell proliferation. Onconova’s novel, proprietary multi-kinase inhibitor narazaciclib (formerly ON 123300) is being evaluated in a combination trial with estrogen blockade in advanced endometrial cancer. Based on preclinical and clinical studies of CDK 4/6 inhibitors, Onconova is also evaluating opportunities for combination studies with narazaciclib in additional indications. Onconova’s product candidate rigosertib is being studied in multiple investigator-sponsored studies. These studies include a dose-escalation and expansion Phase 1/2a study of oral rigosertib in combination with nivolumab in patients with KRAS+ non-small cell lung cancer, a Phase 2 program evaluating rigosertib monotherapy in advanced squamous cell carcinoma complicating recessive dystrophic epidermolysis bullosa (RDEB-associated SCC), and a Phase 2 trial evaluating rigosertib in combination with pembrolizumab in patients with metastatic melanoma.
Robert LeBoyer, Senior Vice President, Equity Research Analyst, Biotechnology, Noble Capital Markets, Inc.
Refer to the full report for the price target, fundamental analysis, and rating.
Incremental Progress Reported During 2Q23. Onconova reported a 2Q23 loss of $4.3 million or $(0.20) per share. R&D expense of $2.5 million was lower than our estimate of $4.5 million, attributed to previous completion of clinical trial start-up costs. We expect clinical costs to rise in coming quarters as patients are accrued and have adjusted our quarterly estimates. We now expect the $29.7 million cash balance to last through 2Q24.
Narazaciclib Makes Progress In Endometrial Cancer. A Phase 1/2 clinical trial testing the combination of narazaciclib with letrozole (Femara, from Novartis) in LGEEC (low grade endometrioid endometrial cancer) began treating patients in 1Q23. Onconova plans to announce results in 4Q23 including safety, pharmacokinetics, and a recommended Phase 2 dose. The Phase 2 trial is planned for 1H24 as a randomized trial against standard therapy.
Equity Research is available at no cost to Registered users of Channelchek. Not a Member? Click ‘Join’ to join the Channelchek Community. There is no cost to register, and we never collect credit card information.
This Company Sponsored Research is provided by Noble Capital Markets, Inc., a FINRA and S.E.C. registered broker-dealer (B/D).
*Analyst certification and important disclosures included in the full report. NOTE: investment decisions should not be based upon the content of this research summary. Proper due diligence is required before making any investment decision.
Michael Kupinski, Director of Research, Equity Research Analyst, Digital, Media & Technology , Noble Capital Markets, Inc.
Patrick McCann, CFA, Research Analyst, Noble Capital Markets, Inc.
Refer to the full report for the price target, fundamental analysis, and rating.
Q2 in line. The company reported Q2 revenue of $35.4 million, above our previously lowered forecast of $29.7 million. Adj. EBITDA of $3.1 million was largely in line with our forecast of $3.2 million. Total company revenue grew a strong 66.5% over the prior year period, despite economic headwinds.
Sell-side revenue bucks trends. The robust revenue growth in the quarter was lead by the company’s Sell-side programmatic platform. Sell-side revenue nearly doubled (+97.7%) over the prior year period to $23.6 million. We believe the strong results reflect well on the technology investments management has made to position the platform for favorable growth.
Equity Research is available at no cost to Registered users of Channelchek. Not a Member? Click ‘Join’ to join the Channelchek Community. There is no cost to register, and we never collect credit card information.
This Company Sponsored Research is provided by Noble Capital Markets, Inc., a FINRA and S.E.C. registered broker-dealer (B/D).
*Analyst certification and important disclosures included in the full report. NOTE: investment decisions should not be based upon the content of this research summary. Proper due diligence is required before making any investment decision.
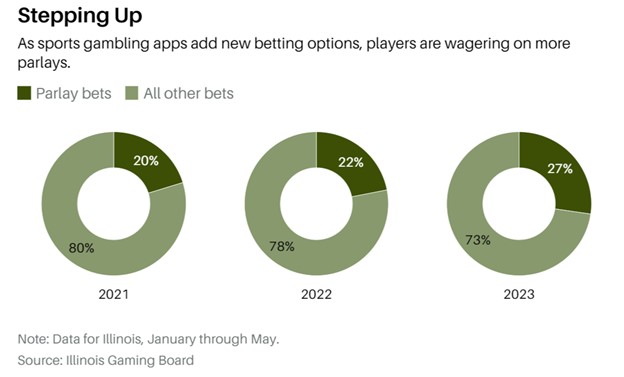
How the Popularity of Parlay Betting is Helping the Major Players
The business of gambling keeps growing as more types of wagers become popular and a friendlier legal environment encourages major players like DraftKings (DKNG) and FanDuel (PDYPF), as well as smaller online sites. A new online betting trend has been particularly profitable for companies who include it in their product line-up. Although specific financials remain undisclosed, parlay betting has dramatically added to the bottom line of some sportsbooks.
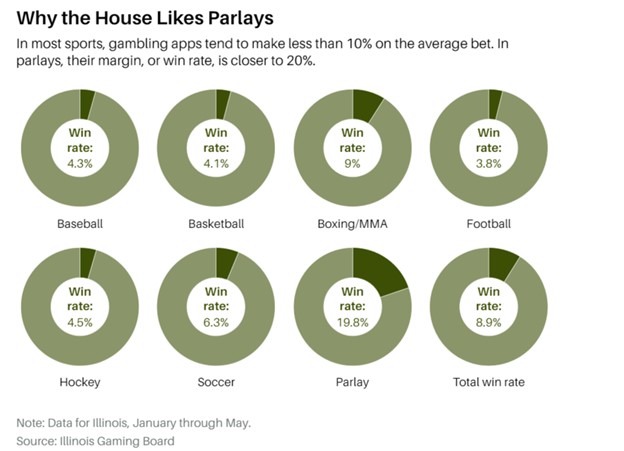
While not public, an analysis published in Barron’s of state gambling regulatory data shows the average amount the house keeps from the wagers is around 20% for parlay bets. This compares quite favorably to the 5% kept by conventional individual outcome wagers.
What is a Parlay Bet?
A parlay bet is a type of sports bet where you combine two or more individual bets into one single all-or-nothing bet. The payout for a parlay bet is much higher than for a single bet, but the probability of winning is much lower.
For example, let’s say you want to bet on the following three NFL games:
The Dallas Cowboys to beat the New York Giants
The Tampa Bay Buccaneers to beat the Philadelphia Eagles
The Miami Dolphins to beat the New York Jets
You could place three separate bets on these games, but you would only win a small amount of money if all three bets won. Instead, you could place a parlay bet on all three games. If you win the parlay bet, you will win a much larger amount.
The payout for a parlay bet is calculated by multiplying the odds of each individual bet together. So, if the odds of the Cowboys winning are 1.50, the odds of the Buccaneers winning are 2.00, and the odds of the Dolphins winning are 1.75, the odds of the parlay bet winning would be 1.50 x 2.00 x 1.75 = 5.25.
This means that if you bet $100 on the parlay bet, you would win $525 if all three bets won.
Gambling companies emphasize that parlays are no gimmick. The odds aren’t skewed in the company’s favor or anything shifty; rather, parlays introduce higher odds against bettors due to the cumulative impact of various outcomes. Betting on multiple events, even up to 10, compounds the odds of each event’s success. This is how the casinos’ 4% to 5% edge evolves into a substantial 20%.
Margins are Better for Companies
The increase in earnings from these bets has helped lift stock values much higher than the overall market.
The growing popularity of parlay bets has also served to increase the appetite in the U.S. for sports betting. In 2018 a Supreme Court’s ruling opened the doors for sports gambling, leaving the decision to legalize it to individual states. Since then, 38 states and Washington, D.C. have legalized sports betting, with online betting approved in 24 of them. The operators amassed a gross revenue of $7.5 billion in 2022, as per the American Gaming Association, and numerous analysts speculate that further state legalization and innovative trends such as parlays could propel the market up to $30 billion or more.
The big two, DraftKings and Flutter/FanDuel dominate the market after spending heavily for years on advertising. Their state-of-the-art technology and popular parlays have helped increase market share. The companies are now veering away from over-the-top marketing, as evidenced by the 49% dip in TV ad spending by online sports betting firms in Q2, and DraftKings’ 10% reduction in marketing expenditures in established markets during the latest quarter.
Regardless of market dominance, parlays are poised to proliferate due to their popularity and profitability. While Las Vegas has long capitalized on the attractiveness of quick riches, the advent of online companies’ represents a distinct shift in the dynamics. Unlike casinos that can’t dramatically boost their own profitability in games like blackjack, the digital platforms can reach the masses electronically and digitally.
As mentioned, this surge in parlays resonates with the penchant for sudden riches, and can be witnessed far beyond Las Vegas. The recent Mega-Millions $1.55 billion prize had players lined up in the summer heat to pay for an almost impossible chance of winning. Platforms like Robinhood appealed to the high-risk high-return nature of many and amassed more brokerage customers in a year than any other company in history.
Parlays effectively tap into and profit handsomely off the mentality of all-or-nothing large gains. A mere $10 parlay could translate into thousands in winnings, mirroring the “got to be in it to win it” feeling of the lottery. But here, the bettor can feel more in control.
Take Away
The overall stock market performance is reported each trading day in popular indexes, but there are individual sectors that rise, or fall separately and at a different pace than each index. Index funds and ETF buyers are beginning to realize that a portion of their portfolio invested in industries and companies that are showing more strength than the S&P, Dow, or Nasdaq indexes may allow for enhanced performance. Many keep the largest allocation in an indexed fund or ETF to still maintain the diversification that prompted the indexed fund investment to begin with.
This December hundreds of investors will be attending NobleCon19 in order to discover actionable ideas they can invest in. The investment conference is the place where both professional and self-directed market participants go to become familiar with less mainstream companies and management. You’re invited – go here for all the information you will need to join us in Florida later this year.
X, the Company Formerly Known as Twitter – Here’s Why It Rebranded
If you’re like me, when Elon Musk announced a rebranding of Twitter to the new name X, you waited for the punchline – or thought of it as a stunt. Although weeks later I’m still typing “Twitter” into my search bar, and still refer to posts as tweets.” I have become sure that this is no stunt, it is a business decision. A decision that begs the question, Why?
This week, X’s CEO, Linda Yaccarino shared her insights in a CNBC interview. She explained the company’s decision to rebrand from Twitter, citing alignment with owner Elon Musk’s overall strategic vision for the platform and how Musk, who has owned the URL X.com since his PayPal days, has championed the social media company as the future, all-encompassing app.
“Elon has been talking about X, the everything app, for a very long time,” Yaccarino said during the interview with CNBC’s Sara Eisen. “Even when we announced that I was joining the company, I was joining the company to partner with Elon to transform Twitter into X, the everything app,” Yaccarino said.
Yaccarino, who took the helm in June, indicated the transformation and growth include extended video content, articles, and even subscriptions to content providers.
“Think about what’s happened since the acquisition,” X’s CEO elaborated, “Experiences and evolution into long-form video and articles, subscribe to your favorite creators, who are now earning a real living on the platform. You look at video, and soon you’ll be able to make video chat calls without having to give your phone number to anyone on the platform.”
Attention was brought to the once microblogging platform’s intentions to facilitate transactions between users, friends, and content creators. The past Twitter was confining, she explained, the new brand will allow evolution without a legacy mindset.
“The rebrand represented really a liberation from Twitter,” she said. “A liberation that allowed us to evolve past a legacy mindset and thinking. And to reimagine how everyone, how everyone on Spaces who’s listening, everybody who’s watching around the world. It’s going to change how we congregate, how we entertain, and how we transact all in one platform.”
The CNBC host asked about the risk in light of name recognition, Yaccarino responded likening the change Johnson & Johnson made by spinning off Band-Aids and Tylenol brands under the new name Kenvue. Her reply suggested the tech giant is almost entrepreneurial now, and can begin with a start-up mentality.
“If you stay Twitter, or you stay whatever your previous brand is, change tends to be only incremental. And you get graded by a legacy report card,” Yaccarino said. “And at X we think about what’s possible. Not the incremental change of what can’t be done.” She pointed to the new product changes and infrastructure improvements, saying it “answers the question of ‘why rebrand?’”
About Yaccarino’s Duties
She is operating independently under Musk’s leadership, Yaccarino assured.
“The roles of Elon and myself are well-defined.” She continued, “Elon is working on accelerating the rebrand and working on the future,” adding, “and I’m responsible for the rest. Running the company, from partnerships to legal to sales to finance.”
Questions regarding Yaccarino’s autonomy within Musk’s framework had arisen due to his comprehensive control over the company and his ventures like Tesla and SpaceX.
Yaccarino, formerly a senior advertising executive at NBC Universal, underscored X’s dedication to enhancing the advertiser experience. This commitment arose from brands withdrawing from the platform following Musk’s acquisition of Twitter.
A large part of the Twitter brand has in the past been questioned by advertisers related to trust and safety. Yaccarino disclosed that X’s trust and safety team is now more capable compared to its pre-acquisition state. While acknowledging that not all content may align with everyone’s views, she highlighted efforts to improve the platform’s content environment.
In November, Twitter disbanded its ethical artificial intelligence team and downsized its trust and safety department. This move halted the team’s work on “algorithmic amplification monitoring,” which mainly aimed to scrutinize content amplification during elections and political events. This stands in sharp contrast to the trust which the new brand has been building.
Rebuilding advertiser confidence stands as a large challenge for Yaccarino. Musk has claimed continuous spikes in user engagement, but concrete data supporting these claims are slim. Yaccarino pointed out the return of prominent brands like Coca-Cola and Visa to advertising under her leadership, facilitated by her direct engagement with marketing and communication executives.
Yaccarino asserted that brands are now insulated from the risk of adjacency to problematic content. She acknowledged that content that is “lawful but awful” can be challenging to manage but emphasized the company’s new content controls in reducing such risks for advertisers.
Yaccarino also addressed the threat posed by Meta’s Threads, indicating that while it hasn’t fully taken off since its high-profile launch, it’s essential to stay vigilant about competitors. Despite already commanding substantial advertiser spending through Instagram and Facebook, Meta’s Threads has yet to introduce advertising.
As for a potential octagon face-off between Musk and Meta CEO Mark Zuckerberg, Yaccarino took a playful stance saying that if the event occurred, Musk “is training” and noted the potential for a great brand sponsorship opportunity.
Full Patient Enrollment Expected Within Six Months
ATLANTA, GA, August 10, 2023 — GeoVax Labs, Inc. (Nasdaq: GOVX), a biotechnology company developing immunotherapies and vaccines against cancers and infectious diseases, today announced that vaccinations have begun in an investigator-initiated clinical trial (ClinicalTrials.gov Identifier: NCT05672355) of GEO-CM04S1 in patients with chronic lymphocytic leukemia (CLL), being conducted at City of Hope National Medical Center.
Despite a high vaccination rate, CLL patients may be at high risk for lethal COVID-19 infection due to poor immune response to currently available vaccines. The GEO-CM04S1 vaccine uses a modified vaccinia virus (MVA) backbone to carry SARS-CoV-2 virus antigens that may be more effective at inducing COVID-19 immunity in patients with poor humoral immune responses since MVA strongly induces T cell expansion even in the background of immunosuppression. By targeting both the spike (S) and nucleocapsid (N) protein antigens, GEO-CM04S1 broadens the specificity of the immune responses and protects against the loss of efficacy associated with current vaccines due to the significant sequence variation observed with the spike antigen.
The study is examining the use of two injections of GEO-CM04S1, three months apart, to assess immune responses in these vulnerable patients, with an mRNA vaccine (currently, the Pfizer-BioNTech Bivalent vaccine) as the control arm. Participants will be randomized 1:1 to receive two boosters with either the GEO-CM04S1 or the control vaccine. The primary immune response outcome will be assessed at 56 days following the first booster injection. Up to 40 participants in each arm will be vaccinated, with immune responses evaluated and compared at the interim and final analyses.
David Dodd, GeoVax President and CEO, stated, “We are very pleased with the rapid start for this third important study for GEO-CM04S1, which we expect will achieve full patient enrollment within six months. We believe the GEO-CM04S1 vaccine, containing the two antigens, S and N, along with the recognized antibody and cellular immune responses resulting from the MVA approach, has the potential to offer greater booster protection than that from the current vaccines in use, as well as provide a greater degree of protection within immunocompromised patients. We expect the CLL trial will add to the data coming from our other ongoing trials, confirming the potential benefit of GEO-CM04S1 in another population of immunocompromised individuals. We look forward to sharing progress reports as we advance.”
About GEO-CM04S1
GEO-CM04S1 is a next-generation COVID-19 vaccine based on GeoVax’s MVA viral vector platform, which supports the presentation of multiple vaccine antigens to the immune system in a single dose. GEO-CM04S1 presents both the spike and nucleocapsid antigens of SARS-CoV-2 and is specifically designed to induce both antibody and T cell responses to non-variable parts of the virus. The more broadly specific and functional engagement of the immune system is designed to protect against the new and continually emerging variants of COVID-19. Based on data from animal models and a completed Phase 1 clinical study, vaccine-induced immune responses were shown to recognize both early and later variants of SARS-CoV-2, including the Omicron variant. Vaccines of this format should not require repeated modification and updating.
A recent presentation of unpublished data from the open-label portion of the Phase 2 trial of GEO-CM04S1 (ClinicalTrials.gov Identifier: NCT04977024) in patients undergoing hematological cancer treatment (i.e., patients who have reduced immune system function as a result of treatment) indicates that GEO-CM04S1 is highly immunogenic in these patients, inducing both antibody responses, including neutralizing antibodies, and T cell responses. These data support the planned progression of the Phase 2 clinical study, which will include a direct comparison to currently approved mRNA vaccines. GEO-CM04S1 also continues to advance in another Phase 2 clinical trial as a booster for healthy patients who have previously received the Pfizer or Moderna mRNA vaccine (ClinicalTrials.gov Identifier: NCT04639466). Data from these studies will form the basis for comparing vaccine potential in unique patient groups as well as the general population.
About GeoVax
GeoVax Labs, Inc. is a clinical-stage biotechnology company developing novel therapies and vaccines for solid tumor cancers and many of the world’s most threatening infectious diseases. The company’s lead program in oncology is a novel oncolytic solid tumor gene-directed therapy, Gedeptin®, presently in a multicenter Phase 1/2 clinical trial for advanced head and neck cancers. GeoVax’s lead infectious disease candidate is GEO-CM04S1, a next-generation COVID-19 vaccine targeting high-risk immunocompromised patient populations. Currently in three Phase 2 clinical trials, GEO-CM04S1 is being evaluated as a primary vaccine for immunocompromised patients such as those suffering from hematologic cancers and other patient populations for whom the current authorized COVID-19 vaccines are insufficient, and as a booster vaccine in patients with chronic lymphocytic leukemia (CLL). In addition, GEO-CM04S1 is in a Phase 2 clinical trial evaluating the vaccine as a more robust, durable COVID-19 booster among healthy patients who previously received the mRNA vaccines. GeoVax has a leadership team who have driven significant value creation across multiple life science companies over the past several decades. For more information, visit our website: www.geovax.com.
Forward-Looking Statements
This release contains forward-looking statements regarding GeoVax’s business plans. The words “believe,” “look forward to,” “may,” “estimate,” “continue,” “anticipate,” “intend,” “should,” “plan,” “could,” “target,” “potential,” “is likely,” “will,” “expect” and similar expressions, as they relate to us, are intended to identify forward-looking statements. We have based these forward-looking statements largely on our current expectations and projections about future events and financial trends that we believe may affect our financial condition, results of operations, business strategy and financial needs. Actual results may differ materially from those included in these statements due to a variety of factors, including whether: GeoVax is able to obtain acceptable results from ongoing or future clinical trials of its investigational products, GeoVax’s immuno-oncology products and preventative vaccines can provoke the desired responses, and those products or vaccines can be used effectively, GeoVax’s viral vector technology adequately amplifies immune responses to cancer antigens, GeoVax can develop and manufacture its immuno-oncology products and preventative vaccines with the desired characteristics in a timely manner, GeoVax’s immuno-oncology products and preventative vaccines will be safe for human use, GeoVax’s vaccines will effectively prevent targeted infections in humans, GeoVax’s immuno-oncology products and preventative vaccines will receive regulatory approvals necessary to be licensed and marketed, GeoVax raises required capital to complete development, there is development of competitive products that may be more effective or easier to use than GeoVax’s products, GeoVax will be able to enter into favorable manufacturing and distribution agreements, and other factors, over which GeoVax has no control.
Further information on our risk factors is contained in our periodic reports on Form 10-Q and Form 10-K that we have filed and will file with the SEC. Any forward-looking statement made by us herein speaks only as of the date on which it is made. Factors or events that could cause our actual results to differ may emerge from time to time, and it is not possible for us to predict all of them. We undertake no obligation to publicly update any forward-looking statement, whether as a result of new information, future developments or otherwise, except as may be required by law.
JERICHO, N.Y.–(BUSINESS WIRE)– 1-800-FLOWERS.COM, Inc. (NASDAQ: FLWS) (the “Company”),a leading provider of gifts designed to help inspire customers to give more, connect more, and build more and better relationships, today announced that the Company will release financial results for its fiscal 2023 fourth quarter and full year on Thursday, August 31, 2023. The press release will be issued prior to market opening and will be followed by a conference call with members of senior management at 8:00 a.m. (ET).
The conference call will be available via live webcast from the Investors section of the Company’s website at 1800flowersinc.com. A recording of the call will be posted on the website within two hours of the call’s completion. A telephonic replay of the call can be accessed beginning at 2:00 p.m. (ET) on August 31, 2023, through September 7, 2023, at: (US) 1-877-344-7529; (Canada) 855-669-9658; (International) 1-412-317-0088; enter conference ID: #7782036.
Special Note Regarding Forward-Looking Statements:
Some of the statements contained in the Company’s scheduled Thursday, August 31, 2023, press release and conference call regarding its results for its fiscal 2023 fourth quarter and full year, other than statements of historical fact, may be forward-looking within the meaning of the Private Securities Litigation Reform Act of 1995. These statements involve risks and uncertainties that could cause actual results to differ materially from those expressed or implied in the applicable statements. For a more detailed description of these and other risk factors, please refer to the Company’s SEC filings including its Annual Reports and Forms 10K and 10Q available at the Investor Relations section of the Company’s website at 1800flowersinc.com. The Company expressly disclaims any intent or obligation to update any of the forward-looking statements made in the scheduled conference call and any recordings thereof, or in any of its SEC filings, except as may be otherwise stated by the Company.
About 1-800-FLOWERS.COM, Inc.
1-800-FLOWERS.COM, Inc. is a leading provider of gifts designed to help inspire customers to give more, connect more, and build more and better relationships. The Company’s e-commerce business platform features an all-star family of brands, including: 1-800-Flowers.com®, 1-800-Baskets.com®, Cheryl’s Cookies®, Harry & David®, PersonalizationMall.com®, Shari’s Berries®, FruitBouquets.com®, Things Remembered®, Moose Munch®, The Popcorn Factory®, Wolferman’s Bakery®, Vital Choice®, and Simply Chocolate®. Through the Celebrations Passport® loyalty program, which provides members with free standard shipping and no service charge across our portfolio of brands, 1-800-FLOWERS.COM, Inc. strives to deepen relationships with customers. The Company also operates BloomNet®, an international floral and gift industry service provider offering a broad-range of products and services designed to help members grow their businesses profitably; Napco℠, a resource for floral gifts and seasonal décor; DesignPac Gifts, LLC, a manufacturer of gift baskets and towers; and Alice’s Table®, a lifestyle business offering fully digital livestreaming and on demand floral, culinary and other experiences to guests across the country. 1-800-FLOWERS.COM, Inc. was recognized among the top 5 on the National Retail Federation’s 2021 Hot 25 Retailers list, which ranks the nation’s fastest-growing retail companies, and was named to the Fortune 1000 list in 2022. Shares in 1-800-FLOWERS.COM, Inc. are traded on the NASDAQ Global Select Market, ticker symbol: FLWS. For more information, visit 1800flowersinc.com or follow @1800FLOWERSInc on Twitter.
Q2 revenue down 3.9%; down 4.5% in constant currency; organic revenue down 2.2% in constant currency
Q2 gross profit down 8.3%; GP rate, 19.8%, down 90 bps year-over-year due primarily to lower permanent placement fees as customer full-time hiring decelerates
Q2 operating earnings of $6.2 million, including $8.0 million of transformation-related restructuring and impairment charges, or $14.2 million on an adjusted basis
Comprehensive business transformation program expected to drive meaningful improvement in EBITDA margin beginning in the second half of 2023
TROY, Mich., Aug. 10, 2023 /PRNewswire/ — Kelly (Nasdaq: KELYA, KELYB), a leading global specialty talent solutions provider, today announced results for the second quarter of 2023.
Peter Quigley, president and chief executive officer, announced revenue for the second quarter of 2023 totaled $1.2 billion, a 3.9% decrease, or 4.5% decrease in constant currency, compared to the corresponding quarter of 2022, with organic, constant currency revenue down 2.2%. Year-over-year revenue trends were impacted by the sale of Russian operations in July 2022 and customers’ more guarded approach to hiring, partially offset by favorable currency impacts.
“In the second quarter, we remained focused on seeking out pockets of demand in more resilient markets, while the effects of ongoing macroeconomic uncertainty became more noticeable in certain parts of our portfolio,” said Quigley. “Our Education segment and higher-margin outcome-based solutions in P&I continued to deliver year-over-year growth, while lower demand for temporary and permanent placement services impacted results in our P&I and SET segments.”
Kelly reported operating earnings in the second quarter of 2023 of $6.2 million, compared to earnings of $8.2 million reported in the second quarter of 2022. Earnings in the second quarter of 2023 include $8.0 million of transformation-related restructuring and impairment charges. Excluding the transformation-related charges, adjusted earnings from operations were $14.2 million. Earnings in the second quarter of 2022 included an $18.5 million asset impairment charge related to our Russian operations and a $4.4 million gain on sale of assets related to underutilized real property and adjusted earnings were $22.3 million. Adjusted earnings declined year-over-year primarily as a result of lower revenues.
Earnings per share in the second quarter of 2023 were $0.20 compared to earnings per share of $0.06 in the second quarter of 2022. Included in the earnings per share in the second quarter of 2023 is an $0.11 loss per share related to transformation-related restructuring charges, net of tax, and a $0.05 loss per share, net of tax, related to an asset impairment charge. Included in the second quarter of 2022 is a $0.48 loss per share, net of tax, asset impairment charge, partially offset by a $0.08 per share gain on sale of real property, net of tax. On an adjusted basis, earnings per share were $0.36 in the second quarter of 2023, a decline of 20% from $0.45 per share in the corresponding quarter of 2022.
Quigley went on to provide an update on the company’s business transformation following the strategic restructuring actions it announced in July. “The change we set out to create through this transformation is no longer hypothetical. The efficiency actions we have implemented to date will deliver an immediate, meaningful improvement to the company’s EBITDA margin, creating a strong foundation for further EBITDA margin expansion going forward. With these actions unlocking additional resources to invest in our future, we are quickly shifting our focus to the growth phase of our transformation to realize the full potential of our specialty strategy.”
As a result of the strategic restructuring and additional cost optimization actions that Kelly will complete in 2023, the Company expects an adjusted EBITDA margin of approximately 3% exiting 2023. Assuming the benefit of a full year of its transformation-related savings and no change in current top-line expectations, the Company would expect to achieve a normalized, adjusted EBITDA margin in the range of 3.3% to 3.5%.
Kelly also reported that on August 9, its board of directors declared a dividend of $0.075 per share. The dividend is payable on September 6, 2023, to shareholders of record as of the close of business on August 23, 2023.
In conjunction with its second-quarter earnings release, Kelly has published a financial presentation on the Investor Relations page of its public website and will host a conference call at 9 a.m. ET on August 10 to review the results and answer questions. The call may be accessed in one of the following ways:
Via the Telephone (877) 692-8955 (toll free) or (234) 720-6979 (caller paid) Enter access code 5728672 After the prompt, please enter ”#”
A recording of the conference call will be available after 2:30 p.m. ET on August 10, 2023, at (866) 207-1041 (toll-free) and (402) 970-0847 (caller-paid). The access code is 7516480#. The recording will also be available at kellyservices.com during this period.
This release contains statements that are forward looking in nature and, accordingly, are subject to risks and uncertainties. These statements are made under the “safe harbor” provisions of the U.S. Private Securities Litigation Reform Act of 1995. Statements that are not historical facts, including statements about Kelly’s financial expectations, are forward-looking statements. Factors that could cause actual results to differ materially from those contained in this release include, but are not limited to, (i) changing market and economic conditions, (ii) disruption in the labor market and weakened demand for human capital resulting from technological advances, loss of large corporate customers and government contractor requirements, (iii) the impact of laws and regulations (including federal, state and international tax laws), (iv) unexpected changes in claim trends on workers’ compensation, unemployment, disability and medical benefit plans, (v) litigation and other legal liabilities (including tax liabilities) in excess of our estimates, (vi) our ability to achieve our business’s anticipated growth strategies, (vii) our future business development, results of operations and financial condition, (viii) damage to our brands, (ix) dependency on third parties for the execution of critical functions, (x) conducting business in foreign countries, including foreign currency fluctuations, (xi) availability of temporary workers with appropriate skills required by customers, (xii) cyberattacks or other breaches of network or information technology security, and (xiii) other risks, uncertainties and factors discussed in this release and in the Company’s filings with the Securities and Exchange Commission. In some cases, forward-looking statements can be identified by words or phrases such as “may,” “will,” “expect,” “anticipate,” “target,” “aim,” “estimate,” “intend,” “plan,” “believe,” “potential,” “continue,” “is/are likely to” or other similar expressions. All information provided in this press release is as of the date of this press release and we undertake no duty to update any forward-looking statement to conform the statement to actual results or changes in the Company’s expectations.
About Kelly®
Kelly Services, Inc. (Nasdaq: KELYA, KELYB) helps companies recruit and manage skilled workers and helps job seekers find great work. Since inventing the staffing industry in 1946, we have become experts in the many industries and local and global markets we serve. With a network of suppliers and partners around the world, we connect more than 450,000 people with work every year. Our suite of outsourcing and consulting services ensures companies have the people they need, when and where they are needed most. Headquartered in Troy, Michigan, we empower businesses and individuals to access limitless opportunities in industries such as science, engineering, technology, education, manufacturing, retail, finance, and energy. Revenue in 2022 was $5.0 billion. Learn more at kellyservices.com.
All dollar amounts expressed are in thousands of U.S. dollars unless otherwise indicated.
Q2 2023 and Other Highlights
Revenues of $53.1 million vs. revenues of $84.8 million Q2 2022; Revenues per pound of V2O5 sold1 of $9.42 vs. $11.69 per pound sold in Q2 2022, mainly driven by a sharp decrease in V2O5 prices during the quarter, which was partially offset by an increase in the Company’s high purity vanadium sales
Operating costs of $43.0 million vs. $50.7 million in Q2 2022; Cash operating costs excluding royalties per pound1 of V2O5 equivalent sold of $5.18 vs. $4.23 in Q2 2022
Net loss of $6.0 million vs. net income of $18.0 million in Q2 2022; Basic loss per share of $0.09
Cash provided before working capital items of $3.8 million vs. $25.4 million in Q2 2022; Cash provided by operating activities of $18.1 million vs. $2.9 million in Q2 2022
Cash balance of $64.0 million, net working capital2 surplus of $103.1 million and debt of $65.0 million exiting Q2 2023
V2O5 production 2,639 tonnes (5.8 million lbs3) vs. 3,084 tonnes in Q2 2022 and 2,111 tonnes in Q1 2023; V2O5 equivalent sales of 2,557 tonnes vs. 3,291 tonnes in Q2 2022
Commissioning of the Company’s ilmenite concentration plant has commenced and is expected to be completed in Q3 2023, at which point a gradual ramp-up of ilmenite production in Q4 2023; Ilmenite concentrate will become a by-product of the Company’s vanadium operations in Brazil
Hot commissioning of Largo Clean Energy’s (“LCE”) 6.1 megawatt-hour (“MWh”) Enel Green Power España (“EGPE”) vanadium redox flow battery (“VRFB”) deployment remains ongoing, with provisional acceptance by EGPE expected in Q3 2023
The Company published its 2022 Sustainability Reportentitled: “Building a low-carbon future together” highlighting the development and improvement of its ongoing sustainability programs
Q2 2023 results conference call: Thursday, August 10th at 1:00 p.m. ET
Vanadium Market Update4
The average benchmark price per lb of V2O5 in Europe was $8.46 in Q2 2023, a 19% decrease from the average of $10.39 seen in Q1 2023 and a 24% decrease from the average of $11.08 seen in Q2 2022; The average benchmark price per kg of ferrovanadium in Europe was $33.47 in Q2 2023, a 15% decrease from the average of $39.46 seen in Q1 2023 and a 24% decrease from the average of $43.83 seen in Q2 2022
Lower vanadium prices can be attributed to weaker demand in the Chinese construction market; however, these prices been partially offset by higher VRFB deployments in China and increased aerospace demand
The average European benchmark V2O5 price at June 30, 2023 was approximately $7.98 per lb, compared with approximately $10.13 per lb at March 31, 2023 and $9.15 per lb at June 30, 2022
According to Vanitec, demand in energy storage applications has increased by 141% from Q1 2022 to Q1 2023
TORONTO–(BUSINESS WIRE)– Largo Inc. (“Largo” or the “Company“) (TSX: LGO) (NASDAQ: LGO) today released financial and operating results for the three and six months ended June 30, 2023. The Company reported revenues of $53.1 million from vanadium pentoxide (“V2O5”) equivalent sales of 2,557 tonnes.
Daniel Tellechea, Interim CEO and Director of Largo, stated: “A sharp decrease in V2O5 prices combined with lower sales in Q2 2023 impacted the Company’s financial performance for the quarter. Higher production at the end of the second quarter is positively impacting in-transit inventory and should support higher availability and sales in the coming months. Our primary focus continues to be on delivering production and sales targets safely, optimizing our mine plan, as well as implementing additional cost reduction measures at both the mine site and at LCE to support profit margins going forward. The Company is beginning to see a reduction in key consumable costs at its mine site and has implemented a cost reduction plan at LCE.”
He continued: “Chinese and European steel sector spot demand for vanadium was weaker in Q2 2023, however, strong demand from the aerospace industry offset this during the quarter. Importantly, recent estimates indicate that energy storage demand is expected to increase significantly in the future, driven primarily by new VRFB deployments to 2030, with a CAGR of 14%8.”
Financial Results
(thousands of U.S. dollars, except for basic earnings (loss) per share and diluted earnings (loss) per share)
Three months ended
Six months ended
June 30, 2023
June 30, 2022
June 30, 2023
June 30, 2022
Revenues
53,110
84,804
110,531
127,492
Operating costs
(43,029)
(50,704)
(88,960)
(79,662)
Direct mine and production costs
(24,976)
(23,905)
(53,395)
(41,465)
Net income (loss) before tax
(4,647)
22,409
(3,932)
23,223
Income tax recovery (expense)
295
(7,115)
(38)
(7,717)
Deferred income tax (expense) recovery
(1,614)
2,671
(3,203)
505
Net income (loss)
(5,966)
17,965
(7,173)
16,011
Basic earnings (loss) per share
(0.09)
0.28
(0.11)
0.25
Diluted earnings (loss) per share
(0.09)
0.28
(0.11)
0.25
Cash provided before non-cash working capital items
3,841
25,400
11,991
31,151
Net cash provided by (used in) operating activities
18,057
2,902
23,010
(1,148)
Net cash (used in) provided by financing activities
(1,756)
(15,679)
23,549
(15,294)
Net cash used in investing activities
(14,283)
(11,383)
(37,689)
(15,651)
Net change in cash
2,405
(25,516)
9,509
(30,912)
As at
June 30, 2023
December 31, 2022
Cash
63,980
54,471
Debt
65,000
40,000
Working capital2
103,147
115,171
Maracás Menchen Mine Operational and Sales Results
Q2 2023
Q2 2022
Total Ore Mined (tonnes)
489,892
378,273
Ore Grade Mined – Effective Grade5 (%)
0.86
1.18
Total Mined – Dry Basis (tonnes)
3,671,842
2,503,696
Concentrate Produced (tonnes)
99,083
124,317
Grade of Concentrate (%)
3.34
3.28
Global Recovery6 (%)
81.0
81.8
V2O5 Produced (Flake + Powder) (tonnes)
2,639
3,084
High purity V2O5 equivalent produced (tonnes)
983
587
V2O5 produced (equivalent pounds3 )
5,817,992
6,799,048
V2O5 Equivalent Sold (tonnes)
2,557
3,291
Produced V2O5 equivalent sold (tonnes)
2,268
2,783
Purchased V2O5 equivalent sold (tonnes)
289
508
Cash Operating Costs Excluding Royalties per pound ($/lb)1
5.18
4.23
Revenues per pound sold ($/lb)1
9.42
11.69
Q2 2023 Financial Highlights
The Company recognized revenues of $53.1 million from sales of 2,557 tonnes of V2O5 equivalent (Q2 2022 – 2,849 tonnes) in Q2 2023. This represents a 37% decrease in revenues over Q2 2022 ($84.8 million) mainly due to lower sales and vanadium prices for the quarter. Reconciliation of the Company’s revenues per pound sold1 and total quantities sold of each product are provided in the “Non-GAAP7 Measures” section of this press release.
Operating costs of $43.0 million (Q2 2022 – $50.7 million) include direct mine and production costs of $25.0 million (Q2 2022 – $23.9 million), conversion costs of $2.2 million (Q2 2022 – $2.3 million), product acquisition costs of $3.8 million (Q2 2022 – $9.6 million), royalties of $2.5 million (Q2 2022 – $3.7 million), distribution costs of $2.5 million (Q2 2022 – $2.9 million), inventory write-down of $0.7 million (Q2 2022 – $2.3 million), depreciation and amortization of $6.2 million (Q2 2022 – $5.5 million) and iron ore costs of $0.2 million (Q2 2022 – $0.2 million). The increase in direct mine and production costs is attributable to an increase in total ore mined and the move to a new mining contractor in Q3 2022. Higher mining costs, the change in production levels across the period and the ramp up following the challenges experienced in the prior quarter negatively impacted costs. In addition, as compared with Q2 2022, the Company continued to experience elevated costs in critical consumables. The Company is actively working to manage its usage of these consumables and is also starting to see a softening in consumable prices.
Cash operating costs excluding royalties1 per pound sold were $5.18 per lb, compared with $4.23 for Q2 2022. The increase seen in Q2 2023 compared with Q2 2022 is largely due to the reasons noted above.
Professional, consulting and management fees of $5.8 million decreased from Q2 2022 by 9%. The decrease was mainly due to lower expenses incurred in the mine properties segment in Q2 2023 over Q2 2022, which is primarily attributable to additional compensation costs incurred in Q2 2022.
Other general and administrative expenses of $3.3 million decreased from Q2 2022 by 35% (or $1.8 million), which is primarily attributable to the increase in legal provisions recognized in Q2 2022 in the mine properties segment.
Finance costs of $2.0 million in Q2 2023 increased by $1.7 million from Q2 2022, which is primarily attributable to interest on the increased debt level in Q2 2023 as compared with Q2 2022, as well as a write-down of vanadium assets of $0.2 million.
Exploration and evaluation costs of $1.3 million in Q2 2023 increased by $1.1 million from Q2 2022. This was driven by infill drilling and geological model work at the Maracás Menchen Mine and diamond drilling at Campo Alegre de Lourdes.
Following the completion of its short-term infill drilling program in the Campbell Pit, the resulting geological model update and the decision to prioritize operating flexibility in the near-term mine planning, the Company has decided to accelerate its pre-stripping mining rates. Accordingly, it has revised its guidance for capitalized waste stripping costs for 2023. Expenditures of $11.7 million were capitalized during the six months ended June 30, 2023, and the Company now plans to incur approximately $15.0 million in the remainder of 2023. The Company believes that increased operating flexibility at its open pit mine will, amongst other things, assist in preventing weather related disruptions at the mine.
Cash provided by operating activities continues to be impacted by expenditures at LCE, with a net loss of $5.3 million recognized in Q2 2023 (Q2 2022 – $5.4 million).
Additional Corporate Updates
Production: V2O5 production in April, May and June 2023 was 676 tonnes, 945 tonnes and 1,018 tonnes, respectively, for a total of 2,639 tonnes of V2O5 produced in Q2 2023.
The Company completed its 2023 infill drilling campaign, which resulted in a further refinement of the Company’s short-term mining model. The Company achieved a normalized production level in June following the completion of upgrades to the crushing circuit and an improvement in mining performance as compared with Q1 2023. These upgrades are expected to reduce operational maintenance costs and provide more flexibility in the blending of ores to stabilize V2O5 production.
In Q2 2023, the Company produced 983 V2O5 equivalent tonnes of high purity products, including 706 tonnes of high purity V2O5 and 277 tonnes of high purity vanadium trioxide (“V2O3“). This represented 37% of the Company’s total quarterly production.
The global recovery6 achieved in Q2 2023 was 81.0%, a decrease of 1.0% from the 81.8% achieved in Q2 2022 and 2.4% lower than the 83.0% achieved in Q1 2023. The global recovery6 in April, May and June 2023 was 81.3%, 80.4%, 81.3%, respectively.
The total material moved in the mine in June was a record 1,349,405 tonnes of waste and 108,104 tonnes of ore (dry basis). In Q2 2023, 489,892 tonnes of ore were mined with an effective grade5 of 0.86% of V2O5. The ore mined in Q2 2023 was 30% higher than in Q2 2022. The Company produced 99,083 tonnes of concentrate with an effective grade5 of 3.34%.
Subsequent to Q2 2023, production in July 2023 was 644 tonnes of V2O5 equivalent as a result of process restrictions following the accident in July at its chemical plant. However, the Company accumulated intermediate stocks of vanadium material that is expected to be processed in August, offsetting a portion of weaker July V2O5 output.
Sales: In Q2 2023, the Company sold 2,557 tonnes of V2O5 equivalent (Q2 2022 – 3,291 tonnes), including 289 tonnes of purchased products (Q2 2022 – 508 tonnes). Produced V2O5 equivalent sold decreased, with 2,268 tonnes sold in Q2 2023, as compared with 2,783 tonnes in Q2 2022. The Company delivered both standard grade and high purity V2O5, as well as vanadium trioxide (“V2O3”) and ferrovanadium (“FeV”) to customers globally. Subsequent to Q2 2023, sales in July 2023 were 860 tonnes of V2O5 equivalent.
Largo Clean Energy: During Q2 2023, LCE continued to make progress on the delivery of the EGPE contract, which remains a priority focus. LCE finalized the pumping of electrolyte for EGPE’s VCHARGE VRFB deployment and completed cold commissioning of the system in June. The battery system was also successfully interconnected with the grid and the system inverter was successfully utilized to form the chemistry. The battery is currently performing charge-discharge cycles as part of the ongoing hot commissioning phase, which is anticipated to be completed in Q3 2023, along with provisional acceptance of the system by EGPE.
During Q2 2023, Mr. Francesco D’Alessio was appointed as President of LCE. The Company continues to evaluate all strategic options for LCE in order to fully maximize its unique value proposition in the energy storage sector. This includes but is not limited to the potential strengthening and formalization of existing industry and commercial relationships, developing additional collaborative partnerships, evaluating alternative deployment strategies, and performing a comprehensive review of cost reduction measures.
In accordance with this strategic evaluation, LCE has implemented a cost reduction plan and expects to realize savings of approximately 50% in its expenditures at LCE going forward.
Ilmenite Plant: Construction of the ilmenite concentration plant was completed in Q2 2023. Commissioning of this new facility has commenced and is expected to be completed in Q3 2023. A gradual ramp-up of ilmenite concentrate production will occur in Q4 2023.
Exploration: During Q2 2023, the Company completed approximately 5,000 metres of reverse circulation (“RC”) infill drilling in the Campbell Pit and 3,500 metres of diamond drilling in the near mine deep drilling program. The Campbell Pit geological model was updated in Q2 2023 and delivered to the mine planning team. This model will continue to be updated quarterly and will assist with mine planning activities going forward.
Largo Physical Vanadium Corp. (“LPV”): LPV continued its acquisition of vanadium assets, with $1.5 million spent during Q2 2023. LPV has deployed over 90% of its capital and is focussed on marketing and strategic initiatives to establish its business model.
Q2 2023 Webcast and Conference Call Information
The Company will host a webcast and conference call on Thursday, August 10th at 1:00 p.m. ET, to discuss its second quarter 2023 results and progress.
Webcast and Conference Call Details:
Details of the webcast and conference call are listed below:
To view press releases or any additional financial information, please visit the Investor Resources section of the Company’s website at: www.largoinc.com/English/investor-resources
A playback recording will be available on the Company’s website for a period of 60-days following the conference call.
The information provided within this release should be read in conjunction with Largo’s unaudited condensed interim consolidated financial statements for the three and six months ended June 30, 2023 and 2022, and its management’s discussion and analysis for the three and six months ended June 30, 2023, which are available on our website at www.largoinc.com or on the Company’s respective profiles at www.sedar.com and www.sec.gov.
About Largo
Largo has a long and successful history as one of the world’s preferred vanadium companies through the supply of its VPURETM and VPURE+TM products, which are sourced from one of the world’s highest-grade vanadium deposits at the Company’s Maracás Menchen Mine in Brazil. Aiming to enhance value creation at Largo, the Company is in the process of implementing a titanium dioxide pigment plant using feedstock sourced from its existing operations in addition to advancing its U.S.-based clean energy division with its VCHARGE vanadium batteries. Largo’s VCHARGE vanadium batteries contain a variety of innovations, enabling an efficient, safe and ESG-aligned long duration solution that is fully recyclable at the end of its 25+ year lifespan. Producing some of the world’s highest quality vanadium, Largo’s strategic business plan is based on two pillars: 1.) vanadium production from its operations in Brazil and 2.) energy storage business in the U.S. to support a low carbon future through its clean energy division.
Largo’s common shares trade on the Nasdaq Stock Market and on the Toronto Stock Exchange under the symbol “LGO”. For more information, please visit www.largoinc.com.
This press release contains “forward-looking information” and “forward-looking statements” within the meaning of applicable Canadian and United States securities legislation. Forward‐looking information in this press release includes, but is not limited to, statements with respect to the timing and amount of estimated future production and sales; the future price of commodities; costs of future activities and operations, including, without limitation, the effect of inflation and exchange rates; the effect of unforeseen equipment maintenance or repairs on production; timing and cost related to the commissioning and ramp-up of the ilmenite plan, ilmenite production; the ability to sell ilmenite, V2O5 or other vanadium commodities on a profitable basis, the ability to produce high purity V2O5 and V2O3 according to customer specifications; the extent of capital and operating expenditures; the improvements to mine planning based on the results of drilling campaigns; the affect of the re-assay program results on measured and indicated resource estimates. Forward‐looking information in this press release also includes, but is not limited to, statements with respect to our ability to build, finance and successfully operate a VRFB business, the projected timing and cost of the completion of the EGPE project; our ability to protect and develop our technology, our ability to maintain our IP, the competitiveness of our product in an evolving market, our ability to market, sell and deliver our VCHARGE batteries on specification and at a competitive price, our ability to successfully deploy our VCHARGE batteries in foreign jurisdictions, the affect of the workforce reduction on operating costs, our ability to secure the required resources to build and deploy our VCHARGE batteries, and the adoption of VRFB technology generally in the market.
The following are some of the assumptions upon which forward-looking information is based: that general business and economic conditions will not change in a material adverse manner; demand for, and stable or improving price of V2O5, other vanadium products, ilmenite and titanium dioxide pigment; receipt of regulatory and governmental approvals, permits and renewals in a timely manner; that the Company will not experience any material accident, labour dispute or failure of plant or equipment or other material disruption in the Company’s operations at the Maracás Menchen Mine or relating to Largo Clean Energy, specially in respect of the installation and commissioning of the EGPE project; the availability of financing for operations and development; the availability of funding for future capital expenditures; the ability to replace current funding on terms satisfactory to the Company; the ability to mitigate the impact of heavy rainfall; the reliability of production, including, without limitation, access to massive ore, the Company’s ability to procure equipment, services and operating supplies in sufficient quantities and on a timely basis; that the estimates of the resources and reserves at the Maracás Menchen Mine are within reasonable bounds of accuracy (including with respect to size, grade and recovery and the operational and price assumptions on which such estimates are based); the accuracy of the Company’s mine plan at the Maracás Menchen Mine, the competitiveness of the Company’s VRFB technology; the ability to obtain funding through government grants and awards for the Green Energy sector, the accuracy of cost estimates and assumptions on future variations of VCHARGE battery system design, that the Company’s current plans for ilmenite and VRFBs can be achieved; the Company’s “two-pillar” business strategy will be successful; the Company’s sales and trading arrangements will not be affected by the evolving sanctions against Russia; and the Company’s ability to attract and retain skilled personnel and directors; the ability of management to execute strategic goals.
Forward-looking statements can be identified by the use of forward-looking terminology such as “plans”, “expects” or “does not expect”, “is expected”, “budget”, “scheduled”, “estimates”, “forecasts”, “intends”, “anticipates” or “does not anticipate”, or “believes”, or variations of such words and phrases or statements that certain actions, events or results “may”, “could”, “would”, “might” or “will be taken”, “occur” or “be achieved”. All information contained in this news release, other than statements of current and historical fact, is forward looking information. Forward-looking statements are subject to known and unknown risks, uncertainties and other factors that may cause the actual results, level of activity, performance or achievements of Largo or Largo Clean Energy to be materially different from those expressed or implied by such forward-looking statements, including but not limited to those risks described in the annual information form of Largo and in its public documents filed on www.sedar.com and available on www.sec.gov from time to time. Forward-looking statements are based on the opinions and estimates of management as of the date such statements are made. Although management of Largo has attempted to identify important factors that could cause actual results to differ materially from those contained in forward-looking statements, there may be other factors that cause results not to be as anticipated, estimated or intended. There can be no assurance that such statements will prove to be accurate, as actual results and future events could differ materially from those anticipated in such statements. Accordingly, readers should not place undue reliance on forward-looking statements. Largo does not undertake to update any forward-looking statements, except in accordance with applicable securities laws. Readers should also review the risks and uncertainties sections of Largo’s annual and interim MD&As which also apply.
Trademarks are owned by Largo Inc.
Q2 2023 Net Income Reconciliation
Q2 2023
Total V2O5 equivalent sold
000s lbs
5,637
A
Tonnesi
2,557
Produced V2O5 equivalent sold
000s lbs
5,000
B
Tonnesi
2,268
Revenues per pound sold
$/lb
$
9.42
C
Cash operating costs per pound
$/lb
$
5.67
D
Conversion of tonnes to pounds, 1 tonne = 2,204.62 pounds or lbs.
Q2 2023
Revenues
$
53,110
A x C 2,557 tonnes of V2O5 equivalent sold (Q2 2022 – 3,291 tonnes), with revenues per pound sold of $9.42 (Q2 2022 – $11.69)
Cash operating costs
(28,365)
B x D Global recovery of 81.0% (Q2 2022 – 81.8%), impact of increased mining costs and cost increases for critical consumables
Other operating costs
Conversion costs (costs incurred in converting V2O5 to FeV that are recognized on the sale of FeV)
(2,220)
Note 19 579 tonnes of FeV sold
Product acquisition costs (costs incurred in purchasing products from 3rd parties that are recognized on the sale of those products)
(3,753)
Note 19 289 tonnes of V2O5 equivalent of purchased products sold, compared with 508 tonnes in Q2 2022 with a cost of $9,568
Distribution costs
(2,525)
Note 19
Depreciation
(6,202)
Note 19
Inventory write-down
(683)
Note 19 Attributable to purchased FeV and V2O5 inventory
Increase in legal provisions
(230)
See “other general and administrative expenses” section on page 5
Iron ore costs
(220)
Note 19
(15,833)
Commercial & Corporate costs
Professional, consulting and management fees
(2,453)
Note 15 (Sales & trading plus Corporate)
Other general and administrative expenses
(1,332)
Share-based payments
(413)
(4,198)
Largo Clean Energy
(5,236)
Note 15 (excluding finance costs and foreign exchange) 2023 guidance between $13,500 and $14,500
Largo Physical Vanadium
(332)
Note 15 (excluding finance costs and foreign exchange)
Titanium project
(174)
Note 15 – “other”
Foreign exchange loss
(817)
Finance costs
(1,981)
Interest income
480
Exploration and evaluation costs
(1,301)
Net income before tax
(4,647)
Income tax expense
295
Deferred income tax expense
(1,614)
Net income (loss)
$
(5,966)
Note references in the table above refer to the note disclosures contained in the Q2 2023 unaudited condensed interim consolidated financial statements.
Non-GAAP Measures
The Company uses certain non-GAAP measures in its press release, which are described in the following section. Non-GAAP financial measures and non-GAAP ratios are not standardized financial measures under IFRS, the Company’s GAAP, and might not be comparable to similar financial measures disclosed by other issuers. These measures are intended to provide additional information and should not be considered in isolation or as a substitute for measures of performance prepared in accordance with IFRS.
Revenues Per Pound
The Company’s press release refers to revenues per pound sold, V2O5 revenues per pound of V2O5 sold and FeV revenues per kg of FeV sold, which are non-GAAP financial measures that are used to provide investors with information about a key measure used by management to monitor performance of the Company.
These measures, along with cash operating costs, are considered to be key indicators of the Company’s ability to generate operating earnings and cash flow from its Maracás Menchen Mine and sales activities. These measures differ from measures determined in accordance with IFRS, and are not necessarily indicative of net earnings or cash flow from operating activities as determined under IFRS.
The following table provides a reconciliation of revenues per pound sold, V2O5 revenues per pound of V2O5 sold and FeV revenues per kg of FeV sold to revenues and the revenue information presented in note 18 as per the Q2 2022 unaudited condensed interim consolidated financial statements.
Three months ended
Six months ended
June 30, 2023
June 30, 2022
June 30, 2023
June 30, 2022
Revenues – V2O5 producedi
$
30,558
$
45,976
$
65,084
$
67,790
V2O5 sold – produced (000s lb)
3,083
4,385
6,881
7,079
V2O5 revenues per pound of V2O5 sold – produced ($/lb)
$
9.91
$
10.48
$
9.46
$
9.58
Revenues – V2O5 purchasedi
$
2,937
$
1,143
$
5,465
$
1,529
V2O5 sold – purchased (000s lb)
396
88
705
132
V2O5 revenues per pound of V2O5 sold – purchased ($/lb)
$
7.42
$
12.99
$
7.75
$
11.58
Revenues – V2O5i
$
33,495
$
47,119
$
70,549
$
69,319
V2O5 sold (000s lb)
3,479
4,473
7,586
7,211
V2O5 revenues per pound of V2O5 sold ($/lb)
$
9.63
$
10.53
$
9.30
$
9.61
Revenues – V2O3i
$
2,358
$
47,119
$
3,841
$
69,319
V2O3 sold (000s lb)
177
–
311
–
V2O3 revenues per pound of V2O3 sold ($/lb)
$
13.32
$
–
$
12.35
$
–
Revenues – FeV producedi
$
17,230
$
22,883
$
34,658
$
41,911
FeV sold – produced (000s kg)
579
550
1,147
1,182
FeV revenues per kg of FeV sold – produced ($/kg)
$
29.76
$
41.61
$
30.22
$
35.46
Revenues – FeV purchasedi
$
27
$
14,802
$
328
$
16,262
FeV sold – purchased (000s kg)
1
317
11
357
FeV revenues per kg of FeV sold – purchased ($/kg)
$
27.00
$
46.69
$
29.82
$
45.55
Revenues – FeVi
$
17,256
$
37,685
$
34,986
$
58,173
FeV sold (000s kg)
580
867
1,158
1,539
FeV revenues per kg of FeV sold ($/kg)
$
29.75
$
43.47
$
30.21
$
37.80
Revenuesi
$
53,110
$
84,804
$
110,531
$
127,492
V2O5 equivalent sold (000s lb)
5,637
7,255
11,918
12,176
Revenues per pound sold ($/lb)
$
9.42
$
11.69
$
9.27
$
10.47
As per note 18 in the Company’s Q2 2023 unaudited condensed interim consolidated financial statements.
Cash Operating Costs and Cash Operating Costs Excluding Royalties
The Company’s press release refers to cash operating costs per pound and cash operating costs excluding royalties per pound, which are non-GAAP ratios based on cash operating costs and cash operating costs excluding royalties, which are non-GAAP financial measures, in order to provide investors with information about a key measure used by management to monitor performance. This information is used to assess how well the Maracás Menchen Mine is performing compared to plan and prior periods, and also to assess its overall effectiveness and efficiency.
Cash operating costs includes mine site operating costs such as mining costs, plant and maintenance costs, sustainability costs, mine and plant administration costs, royalties and sales, general and administrative costs (all for the Mine properties segment), but excludes depreciation and amortization, share-based payments, foreign exchange gains or losses, commissions, reclamation, capital expenditures and exploration and evaluation costs. Operating costs not attributable to the Mine properties segment are also excluded, including conversion costs, product acquisition costs, distribution costs and inventory write-downs.
Cash operating costs excluding royalties is calculated as cash operating costs less royalties.
Cash operating costs per pound and cash operating costs excluding royalties per pound are obtained by dividing cash operating costs and cash operating costs excluding royalties, respectively, by the pounds of vanadium equivalent sold that were produced by the Maracás Menchen Mine.
Cash operating costs, cash operating costs excluding royalties, cash operating costs per pound and cash operating costs excluding royalties per pound, along with revenues, are considered to be key indicators of the Company’s ability to generate operating earnings and cash flow from its Maracás Menchen Mine. These measures differ from measures determined in accordance with IFRS, and are not necessarily indicative of net earnings or cash flow from operating activities as determined under IFRS.
The following table provides a reconciliation of cash operating costs and cash operating costs excluding royalties, cash operating costs per pound and cash operating costs excluding royalties per pound for the Maracás Menchen Mine to operating costs as per the Q2 2022 unaudited condensed interim consolidated financial statements.
Three months ended
Six months ended
June 30, 2023
June 30, 2022
June 30, 2023
June 30, 2022
Operating costsi
$
43,029
$
50,704
$
88,960
$
79,662
Professional, consulting and management feesii
624
1,567
1,468
2,603
Other general and administrative expensesiii
315
209
624
476
Less: iron ore costsi
(220)
(222)
(493)
(437)
Less: conversion costsi
(2,220)
(2,337)
(4,138)
(4,184)
Less: product acquisition costsi
(3,753)
(9,568)
(7,931)
(11,118)
Less: distribution costsi
(2,525)
(2,851)
(3,972)
(4,306)
Less: inventory write-down
(683)
(2,285)
(683)
(2,285)
Less: depreciation and amortization expense1
(6,202)
(5,507)
(13,453)
(9,812)
Cash operating costs
28,365
29,710
60,382
50,599
Less: royaltiesi
(2,450)
(3,742)
(4,895)
(5,768)
Cash operating costs excluding royalties
25,915
25,968
55,487
44,831
Produced V2O5 sold (000s lb)
5,000
6,135
10,741
10,882
Cash operating costs per pound ($/lb)
$
5.67
$
4.84
$
5.62
$
4.65
Cash operating costs excluding royalties per pound ($/lb)
$
5.18
$
4.23
$
5.17
$
4.12
As per note 19 in the Company’s Q2 2023 unaudited condensed interim consolidated financial statements.
As per the Mine properties segment in note 15 in the Company’s Q2 2023 unaudited condensed interim consolidated financial statements.
As per the Mine properties segment in note 15, less the increase in legal provisions of $0.2 million (Q2 2023) and $0.3 million (for the six months ended June 30, 2023) as noted in the “other general and administrative expenses” section on page 6 of the Company’s Q2 2023 Management Discussion and Analysis.
______________________________________ 1Revenues per pound sold and cash operating costs are non-GAAP financial measures, and cash operating costs per pound and cash operating costs excluding royalties per pound are non-GAAP ratios with no standard meaning under IFRS, and may not be comparable to similar financial measures disclosed by other issuers. Refer to the “Non-GAAP Measures” section of this press release. 2Defined as current assets less current liabilities per the consolidated statements of financial position. 3Conversion of tonnes to pounds, 1 tonne = 2,204.62 pounds or lbs. 4Fastmarkets Metal Bulletin. 5Effective grade represents the percentage of magnetic material mined multiplied by the percentage of V2O5 in the magnetic concentrate. 6Global recovery is the product of crushing recovery, milling recovery, kiln recovery, leaching recovery and chemical plant recovery. 7GAAP – Generally Accepted Accounting Principles 8RBC Capital Markets Vanadium Outlook (2023)
For further information, please contact: Investor Relations Alex Guthrie Senior Manager, External Relations +1.416.861.9778 aguthrie@largoinc.com
CALGARY, AB, Aug. 9, 2023 /CNW/ – Alvopetro Energy Ltd. (TSXV: ALV) (OTCQX: ALVOF) is pleased to announce financial results for the three and six months ended June 30, 2023 and an operational update.
All references herein to $ refer to United States dollars, unless otherwise stated and all tabular amounts are in thousands of United States dollars, except as otherwise noted.
President & CEO, Corey C. Ruttan commented:
“We continue to post strong results, generating an operating netback of $69.61 per boe and $11 million in funds flow from operations, highlighting the strong profitability of our operations. Our 2023 capital program is focused on adding 100% interest production from our Murucututu natural gas project and our Bom Lugar oil field. We have had exciting early results with the stimulation of our 197(1) Murucututu well and drilling our first oil development well at Bom Lugar.”
Operational Update
Drilling operations continue on the 183-A3 well on our Murucututu natural gas field. The well was spud on July 11th and is targeting shallower exploration potential in the Caruaçu Formation and the Gomo member of the Candeias Formation. We expect drilling to be completed later this quarter. We also expect to complete our recently drilled Bom Lugar well (BL-06) and have the well on production in the third quarter.
Our natural gas price under our long-term gas sales agreement with Bahiagás was adjusted effective August 1st to BRL1.99/m3 or $13.25/Mcf, based on our average heat content to date, the July 31, 2023 BRL/USD foreign exchange rate of 4.74 and enhanced sales tax credits applicable in 2023. This new gas price is effective for all of our natural gas sales from both our Caburé and Murucututu fields as of August 1, 2023.
Financial and Operating Highlights – Second Quarter of 2023
Average daily sales decreased to 1,975 boepd (-29% from Q1 2023 and -16% from Q2 2022) due mainly to reduced production from our Caburé natural gas field as a result of higher nominated volumes from our partner.
Our average realized natural gas price increased to $12.86/Mcf, an 8% increase from Q2 2022 with the 3% increase in our contracted natural gas price and enhanced sales tax credits available in 2023. Compared to Q1 2023, our realized sales price increased 7% due mainly to the appreciation of the BRL to the USD in Q2. With the higher natural gas price, our overall realized price per boe increased to $77.41 (+6% from Q1 2023 and +5% from Q2 2022), despite lower Brent pricing on condensate sales.
Our natural gas, condensate and oil revenue was $13.9 million in Q2 2023, a decrease of $1.9 million compared to Q2 2022 (-12%) due to a 16% decrease in production partially offset by the increase in realized sales prices per boe.
Our operating netback improved to $69.61 per boe (+$3.00 per boe from Q1 2023 and +$5.65 per boe from Q2 2022) with a higher realized sales price and lower royalties, partially offset by the impact of fixed operating costs with lower sales volumes.
We generated funds flows from operations of $11.0 million ($0.30 per basic share and $0.29 per diluted share), a decrease of $1.4 million compared to Q2 2022 and $3.9 million compared to Q1 2023.
We reported net income of $9.9 million in Q2 2023, an increase of $3.2 million (+49%) compared to Q2 2022.
Capital expenditures totaled $8.5 million, including drilling cost for our BL-06 well on our Bom Lugar field, stimulation costs for our 197(1) well on our Murucututu field, and long-lead purchases for future capital projects.
Our working capital surplus was $18.1 million as of June 30, 2023, a decrease of $2.8 million from March 31, 2023, and an improvement of $3.4 million from December 31, 2022.
The following table provides a summary of Alvopetro’s financial and operating results for three and six months ended June 30, 2023 and June 30, 2022. The consolidated financial statements with the Management’s Discussion and Analysis (“MD&A”) are available on our website at www.alvopetro.com and will be available on the SEDAR+ website at www.sedarplus.ca.
As at and Three Months EndedJune 30,
As at and Six Months EndedJune 30,
2023
2022
Change
2023
2022
Change (%)
Financial
($000s, except where noted)
Natural gas, oil and condensate sales
13,914
15,787
(12)
32,074
29,759
8
Net income
9,852
6,631
49
22,054
17,746
24
Per share – basic ($)(1)
0.27
0.20
35
0.60
0.52
15
Per share – diluted ($)(1)
0.26
0.18
44
0.59
0.49
20
Cash flows from operating activities
13,473
12,997
4
27,329
21,330
28
Per share – basic ($)(1)
0.37
0.38
(3)
0.75
0.63
19
Per share – diluted ($)(1)
0.36
0.35
3
0.73
0.59
24
Funds flow from operations (2)
11,047
12,434
(11)
26,019
23,338
11
Per share – basic ($)(1)
0.30
0.37
(19)
0.71
0.69
3
Per share – diluted ($)(1)
0.29
0.34
(15)
0.69
0.64
8
Dividends declared
5,109
2,728
87
10,213
5,444
88
Per share(1)
0.14
0.08
75
0.28
0.16
75
Capital expenditures
8,521
6,338
34
11,812
10,138
17
Cash and cash equivalents
25,598
13,672
87
25,598
13,672
87
Net working capital surplus(2)
18,084
11,641
55
18,084
11,641
55
Working capital, net of debt(2)
18,084
9,096
99
18,084
9,096
99
Weighted average shares outstanding
Basic (000s)(1)
36,697
33,973
8
36,627
33,941
8
Diluted (000s)(1)
37,755
36,637
3
37,657
36,426
3
Operations
Natural gas, NGLs and crude oil sales:
Natural gas (Mcfpd)
11,269
13,546
(17)
13,520
13,940
(3)
NGLs – condensate (bopd)
92
97
(5)
111
98
13
Oil (bopd)
5
5
–
5
8
(38)
Total (boepd)
1,975
2,359
(16)
2,369
2,429
(2)
Average realized prices(2):
Natural gas ($/Mcf)
12.86
11.90
8
12.40
10.94
13
NGLs – condensate ($/bbl)
83.35
121.93
(32)
83.79
114.11
(27)
Oil ($/bbl)
63.93
94.47
(32)
68.00
83.90
(19)
Total ($/boe)
77.41
73.54
5
74.80
67.68
11
Operating netback ($/boe)(2)
Realized sales price
77.41
73.54
5
74.80
67.68
11
Royalties
(1.97)
(5.35)
(63)
(2.18)
(4.84)
(55)
Production expenses
(5.83)
(4.23)
38
(4.75)
(4.00)
19
Operating netback
69.61
63.96
9
67.87
58.84
15
Operating netback margin(2)
90 %
87 %
3
91 %
87 %
5
Notes:
(1) Per share amounts are based on weighted average shares outstanding other than dividends per share, which is based on the number of common shares outstanding at each dividend record date. The weighted average number of diluted common shares outstanding in the computation of funds flow from operations and cash flows from operating activities per share is the same as for net income per share.
(2) See “Non-GAAP and Other Financial Measures” section within this news release.
Q2 2023 Results Webcast
Alvopetro will host a live webcast to discuss our Q2 2023 financial results at 9:00 am Mountain time on Thursday August 10, 2023. Details for joining the event are as follows:
The webcast will include a question and answer period. Online participants will be able to ask questions through the Zoom portal. Dial-in participants can email questions directly to socialmedia@alvopetro.com.
Alvopetro Energy Ltd.’svision is to become a leading independent upstream and midstream operator in Brazil. Our strategy is to unlock the on-shore natural gas potential in the state of Bahia in Brazil, building off the development of our Caburé and Murucututu natural gas fields and our strategic midstream infrastructure.
Neither the TSX Venture Exchange nor its Regulation Services Provider (as that term is defined in the policies of the TSX Venture Exchange) accepts responsibility for the adequacy or accuracy of this news release.
Abbreviations:
$000s
=
thousands of U.S. dollars
bbls
=
barrels
boepd
=
barrels of oil equivalent (“boe”) per day
bopd
=
barrels of oil and/or natural gas liquids (condensate) per day
BRL
=
Brazilian Real
CAD
=
Canadian dollars
m3
=
cubic metre
Mcf
=
thousand cubic feet
Mcfpd
=
thousand cubic feet per day
MMcf
=
million cubic feet
MMcfpd
=
million cubic feet per day
NGLs
=
natural gas liquids
Q1 2023
=
three months ended March 31, 2023
Q2 2022
=
three months ended June 30, 2022
Q2 2023
=
three months ended June 30, 2023
Non-GAAP and Other Financial Measures
This news release contains references to various non-GAAP financial measures, non-GAAP ratios, capital management measures and supplementary financial measures as such terms are defined in National Instrument 52-112 Non-GAAP and Other Financial Measures Disclosure. Such measures are not recognized measures under GAAP and do not have a standardized meaning prescribed by IFRS and might not be comparable to similar financial measures disclosed by other issuers. While these measures may be common in the oil and gas industry, the Company’s use of these terms may not be comparable to similarly defined measures presented by other companies. The non-GAAP and other financial measures referred to in this report should not be considered an alternative to, or more meaningful than measures prescribed by IFRS and they are not meant to enhance the Company’s reported financial performance or position. These are complementary measures that are used by management in assessing the Company’s financial performance, efficiency and liquidity and they may be used by investors or other users of this document for the same purpose. Below is a description of the non-GAAP financial measures, non-GAAP ratios, capital management measures and supplementary financial measures used in this news release. For more information with respect to financial measures which have not been defined by GAAP, including reconciliations to the closest comparable GAAP measure, see the “Non-GAAP Measures and Other Financial Measures” section of the Company’s MD&A which may be accessed through the SEDAR+ website at www.sedarplus.ca.
Non-GAAP Financial Measures
Operating netback
Operating netback is calculated as natural gas, oil and condensate revenues less royalties and production expenses. This calculation is provided in the “Operating Netback” section of the Company’s MD&A using our IFRS measures. The Company’s MD&A may be accessed through the SEDAR+ website at www.sedarplus.ca. Operating netback is a common metric used in the oil and gas industry used to demonstrate profitability from operations.
Non-GAAP Financial Ratios
Operating netback per boe
Operating netback is calculated on a per unit basis, which is per barrel of oil equivalent (“boe”). It is a common non-GAAP measure used in the oil and gas industry and management believes this measurement assists in evaluating the operating performance of the Company. It is a measure of the economic quality of the Company’s producing assets and is useful for evaluating variable costs as it provides a reliable measure regardless of fluctuations in production. Alvopetro calculated operating netback per boe as operating netback divided by total sales volumes (barrels of oil equivalent). This calculation is provided in the “Operating Netback” section of the Company’s MD&A using our IFRS measures. The Company’s MD&A may be accessed through the SEDAR+ website at www.sedarplus.ca. Operating netback is a common metric used in the oil and gas industry used to demonstrate profitability from operations on a per unit basis (boe).
Operating netback margin
Operating netback margin is calculated as operating netback per boe divided by the realized sales price per boe. Operating netback margin is a measure of the profitability per boe relative to natural gas, oil and condensate sales revenues per boe and is calculated as follows:
Three Months EndedJune 30,
Six Months EndedJune 30,
2023
2022
2023
2022
Operating netback – $ per boe
69.61
63.96
67.87
58.84
Average realized price – $ per boe
77.41
73.54
74.80
67.68
Operating netback margin
90 %
87 %
91 %
87 %
Funds Flow from Operations Per Share
Funds flow from operations per share is a non-GAAP ratio that includes all cash generated from operating activities and is calculated before changes in non-cash working capital, divided by the weighted the weighted average shares outstanding for the respective period. For the periods reported in this news release the cash flows from operating activities per share and funds flow from operations per share is as follows:
Three Months EndedJune 30,
Six Months EndedJune 30,
$ per share
2023
2022
2023
2022
Per basic share:
Cash flows from operating activities
0.37
0.38
0.75
0.63
Funds flow from operations
0.30
0.37
0.71
0.69
Per diluted share:
Cash flows from operating activities
0.36
0.35
0.73
0.59
Funds flow from operations
0.29
0.34
0.69
0.64
Capital Management Measures
Funds Flow from Operations
Funds flow from operations is a non-GAAP capital management measure that includes all cash generated from operating activities and is calculated before changes in non-cash working capital. The most comparable GAAP measure to funds flow from operations is cash flows from operating activities. Management considers funds flow from operations important as it helps evaluate financial performance and demonstrates the Company’s ability to generate sufficient cash to fund future growth opportunities. Funds flow from operations should not be considered an alternative to, or more meaningful than, cash flows from operating activities however management finds that the impact of working capital items on the cash flows reduces the comparability of the metric from period to period. A reconciliation of funds flow from operations to cash flows from operating activities is as follows:
Three Months EndedJune 30,
Six Months EndedJune 30,
2023
2022
2023
2022
Cash flows from operating activities
13,473
12,997
27,329
21,330
(Deduct) add back changes in non-cash working capital
(2,426)
(563)
(1,310)
2,008
Funds flow from operations
11,047
12,434
26,019
23,338
Net Working Capital
Net working capital is computed as current assets less current liabilities. Net working capital is a measure of liquidity, is used to evaluate financial resources, and is calculated as follows:
As at June 30,
2023
2022
Total current assets
32,801
21,461
Total current liabilities
(14,717)
(9,820)
Net working capital surplus
18,084
11,641
Working Capital Net of Debt
Working capital net of debt is computed as net working capital surplus decreased by the carrying amount of the Credit Facility. Working capital net of debt is used by management to assess the Company’s overall financial position.
As at June 30,
2023
2022
Net working capital surplus
18,084
11,641
Credit Facility, balance outstanding
–
(2,545)
Working capital, net of debt
18,084
9,096
Supplementary Financial Measures
“Average realized natural gas price – $/Mcf” is comprised of natural gas sales as determined in accordance with IFRS, divided by the Company’s natural gas sales volumes.
“Average realized NGL – condensate price – $/bbl” is comprised of condensate sales as determined in accordance with IFRS, divided by the Company’s NGL sales volumes from condensate.
“Average realized oil price – $/bbl” is comprised of oil sales as determined in accordance with IFRS, divided by the Company’s oil sales volumes.
“Average realized price – $/boe” is comprised of natural gas, condensate and oil sales as determined in accordance with IFRS, divided by the Company’s total natural gas, condensate and oil sales volumes (barrels of oil equivalent).
“Dividends per share” is comprised of dividends declared, as determined in accordance with IFRS, divided by the number of shares outstanding at the dividend record date.
“Royalties per boe” is comprised of royalties, as determined in accordance with IFRS, divided by the total natural gas, condensate and oil sales volumes (barrels of oil equivalent).
“Production expenses per boe” is comprised of production expenses, as determined in accordance with IFRS, divided by the total natural gas, condensate and oil sales volumes (barrels of oil equivalent).
BOE Disclosure
The term barrels of oil equivalent (“boe”) may be misleading, particularly if used in isolation. A boe conversion ratio of six thousand cubic feet per barrel (6 Mcf/bbl) of natural gas to barrels of oil equivalence is based on an energy equivalency conversion method primarily applicable at the burner tip and does not represent a value equivalency at the wellhead. All boe conversions in this news release are derived from converting gas to oil in the ratio mix of six thousand cubic feet of gas to one barrel of oil.
Forward-Looking Statements and Cautionary Language
This news release contains forward-looking information within the meaning of applicable securities laws. The use of any of the words “will”, “expect”, “intend” and other similar words or expressions are intended to identify forward-looking information. Forward‐looking statements involve significant risks and uncertainties, should not be read as guarantees of future performance or results, and will not necessarily be accurate indications of whether or not such results will be achieved. A number of factors could cause actual results to vary significantly from the expectations discussed in the forward-looking statements. These forward-looking statements reflect current assumptions and expectations regarding future events. Accordingly, when relying on forward-looking statements to make decisions, Alvopetro cautions readers not to place undue reliance on these statements, as forward-looking statements involve significant risks and uncertainties. More particularly and without limitation, this news release contains forward-looking statements concerning concerning plans relating to the Company’s operational activities, proposed exploration development activities and the timing for such activities, exploration and development prospects of Alvopetro, capital spending levels, future capital and operating costs, future production and sales volumes, production allocations from the Caburé natural gas field, the expected natural gas price, gas sales and gas deliveries under Alvopetro’s long-term gas sales agreement, the expected timing of testing the BL-06 well and production commencement from the BL-06 well, anticipated duration of drilling operations for the 183-A3 well, anticipated timing for upcoming drilling and testing of other wells, projected financial results, the expected timing and outcomes of certain of Alvopetro’s testing activities, and sources and availability of capital. Forward-looking statements are necessarily based upon assumptions and judgments with respect to the future including, but not limited to, expectations and assumptions concerning the timing of regulatory licenses and approvals, equipment availability, the success of future drilling, completion, testing, recompletion and development activities and the timing of such activities, the performance of producing wells and reservoirs, well development and operating performance, expectations regarding Alvopetro’s working interest and the outcome of any redeterminations, environmental regulation, including regulation relating to hydraulic fracturing and stimulation, the ability to monetize hydrocarbons discovered, the outlook for commodity markets and ability to access capital markets, foreign exchange rates, general economic and business conditions, forecasted demand for oil and natural gas, the impact of global pandemics, weather and access to drilling locations, the availability and cost of labour and services, the regulatory and legal environment and other risks associated with oil and gas operations. The reader is cautioned that assumptions used in the preparation of such information, although considered reasonable at the time of preparation, may prove to be incorrect. Actual results achieved during the forecast period will vary from the information provided herein as a result of numerous known and unknown risks and uncertainties and other factors. In addition, the declaration, timing, amount and payment of future dividends remain at the discretion of the Board of Directors. Although we believe that the expectations and assumptions on which the forward-looking statements are based are reasonable, undue reliance should not be placed on the forward-looking statements because we can give no assurance that they will prove to be correct. Since forward looking statements address future events and conditions, by their very nature they involve inherent risks and uncertainties. Actual results could differ materially from those currently anticipated due to a number of factors and risks. These include, but are not limited to, risks associated with the oil and gas industry in general (e.g., operational risks in development, exploration and production; delays or changes in plans with respect to exploration or development projects or capital expenditures; the uncertainty of reserve estimates; the uncertainty of estimates and projections relating to production, costs and expenses, reliance on industry partners, availability of equipment and personnel, uncertainty surrounding timing for drilling and completion activities resulting from weather and other factors, changes in applicable regulatory regimes and health, safety and environmental risks), commodity price and foreign exchange rate fluctuations, market uncertainty associated with financial institution instability, and general economic conditions. The reader is cautioned that assumptions used in the preparation of such information, although considered reasonable at the time of preparation, may prove to be incorrect. Although Alvopetro believes that the expectations and assumptions on which such forward-looking information is based are reasonable, undue reliance should not be placed on the forward-looking information because Alvopetro can give no assurance that it will prove to be correct. Readers are cautioned that the foregoing list of factors is not exhaustive. Additional information on factors that could affect the operations or financial results of Alvopetro are included in our annual information form which may be accessed on Alvopetro’s SEDAR+ profile at www.sedarplus.ca. The forward-looking information contained in this news release is made as of the date hereof and Alvopetro undertakes no obligation to update publicly or revise any forward-looking information, whether as a result of new information, future events or otherwise, unless so required by applicable securities laws.
ACCO Brands Corporation is one of the world’s largest designers, marketers and manufacturers of branded academic, consumer and business products. Our widely recognized brands include AT-A-GLANCE®, Esselte®, Five Star®, GBC®, Kensington®, Leitz®, Mead®, PowerA®, Quartet®, Rapid®, Rexel®, Swingline®, Tilibra®, and many others. Our products are sold in more than 100 countries around the world. More information about ACCO Brands, the Home of Great Brands Built by Great People, can be found at www.accobrands.com.
Joe Gomes, Managing Director, Equity Research Analyst, Generalist , Noble Capital Markets, Inc.
Joshua Zoepfel, Research Associate, Noble Capital Markets, Inc.
Refer to the full report for the price target, fundamental analysis, and rating.
Margin Focus Remains. Management remains laser focused on restoring margins. In 2Q23, gross margin improved by 450 basis points and adjusted operating margin improved 220 bp year-over-year. The Company upped its full year gross margin goal to 31%-32% from a prior 30.5%. The longer-term goal is for gross margin to return to the 33%+ level.
Debt Reduction to Pay Dividends. Strong cash flow in 1H23 enabled ACCO to reduce its net leverage ratio to 4.3x at the end of the quarter, with management expecting the ratio to be in the 3.3x-3.5x range, below the old 3.5x-3.7x range, by year end. As debt declines, it positively impacts interest expense, providing additional capital to continue reducing debt levels or invest in the business.
Equity Research is available at no cost to Registered users of Channelchek. Not a Member? Click ‘Join’ to join the Channelchek Community. There is no cost to register, and we never collect credit card information.
This Company Sponsored Research is provided by Noble Capital Markets, Inc., a FINRA and S.E.C. registered broker-dealer (B/D).
*Analyst certification and important disclosures included in the full report. NOTE: investment decisions should not be based upon the content of this research summary. Proper due diligence is required before making any investment decision.
Mark Reichman, Managing Director, Equity Research Analyst, Natural Resources, Noble Capital Markets, Inc.
Refer to the full report for the price target, fundamental analysis, and rating.
Successful collaboration with Koch. Century Lithium is collaborating with Koch Technology Solutions (KTS) in the application of Koch’s proprietary Li-Pro direct lithium extraction (DLE) process. In April, Century installed equipment from KTS and has operated the equipment at the pilot plant with significantly improved results.
Li-Pro leads to a higher grade lithium concentrate. With the integration of KTS’s DLE process, the grades of the intermediate lithium solution produced at the pilot plant have increased to the highest levels to date with an average grade of 7.5 grams per liter or 7,500 parts per million lithium. Lithium concentrations are four times higher than previously produced and unwanted elements in the final solution have been reduced. The process has resulted in the complete removal of calcium and magnesium along with significant reductions of sodium and potassium.
Equity Research is available at no cost to Registered users of Channelchek. Not a Member? Click ‘Join’ to join the Channelchek Community. There is no cost to register, and we never collect credit card information.
This Company Sponsored Research is provided by Noble Capital Markets, Inc., a FINRA and S.E.C. registered broker-dealer (B/D).
*Analyst certification and important disclosures included in the full report. NOTE: investment decisions should not be based upon the content of this research summary. Proper due diligence is required before making any investment decision.