Does the FDA Provide Information that Helps Pharmaceutical Stock Investors?
Investors with a “Stocks on the Move” or “Market Movers” window open sometimes witness a stock climb double or triple digits during a single trading day. It often turns out that it’s a drug company that just passed an FDA milestone. When this happens, these companies have the potential for large movements. The natural question investors ask is, how does one become more aware that there may be an extreme movement in a biotech, or pharmaceutical stock? For wisdom on this subject, I turned to Robert LeBoyer, the Senior Life Sciences Analyst at Noble Capital Markets. Below, cutting through many complex details and variables, is what I discovered from the veteran equity analyst.
The key is to first understand the framework of the FDA approval process. This will help an investor understand the significance of activity and even where to find key dates and imminent decision periods. Especially toward the end of the process, it is especially then when there are events that could rocket the company stock or cause it to retreat. These are PDUFA calendar deadlines and advisory panel meeting dates. Below is an outline of the process and key dates that may allow investors to position themselves to take advantage of any big jump (or even sudden decline) in a biotech’s stock price.
Understanding The FDA Approval Process
The FDA is responsible for regulating the safety and efficacy of drugs and medical devices in the United States. The review process for new drug applications falls under the legally required format called the Prescription Drug User Fee Act (PDUFA).
PDUFA requires the FDA to collect fees from drug developers to fund the review process, in exchange, the FDA has an obligation to answer the application within ten months. The PDUFA legislation has improved the process for companies seeking FDA approval helping to speed the review process. The fees collected are used to hire additional staff and overall improve the FDA’s review process. This avenue has many benefits. It accelerates the process for the companies that are seeking approval as the FDA can afford greater resources, it benefits the taxpayers as the FDA is then subsidized by those that use its service to review potential products, and it helps those with medical conditions that may benefit from a new drug or class of therapy coming to market sooner as a result of the FDA having greater resources.
The first step is pre-clinical testing in animals for indications of effectiveness and toxicity in a laboratory. If satisfactory, it clears the way for the company to submit an investigational new drug application (IND) to the FDA. The overriding goal of pre-clinical testing is to demonstrate that the product safe to then be tested in humans. The IND application outlines what the sponsor of the new drug proposes for human testing in clinical trials. Once reviewed and granted the company can move to clinical trials.
Clinical Trials
Clinical Trials are done in three phases designed to determine the drug candidate’s safety, characterization, and proof of efficacy.
Phase 1 studies (typically involves 20 to 80 people).
This phase involves testing the drug candidate on a small group of healthy volunteers to assess the drug’s safety and determine the appropriate dosage range. The primary goal is to verify safety and to identify any potential side effects.
Phase 2 studies (typically involve a few dozen to about 300 people).
This phase involves testing the drug on a larger trial group of patients that have the condition the drug is intended to treat. In this phase, the developer determines the drug’s efficacy, optimal dosage, and potential side effects. The primary goal is to assess and characterize the drug’s effectiveness in treating the targeted condition. Stocks will sometimes move on Phase 2 effiacy results.
Phase 3 studies (typically involve several hundred to about 3,000 people).
This final clinical study phase involves testing the drug on an even larger and intentionally diversified group of patients with the very condition the drug is intended to treat. These clinical trials are randomized and controlled to confirm the drug’s safety and efficacy in comparasin to existing treatments, a placebo, or both. The primary goal is to demonstrate statistically significant benefit, as defined by the trial parameters.
The announcement of Phase 3 results is a huge milestone, and by itself ordinarily impacts a stock’s price.
According to the Congressional Budget Office (CBO) only about 12 percent of drugs entering clinical trials are ultimately approved for introduction by the FDA. But it is costly; estimates of the average R&D cost per new drug range from less than $1 billion to more than $2 billion per drug. So in addition to being expensive, it’s an uncertain process – many potential drugs never make it to market. This is why full FDA approval, which isn’t automatic after a successful Phase 3 clinical trial, can create an huge upswing, even when expected.
Several things can go wrong during the three phases; these include unexpected side effects or toxicity, lack of efficacy, or failure to meet the primary endpoints of the clinical trial. The developer may even find that it is less effective than current medications. These issues can lead to delays in the approval process, additional studies, or even the termination of the drug’s development.
However, if the clinical trials are successful, the company is ready to file a New Drug Application with the FDA.
FDA Panels are experts with knowledge specific to what is being reviewed (Source: FDA)
New Drug Application (NDA)
There is a pre-NDA period, just before a new drug application is submitted to the FDA. At this time the company may seek guidance from the FDA on the new drug process.
The Submission of an NDA is the formal step that asks the FDA to consider the drug for approval to market. The FDA then has 60 days to decide whether the application gets filed for review. If the FDA files to review the NDA, an FDA review team is assigned to evaluate the sponsor’s research on the drug’s safety and effectiveness.
The FDA review includes a product label approval which includes how the drug can be used. This is very important because the drug can only be marketed within the label indications. The FDA also will inspect the facilities where the drug will be manufactured as part of the approval process.
FDA reviewers will either approve the application or instead issue a complete response letter.
PDUFA Calendar
The FDA PDUFA calendar is a schedule of dates for upcoming PDUFA decisions. These dates are important to investors in biotech and pharmaceutical companies because they represent the time period when the FDA will make a decision about a new drug application. If a drug is approved, it can eventually generate significant revenue for the company, while rejection can lead to a decline in the stock price as investors are disappointed.
Updates direct from the FDA on their calendar and meeting schedule can be subscribed to here.
Advisory Panel
In addition to PDUFA dates, there are other FDA events that can trigger movement in biotech and pharmaceutical stocks. These events include advisory committee meetings, which are meetings where a panel of experts provides recommendations to the FDA on whether to approve a drug or not. These meetings can provide insight into the FDA’s thinking and can influence the stock price.
A schedule of FDA Advisory Panel meetings can be found here.
Advisory committees make non-binding recommendations to the FDA, which generally follows the recommendations but is not legally bound to do so.
Other events that can impact the stock price include Complete Response Letters (CRLs), which are letters from the FDA that outline deficiencies in a drug application and can delay approval. Additionally, FDA inspections of manufacturing facilities can impact the stock price if there are concerns about quality control or manufacturing processes.
Take Away
Investors looking to grow their watch list to include biotech stocks that are in line to receive positive news that could drive the stock value way up or even disappointing news that would weigh on the price, could pay attention to the FDA approval process.
The process is an important tool for biotech and pharmaceutical companies, investors, and analysts. PDUFA dates represent the time when the FDA will make a decision about a new drug application, and can have a significant impact on the stock price. However, there are other FDA events that can also impact the stock price, such as advisory committee meetings, CRLs, and manufacturing facility inspections. It is helpful to stay informed about these events to make knowledgeable investment decisions in the biotech and pharmaceutical industry.
Basics for Individuals Looking to Use Futures in Investing
Should you use futures in investing your portfolio? Futures trading can be an exciting and potentially lucrative investment opportunity for those who are willing to assume the risks involved. The contracts allow investors to trade a wide range of assets, from commodities like oil and gold to financial instruments like stock indices and currencies. Below we’ll explore what futures trading is, what types of assets are traded in the futures market, the advantages and disadvantages of futures trading, and what beginners should know about trading platforms and the Chicago Mercantile Exchange (CME).
Background
Futures were originally designed to allow buyers and sellers of raw materials to lock in a price and know their future costs to avoid being impacted by factors affecting the commodity’s price, like weather. The market later grew to help other businesses, such as utilities and airlines, hedge against unknown fuel costs – and the products continue to expand today. Currently, futures are being used by all manners of investors, speculators, and those that want to hedge against the risk of future cost spikes.
This has made for deep markets, the trading volume in futures contracts, is now often a multiple of the trading of the underlying physical assets. This is the case with oil futures contracts. The addition of professional and individual investors and speculators has dramatically increased trading volume. This helped make the financial products extremely liquid compared to when they just functioned as insurance against manufacturing price risk.
It is no surprise, then, that many speculators are drawn to futures trading, both for the potential of outsized profits and the ability to have exposure to assets that may otherwise not be accessible to the investor.
What is Futures Trading?
A futures contract is an agreement to buy or sell an asset at a specified price and time in the future. Futures contracts are traded on organized exchanges, such as the CME, which provide a platform for buyers and sellers to trade contracts. Unlike stocks or bonds, futures contracts are derivative products, meaning that their value is derived from the underlying asset. The underlying asset can be a physical commodity, such as gold or oil, or a financial instrument, such as a stock index or a currency.
Terms Used in Futures Trading
Before making any transaction, especially investing in futures contracts, it is critical to understand some of the most used key terms in futures trading:
Contract Size: The amount of the underlying asset covered by one futures contract.
Contract Expiration: The date when the futures contract expires.
Margin: The amount of money an investor must deposit to buy or sell a futures contract.
Settlement: The process of fulfilling the terms of a futures contract by exchanging the underlying asset or its cash value.
Types of Assets Traded in the Futures Market
As mentioned earlier, there continue to be new types of futures contracts being brought to market. The futures market offers a wide range of assets that can be traded through futures contracts. Some of the more commonly traded assets among self-directed traders include:
Commodities: Futures contracts are frequently used to trade commodities like crude oil, gold, silver, and agricultural products like wheat and corn.
Financial Instruments: Futures contracts are also used to trade financial instruments like stock indices, bonds, and currencies.
Advantages and Disadvantages of Futures Trading
Like any investment opportunity, futures trading has its advantages and disadvantages. Here are a few of the key advantages and disadvantages of investing in futures contracts:
Advantages:
Leverage: Futures contracts offer investors the ability to leverage their investment, meaning that they can control a larger amount of the underlying asset with a smaller amount of capital.
Diversification: Futures contracts provide investors with a way to diversify their portfolio by investing in a wide range of assets.
Liquidity: The futures market is highly liquid, meaning that investors can easily buy and sell contracts without impacting the market.
Disadvantages:
Risk: Futures trading is a highly speculative investment opportunity and involves significant risk. A futures position can also quickly turn against you – the high leverage could make matters worse this is because margin magnifies both profits and losses.
Complexity: Futures trading can be complex and requires a good understanding of the underlying asset and market conditions. Often there are factors that impact price movements that are well beyond the ability of an individual to account for.
Costs: Futures trading can be expensive, while commissions on future trades are very low and are charged when the position is closed, usually as low as 0.5% of the contract value, the spread between the bid and offer may be wide which could impact costs when it’s time to close out the position.
What is the CME?
The Chicago Mercantile Exchange, or The Merc is one of the largest and most well-known futures exchanges in the world. It offers a platform for trading futures contracts on a wide range of assets, including commodities, financial instruments, and currencies. The CME also provides a range of resources for investors, including market data, trading tools, and educational materials.
What Should Self-Directed Investors Look for in a Trading Platform?
Self-directed investors who are interested in trading futures contracts should look for a trading platform that doesn’t limit their growth as a trader. As such it should offer a range of broad range features and resources. Here are a few key features beginner futures traders look for:
Easy-to-use interface: Auser-friendly interface can make it easier for investors to navigate the trading platform and place trades. A complex and confusing interface can make it difficult for investors to execute trades quickly and efficiently, which could result in missed opportunities or costly mistakes. If you are currently using a platform for stock trading, see if they have ample futures capabilities. At times, comfort and familiarity navigating a platform can make all the difference.
Mobile compatibility: Many investors prefer to trade on-the-go using their mobile devices. A good trading platform should be compatible with mobile devices, allowing investors to monitor their trades and make trades from anywhere with an internet connection.
Access to market data: This would seem basic, but access to real-time market data, including price quotes, charts, and news feeds, is essential. This information can keep you looking at what is occurring now, not 20 minutes ago before a market-moving economic report was released.
Advanced order types: The ability to place advanced order types, such as stop-loss and limit orders, can help investors manage their risk and control their trades more effectively.
Educational resources: Futures trading can be complex and requires a good understanding of the underlying asset and market conditions. A good trading platform should provide investors with access to educational resources, such as articles, tutorials, and webinars, to help them learn about futures trading and stay up-to-date on market trends.
Commission and fees: Trading fees can add up quickly and eat into profits. It is important to choose a trading platform that offers competitive commission and fees, without sacrificing the quality of service or features offered.
Take Away
Investing in futures contracts has developed to include many different underlying asset types. It has also become much easier for the individual and average investor to be involved. The leverage magnifies moves, this can be a high-risk, high-reward trading experience.
Before investing, it is important to understand the risks and benefits of futures trading, as well as the key terms and concepts used in the futures market. Choosing the right trading platform can also be crucial to success, as it can provide investors with the tools, resources, and support needed to make informed trading decisions and stay ahead of the market.
ZyVersa is advancing a dynamic pipeline of drug candidates with multiple programs built around two proprietary technologies – Cholesterol Efflux Mediator™ VAR 200 for treatment of kidney diseases, and Inflammasome ASC Inhibitor IC 100 for treatment of multiple CNS and other inflammatory diseases
Mr. Glover welcomes one-on-one meetings with registered investors to discuss ZyVersa’s technology, pipeline assets, and key development milestones
WESTON, Fla., May 11, 2023 (GLOBE NEWSWIRE) — ZyVersa Therapeutics, Inc. (Nasdaq: ZVSA, or “ZyVersa”), a clinical stage specialty biopharmaceutical company developing first-in-class drugs for the treatment of renal and inflammatory diseases with high unmet medical needs, announces that Stephen C. Glover, Co-Founder, Chairman, Chief Executive Officer, and President, will participate in A.G.P.’s Virtual Healthcare Conference being held May 23 – 24, 2023.
“We are pleased to have the opportunity to schedule virtual one-on-one meetings with registered investors during A.G.P.’s Virtual Healthcare Conference to discuss ZyVersa’s technology, pipeline assets, and key development milestones,” stated Mr. Glover. “ZyVersa is currently advancing two product candidates, Phase 2a-ready Cholesterol Efflux Mediator™ VAR 200 designed to ameliorate renal lipid accumulation that damages the kidneys’ filtration system in patients with glomerular diseases, and Inflammasome ASC Inhibitor IC 100 in development to block initiation and perpetuation of damaging inflammation associated with numerous inflammatory diseases.”
To learn more about ZyVersa and its differentiated product pipeline, please schedule a one-on-one meeting with Mr. Glover by contacting an A.G.P. representative or by emailing A.G.P. Events at agpevents@allianceg.com.
About ZyVersa Therapeutics, Inc.
ZyVersa (Nasdaq: ZVSA) is a clinical stage specialty biopharmaceutical company leveraging advanced, proprietary technologies to develop first-in-class drugs for patients with renal and inflammatory diseases who have significant unmet medical needs. The Company is currently advancing a therapeutic development pipeline with multiple programs built around its two proprietary technologies – Cholesterol Efflux Mediator™ VAR 200 developed to ameliorate renal lipid accumulation that damages the kidneys’ filtration system in patients with glomerular kidney diseases, and Inflammasome ASC Inhibitor IC 100, targeting damaging inflammation associated with numerous CNS and other inflammatory diseases. For more information, please visit www.zyversa.com.
Certain statements contained in this press release regarding matters that are not historical facts, are forward-looking statements within the meaning of Section 21E of the Securities Exchange Act of 1934, as amended, and the Private Securities Litigation Reform Act of 1995. These include statements regarding management’s intentions, plans, beliefs, expectations, or forecasts for the future, and, therefore, you are cautioned not to place undue reliance on them. No forward-looking statement can be guaranteed, and actual results may differ materially from those projected. ZyVersa Therapeutics, Inc (“ZyVersa”) uses words such as “anticipates,” “believes,” “plans,” “expects,” “projects,” “future,” “intends,” “may,” “will,” “should,” “could,” “estimates,” “predicts,” “potential,” “continue,” “guidance,” and similar expressions to identify these forward-looking statements that are intended to be covered by the safe-harbor provisions. Such forward-looking statements are based on ZyVersa’s expectations and involve risks and uncertainties; consequently, actual results may differ materially from those expressed or implied in the statements due to a number of factors, including ZyVersa’s plans to develop and commercialize its product candidates, the timing of initiation of ZyVersa’s planned preclinical and clinical trials; the timing of the availability of data from ZyVersa’s preclinical and clinical trials; the timing of any planned investigational new drug application or new drug application; ZyVersa’s plans to research, develop, and commercialize its current and future product candidates; the clinical utility, potential benefits and market acceptance of ZyVersa’s product candidates; ZyVersa’s commercialization, marketing and manufacturing capabilities and strategy; ZyVersa’s ability to protect its intellectual property position; and ZyVersa’s estimates regarding future revenue, expenses, capital requirements and need for additional financing.
New factors emerge from time-to-time, and it is not possible for ZyVersa to predict all such factors, nor can ZyVersa assess the impact of each such factor on the business or the extent to which any factor, or combination of factors, may cause actual results to differ materially from those contained in any forward-looking statements. Forward-looking statements included in this press release are based on information available to ZyVersa as of the date of this press release. ZyVersa disclaims any obligation to update such forward-looking statements to reflect events or circumstances after the date of this press release, except as required by applicable law.
This press release does not constitute an offer to sell, or the solicitation of an offer to buy, any securities.
Corporate and IR Contact: Karen Cashmere Chief Commercial Officer kcashmere@zyversa.com 786-251-9641
Media Contacts Tiberend Strategic Advisors, Inc. Casey McDonald cmcdonald@tiberend.com 646-577-8520
FatburgerGains Momentum,Great American Cookies, Marble Slab Creamery,Buffalo’s Express Make Debut
LOS ANGELES, May 11, 2023 (GLOBE NEWSWIRE) — FAT (Fresh. Authentic. Tasty.) Brands Inc., parent company of Fatburger, Buffalo’s Express, Great American Cookies, Marble Slab Creamery, and 13 other restaurant concepts, announces a new development deal to open 22 new franchised locations in Iraq. In partnership with Global Vita USA LLC, 12 co-branded Fatburger and Buffalo’s Express locations will open throughout the country outside of the Kurdistan region over the next five years with the first units set to open in 2024. Ten co-branded Great American Cookies and Marble Slab Creamery units will also arrive throughout the country, opening in the next five years with the first locations set to open in 2024.
“With four units already operating in the Kurdistan region, Fatburger has established a strong following in the country,” said Taylor Wiederhorn, Chief Development Officer of FAT Brands. “Now, as we look to further expand the brand with Global Vita USA, we can reach even more fans that crave our all-American, custom-built burgers. This is new territory for Great American Cookies, Marble Slab Creamery, and Buffalo’s Express, however, the brands have had a presence in the Middle East for some time, so this is a natural progression for the concepts to strengthen their foothold in the region.”
Ever since the first Fatburger opened in Los Angeles 70 years ago, the chain has been known for its delicious, grilled-to-perfection and cooked-to-order burgers. Founder Lovie Yancey believed that a big burger with everything on it is a meal in itself; at Fatburger “everything” is not just the usual roster of toppings. Burgers can be customized with everything from bacon and eggs to chili and onion rings. In addition to its famous burgers, the Fatburger menu also includes Fat and Skinny Fries, sweet potato fries, scratch-made onion rings, Impossible™ Burgers, turkeyburgers, hand-breaded crispy chicken sandwiches, and hand-scooped milkshakes made from 100% real ice cream.
A perfect complement to Fatburger, Buffalo’s Express menu includes delicious bone-in and boneless chicken wings accompanied by a range of original sauces. All of Buffalo’s Express’ wings are accompanied by celery, carrots, and blue cheese, ranch or honey mustard dressing.
For nearly 40 years, Marble Slab Creamery has been an innovator in the ice cream space, dreaming up the frozen slab technique and offering homemade, small-batch ice cream with free unlimited mix-ins, shakes in a variety of flavors, and ice cream cakes.
Since 1977, Great American Cookies has baked up a reputation for not only being the creator of the Original Cookie Cake, but also for its famous chocolate chip cookie recipe. Other crave-able menu items include brownies and Double Doozies™, delectable icing sandwiched between two cookies.
About FAT (Fresh. Authentic. Tasty.) Brands FAT Brands (NASDAQ: FAT) is a leading global franchising company that strategically acquires, markets, and develops fast casual, quick-service, casual dining, and polished casual dining concepts around the world. The Company currently owns 17 restaurant brands: Round Table Pizza, Fatburger, Marble Slab Creamery, Johnny Rockets, Fazoli’s, Twin Peaks, Great American Cookies, Hot Dog on a Stick, Buffalo’s Cafe & Express, Hurricane Grill & Wings, Pretzelmaker, Elevation Burger, Native Grill & Wings, Yalla Mediterranean and Ponderosa and Bonanza Steakhouses, and franchises and owns over 2,300 units worldwide. For more information on FAT Brands, please visit www.fatbrands.com.
About Fatburger
An all-American, Hollywood favorite, Fatburger is a fast-casual restaurant serving big, juicy, tasty burgers, crafted specifically to each customer’s liking. With a legacy spanning 70 years, Fatburger’s extraordinary quality and taste inspire fierce loyalty amongst its fan base, which includes a number of A-list celebrities and athletes. Featuring a contemporary design and ambience, Fatburger offers an unparalleled dining experience, demonstrating the same dedication to serving gourmet, homemade, custom-built burgers as it has since 1952 – The Last Great Hamburger Stand™.
About Buffalo’s Express
Founded in 1985 in Roswell, Georgia, Buffalo’s Express is a fast-casual chain known for its world-famous chicken wings and proprietary wing sauces. Co-branded with over 100 Fatburger restaurants to date, Buffalo’s Express’ significant growth can be attributed to its high-quality menu offerings and unparalleled dining experience. Featuring a contemporary design and ambience, whether guests are dining-in or having take-out/delivery, Buffalo’s Express offers friends and families the flexibility to enjoy their world-famous chicken wings however they prefer. Buffalo’s Express – Where Everyone is Family™.
About Great American Cookies
Founded on a family chocolate chip cookie recipe in 1977, Great American Cookies believes that pure, simple delight is part of living a full life. Serving the Original Cookie Cake, fresh baked cookies in a variety of flavors, brownies, and Double Doozies™, we promise to treat you to bites of bliss that prove how sweet life can be. With more than 370 bakeries across the country and internationally in Bahrain, Guam, Saudi Arabia, and treats available to ship right to your door, the sweet spot is always close to home. For more information, visit www.greatamericancookies.com.
About Marble Slab Creamery Since dreaming up the frozen slab technique and serving fresh homemade, small-batch ice cream in-store since 1983, Marble Slab Creamery has always known how to dream big. We sprinkle our customers with imagination and promise to inspire with infinite ice cream possibilities to feed your curiosity and capture cravings. With our free unlimited mix-in philosophy, delicious ice cream and shakes in a variety of flavors, hand-rolled waffle cones, and ice cream cakes, imagination has no limits. Today, Marble Slab Creamery is enjoyed by consumers across the globe with locations in Bahrain, Bangladesh, Canada, Kuwait, Pakistan, Saudi Arabia, Guam, Puerto Rico, and the United States. For more information, visit www.marbleslab.com.
Forward Looking Statements
This press release contains forward-looking statements within the meaning of the Private Securities Litigation Reform Act of 1995, including statements relating to the timing and performance of new store openings. Forward-looking statements reflect expectations of FAT Brands Inc. (“we”, “our” or the “Company”) concerning the future and are subject to significant business, economic and competitive risks, uncertainties and contingencies, including but not limited to uncertainties surrounding the severity, duration and effects of the COVID-19 pandemic. These factors are difficult to predict and beyond our control, and could cause our actual results to differ materially from those expressed or implied in such forward-looking statements. We refer you to the documents that we file from time to time with the Securities and Exchange Commission, such as our reports on Form 10-K, Form 10-Q and Form 8-K, for a discussion of these and other factors. We undertake no obligation to update any forward-looking statement to reflect events or circumstances occurring after the date of this press release.
Prior data provide clinical proof-of-concept for narazaciclib’s mechanism of action in endometrial cancer
Preliminary data from trial’s Phase 1 portion expected in 4Q 2023
NEWTOWN, Pa., May 11, 2023 (GLOBE NEWSWIRE) — Onconova Therapeutics, Inc. (NASDAQ: ONTX), (“Onconova”), a clinical-stage biopharmaceutical company focused on discovering and developing novel products for patients with cancer, today announced that the first patient has been dosed in the Company’s Phase 1/2a trial evaluating narazaciclib combined with letrozole in recurrent metastatic low-grade endometrioid endometrial cancer (LGEEC). Narazaciclib is a multi-kinase inhibitor targeting CDK 4, CDK 6, and other kinases important for cell proliferation and motility. Preliminary data from the trial’s Phase 1 portion are expected in 4Q 2023.
Endometrial cancer arises in the uterine lining and is the most common cancer of the female reproductive organs. Endometrioid endometrial cancer is the most common subtype of endometrial cancer, accounting for approximately 75% of cases. Data from prior randomized and single-arm trials have demonstrated the anti-cancer activity of letrozole combined with CDK 4/6 inhibition in recurrent endometrial cancer1-3. Currently, there is no health authority-approved CDK 4/6 inhibitor for the treatment of endometrial cancer.
“Improved treatment options for recurrent LGEEC are urgently needed, as the CDK 4/6 inhibitors currently used off-label for this indication are marked by limitations related to safety, tolerability, and treatment resistance,” said Bhavana Pothuri, M.D., Professor, Department of Obstetrics and Gynecology at NYU Grossman School of Medicine and Director, Gynecologic Oncology Research; Perlmutter Cancer Center and Principal Investigator of the trial. “Narazaciclib’s kinase inhibitory profile suggests it can overcome each of these limitations thanks to reduced activity against kinases whose inhibition is associated with bone marrow toxicity and diarrhea, and increased activity against those implicated in pro-tumor immune suppression and cancer cell survival. This hypothesis is supported by data from in vitro and murine cancer models, and I look forward to its continued evaluation in the ongoing Phase 1/2a trial.”
Steven M. Fruchtman, M.D., President and Chief Executive Officer of Onconova, commented, “Our recurrent LGEEC program provides an opportunity to establish narazaciclib as a best-in-class therapy in an indication where clinical proof-of-concept for its mechanism of action has been demonstrated. We, therefore, view the program as a key avenue for value creation and look forward to our Phase 1/2a trial’s preliminary data readout expected later this year.”
About the Phase 1/2a Trial
The Phase 1/2a trial is an open-label, multicenter study evaluating narazaciclib in combination with letrozole as a second or third-line treatment for patients with recurrent metastatic LGEEC. Both narazaciclib and letrozole are administered orally with a continuous daily dosing schedule. The trial begins with a Phase 1 dose escalation phase before moving to a Phase 2 expansion cohort designed to enroll approximately 30 patients. The primary objective of the Phase 1 portion of the trial is to evaluate safety, tolerability, pharmacokinetics, and pharmacodynamics in order to determine a recommended Phase 2 dose (RP2D) of the combination. The primary objective of the Phase 2 portion will be to evaluate the efficacy of the combination at the RP2D, as measured by progression-free survival at 24 weeks. The estrogen/progesterone receptor status of participants will be recorded as part of an exploratory objective. The trial will be conducted at sites including NYU Langone Health, the site of the Principal Investigator of the study, sites affiliated with MD Anderson Cancer Center, and U.S. Oncology Research sites.
References
1. Mirza MR. ESMO Virtual Congress 2020. Abstr. LBA28.
2. Konstantinopoulos PA, et al.; 2022 SGO Annual Meeting on Women’s Cancer; March 18-21, 2022. Phoenix, AZ
Onconova Therapeutics is a clinical-stage biopharmaceutical company focused on discovering and developing novel products for patients with cancer. The Company has proprietary targeted anti-cancer agents designed to disrupt specific cellular pathways that are important for cancer cell proliferation.
Onconova’s novel, proprietary multi-kinase inhibitor narazaciclib (formerly ON 123300) is being evaluated in a combination trial with estrogen blockade in advanced endometrial cancer. Based on preclinical and clinical studies of CDK 4/6 inhibitors, Onconova is also evaluating opportunities for combination studies with narazaciclib in additional indications.
Onconova’s product candidate rigosertib is being studied in multiple investigator-sponsored studies, including a dose-escalation and expansion Phase 1/2a study of oral rigosertib in combination with nivolumab in patients with KRAS+ non-small cell lung cancer, and a Phase 2 program evaluating rigosertib monotherapy in advanced squamous cell carcinoma complicating recessive dystrophic epidermolysis bullosa.
Some of the statements in this release are forward-looking statements within the meaning of Section 27A of the Securities Act of 1933, as amended, Section 21E of the Securities Exchange Act of 1934, as amended, and the Private Securities Litigation Reform Act of 1995, and involve risks and uncertainties. These statements relate to Onconova’s expectations regarding its clinical development and trials, its product candidates, its business and financial position. Onconova has attempted to identify forward-looking statements by terminology including “believes,” “estimates,” “anticipates,” “expects,” “plans,” “intends,” “may,” “could,” “might,” “will,” “should,” “preliminary,” “encouraging,” “approximately” or other words that convey uncertainty of future events or outcomes. Although Onconova believes that the expectations reflected in such forward-looking statements are reasonable as of the date made, expectations may prove to have been materially different from the results expressed or implied by such forward-looking statements. These statements are only predictions and involve known and unknown risks, uncertainties, and other factors, including the success and timing of Onconova’s clinical trials, investigator-initiated trials and regulatory agency and institutional review board approvals of protocols, Onconova’s collaborations, market conditions and those discussed under the heading “Risk Factors” in Onconova’s most recent Annual Report on Form 10-K and quarterly reports on Form 10-Q. Any forward-looking statements contained in this release speak only as of its date. Onconova undertakes no obligation to update any forward-looking statements contained in this release to reflect events or circumstances occurring after its date or to reflect the occurrence of unanticipated events.
Q1 revenue down 2.2%; down 1.4% in constant currency; organic revenue nearly flat (down 0.5% in constant currency)
Q1 gross profit down 1.7%; down 0.8% in constant currency; delivered continued improvement in GP rate, 20.0%, up 10 bps year-over-year
Q1 operating earnings of $10.7 million, including a $5.7 million restructuring charge, or $16.4 million on an adjusted basis
Initiated a comprehensive business transformation program to significantly improve EBITDA margin
TROY, Mich., May 11, 2023 /PRNewswire/ — Kelly (Nasdaq: KELYA, KELYB), a leading specialty talent solutions provider, today announced results for the first quarter of 2023.
Peter Quigley, president and chief executive officer, announced revenue for the first quarter of 2023 totaled $1.3 billion, a 2.2% decrease, or 1.4% decrease in constant currency, compared to the corresponding quarter of 2022, with organic, constant currency revenue down 0.5%. Year-over-year revenue trends were impacted by foreign currency headwinds and the impact of the sale of Russian operations in July 2022. Year-over-year results in the quarter also reflect the impact of the 2022 acquisitions of RocketPower, a recruitment process outsourcing firm, and Pediatric Therapeutic Services, a specialty firm providing in-school therapy services.
“Taking into account well recognized macroeconomic headwinds, we delivered solid results as our specialty solutions proved more resilient than others. Our Education segment and our more profitable outcome-based solutions in both P&I and SET continued to deliver solid growth, while, as expected, our staffing businesses faced decreased demand in this environment,” said Quigley.
Kelly reported operating earnings in the first quarter of 2023 of $10.7 million, compared to earnings of $23.4 million reported in the first quarter of 2022. Earnings in the first quarter of 2023 included a $5.7 million restructuring charge. The restructuring charge reflects cost management actions in response to the current demand levels and to reposition the Professional & Industrial staffing business to better capitalize on opportunities in local markets. Excluding the restructuring charge, adjusted earnings from operations were $16.4 million. Earnings in the first quarter of 2022 included a $0.9 million gain on sale of assets and adjusted earnings were $22.5 million. Adjusted earnings declined year-over-year primarily as a result of lower revenues.
Earnings per share in the first quarter of 2023 were $0.29 compared to a loss per share of $1.23 in the first quarter of 2022. Included in the earnings per share in the first quarter of 2023 is an $0.11 per share restructuring charge, net of tax. Included in the first quarter of 2022 is a $1.69 loss per share, net of tax, on the sale of Kelly’s investment in Persol Holdings common shares and related transactions, partially offset by a $0.02 per share gain on sale of real property, net of tax. On an adjusted basis, earnings per share were $0.40 in the first quarter of 2023, a decline of 9% from $0.44 per share in the corresponding quarter of 2022.
As Kelly approaches the three-year anniversary of its operating model, Quigley went on to introduce a new phase in the company’s journey toward profitable growth. “We have made progress on our growth journey. Now, with an eye to the future, we are taking a bold approach to accelerate profitable growth. I’ve established a Transformation Management Office reporting directly to me and engaged an expert consulting firm to support our aggressive ambitions to create structural improvements in our business designed to convert our revenue and gross margin gains to significantly improve our EBITDA.” Quigley noted that regular progress updates will be provided starting in August.
Kelly also reported that on May 9, its board of directors declared a dividend of $0.075 per share. The dividend is payable on June 6, 2023, to shareholders of record as of the close of business on May 22, 2023.
In conjunction with its first-quarter earnings release, Kelly has published a financial presentation on the Investor Relations page of its public website and will host a conference call at 9 a.m. ET on May 11 to review the results and answer questions. The call may be accessed in one of the following ways:
Via the Telephone (877) 692-8955 (toll free) or (234) 720-6979 (caller paid) Enter access code 5728672 After the prompt, please enter ”#”
A recording of the conference call will be available after 2:30 p.m. ET on May 11, 2023, at (866) 207-1041 (toll-free) and (402) 970-0847 (caller-paid). The access code is 4789007#. The recording will also be available at kellyservices.com during this period.
This release contains statements that are forward looking in nature and, accordingly, are subject to risks and uncertainties. These factors include, but are not limited to, changing market and economic conditions, the impact of the novel coronavirus (COVID-19) outbreak, competitive market pressures including pricing and technology introductions and disruptions, disruption in the labor market and weakened demand for human capital resulting from technological advances, competition law risks, the impact of changes in laws and regulations (including federal, state and international tax laws), unexpected changes in claim trends on workers’ compensation, unemployment, disability and medical benefit plans, or the risk of additional tax liabilities in excess of our estimates, our ability to achieve our business strategy, our ability to successfully develop new service offerings, material changes in demand from or loss of large corporate customers as well as changes in their buying practices, risks particular to doing business with government or government contractors, the risk of damage to our brands, our exposure to risks associated with services outside traditional staffing, including business process outsourcing, services of licensed professionals and services connecting talent to independent work, our increasing dependency on third parties for the execution of critical functions, our ability to effectively implement and manage our information technology strategy, the risks associated with past and future acquisitions, including risk of related impairment of goodwill and intangible assets, exposure to risks associated with certain equity investments, including with strategic partners, risks associated with conducting business in foreign countries, including foreign currency fluctuations, risks associated with violations of anti-corruption, trade protection and other laws and regulations, availability of qualified full-time employees, availability of temporary workers with appropriate skills required by customers, liabilities for employment-related claims and losses, including class action lawsuits and collective actions, our ability to sustain critical business applications through our key data centers, risks arising from failure to preserve the privacy of information entrusted to us or to meet our obligations under global privacy laws, the risk of cyberattacks or other breaches of network or information technology security, our ability to realize value from our tax credit and net operating loss carryforwards, our ability to maintain specified financial covenants in our bank facilities to continue to access credit markets, and other risks, uncertainties and factors discussed in this release and in the Company’s filings with the Securities and Exchange Commission. Actual results may differ materially from any forward-looking statements contained herein, and we undertake no duty to update any forward-looking statement to conform the statement to actual results or changes in the Company’s expectations.
About Kelly®
Kelly Services, Inc. (Nasdaq: KELYA, KELYB) helps companies recruit and manage skilled workers and helps job seekers find great work. Since inventing the staffing industry in 1946, we have become experts in the many industries and local and global markets we serve. With a network of suppliers and partners around the world, we connect more than 450,000 people with work every year. Our suite of outsourcing and consulting services ensures companies have the people they need, when and where they are needed most. Headquartered in Troy, Michigan, we empower businesses and individuals to access limitless opportunities in industries such as science, engineering, technology, education, manufacturing, retail, finance, and energy. Revenue in 2022 was $5.0 billion. Learn more at kellyservices.com.
Generates Net Revenues of $417.6 million and a Net Loss of $71.0 million, which Net Loss Includes an After-Tax, Non-Cash Goodwill and Intangible Asset Impairment Charge of $53.1 million
Adjusted Net Loss(1) Improves to $17.8 million, Compared with an Adjusted Net Loss of $21.0 million in the Prior Year Period
Adjusted EBITDA(1)Loss Improves to $5.5 million, Compared with an Adjusted EBITDA Loss of $12.0 million in the Prior Year Period, as Gross Margin Improvement and Operating Efficiencies Mitigate Revenue Decline
Updates Fiscal 2023 Outlook
(1) Refer to “Definitions of Non-GAAP Financial Measures” and the tables attached at the end of this press release for reconciliation of non-GAAP results to applicable GAAP results.
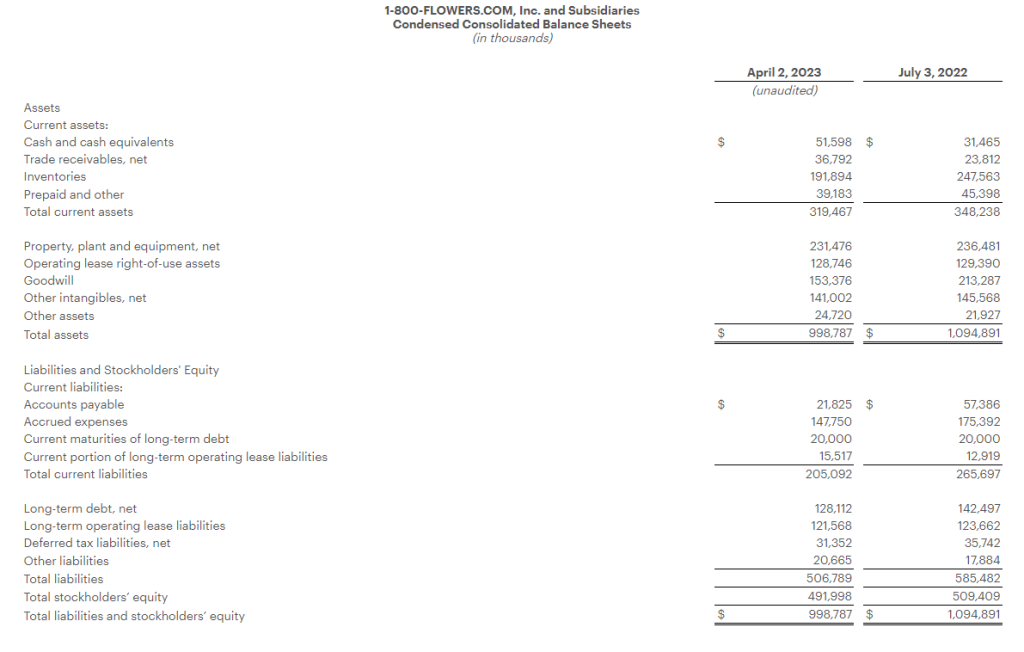
JERICHO, N.Y.–(BUSINESS WIRE)– 1-800-FLOWERS.COM, Inc. (NASDAQ: FLWS), a leading provider of gifts designed to help inspire customers to give more, connect more, and build more and better relationships, today reported results for its fiscal 2023 third quarter, ended April 2, 2023.
Fiscal 2023 Third Quarter Highlights
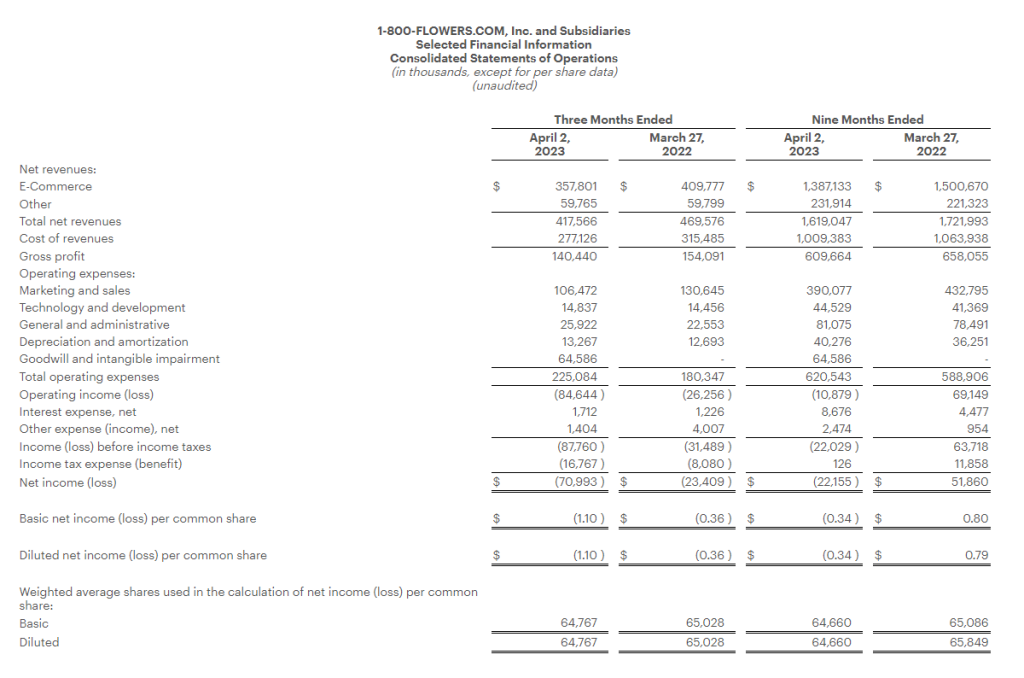
Total consolidated revenues decreased 11.1% to $417.6 million, compared with total consolidated revenues of $469.6 million in the prior year period.
Gross profit margin for the quarter increased 80 basis points to 33.6%, compared with 32.8% in the prior year period.
Operating expenses increased $44.7 million from the prior year period, including a $64.6 million non-cash goodwill and intangible assets impairment charge. Excluding the impact of this charge, operating expenses declined $19.8 million or 11.0%, as compared with the prior year period.
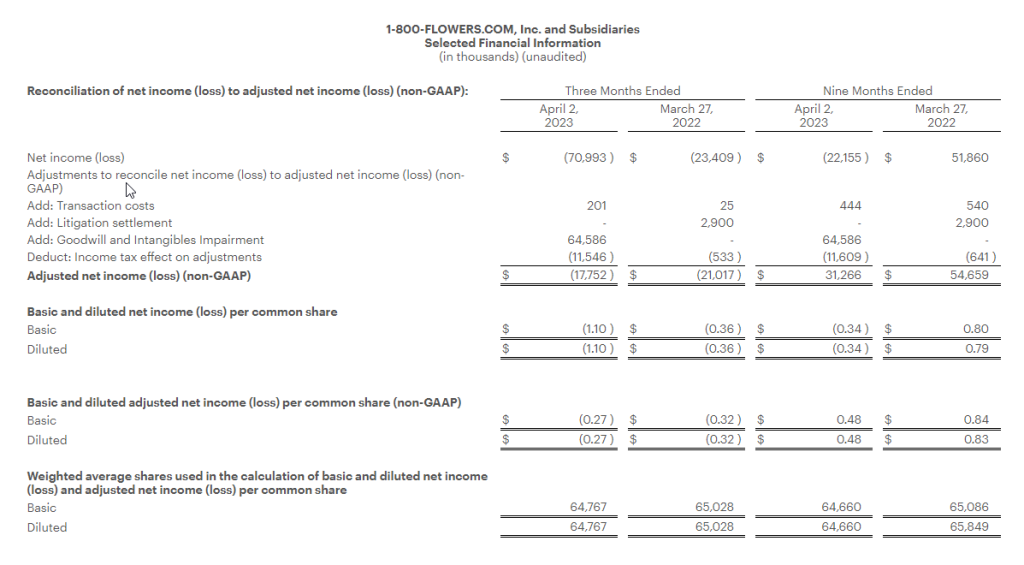
Net loss for the quarter was $71.0 million, or $1.10 per share, which includes an after-tax non-cash goodwill and intangible assets impairment charge of $53.1 million or $0.82 per share. Adjusted Net Loss1 was $17.8 million, or $0.27 per share.
Adjusted EBITDA1 for the quarter was a loss of $5.5 million, as compared with an Adjusted EBITDA1 loss of $12.0 million in the prior year period.
Chris McCann, CEO of 1-800-FLOWERS.COM, Inc., said “Our third quarter results reflect a continuation of the trends that we have experienced throughout this fiscal year. In this challenging consumer environment, we are executing on our strategy to invest in and develop stronger customer relationships, while continuing to identify operating efficiencies to reduce expenses. As a result of our expense optimization efforts, combined with improving gross margin, we exceeded our Adjusted EBITDA1 expectations for the quarter and are raising our full year Adjusted EBITDA1 guidance.”
McCann added, “We will continue to optimize operating expenses in this environment, while simultaneously investing in the long-term growth of our business, as evidenced by the recent acquisitions of Things Remembered® and SmartGift®. We believe these efforts position us well once the broader consumer environment improves and reinforce our company as a premier gifting destination that helps our customers connect with the important people in their lives.”
Third Quarter 2023 Financial Results
Total consolidated revenues decreased 11.1% to $417.6 million, as compared with total consolidated revenues of $469.6 million in the prior year period.
Gross profit margin for the quarter was 33.6%, increasing 80 basis points from the prior year period led by the Consumer Floral and Gifts and BloomNet® segments. Operating expenses, excluding the impairment charge noted above, stock-based compensation, appreciation-or-depreciation of investments in the Company’s non-qualified compensation plan, and the costs associated with a legal settlement in the prior year period, were 38.1% of total sales, or flat with the prior year period, as lower advertising and labor costs were offset by higher depreciation and amortization due to our capital investments in technology and automation.
As a result, the Company generated a net loss of $71.0 million, or ($1.10) per share, and an Adjusted Net Loss1 of $17.8 million, or ($0.27) per share, compared with a net loss of $23.4 million, or ($0.36) per share, and an Adjusted Net Loss1 of $21.0 million, or ($0.32) per share, in the prior year period.
Adjusted EBITDA1 for the quarter was a loss of $5.5 million, as compared with an Adjusted EBITDA1 loss of $12.0 million in the prior year period.
Segment Results
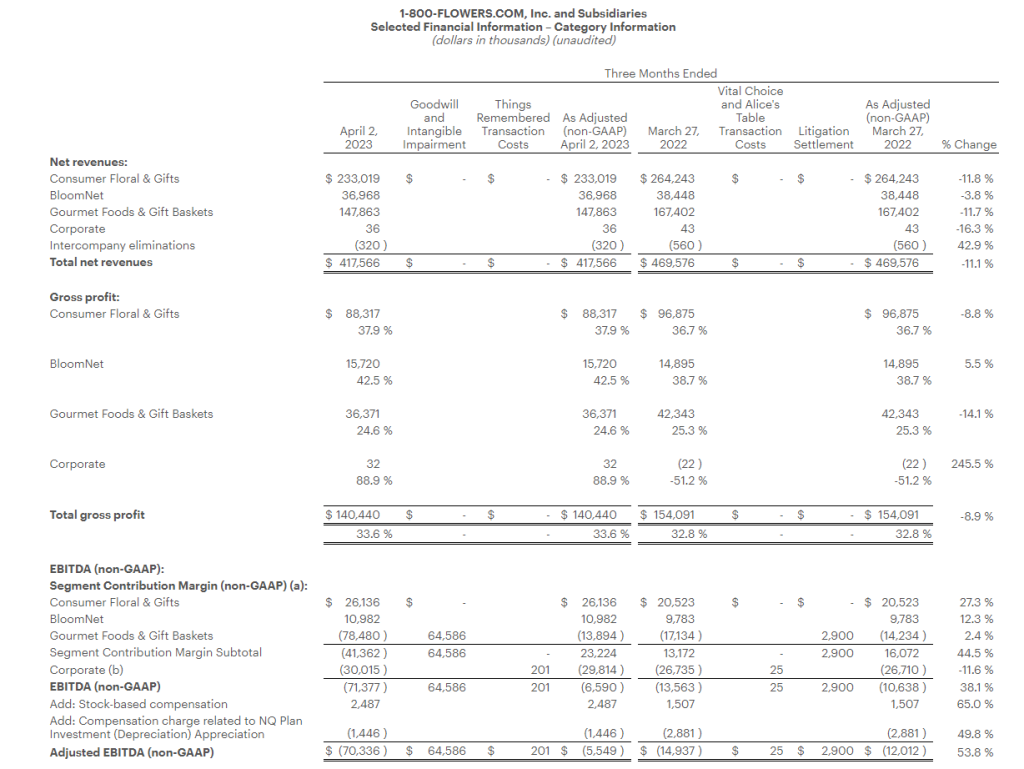
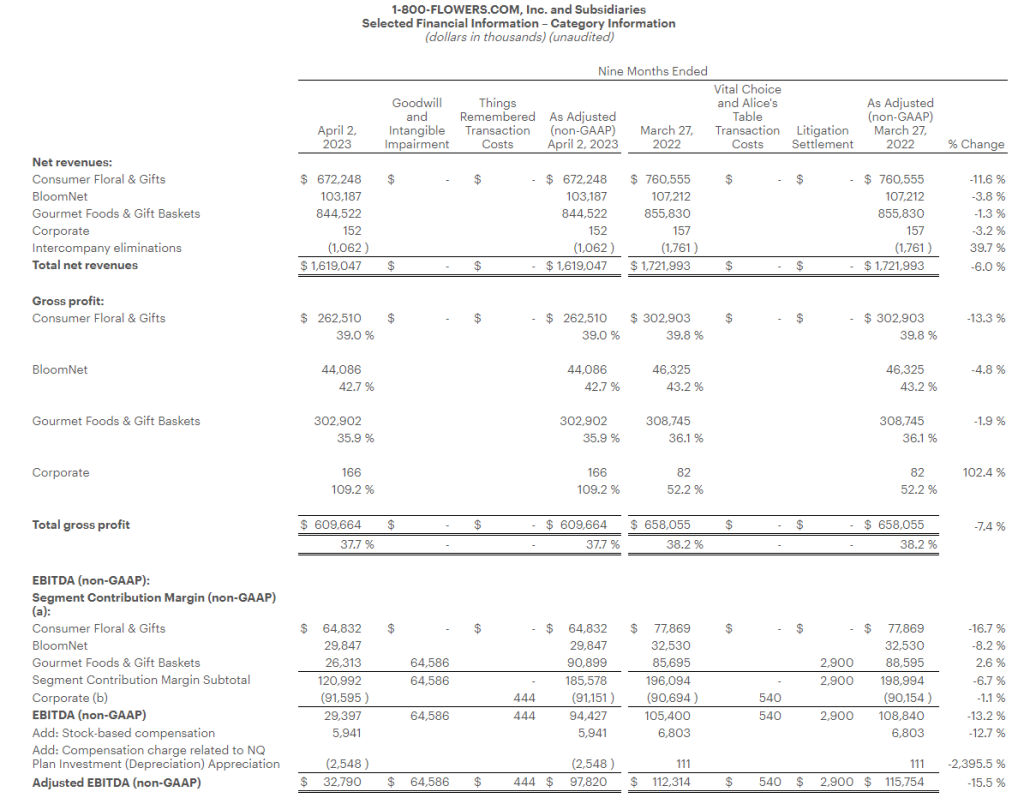
The Company provides selected financial results for its Gourmet Foods and Gift Baskets, Consumer Floral and Gifts, and BloomNet segments in the tables attached to this release and as follows:
Gourmet Foods and Gift Baskets: Revenues for the quarter decreased 11.7% to $147.9 million, compared with $167.4 million in the prior year period. Gross profit margin was 24.6%, compared with 25.3% in the prior year period, declining on continued higher commodity costs, increased promotional activity and overhead cost deleveraging. Segment contribution margin1 without the impairment charge was a loss of $13.9 million, compared with an adjusted loss1 of $14.2 million a year ago.
Consumer Floral and Gifts: Revenues decreased 11.8% to $233.0 million, compared with $264.2 million in the prior year period. Gross profit margin increased to 37.9%, compared with 36.7% in the prior year period, on strategic pricing initiatives and lower cost of merchandise in part due to lower ocean freight costs. Segment contribution margin1 was $26.1 million, compared with $20.5 million the prior year.
BloomNet: Revenues for the quarter decreased 3.8% to $37.0 million, compared with $38.4 million in the prior year period. Gross profit margin increased to 42.5%, compared with 38.7% in the prior year on strategic pricing initiatives and lower ocean freight costs. Segment contribution margin1 was $11.0 million, compared with $9.8 million in the prior year period.
Company Guidance
Based on its third quarter performance and outlook for the balance of the year, the Company is updating its Fiscal 2023 guidance. This outlook includes a continuation of the challenging consumer environment, which is expected to be mitigated by the Company’s expense management efforts.
The Company expects:
total revenues to decline approximately 8% as compared with the prior year;
adjusted EBITDA1 to be in a range of $85 million to $90 million; and
Free Cash Flow1 to exceed $75 million.
Conference Call
The Company will conduct a conference call to discuss the above details and attached financial results today, Thursday, May 11, at 8:00 a.m. (ET). The conference call will be webcast from the Investors section of the Company’s website at www.1800flowersinc.com. A recording of the call will be posted on the Investors section of the Company’s website within two hours of the call’s completion. A telephonic replay of the call can be accessed beginning at 2:00 p.m. (ET) today through May 18, 2023, at: (US) 1-877-344-7529; (Canada) 855-669-9658; (International) 1-412-317-0088; enter conference ID #: 4785326.
Definitions of non-GAAP Financial Measures:
We sometimes use financial measures derived from consolidated financial information, but not presented in our financial statements prepared in accordance with U.S. generally accepted accounting principles (“GAAP”). Certain of these are considered “non-GAAP financial measures” under the U.S. Securities and Exchange Commission rules. Non-GAAP financial measures referred to in this document are either labeled as “non-GAAP” or designated as such with a “1”. See below for definitions and the reasons why we use these non-GAAP financial measures. Where applicable, see the Selected Financial Information below for reconciliations of these non-GAAP measures to their most directly comparable GAAP financial measures. Reconciliations for forward-looking figures would require unreasonable efforts at this time because of the uncertainty and variability of the nature and amount of certain components of various necessary GAAP components, including, for example, those related to compensation, tax items, amortization or others that may arise during the year, and the Company’s management believes such reconciliations would imply a degree of precision that would be confusing or misleading to investors. For the same reasons, the Company is unable to address the probable significance of the unavailable information. The lack of such reconciling information should be considered when assessing the impact of such disclosures.
EBITDA and Adjusted EBITDA:
We define EBITDA as net income (loss) before interest, taxes, depreciation, and amortization. Adjusted EBITDA is defined as EBITDA adjusted for the impact of stock-based compensation, Non-Qualified Plan Investment appreciation/depreciation, and for certain items affecting period-to-period comparability. See Selected Financial Information for details on how EBITDA and Adjusted EBITDA were calculated for each period presented. The Company presents EBITDA and Adjusted EBITDA because it considers such information meaningful supplemental measures of its performance and believes such information is frequently used by the investment community in the evaluation of similarly situated companies. The Company uses EBITDA and Adjusted EBITDA as factors to determine the total amount of incentive compensation available to be awarded to executive officers and other employees. The Company’s credit agreement uses EBITDA and Adjusted EBITDA to determine its interest rate and to measure compliance with certain covenants. EBITDA and Adjusted EBITDA are also used by the Company to evaluate and price potential acquisition candidates. EBITDA and Adjusted EBITDA have limitations as analytical tools and should not be considered in isolation or as a substitute for analysis of the Company’s results as reported under GAAP. Some of the limitations are: (a) EBITDA and Adjusted EBITDA do not reflect changes in, or cash requirements for, the Company’s working capital needs; (b) EBITDA and Adjusted EBITDA do not reflect the significant interest expense, or the cash requirements necessary to service interest or principal payments, on the Company’s debts; and (c) although depreciation and amortization are non-cash charges, the assets being depreciated and amortized may have to be replaced in the future and EBITDA does not reflect any cash requirements for such capital expenditures. EBITDA and Adjusted EBITDA should only be used on a supplemental basis combined with GAAP results when evaluating the Company’s performance.
Segment Contribution Margin and Adjusted Segment Contribution Margin
We define Segment Contribution Margin as earnings before interest, taxes, depreciation, and amortization, before the allocation of corporate overhead expenses. Adjusted Contribution Margin is defined as Contribution Margin adjusted for certain items affecting period-to-period comparability. See Selected Financial Information for details on how Segment Contribution Margin and Adjusted Segment Contribution Margin were calculated for each period presented. When viewed together with our GAAP results, we believe Segment Contribution Margin and Adjusted Segment Contribution Margin provide management and users of the financial statements meaningful information about the performance of our business segments. Segment Contribution Margin and Adjusted Segment Contribution Margin are used in addition to and in conjunction with results presented in accordance with GAAP and should not be relied upon to the exclusion of GAAP financial measures. The material limitation associated with the use of Segment Contribution Margin and Adjusted Segment Contribution Margin is that they are an incomplete measure of profitability as they do not include all operating expenses or non-operating income and expenses. Management compensates for this limitation when using these measures by looking at other GAAP measures, such as Operating Income and Net Income.
Adjusted Net Income (Loss) and Adjusted or Comparable Net Income (Loss) Per Common Share:
We define Adjusted Net Income (Loss) and Adjusted or Comparable Net Income (Loss) Per Common Share as Net Income (Loss) and Net Income (Loss) Per Common Share adjusted for certain items affecting period-to-period comparability. See Selected Financial Information below for details on how Adjusted Net Income (Loss) Per Common Share and Adjusted or Comparable Net Income (Loss) Per Common Share were calculated for each period presented. We believe that Adjusted Net Income (Loss) and Adjusted or Comparable Net Income (Loss) Per Common Share are meaningful measures because they increase the comparability of period-to-period results. Since these are not measures of performance calculated in accordance with GAAP, they should not be considered in isolation of, or as a substitute for, GAAP Net Income (Loss) and Net Income (Loss) Per Common share, as indicators of operating performance and they may not be comparable to similarly titled measures employed by other companies.
Free Cash Flow:
We define Free Cash Flow as net cash provided by operating activities less capital expenditures. The Company considers Free Cash Flow to be a liquidity measure that provides useful information to management and investors about the amount of cash generated by the business after the purchases of fixed assets, which can then be used to, among other things, invest in the Company’s business, make strategic acquisitions, strengthen the balance sheet, and repurchase stock or retire debt. Free Cash Flow is a liquidity measure that is frequently used by the investment community in the evaluation of similarly situated companies. Since Free Cash Flow is not a measure of performance calculated in accordance with GAAP, it should not be considered in isolation or as a substitute for analysis of the Company’s results as reported under GAAP. A limitation of the utility of Free Cash Flow as a measure of financial performance is that it does not represent the total increase or decrease in the Company’s cash balance for the period.
About 1-800-FLOWERS.COM, Inc.
1-800-FLOWERS.COM, Inc. is a leading provider of gifts designed to help inspire customers to give more, connect more, and build more and better relationships. The Company’s e-commerce business platform features an all-star family of brands, including: 1-800-Flowers.com®, 1-800-Baskets.com®, Cheryl’s Cookies®, Harry & David®, PersonalizationMall.com®, Shari’s Berries®, FruitBouquets.com®, Things Remembered®, Moose Munch®, The Popcorn Factory®, Wolferman’s Bakery®, Vital Choice®, Stock Yards® and Simply Chocolate®. Through the Celebrations Passport® loyalty program, which provides members with free standard shipping and no service charge across our portfolio of brands, 1-800-FLOWERS.COM, Inc. strives to deepen relationships with customers. The Company also operates BloomNet®, an international floral and gift industry service provider offering a broad-range of products and services designed to help members grow their businesses profitably; Napco℠, a resource for floral gifts and seasonal décor; DesignPac Gifts, LLC, a manufacturer of gift baskets and towers; and Alice’s Table®, a lifestyle business offering fully digital livestreaming and on demand floral, culinary and other experiences to guests across the country. 1-800-FLOWERS.COM, Inc. was recognized among the top 5 on the National Retail Federation’s 2021 Hot 25 Retailers list, which ranks the nation’s fastest-growing retail companies, and was named to the Fortune 1000 list in 2022. Shares in 1-800-FLOWERS.COM, Inc. are traded on the NASDAQ Global Select Market, ticker symbol: FLWS. For more information, visit 1800flowersinc.com or follow @1800FLOWERSInc on Twitter.
FLWS–COMP FLWS-FN
Special Note Regarding Forward Looking Statements:
This press release contains forward-looking statements within the meaning of the Private Securities Litigation Reform Act of 1995. These forward-looking statements represent the Company’s current expectations or beliefs concerning future events and can generally be identified using statements that include words such as “estimate,” “expects,” “project,” “believe,” “anticipate,” “intend,” “plan,” “foresee,” “forecast,” “likely,” “will,” “target” or similar words or phrases. These forward-looking statements are subject to risks, uncertainties, and other factors, many of which are outside of the Company’s control, which could cause actual results to differ materially from the results expressed or implied in the forward-looking statements, including, but not limited to, statements regarding the Company’s ability to achieve its guidance for the full Fiscal year; the Company’s ability to leverage its operating platform and reduce its operating expense ratio; its ability to sell through existing inventories; its ability to successfully integrate acquired businesses and assets; its ability to successfully execute its strategic initiatives; its ability to cost effectively acquire and retain customers; the outcome of contingencies, including legal proceedings in the normal course of business; its ability to compete against existing and new competitors; its ability to manage expenses associated with sales and marketing and necessary general and administrative and technology investments; its ability to reduce promotional activities and achieve more efficient marketing programs; and general consumer sentiment and industry and economic conditions that may affect levels of discretionary customer purchases of the Company’s products. The Company undertakes no obligation to publicly update any of the forward-looking statements, whether because of new information, future events or otherwise, made in this release or in any of its SEC filings. Consequently, you should not consider any such list to be a complete set of all potential risks and uncertainties. For a more detailed description of these and other risk factors, refer to the Company’s SEC filings, including the Company’s Annual Reports on Form 10-K and its Quarterly Reports on Form 10-Q.
Note: The following tables are an integral part of this press release without which the information presented in this press release should be considered incomplete.
All dollar amounts expressed are in thousands of U.S. dollars unless otherwise indicated.
Q1 2023 and Other Highlights
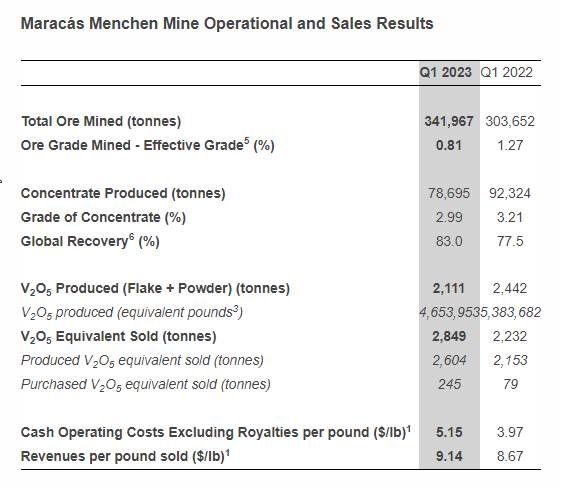
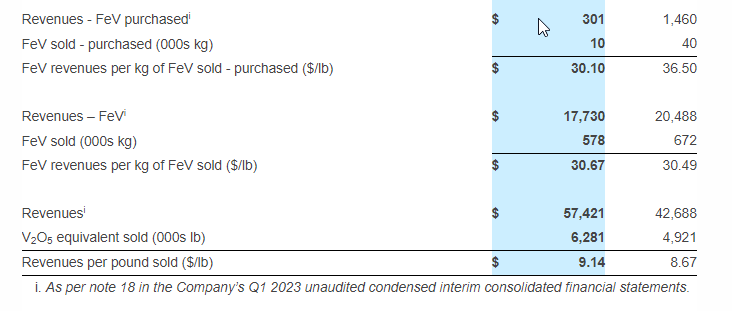
Revenues of $57.4 million, a 35% increase over Q1 2022, mainly due to greater sales quantities at a higher revenue per lb sold1; Revenues per pound sold1 of $9.14, a 5% increase over Q1 2022
Operating costs of $45.9 million vs. $29.0 million in Q1 2022, and cash operating costs excluding royalties per pound1 of V2O5 equivalent sold of $5.15 vs. $3.97 in Q1 2022
Net loss of $1.2 million vs. a net loss of $2.0 million in Q1 2022
Cash provided before working capital items of $8.2 million, a 42% increase over Q1 2022
In January 2023, the Company secured two debt facilities: a two-year debt facility of $15.0 million, bearing interest at 6.85% per annum with payments due quarterly and principal repayments starting after a grace period of 180 days, and a three-year debt facility of $10.0 million, bearing interest at 8.36% per annum with an initial fee of 0.70% and payments due semi-annually with principal repayments starting after a grace period of 360 days
Cash balance of $61.6 million, debt of $65.0 million and a net working capital2 surplus of $119.3 million exiting Q1 2023
Total V2O5 equivalent sales of 2,849 tonnes (including 245 tonnes of purchased material), a 28% increase over Q1 2022; V2O5 production 2,111 tonnes (4.6 million lbs3) vs. 2,441 tonnes (4.4 million lbs3) in Q1 2022
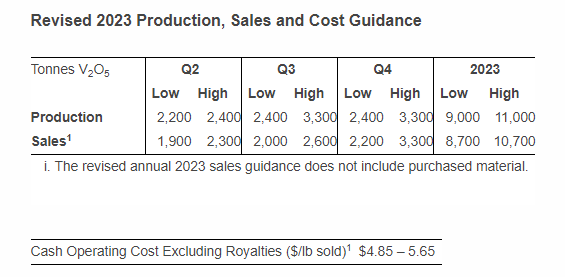
The Company has adjusted its annual 2023 V2O5 equivalent production guidance to 9,000 – 11,000 tonnes from 11,000 – 12,000 tonnes, its annual 2023 V2O5 equivalent sales guidance to 8,700 – 10,700 tonnes from 10,300 – 11,300 tonnes and its cash operating cost excluding royalties per lb sold guidance to $4.85 – 5.65 from $4.85 – 5.25
Q1 2023 results conference call and webcast: Thursday, May 11th at 1:00 p.m. ET
Vanadium Market Update4
Spot demand remained strong in Q1 2023, primarily due to higher-than-expected demand from the aerospace sector with demand in the energy storage market anticipated to increase in future quarters largely due to anticipated Chinese vanadium redox flow battery (“VRFB”) deployments
The average benchmark price per pound of V2O5 in Europe was $10.39 in Q1 2023, a 3% decrease from the average of $10.72 seen in Q1 2022; The average benchmark price per kg of ferrovanadium (“FeV”) in Europe was $39.46 in Q1 2023, a 15% decrease from the average of $46.17 seen in Q1 2022, mainly due to lower spot demand from the steel sector in the quarter
TORONTO–(BUSINESS WIRE)– Largo Inc. (“Largo” or the “Company“) (TSX: LGO) (NASDAQ: LGO) today released financial and operating results for the three months ended March 31, 2023. The Company reported quarterly vanadium pentoxide (“V2O5”) equivalent sales of 2,849 tonnes at a cash operating cost excluding royalties per pound1 sold of $5.15.
Largo Reports First Quarter 2023 Financial Results and Provides Update to 2023 Operational and Sales Outlook (Photo: Business Wire)
Daniel Tellechea, Interim CEO and Director of Largo, stated: “While first quarter results were in line with our annual 2023 guidance, we have revised our 2023 production, sales and cost guidance due to heavy rain in December causing the Company to delay its infill drilling campaign for 2023, which is required for further refinement of the Company’s short-term mining model. Returning to normalized production levels remains the top priority for Largo as we work through this period of adjustment in our mining operations.”
He continued: “However, we should not overlook the upcoming catalysts for the Company in 2023. We continued to progress with the construction of our ilmenite concentration plant during the first quarter and expect to complete construction in Q2 2023, with commissioning and ramp up following shortly thereafter. In addition, installation of our 6.1 megawatt-hour vanadium battery in Spain continued during Q1 2023 with final provisional acceptance scheduled for Q3 2023.” He concluded: “As for the market, vanadium prices decreased approximately 6% in April 2023 as a result of lower short-term steel demand. Despite this, we believe vanadium’s long-term and medium-term fundamentals remain strong, with considerable demand growth expected in the future from battery applications.”
Q1 2023 Financial Highlights
During Q1 2023, the Company recognized revenues of $57.4 million from sales of 2,849 tonnes of V2O5 equivalent (Q1 2022 – 2,232 tonnes). This represents a 35% increase in revenues over Q1 2022 ($42.7 million) and is mainly due to greater sales quantities at a higher revenue per lb sold1.
Operating costs of $45.9 million in Q1 2023 (Q1 2022 – $29.0 million) include direct mine and production costs of $28.4 million (Q1 2022 – $17.6 million), conversion costs of $1.9 million (Q1 2022 – $1.8 million), product acquisition costs of $4.2 million (Q1 2022 – $1.6 million), royalties of $2.4 million (Q1 2022 – $2.0 million), distribution costs of $1.4 million (Q1 2022 – $1.4 million), depreciation and amortization of $7.3 million (Q1 2022 – $4.3 million) and iron ore costs of $0.3 million (Q1 2022 – $0.2 million). The increase in direct mine and production costs is attributable to low ore availability due in part to the heavy rains in December 2022, as well as a shutdown for the completion of the planned maintenance and refractory refurbishment in the kiln. Higher mining costs, the lack of production stability and the ramp up following the shutdown negatively impacted costs in Q1 2023. In addition, as compared with Q1 2022, the Company experienced cost increases in critical consumables, including sodium carbonate, as well as increased consumption of ammonium sulfate.
Cash operating costs excluding royalties per pound1 sold were $5.15 in Q1 2023, compared with $3.97 in Q1 2022. The increase seen in Q1 2023 compared with Q1 2022 is largely due to the reasons noted above for operating costs, with the previously noted plant shutdowns negatively impacting operational and financial performance for the quarter.
Professional, consulting and management fees were $5.5 million in Q1 2023, compared with $5.9 million in Q1 2022, representing a 6% decrease. The decrease is primarily due to lower costs incurred for Largo Physical Vanadium Corp. (“LPV”) in Q1 2023 than in the previous comparative quarter.
Other general and administrative expenses were $3.3 million in Q1 2023, compared with $1.7 million in Q1 2022. The increase is primarily attributable to increased depreciation in Q1 2023 from the Company’s software intangible asset, as well as increased IT related costs in support of the Company’s enterprise resource planning (“ERP”) software implementation. The Company also saw increased costs at LCE, which are primarily related to increased travel costs arising from its battery installation activities in Spain.
Share-based payments in Q1 2023 decreased from Q1 2022 by 266% to an expense recovery of $1.3 million. The decrease was attributable to the reversal of share-based payment expenditures on forfeited unvested stock options and restricted share units (“RSUs”) as well as a reduced number of stock options and RSUs granted in Q1 2023, as compared with Q1 2022.
Finance costs were $1.4 million in Q1 2023, compared with $0.2 million in Q1 2022. The increase is attributable to increased debt, as well as an initial financing fee on the Company’s new debt facilities.
Technology start-up costs were $2.8 million in Q1 2023, representing a 7% decrease over Q1 2022. These costs relate to activities at LCE focussed on the deployment of its initial VCHARGE VRFB system in Spain with the quarter seeing increased activity by the field service team and higher transportation and installation costs.
Cash provided by financing activities in Q1 2023 increased from cash provided by financing activities in Q1 2022 by $24.9 million. The movement is primarily due to the receipt of debt of $25.0 million.
Cash used in investing activities in Q1 2023 of $23.4 million is an increase from the $4.3 million seen in Q1 2022. This is primarily due to capital expenditures for the ilmenite project and purchases of vanadium assets by LPV of $8.6 million.
Additional Corporate Updates
Q1 2023 Production Overview: Production of 2,111 tonnes of V2O5 in Q1 2023 was 14% lower than the 2,442 tonnes of V2O5 produced in Q1 2022. In Q1 2023, the Company experienced reduced massive ore inventory arising from the heavy rainfall in December 2022. The planned kiln maintenance and refractory refurbishment initially scheduled for February was completed in January during the stoppage in operations. In Q1 2023, the transition in mining contractor was completed and 341,967 tonnes of ore were mined with an effective grade5 of 0.81% of V2O5. The ore mined in Q1 2023 was 13% higher than in Q1 2022. The Company produced 78,695 tonnes of concentrate with an effective grade5 of 2.99%. The global recovery6 achieved in Q1 2023 was 83.0%, an increase of 7.1% from the 77.5% achieved in Q1 2022 and 11.1% higher than the 74.7% achieved in Q4 2022. The global recovery6 in January was 83.1%, with 82.9% achieved in February and 82.7% achieved in March. Subsequent to Q1 2023, production in April 2023 was 676 tonnes of V2O5 equivalent.
Q1 2023 High Purity Production: In Q1 2023, the Company produced 1,041 V2O5 equivalent tonnes of high purity products, including 813 tonnes of high purity V2O5 and 228 tonnes of high purity vanadium trioxide (“V2O3”). This represented 49% of the total quarterly production.
Q1 2023 Sales Overview and Outlook: In Q1 2023, the Company sold 2,849 tonnes of V2O5 equivalent (Q1 2022 – 2,232 tonnes), including 245 tonnes of purchased products (Q1 2022 – 79 tonnes). Logistical challenges and transport costs have eased from their highs and the Company expects further improvements in the coming quarters and the Company continued to deliver on all its commercial commitments. The Company has also committed to the purchase of 60 tonnes per month of V2O5 from third parties for the remainder of the year. Subsequent to Q1 2023, sales in April 2023 were 1,101 tonnes of V2O5 equivalent, including 78 tonnes of purchased material.
Stack Manufacturing Facility Improvements at LCE: All building improvements at Largo Clean Energy’s (“LCE”) facility in Wilmington, Massachusetts were completed during Q1 2023. Stack manufacturing has moved into its final location and LCE will now begin the process of restarting and scaling up the capacity to 12.5 megawatts (“MW”) by the end of the year, with an ultimate capacity of 100 MW by the end of 2025. The sub-scale and chemistry teams have moved into their new lab, which, following an upgrade over the next two quarters, will increase the material and core technology testing capacity to support new vendors and performance improvements.
Promotion of Paul Vollant to Chief Commercial Officer: Effective May 9, 2023, Largo has promoted Paul Vollant to Chief Commercial Officer in order to oversee all sales and strategic business development efforts related to the commodity division of the Company. His promotion reflects an unwavering commitment and support of the Company’s sales efforts to date, including the establishment and oversight of Largo’s sales and trading department. Mr. Vollant is highly experienced in the sales and marketing of metals and minerals and has specialized in strategic metals, particularly vanadium and titanium. Mr. Vollant joined Largo in 2019 as Director of Sales and Trading and was subsequently promoted to Vice President of Commercial in 2021.
Update of 2023 Production and Sales Strategy Outlook
The Company is in the process of reviewing its short-term mine model to incorporate on-going infill drilling at the Campbell Pit. Based on results to date and expected future results, the Company has adjusted its annual 2023 production, sales and cash cost guidance.
Q1 2023 Webcast and Conference Call Information
To join the conference call without operator assistance, you may register and enter your phone number at https://emportal.ink/40oF5sO to receive an instant automated call back.
You can also dial direct to be entered to the call by an Operator via dial-in details below.
To view press releases or any additional financial information, please visit the Investor Resources section of the Company’s website at: www.largoinc.com/English/investor-resources
A playback recording will be available on the Company’s website for a period of 60-days following the conference call.
The information provided within this release should be read in conjunction with Largo’s unaudited condensed interim financial statements for the three months ended March 31, 2023 and 2022 and its management’s discussion and analysis for the three months ended March 31, 2023 which are available on our website at www.largoinc.com or on the Company’s respective profiles at www.sedar.com and www.sec.gov.
About Largo
Largo has a long and successful history as one of the world’s preferred vanadium companies through the supply of its VPURETM and VPURE+TM products, which are sourced from one of the world’s highest-grade vanadium deposits at the Company’s Maracás Menchen Mine in Brazil. Aiming to enhance value creation at Largo, the Company is in the process of implementing an ilmenite concentration plant using feedstock sourced from its existing operations in addition to advancing its U.S.-based clean energy division with its VCHARGE vanadium batteries. Largo’s VCHARGE vanadium batteries contain a variety of innovations, enabling an efficient, safe and ESG-aligned long duration solution that is fully recyclable at the end of its 25+ year lifespan. Producing some of the world’s highest quality vanadium, Largo’s strategic business plan is based on two pillars: 1.) leading vanadium supplier with an outlined growth plan and 2.) U.S.-based energy storage business support a low carbon future.
Largo’s common shares trade on the Nasdaq Stock Market and on the Toronto Stock Exchange under the symbol “LGO”. For more information, please visit www.largoinc.com.
This press release contains “forward-looking information” and “forward-looking statements” within the meaning of applicable Canadian and United States securities legislation. Forward‐looking information in this press release includes, but is not limited to, statements with respect to the timing and amount of estimated future production and sales; the future price of commodities; costs of future activities and operations, including, without limitation, the effect of inflation and exchange rates; the effect of unforeseen equipment maintenance or repairs on production; timing of ilmenite production; the ability to produce high purity V2O5 and V2O3 according to customer specifications; the extent of capital and operating expenditures; the ability of the Company to make improvements on its current short-term mine plan; the impact of global delays and related price increases on the Company’s global supply chain and future sales of vanadium products. Forward‐looking information in this press release also includes, but is not limited to, statements with respect to our ability to build, finance and successfully operate a VRFB business, the projected timing and cost of the completion of the EGPE project; our ability to protect and develop our technology, our ability to maintain our IP, the competitiveness of our product in an evolving market, our ability to market, sell and deliver our VCHARGE batteries on specification and at a competitive price, our ability to successfully deploy our VCHARGE batteries in foreign jurisdictions; our ability to negotiate and enter into a joint venture with Ansaldo Green Tech on terms satisfactory to the Company and the success of such joint venture; the receipt of necessary governmental permits and approvals on a timely basis, our ability to secure the required resources to build and deploy our VCHARGE batteries, and the adoption of VRFB technology generally in the market.
The following are some of the assumptions upon which forward-looking information is based: that general business and economic conditions will not change in a material adverse manner; demand for, and stable or improving price of V2O5 and other vanadium commodities; receipt of regulatory and governmental approvals, permits and renewals in a timely manner; that the Company will not experience any material accident, labour dispute or failure of plant or equipment or other material disruption in the Company’s operations at the Maracás Menchen Mine or relating to Largo Clean Energy, specially in respect of the installation and commissioning of the EGPE project; the availability of financing for operations and development; the availability of funding for future capital expenditures; the ability to replace current funding on terms satisfactory to the Company; the ability to mitigate the impact of heavy rainfall; the Company’s ability to procure equipment, services and operating supplies in sufficient quantities and on a timely basis; that the estimates of the resources and reserves at the Maracás Menchen Mine are within reasonable bounds of accuracy (including with respect to size, grade and recovery and the operational and price assumptions on which such estimates are based); the accuracy of the Company’s mine plan at the Maracás Menchen Mine, the competitiveness of the Company’s VRFB technology; the ability to obtain funding through government grants and awards for the Green Energy sector, the accuracy of cost estimates and assumptions on future variations of VCHARGE battery system design, that the Company’s current plans for ilmenite and VRFBs can be achieved; the Company’s “two-pillar” business strategy will be successful; the Company’s sales and trading arrangements will not be affected by the evolving sanctions against Russia; and the Company’s ability to attract and retain skilled personnel and directors; the ability of management to execute strategic goals.
Forward-looking statements can be identified by the use of forward-looking terminology such as “plans”, “expects” or “does not expect”, “is expected”, “budget”, “scheduled”, “estimates”, “forecasts”, “intends”, “anticipates” or “does not anticipate”, or “believes”, or variations of such words and phrases or statements that certain actions, events or results “may”, “could”, “would”, “might” or “will be taken”, “occur” or “be achieved”. All information contained in this news release, other than statements of current and historical fact, is forward looking information. Forward-looking statements are subject to known and unknown risks, uncertainties and other factors that may cause the actual results, level of activity, performance or achievements of Largo or Largo Clean Energy to be materially different from those expressed or implied by such forward-looking statements, including but not limited to those risks described in the annual information form of Largo and in its public documents filed on www.sedar.com and available on www.sec.gov from time to time. Forward-looking statements are based on the opinions and estimates of management as of the date such statements are made. Although management of Largo has attempted to identify important factors that could cause actual results to differ materially from those contained in forward-looking statements, there may be other factors that cause results not to be as anticipated, estimated or intended. There can be no assurance that such statements will prove to be accurate, as actual results and future events could differ materially from those anticipated in such statements. Accordingly, readers should not place undue reliance on forward-looking statements. Largo does not undertake to update any forward-looking statements, except in accordance with applicable securities laws. Readers should also review the risks and uncertainties sections of Largo’s annual and interim MD&As which also apply.
Trademarks are owned by Largo Inc.
Non-GAAP Measures
The Company uses certain non-GAAP measures in its press release, which are described in the following section. Non-GAAP financial measures and non-GAAP ratios are not standardized financial measures under IFRS, the Company’s GAAP, and might not be comparable to similar financial measures disclosed by other issuers. These measures are intended to provide additional information and should not be considered in isolation or as a substitute for measures of performance prepared in accordance with IFRS.
Revenues Per Pound
The Company’s press release refers to revenues per pound sold, V2 O5 revenues per pound of V2 O5 sold and FeV revenues per kg of FeV sold, which are non-GAAP financial measures that are used to provide investors with information about a key measure used by management to monitor performance of the Company.
These measures, along with cash operating costs, are considered to be key indicators of the Company’s ability to generate operating earnings and cash flow from its Maracás Menchen Mine and sales activities. These measures differ from measures determined in accordance with IFRS, and are not necessarily indicative of net earnings or cash flow from operating activities as determined under IFRS.
The following table provides a reconciliation of revenues per pound sold, V2O5 revenues per pound of V2O5 sold and FeV revenues per kg of FeV sold to revenues and the revenue information presented in note 18 as per the Q1 2023 unaudited condensed interim consolidated financial statements.
Cash Operating Costs and Cash Operating Costs Excluding Royalties
The Company’s press release refers to cash operating costs per pound and cash operating costs excluding royalties per pound, which are non-GAAP ratios based on cash operating costs and cash operating costs excluding royalties, which are non-GAAP financial measures, in order to provide investors with information about a key measure used by management to monitor performance. This information is used to assess how well the Maracás Menchen Mine is performing compared to plan and prior periods, and also to assess its overall effectiveness and efficiency.
Cash operating costs includes mine site operating costs such as mining costs, plant and maintenance costs, sustainability costs, mine and plant administration costs, royalties and sales, general and administrative costs (all for the Mine properties segment), but excludes depreciation and amortization, share-based payments, foreign exchange gains or losses, commissions, reclamation, capital expenditures and exploration and evaluation costs. Operating costs not attributable to the Mine properties segment are also excluded, including conversion costs, product acquisition costs, distribution costs and inventory write-downs.
Cash operating costs excluding royalties is calculated as cash operating costs less royalties.
Cash operating costs per pound and cash operating costs excluding royalties per pound are obtained by dividing cash operating costs and cash operating costs excluding royalties, respectively, by the pounds of vanadium equivalent sold that were produced by the Maracás Menchen Mine.
Cash operating costs, cash operating costs excluding royalties, cash operating costs per pound and cash operating costs excluding royalties per pound, along with revenues, are considered to be key indicators of the Company’s ability to generate operating earnings and cash flow from its Maracás Menchen Mine. These measures differ from measures determined in accordance with IFRS, and are not necessarily indicative of net earnings or cash flow from operating activities as determined under IFRS.
The following table provides a reconciliation of cash operating costs and cash operating costs excluding royalties, cash operating costs per pound and cash operating costs excluding royalties per pound for the Maracás Menchen Mine to operating costs as per the Q1 2023 unaudited condensed interim consolidated financial statements.
For further information, please contact:
Investor Relations Alex Guthrie Senior Manager, External Relations +1.416.861.9778 aguthrie@largoinc.com
Revenue Increases 26% to $40.0M Compared to $31.8M in Q1 2022
Income From Operations Grew to $5.6M Compared to ($4.8M) in Q1 2022
Adjusted EBITDA (1) of $14.5M, or 36% of Revenue, Compared to $7.9M, or 25% in Q1 2022
Company Generates $2.7M in Free Cash Flow (2)
Continues to Deepen Foothold in Colorado & New Mexico with Newly Signed Asset Purchases
Conference Call & Webcast Scheduled for Today – 5:00 pm ET
DENVER, May 10, 2023 /CNW/ – Medicine Man Technologies Inc. operating as Schwazze, (OTCQX: SHWZ) (NEO: SHWZ) (“Schwazze” or the “Company”), today announced financial results for the first quarter (“Q1 2023”).
Q1 2023 Financial Summary:
Revenues of $40.0M, an increase of 26% compared to $31.8M in Q1 2022
Gross Profit of $23.0M, an increase of 111% compared to $10.9M in Q1 2022
Operating Income of $5.6M, an increase of $10.4M compared to ($4.8M) in Q1 2022
Adjusted EBITDA (1) of $14.5M was 36.3% of revenue, compared to $7.9M and 24.7% of revenue for Q1 2022
Net Income of $1.7M, an increase of $28.5M compared to net loss of ($26.8M) in Q1 2022
Free Cash Flow (2) of $2.7M, a decrease of $3.0M compared to $5.7M in Q1 2022
Retail sales of $35.8M, an increase of 35% compared to $26.5M in Q1 2022
Accomplishments for Q1 2023
During the first quarter of 2023, Schwazze continued its expansion plans into Colorado and New Mexico. In Colorado, the Company entered into definitive agreements to acquire two Smokey’s retail dispensaries in Fort Collins and Garden City, as well as Standing Akimbo, the largest medical dispensary in Colorado. In New Mexico, the Company entered into a definitive agreement to acquire 14 retail dispensaries, one manufacturing and one cultivation facility from Everest. These acquisitions continue to deepen Company’s foothold in Colorado and New Mexico with a total dispensary count to-date of 60, as well as three manufacturing facilities and six operating cultivation facilities.
Recent 2023 Developments
In January, we announced new Chief Financial Officer, Forrest Hoffmaster
In February, we announced new Chief Legal Officer, Christine Jones
In March, we opened two new R.Greenleaf locations in New Mexico – Albuquerque and Carlsbad
In March, we launched an enhanced customer ecommerce platform in New Mexico for the R.Greenleaf retail banner
In April, we launched the expansion of our in-house product portfolio with a new pre-ground, ready-to-roll flower brand, EDW or Every Day Weed
In May, we announced new Executive Vice President of Commercial Sales, Chris Driessen
In May, we launched an enhanced custom e-commerce platform in Colorado for the Emerald Fields retail banner
“To date, we have opened, acquired, or announced pending acquisitions of 60 dispensaries with six operating cultivations and three manufacturing facilities across Colorado and New Mexico,” stated Justin Dye, CEO of Schwazze. “We believe our growing variety of retail brands resonate strongly with our cannabis customers, and the team is well-positioned to play offense as we continue to strengthen our position for shareholders.”
“Schwazze continues to gain significant momentum in its performance year-over-year despite a continued challenging environment, particularly in Colorado,” said Nirup Krishnamurthy, President of Schwazze. “We are excited about the pending acquisitions in our portfolio and the forthcoming retail banners of Standing Akimbo and Everest. In addition, the expansion of our in-house product portfolio with the launch of our pre-ground, ready-to-roll flower brand, EDW, provides our consumers with more variety in product selection.
Q1 2023 Results of Operations Consolidated First Quarter revenues of $40 million dollars increased $8.2 million dollars or 26% compared to $31.8 million dollars for the same quarter last year. Quarter over quarter revenues remain flat as is seasonally typical for the industry.
Income from operations was $5.6 million dollars and improved $10.4 million dollars over the ($4.8) million dollar loss from operations in the first quarter of 2022. Adjusted EBITDA for Q1 2023 was $14.5 million dollars or 36.3% of revenue compared to $7.9 million dollars or 24.7% of revenue for the same period last year. We ended the quarter with $35 million in cash.
Total cost of goods and services was $17.0 million dollars compared to $20.8 million for the same period last year, representing a $3.8 million dollar decrease or 18.6%. This was primarily due to overall cost improvements due to vertical integration in New Mexico.
As a result, gross profit increased to $23.0 million dollars or 58% of total revenue compared to $10.9 million dollars or 34% for the same quarter last year with quarter over quarter improvement as compared to $23 million or 57% of total revenue in Q4 2022.
Total Operating Expenses totaled $17.4 million dollars for Q1 2023 as compared to $15.7 million for Q1 2022, representing an increase of $1.7 million dollars driven by payroll tax refunds offset by intangible asset amortization related to non-cash purchase price accounting adjustments from 2022 acquisitions reflected in selling, general and administrative expenses.
Other income for Q1 2023 was $758 thousand dollars, compared to other expense of $20.7 million dollars for the same quarter last year. The year-over-year change in other income/expense was driven by the accounting revaluation of the derivative liability related to the convertible note.
As a result, Schwazze generated Net Income of $1.7 million dollars compared to a Net Loss of ($26.8) million dollars for Q1 2023.
Forrest Hoffmaster, CFO for Schwazze commented, “While weathering tough macro economic and industry specific conditions, our team continues to deliver disciplined improvements to the core business infrastructure with smart, accretive acquisitions within two highly competitively markets. We are pleased with our start to 2023, our ability to produce strong results, a desirable cash position, and free cash flow.”
(1)
Adjusted EBITDA represents earnings before interest, taxes, depreciation, and amortization, adjusted for other income, non-cash share-based compensation, one-time transaction related expenses, or other non-operating costs. The Company uses adjusted EBITDA as it believes it better explains the results of its core business.
(2)
Free Cash Flow, a non-GAAP measure, represents cash flow from operations, adding back cash interest expense for the period, less capital expenditures for the period.
Webcast – Wednesday, May 10 – 5:00 pm ET Investors and stakeholders may participate in the conference call by dialing 416-764-8650 or by dialing North American toll free 1-888-664-6383 or listen to the webcast from the Company’s website at https://ir.schwazze.com The webcast will be available on the Company’s website and on replay until May 17, 2023, and may be accessed by dialing 1-416-764-8677 or North American toll free 1-888-390-0541 / 592815 #.
Following their prepared remarks, Company management will answer investor questions. Investors may submit questions in advance or during the conference call itself through the weblink: https://app.webinar.net/x0q6rpnP84n This weblink has been posted to the Company’s website and will be archived on the website. All Company SEC filings can also be accessed on the Company website at https://ir.schwazze.com/sec-filings.
About Schwazze Schwazze (OTCQX: SHWZ) (NEO: SHWZ) is building a premier vertically integrated regional cannabis company with assets in Colorado and New Mexico and will continue to take its operating system to other states where it can develop a differentiated regional leadership position. Schwazze is the parent company of a portfolio of leading cannabis businesses and brands spanning seed to sale. The Company is committed to unlocking the full potential of the cannabis plant to improve the human condition, deriving its name from the pruning technique of a cannabis plant to enhance plant structure and promote healthy growth.
Since April 2020, Schwazze has acquired, opened, or announced the planned acquisition of 60 cannabis retail dispensaries (bannered as Star Buds, Emerald Fields, R. Greenleaf, Standing Akimbo, and Everest) as well as six operating cultivation facilities and three manufacturing plants across Colorado and New Mexico. In May 2021, Schwazze announced its Biosciences division, and in August 2021, it commenced home delivery services in Colorado.
Schwazze is anchored by a high-performance culture that combines customer-centric thinking and data science to test, measure, and drive decisions and outcomes. The Company’s leadership team has deep expertise in retailing, wholesaling, and building consumer brands at Fortune 500 companies as well as in the cannabis sector. Schwazze is passionate about making a difference in our communities, promoting diversity and inclusion, and doing its part to incorporate climate-conscious best practices.
Medicine Man Technologies, Inc. was Schwazze’s former operating trade name. The corporate entity continues to be named Medicine Man Technologies, Inc.
Forward-Looking Statements This press release contains “forward-looking statements.” Such statements may be preceded by the words “may,” “will,” “could,” “would,” “should,” “expect,” “intends,” “plans,” “strategy,” “prospects,” “anticipate,” “believe,” “approximately,” “estimate,” “predict,” “project,” “potential,” “continue,” “ongoing,” or the negative of these terms or other words of similar meaning in connection with a discussion of future events or future operating or financial performance, although the absence of these words does not necessarily mean that a statement is not forward-looking. Forward-looking statements are not guarantees of future events or performance, are based on certain assumptions, and are subject to various known and unknown risks and uncertainties, many of which are beyond the Company’s control and cannot be predicted or quantified. Consequently, actual events and results may differ materially from those expressed or implied by such forward-looking statements. Such risks and uncertainties include, without limitation, risks and uncertainties associated with (i) regulatory limitations on our products and services and the uncertainty in the application of federal, state, and local laws to our business, and any changes in such laws; (ii) our ability to manufacture our products and product candidates on a commercial scale on our own or in collaboration with third parties; (iii) our ability to identify, consummate, and integrate anticipated acquisitions; (iv) general industry and economic conditions; (v) our ability to access adequate capital upon terms and conditions that are acceptable to us; (vi) our ability to pay interest and principal on outstanding debt when due; (vii) volatility in credit and market conditions; (viii) the loss of one or more key executives or other key employees; and (ix) other risks and uncertainties related to the cannabis market and our business strategy. More detailed information about the Company and the risk factors that may affect the realization of forward-looking statements is set forth in the Company’s filings with the Securities and Exchange Commission (SEC), including the Company’s Annual Report on Form 10-K and its Quarterly Reports on Form 10-Q. Investors and security holders are urged to read these documents free of charge on the SEC’s website at http://www.sec.gov. The Company assumes no obligation to publicly update or revise its forward-looking statements as a result of new information, future events or otherwise except as required by law.
For more than 70 years, Vectrus has provided critical mission support for our customers’ toughest operational challenges. As a high-performing organization with exceptional talent, deep domain knowledge, a history of long-term customer relationships, and groundbreaking technical expertise, we deliver innovative, mission-matched solutions for our military and government customers worldwide. Whether it’s base operations support, supply chain and logistics, IT mission support, engineering and digital integration, security, or maintenance, repair and overhaul, our customers count on us for on-target solutions that increase efficiency, reduce costs, improve readiness, and strengthen national security. Vectrus is headquartered in Colorado Springs, Colo., and includes about 8,100 employees spanning 205 locations in 28 countries. In 2021, Vectrus generated sales of $1.8 billion. For more information, visit the company’s website at www.vectrus.com or connect with Vectrus on Facebook, Twitter, and LinkedIn.
Joe Gomes, Managing Director, Equity Research Analyst, Generalist , Noble Capital Markets, Inc.
Joshua Zoepfel, Research Associate, Noble Capital Markets, Inc.
Refer to the full report for the price target, fundamental analysis, and rating.
An Excellent Quarter. Driven by outstanding results in the INDOPACOM region, V2X reported excellent results for 1Q23. With the Talisman exercise moving “to the left,” INDOPACOM revenue increased 300% year-over-year and 18% sequentially. Continued expansion on existing programs, contribution from new awards, and successful re-competes, all added to top line growth.
1Q23 Results. Revenue came in at $943.5 million, up 12% y-o-y on a pro forma basis, and exceeded our $830 million estimate. Adjusted EBITDA was $68 million, or a 7.2% margin, compared to our estimate of $54.8 million. Adjusted diluted EPS was $0.80 versus our projection of $0.62.
Equity Research is available at no cost to Registered users of Channelchek. Not a Member? Click ‘Join’ to join the Channelchek Community. There is no cost to register, and we never collect credit card information.
This Company Sponsored Research is provided by Noble Capital Markets, Inc., a FINRA and S.E.C. registered broker-dealer (B/D).
*Analyst certification and important disclosures included in the full report. NOTE: investment decisions should not be based upon the content of this research summary. Proper due diligence is required before making any investment decision.
Townsquare is a community-focused digital media and digital marketing solutions company with market leading local radio stations, principally focused outside the top 50 markets in the U.S. Our assets include a subscription digital marketing services business, Townsquare Interactive, providing website design, creation and hosting, search engine optimization, social media and online reputation management as well as other digital monthly services for approximately 26,800 SMBs; a robust digital advertising division, Townsquare IGNITE, a powerful combination of a) an owned and operated portfolio of more than 330 local news and entertainment websites and mobile apps along with a network of leading national music and entertainment brands, collecting valuable first party data, and b) a proprietary digital programmatic advertising technology stack with an in-house demand and data management platform; and a portfolio of 321 local terrestrial radio stations in 67 U.S. markets strategically situated outside the Top 50 markets in the United States. Our portfolio includes local media brands such as WYRK.com, WJON.com, and NJ101.5.com and premier national music brands such as XXLmag.com, TasteofCountry.com, UltimateClassicRock.com and Loudwire.com.
Michael Kupinski, Director of Research, Equity Research Analyst, Digital, Media & Technology , Noble Capital Markets, Inc.
Patrick McCann, CFA, Research Analyst, Noble Capital Markets, Inc.
Refer to the full report for the price target, fundamental analysis, and rating.
Beats Q1 estimates. The company reported another industry leading performance in the first quarter with revenues up 2.9% to $103.1 million, beating our $100.9 million estimate. We estimate that industry revenues likely will be down in the range of 3% to 5%. First quarter adj. EBITDA was $19.4 million, which beat our $17.9 million estimate.
Digital surpasses 50% of revenue. Digital revenue grew 8% in the quarter, accounting for 54% of total revenue. Impressively, Digital contributed 63% of total operating profit. The Digital revenue growth was fueled by the company’s Digital Advertising solutions business, which was up 15%, making up for the slight decline in Townsquare Interactive revenue.
Equity Research is available at no cost to Registered users of Channelchek. Not a Member? Click ‘Join’ to join the Channelchek Community. There is no cost to register, and we never collect credit card information.
This Company Sponsored Research is provided by Noble Capital Markets, Inc., a FINRA and S.E.C. registered broker-dealer (B/D).
*Analyst certification and important disclosures included in the full report. NOTE: investment decisions should not be based upon the content of this research summary. Proper due diligence is required before making any investment decision.
Snail is a leading, global independent developer and publisher of interactive digital entertainment for consumers around the world, with a premier portfolio of premium games designed for use on a variety of platforms, including consoles, PCs and mobile devices.
Michael Kupinski, Director of Research, Equity Research Analyst, Digital, Media & Technology , Noble Capital Markets, Inc.
Patrick McCann, CFA, Research Analyst, Noble Capital Markets, Inc.
Refer to the full report for the price target, fundamental analysis, and rating.
Q1 results. The company reported quarterly results largely in line with our expectations. Q1 revenue was $13.5 million and adj. EBITDA was a loss of $3.4 million, compared with our estimates of $12.5 million and a loss of $2.6 million, respectively.
ARK Remastered. The release of a remastered version of its popular game ARK is expected later this year. The game, which will be remastered using Unreal Engine 5, will be called ARK: Survival Ascended, and will include the entirety of ARK: Survival Evolved, including previously issued DLCs. Core fans appear excited about the upcoming release, which we believe could offer a favorable revenue boost during the lead up to the ARK 2 release in 2024.
Equity Research is available at no cost to Registered users of Channelchek. Not a Member? Click ‘Join’ to join the Channelchek Community. There is no cost to register, and we never collect credit card information.
This Company Sponsored Research is provided by Noble Capital Markets, Inc., a FINRA and S.E.C. registered broker-dealer (B/D).
*Analyst certification and important disclosures included in the full report. NOTE: investment decisions should not be based upon the content of this research summary. Proper due diligence is required before making any investment decision.
One Stop Systems, Inc. (OSS) designs and manufactures innovative AI Transportable edge computing modules and systems, including ruggedized servers, compute accelerators, expansion systems, flash storage arrays, and Ion Accelerator™ SAN, NAS, and data recording software for AI workflows. These products are used for AI data set capture, training, and large-scale inference in the defense, oil and gas, mining, autonomous vehicles, and rugged entertainment applications. OSS utilizes the power of PCI Express, the latest GPU accelerators and NVMe storage to build award-winning systems, including many industry firsts, for industrial OEMs and government customers. The company enables AI on the Fly® by bringing AI datacenter performance to ‘the edge,’ especially on mobile platforms, and by addressing the entire AI workflow, from high-speed data acquisition to deep learning, training, and inference. OSS products are available directly or through global distributors. For more information, go to www.onestopsystems.com.
Joe Gomes, Managing Director, Equity Research Analyst, Generalist , Noble Capital Markets, Inc.
Joshua Zoepfel, Research Associate, Noble Capital Markets, Inc.
Refer to the full report for the price target, fundamental analysis, and rating.
New Award. One Stop Systems received an initial order from a new military prime contractor for OSS 3U short-depth servers (SDS) for use by a U.S. Air Force anti-electronic warfare system. OSS has already commenced shipments under an initial purchase order. This program is the company’s first with this prime contractor. It is valued at approximately $3.5 million over the next three years.
SDS. The servers feature proprietary OSS Gen 4 PCI express NVMe controllers, OSS transportable hot-swap drive canisters, and NVMe SSDs that support government encryption standards. The servers are expected to serve as a head storage node for data collection located at U.S. Air Force ground stations that house military aircraft. They will be capable of recording large volumes of simulation data and deliver it at high speeds with low latency to data scientists on the network.
Equity Research is available at no cost to Registered users of Channelchek. Not a Member? Click ‘Join’ to join the Channelchek Community. There is no cost to register, and we never collect credit card information.
This Company Sponsored Research is provided by Noble Capital Markets, Inc., a FINRA and S.E.C. registered broker-dealer (B/D).
*Analyst certification and important disclosures included in the full report. NOTE: investment decisions should not be based upon the content of this research summary. Proper due diligence is required before making any investment decision.