GLYFADA, Greece, March 12, 2026 (GLOBE NEWSWIRE) — Seanergy Maritime Holdings Corp. (the “Company” or “Seanergy”) (NASDAQ: SHIP) announced today that it has agreed to acquire two scrubber-fitted 181,500 dwt Capesize vessels to be constructed at a first-class shipyard in Japan and has entered into an agreement for the sale of the 2010-built M/V Squireship.
The transactions expand the Company’s newbuilding program to five vessels (four Capesizes and one Newcastlemax) totaling approximately $384.0 million and underscore its disciplined fleet renewal strategy, which focuses on reallocating capital from older vessels into modern, fuel-efficient tonnage with attractive delivery positions.
Acquisition of Two Japanese Newbuilding Capesizes
The Company entered into an agreement with an unaffiliated third party in Japan for the acquisition of a 181,500 dwt scrubber fitted Capesize newbuilding vessel with prompt delivery, constructed at a first-class Japanese Shipyard. The delivery is expected between the second and the third quarter of 2027.
In addition, the Company has entered into a 10-year bareboat-in contract for a second 181,500 dwt scrubber fitted Capesize dry bulk vessel to be constructed by the same first-class Japanese shipyard with delivery expected in the first quarter of 2029. Seanergy has the option to acquire the vessel starting at the end of year five until the end of the charter period.
The combined acquisition cost of the above vessels is estimated at approximately $158 million, assuming the exercise of the option to acquire the second vessel at the end of the 10-year period and excluding interest payments under the bareboat scheme.
The Company believes that securing a prompt 2027 delivery position from a top-tier Japanese yard represents a highly attractive strategic opportunity, given the limited availability of near-term construction slots and the strong expected demand for modern Capesize tonnage over the near and medium-term. In addition, the structure associated with the second Japanese Capesize vessel, provides Seanergy with advantageous fleet renewal optionality while maintaining capital flexibility.
Sale of M/V Squireship
Seanergy has agreed to sell the M/V Squireship, a 2010-built Capesize vessel constructed in South Korea with a cargo capacity of 170,018 dwt, to United Maritime Corporation, a related party, for a purchase price of $29.5 million, with delivery expected between end April to beginning of June 2026.
The transaction is expected to generate net cash proceeds of approximately $13.5 million after repayment of the associated debt, supporting the Company’s ongoing newbuilding program, while reducing Seanergy’s average fleet age. The vessel sale is expected to result in an accounting profit of around $4 million, which will be recorded in Seanergy’s second quarter financial results.
The transaction allows the Company to monetize the Squireship at an attractive market valuation. Following delivery, Seanergy will continue to provide technical and commercial management services to the vessel, facilitating the continuation of the vessel’s existing commercial employment.
Stamatis Tsantanis, the Company’s Chairman & Chief Executive Officer, stated:
“These transactions represent another step in the disciplined renewal of our fleet. By monetizing an older vessel at an attractive valuation and reinvesting in high-quality Japanese newbuildings with favorable delivery positions, we continue to enhance the long-term earnings capacity and efficiency of our fleet.
“Including our newbuilding orders in China, we expect to take delivery of five high-quality vessels with a total contract value of approximately $384 million, including three deliveries in mid-2027, one in mid-2028 and one in early-2029. We believe vessels delivering between 2027 and 2029 will be well positioned to benefit from strong Capesize fundamentals, an aging fleet and constrained vessel supply.
“Our strategy remains clear: reallocate capital from older assets into modern Capesize tonnage, maintain balance sheet discipline, and position the Company to capture long-term market upside. At the same time, we remain firmly committed to our capital return policy and expect to continue delivering meaningful returns to our shareholders.”
Commercial Performance Update
Further to the Company’s previous commercial updates provided in the FY 2025 Earnings Release, Seanergy has secured fixed rates for approximately 45% of its available operating days for the period Q2–Q4 2026, at an average gross daily rate of $29,300. These fixtures enhance forward earnings visibility while preserving meaningful exposure to market upside.
Sphinx – Economou Litigation Update
The Supreme Court of the Republic of the Marshall Islands affirmed the dismissal of the lawsuit brought by Sphinx Investment Corp., an affiliate of George Economou, upholding the prior decision of the High Court of the Republic of the Marshall Islands. The ruling brings this matter to a final resolution.
About Seanergy Maritime Holdings Corp.
Seanergy Maritime Holdings Corp. is a prominent pure-play Capesize ship-owner publicly listed in the U.S. Seanergy provides marine dry bulk transportation services through a modern fleet of Capesize vessels. The Company owns or finance leases 20 vessels (2 Newcastlemax and 18 Capesize) with an average age of approximately 14.7 years and an aggregate cargo carrying capacity of approximately 3,633,861 dwt. Following the sale of the M/V Squireship and the delivery of the newbuilding vessels, the Company will own or finance lease 24 vessels (3 Newcastlemax and 21 Capesize), with an aggregate cargo carrying capacity of approximately 4,400,343 dwt.
The Company is incorporated in the Republic of the Marshall Islands and has executive offices in Glyfada, Greece. The Company’s common shares trade on the Nasdaq Capital Market under the symbol “SHIP”. Please visit our company website at: www.seanergymaritime.com.
Forward-Looking Statements
This press release contains forward-looking statements (as defined in Section 27A of the Securities Act of 1933, as amended, and Section 21E of the Securities Exchange Act of 1934, as amended) concerning future events, including with respect to declaration of dividends, market trends and shareholder returns. Words such as “may”, “should”, “expects”, “intends”, “plans”, “believes”, “anticipates”, “hopes”, “estimates” and variations of such words and similar expressions are intended to identify forward-looking statements. These statements involve known and unknown risks and are based upon a number of assumptions and estimates, which are inherently subject to significant uncertainties and contingencies, many of which are beyond the control of the Company. Actual results differ materially from those expressed or implied by such forward-looking statements. Factors that could cause actual results to differ materially include, but are not limited to, the Company’s operating or financial results; the Company’s liquidity, including its ability to service its indebtedness; competitive factors in the market in which the Company operates; shipping industry trends, including charter rates, vessel values and factors affecting vessel supply and demand; future, pending or recent acquisitions and dispositions, business strategy, impacts of litigation, areas of possible expansion or contraction, and expected capital spending or operating expenses; risks associated with operations outside the United States; risks arising from trade disputes between the U.S. and China, including the re-imposition of reciprocal port fees; broader market impacts arising from trade disputes or war (or threatened war) or international hostilities, such as between the U.S. and Venezuela, Israel and Hamas or Iran, China and Taiwan and Russia and Ukraine; risks associated with the length and severity of pandemics; and other factors listed from time to time in the Company’s filings with the SEC, including its most recent annual report on Form 20-F. The Company’s filings can be obtained free of charge on the SEC’s website at www.sec.gov. Except to the extent required by law, the Company expressly disclaims any obligations or undertaking to release publicly any updates or revisions to any forward-looking statements contained herein to reflect any change in the Company’s expectations with respect thereto or any change in events, conditions or circumstances on which any statement is based.
Mark Reichman, Managing Director, Equity Research Analyst, Natural Resources, Noble Capital Markets, Inc.
Hans Baldau, Associate Analyst, Noble Capital Markets, Inc.
Refer to the full report for the price target, fundamental analysis, and rating.
FY2025 financial results. FreightCar America generated 2025 adjusted earnings per share (EPS) of $0.50 per share compared to $0.15 per share in 2024. Gross margin as a percentage of revenue increased to 14.6% compared to 12.0% in FY2024. Revenue and rail car deliveries decreased to $501.0 million and 4,125, respectively, compared to $559.4 million and 4,362 in 2024. Adjusted EBITDA increased to $44.8 million compared to $43.0 million in 2024. Full year adjusted free cash flow amounted to $31.4 million versus $21.7 million in 2024.
FY2026 corporate guidance. Railcar deliveries are expected to be in the range of 4,000 to 4,500, revenue in the range of $500 to $550 million, and adjusted EBITDA of $41 to $50 million. Guidance for 2026 adj. EBITDA reflects facility lease expenses recorded in cost of goods sold instead of previously classified within interest expense. On a lease-adjusted basis, 2025 adj. EBITDA was $41.2 million.
Equity Research is available at no cost to Registered users of Channelchek. Not a Member? Click ‘Join’ to join the Channelchek Community. There is no cost to register, and we never collect credit card information.
This Company Sponsored Research is provided by Noble Capital Markets, Inc., a FINRA and S.E.C. registered broker-dealer (B/D).
*Analyst certification and important disclosures included in the full report. NOTE: investment decisions should not be based upon the content of this research summary. Proper due diligence is required before making any investment decision.
Mark Reichman, Managing Director, Equity Research Analyst, Natural Resources, Noble Capital Markets, Inc.
Hans Baldau, Associate Analyst, Noble Capital Markets, Inc.
Refer to the full report for the price target, fundamental analysis, and rating.
Q4′ 2025 financial results. RAIL generated Q4′ 2025 adj. net income of $4.9 million or $0.16 per share, compared to net income of $8.0 million or $0.21 per share in Q4′ 2024. We had projected net income of $6.1 million or $0.18 per share. Gross margin as a percentage of revenue decreased to 13.4% compared to 15.3% in Q4′ 2024 and our estimate of 14.0%. Revenue declined to $125.6 million compared to $137.7 million during the prior year period, while rail car deliveries increased to 1,172 compared to 1,019 units. We had projected rail car deliveries of 1,557 and revenue of $139.9 million. Adj. EBITDA declined to $10.4 million compared to $13.9 million in Q4′ 2024. We had forecasted adj. EBITDA of $12.5 million.
FY2026 corporate guidance. Railcar deliveries are expected to be in the range of 4,000 to 4,500, revenue in the range of $500 to $550 million, and adjusted EBITDA of $41 to $50 million. In FY2025, railcar deliveries were 4,125, revenue amounted to $501.0 million, and adjusted EBITDA totaled $44.8 million. FY2026 guidance is below our current 2026 estimates. Following relatively soft industry orders during the fourth quarter of 2025, we think management is taking a conservative view based on an increasingly uncertain economic outlook and an EOY 2025 backlog of 1,926 units valued at $137.5 million. Moreover, 2026 adj. EBITDA guidance reflects facility lease expenses recorded in cost of goods sold instead of previously classified within interest expense. On a lease-adjusted basis, 2025 adj. EBITDA was $41.2 million.
Equity Research is available at no cost to Registered users of Channelchek. Not a Member? Click ‘Join’ to join the Channelchek Community. There is no cost to register, and we never collect credit card information.
This Company Sponsored Research is provided by Noble Capital Markets, Inc., a FINRA and S.E.C. registered broker-dealer (B/D).
*Analyst certification and important disclosures included in the full report. NOTE: investment decisions should not be based upon the content of this research summary. Proper due diligence is required before making any investment decision.
ATHENS, Greece, Feb. 18, 2026 (GLOBE NEWSWIRE) — EuroDry Ltd. (NASDAQ: EDRY, the “Company” or “EuroDry”), an owner and operator of drybulk vessels and provider of seaborne transportation for drybulk cargoes, announced today that it will release its financial results for the fourth quarter ended December 31, 2025, on Thursday, February 19, 2026 after market closes in New York.
On the next day, Friday, February 20, 2026, at 8:00 a.m. Eastern Time, the Company’s management will host a conference call and webcast to discuss the results.
ConferenceCalldetails: Participants should dial into the call 10 minutes before the scheduled time using the following numbers: 877 405 1226 (US Toll-Free Dial In) or +1 201 689 7823 (US and Standard International Dial In). Please quote “EuroDry” to the operator and/or conference ID 13758897. Click here for additional participant International Toll-Free access numbers.
Alternatively, participants can register for the call using the call me option for a faster connection to join the conference call. You can enter your phone number and let the system call you right away. Click here for the call me option.
AudioWebcast-SlidesPresentation: There will be a live and then archived webcast of the conference call and accompanying slides, available on the Company’s website. To listen to the archived audio file, visit our website http://www.eurodry.gr and click on Company Presentations under our Investor Relations page. Participants to the live webcast should register on the website approximately 10 minutes prior to the start of the webcast.
The slide presentation for the fourth quarter ended December 31, 2025, will also be available in PDF format 10 minutes prior to the conference call and webcast, accessible on the company’s website (www.eurodry.gr) on the webcast page. Participants to the webcast can download the PDF presentation.
About EuroDryLtd. EuroDry Ltd. was formed on January 8, 2018, under the laws of the Republic of the Marshall Islands to consolidate the drybulk fleet of Euroseas Ltd. into a separate listed public company. EuroDry was spunoff from Euroseas Ltd on May 30, 2018; it trades on the NASDAQ Capital Market under the ticker EDRY.
EuroDry operates in the dry cargo, drybulk shipping market. EuroDry’s operations are managed by Eurobulk Ltd., an ISO 9001:2008 and ISO 14001:2004 certified affiliated ship management company and Eurobulk (Far East) Ltd. Inc., which are responsible for the day-to-day commercial and technical management and operations of the vessels. EuroDry employs its vessels on spot and period charters and under pool agreements.
The Company has a fleet of 11 vessels, including 3 Panamax drybulk carriers, 5 Ultramax drybulk carriers, 2 Kamsarmax drybulk carriers and 1 Supramax drybulk carrier. EuroDry’s 11 drybulk carriers have a total cargo capacity of 766,420 dwt. After the delivery of two Ultramax vessels in 2027, the Company’s fleet will consist of 13 vessels with a total carrying capacity of 893,420 dwt.
InvestorRelations/FinancialMedia Nicolas Bornozis Markella Kara Capital Link, Inc. 230 Park Avenue, Suite 1540 New York, NY 10169 Tel. (212) 661-7566 E-mail: eurodry@capitallink.com
Declares $0.20 Per Share Dividend and Expands Prompt Newbuilding Program Totaling $226m
Highlights and Developments:
Fifth consecutive year of profitability, delivering adjusted EPS of $1.28, underscoring the resilience and earnings power of Seanergy’s pure-play Capesize strategy across cycles
Declared a Q4 cash dividend of $0.20 per share and total cash dividends for 2025 of $0.43 per share
The Q4 dividend marks the Company’s 17th consecutive quarterly dividend bringing cumulative distributions to $2.64 per share, or approximately $51.2 million
Expanded the prompt newbuilding program to three eco vessels totaling $226million, securing attractive early delivery positions and enhancing future earnings capacity:
Two scrubber-fitted 181,000 dwt Capesize bulkers with expected deliveries in Q2 and Q3 2027
One scrubber-fitted 211,000 dwt Newcastlemax bulker with expected delivery in Q2 2028
Advanced fleet renewal through the sale of the 2010-built M/V Dukeship at a highly attractive valuation, via an 18-month bareboat charter with purchase obligation, generating positive cash flows and releasing significant liquidity
Completed $123.0 million of refinancings at improved terms, generating $51.9 million of incremental liquidity in Q4 and this year to date
Q1 TCE guidance of $25,2732, representing a 14% premium to the average AV5 Baltic Capesize Index year-to-date
____________________________ 1 Adjusted earnings per share, Adjusted Net Income, EBITDA and Adjusted EBITDA are non-GAAP measures. Please see the reconciliation below of Adjusted earnings per share, Adjusted Net Income, EBITDA and Adjusted EBITDA to net income, the most directly comparable U.S. GAAP measure.
ATHENS, Greece, Feb. 17, 2026 (GLOBE NEWSWIRE) — Seanergy Maritime Holdings Corp. (“Seanergy” or the “Company”) (NASDAQ: SHIP), a leading pure-play Capesize shipping company, today reported its financial results for the fourth quarter and twelve months ended December 31, 2025, and announced a quarterly cash dividend of $0.20 per common share. This represents Seanergy’s 17th consecutive quarterly dividend under its capital return policy, with total cash dividends for 2025 of $0.43 per common share, underscoring the Company’s commitment to disciplined capital allocation and consistent shareholder returns.
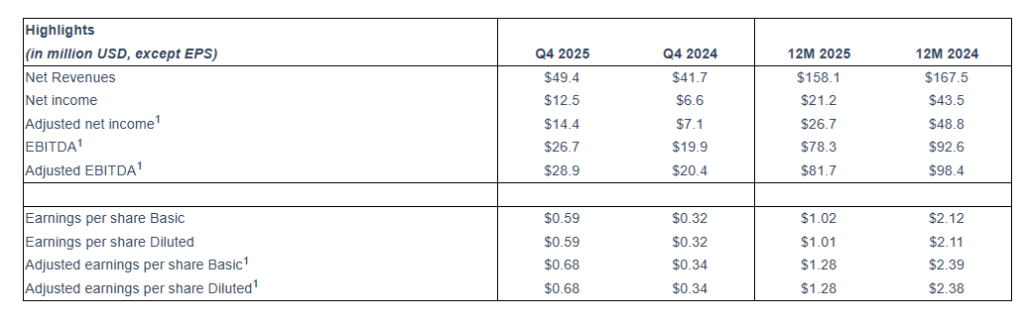
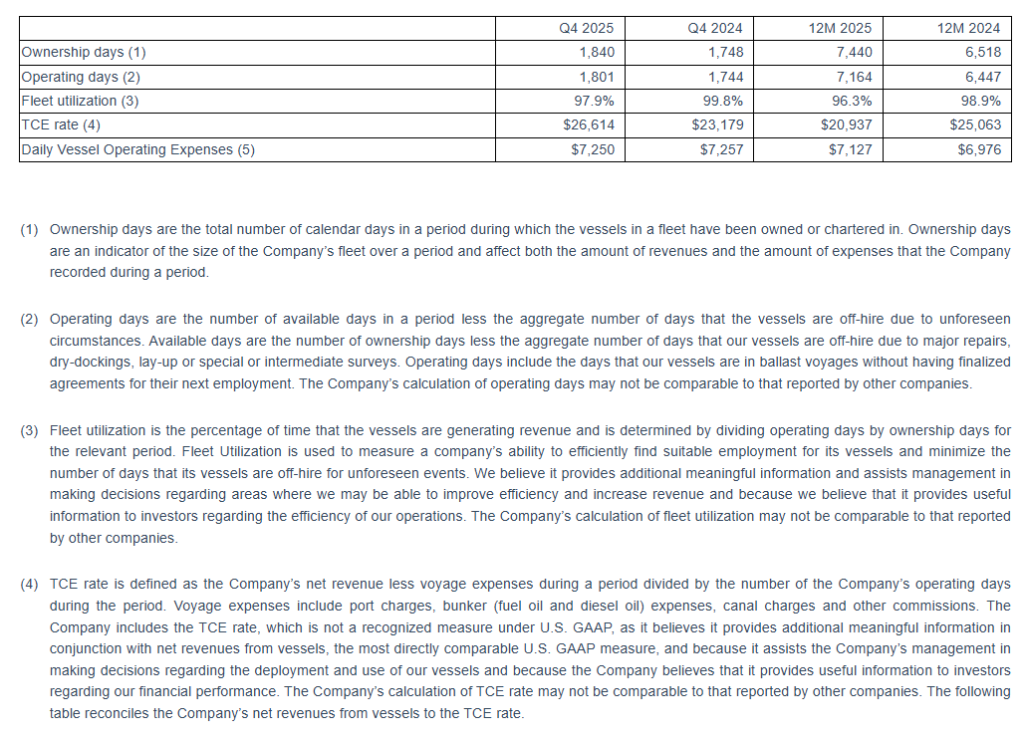
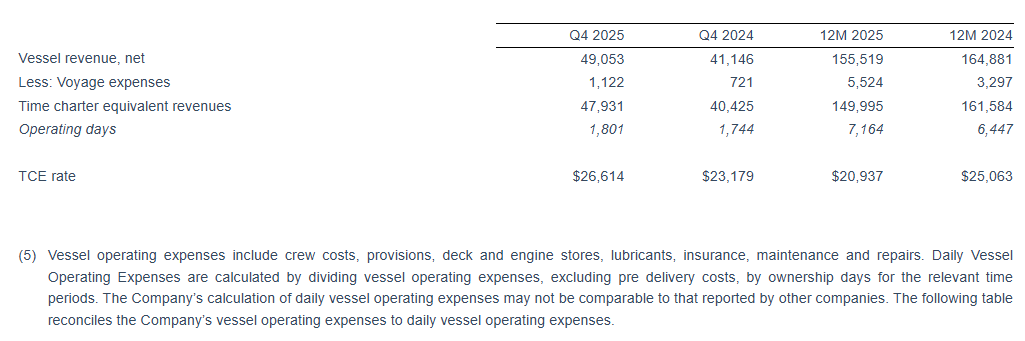
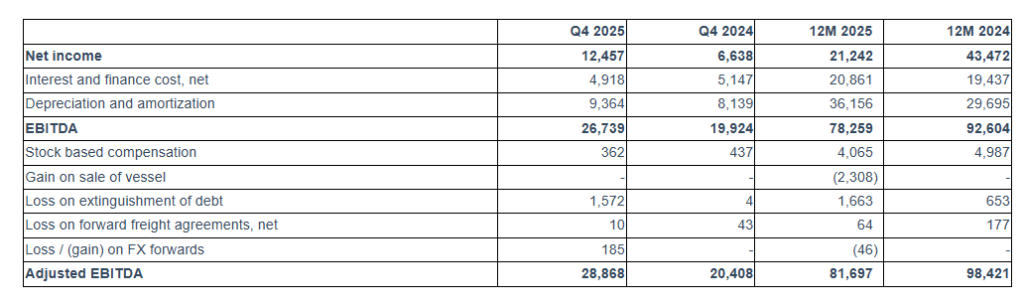
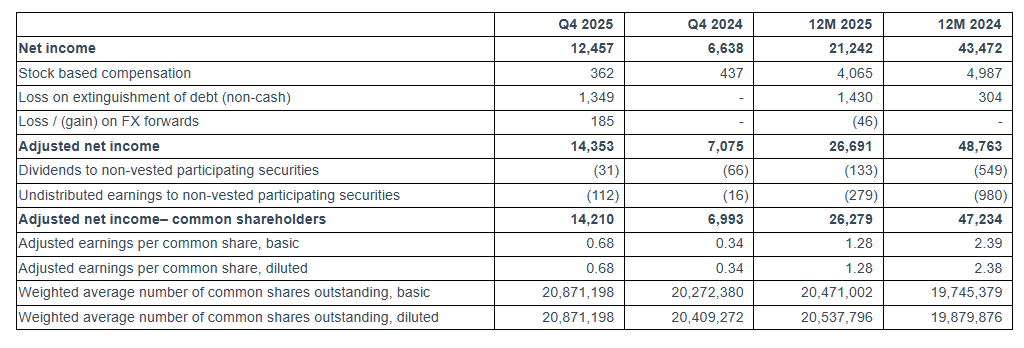
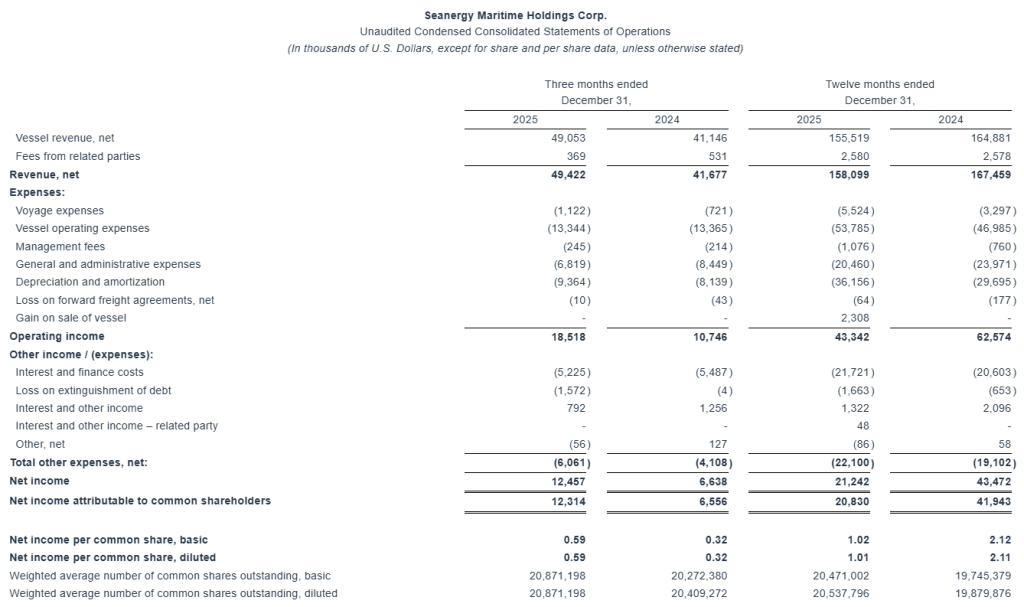
For the quarter ended December 31, 2025, Seanergy generated Net Revenues of $49.4 million, up from $41.7 million in the fourth quarter of 2024. Net Income and Adjusted Net Income for the quarter were $12.5 million and $14.4 million, respectively, compared to Net Income of $6.6 million and Adjusted Net Income of $7.1 million in the fourth quarter of 2024. Adjusted EBITDA for the quarter was $28.9 million, compared to $20.4 million in the same period of 2024. The fleet achieved a daily Time Charter Equivalent (“TCE”) of $26,614 for the fourth quarter of 2025.
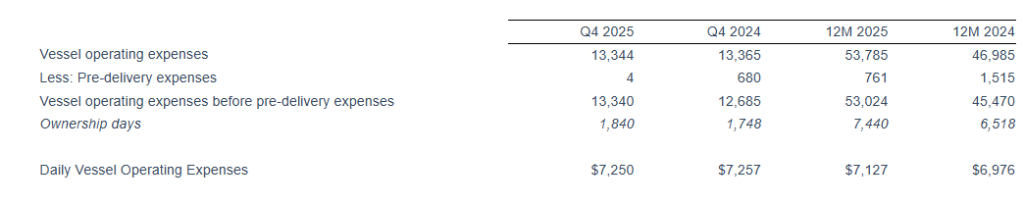
For the full year 2025, Seanergy delivered Net Revenues of $158.1 million, compared to $167.5 million in 2024. Net Income and Adjusted Net Income were $21.2 million and $26.7 million, respectively, compared to Net Income of $43.5 million and Adjusted Net Income of $48.8 million in 2024. Adjusted EBITDA for the twelve months was $81.7 million, compared to $98.4 million for 2024. The daily TCE rate of the fleet for 2025 was $20,937, compared to $25,063 in 2024. The average daily OPEX was $7,127 compared to $6,976 in 2024.
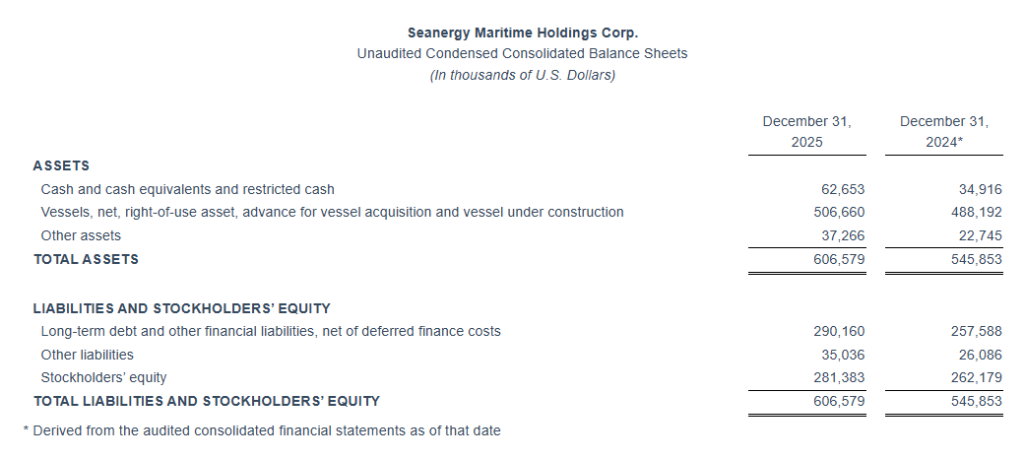
Cash and cash-equivalents and restricted cash, as of December 31, 2025, stood at $62.7 million. Stockholders’ equity at the end of the fourth quarter was $281.4 million. Long-term debt (senior loans and other financial liabilities) net of deferred charges stood at $290.2 million, while the book value of the fleet was $506.7 million, including vessels under construction.
Stamatis Tsantanis, the Company’s Chairman & Chief Executive Officer, stated:
“Driven by a strong Capesize market, Seanergy delivered a very strong fourth quarter, marking our fifth consecutive year of profitability. This performance reflects the durability of our pure-play Capesize strategy, disciplined balance sheet management, and our ability to consistently capture market upside.
“We remain firmly focused on delivering consistent shareholder returns. In 2025, we distributed $0.43 per common share in cash dividends, and with the declaration of the Q4 dividend of $0.20 per common share, we marked our 17th consecutive quarterly dividend. Since launching our dividend program, we have returned $2.64 per common share, or approximately $51.2 million, to our shareholders, underscoring both the strong earnings capacity of our fleet and our disciplined approach to capital allocation.
“Looking ahead, market fundamentals remain constructive as we move into 2026. Robust iron ore and bauxite trade flows, limited Capesize newbuilding supply, and favorable ton-mile dynamics continue to support earnings visibility. With a high-quality fleet, predominantly index-linked employment, and balanced leverage profile, we believe Seanergy is well positioned to capture meaningful upside in this favorable environment.
“Our fleet renewal program is progressing as planned and remains a core strategic priority. In recent months, we added two prompt, eco newbuilding orders at leading Chinese shipyards: a scrubber-fitted Capesize sister vessel to the unit previously announced, scheduled for delivery in Q3 2027, and a scrubber-fitted Newcastlemax scheduled for delivery in Q2 2028. The total current newbuilding investment of approximately $226 million reflects our intention to continue pursuing selective and prompt newbuilding opportunities when market conditions and financing terms are favorably aligned.
“In parallel, and taking advantage of firm secondhand values, we recently agreed to sell the 2010-built Dukeship through an 18-month bareboat arrangement, crystallizing a solid price and generating positive cash flows through the bareboat period. We continue to actively evaluate opportunities to optimize our fleet through selective acquisitions and targeted disposals, while keeping long-term shareholder value and returns as a top priority.
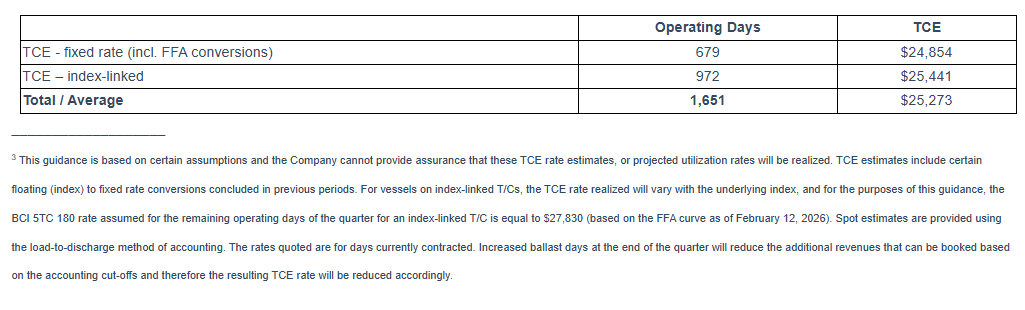
“On the commercial front, we secured index-linked renewals for five vessels, maintaining full participation in a strengthening market while selectively utilizing FFAs to manage volatility. This disciplined approach continues to deliver strong commercial performance. For the first quarter of 2026, we estimate a daily TCE of approximately $25,300, representing a 14% premium to the prevailing AV5 BCI year-to-date, based on the current FFA curve, with approximately 77% of available days fixed at an average rate of $24,739.
“Seanergy enters 2026 from a position of financial strength, operational excellence, and strategic clarity, with a clear path toward continued per-share value creation for our shareholders.”
______________________________ 2 This guidance is based on certain assumptions and the Company cannot provide assurance that these TCE rate estimates, or projected utilization rates will be realized. TCE estimates include certain floating (index) to fixed rate conversions concluded in previous periods. For vessels on index-linked T/Cs, the TCE rate realized will vary with the underlying index, and for the purposes of this guidance, the BCI 5TC 180 rate assumed for the remaining operating days of the quarter for an index-linked T/C is equal to $27,830 (based on the FFA curve as of February 12, 2026). Spot estimates are provided using the load-to-discharge method of accounting. The rates quoted are for days currently contracted. Increased ballast days at the end of the quarter will reduce the additional revenues that can be booked based on the accounting cut-offs and therefore the resulting TCE rate will be reduced accordingly.
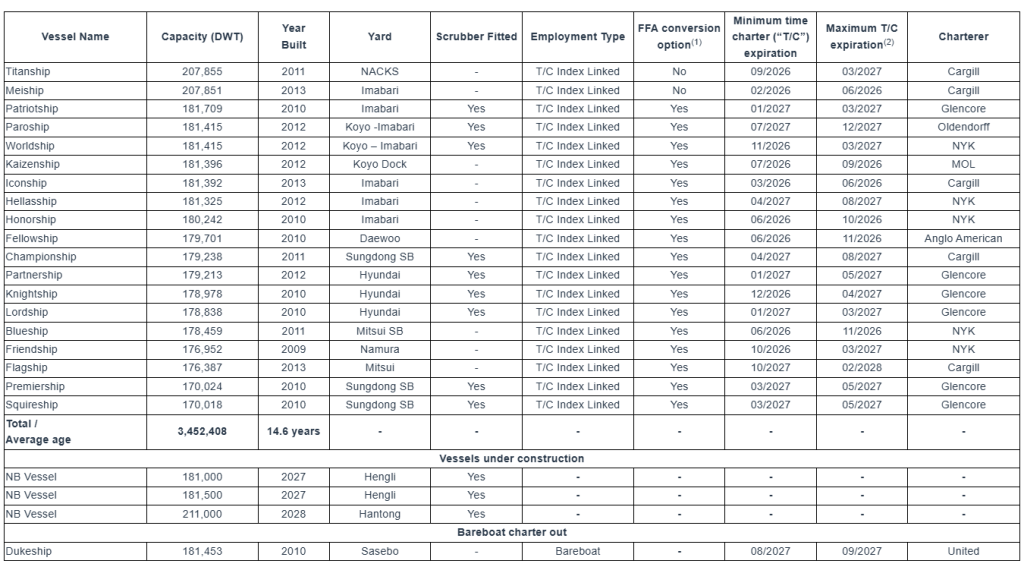
Company Fleet:
Fleet Data:
(U.S. Dollars in thousands)
(In thousands of U.S. Dollars, except operating days and TCE rate)
(In thousands of U.S. Dollars, except ownership days and Daily Vessel Operating Expenses)
Net income to EBITDA and Adjusted EBITDA Reconciliation:
(In thousands of U.S. Dollars)
Earnings Before Interest, Taxes, Depreciation and Amortization (“EBITDA”) represents the sum of net income, net interest and finance costs, depreciation and amortization and, if any, income taxes during a period. EBITDA and Adjusted EBITDA are not recognized measurements under U.S. GAAP. Adjusted EBITDA represents EBITDA adjusted to exclude stock-based compensation, gain on sale of vessel, loss on forward freight agreements, net, loss on extinguishment of debt, and loss / (gain) on FX forwards (“Other, net” in statement of operations), which the Company believes are not indicative of the ongoing performance of its core operations.
EBITDA and adjusted EBITDA are presented as we believe that these measures are useful to investors as a widely used means of evaluating operating profitability. Management also uses these non-GAAP financial measures in making financial, operating and planning decisions and in evaluating the Company’s performance. EBITDA and adjusted EBITDA as presented here may not be comparable to similarly titled measures presented by other companies. These non-GAAP measures should not be considered in isolation from, as a substitute for, or superior to, financial measures prepared in accordance with U.S. GAAP.
Adjusted Net Income Reconciliation and calculation of Adjusted Earnings Per Share
(In thousands of U.S. Dollars, except for share and per share data)
To derive Adjusted Earnings Per Share, a non-GAAP financial measure, from Net Income, we adjust for dividends and undistributed earnings to non-vested participating securities and exclude non-cash items, as provided in the table above. We believe that Adjusted Net Income and Adjusted Earnings Per Share assist our management and investors by increasing the comparability of our performance from period to period since each such measure eliminates the effects of such non-cash items as loss on extinguishment of debt, stock based compensation, loss / (gain) on FX forwards and other items which may vary from year to year, for reasons unrelated to overall operating performance. In addition, we believe that the presentation of the respective measure provides investors with supplemental data relating to our results of operations, and therefore, with a more complete understanding of factors affecting our business than with GAAP measures alone. Our method of computing Adjusted Net Income and Adjusted Earnings Per Share may not necessarily be comparable to other similarly titled captions of other companies due to differences in methods of calculation.
First Quarter 2026 TCE Rate Guidance:
As of the date hereof, approximately 77% of the Company fleet’s expected operating days in the first quarter of 2026 have been fixed at an estimated TCE rate of approximately $24,739. Assuming that for the remaining operating days of our index-linked time charters, the BCI 5TC 180 rate will be equal to $27,830 (based on the FFA curve as of February 12, 2026), our estimated TCE rate for the first quarter of 2026 will be approximately $25,2733. The following table provides the breakdown of index-linked charters and fixed-rate charters in the first quarter of 2026:
Fourth Quarter and Recent Developments:
Dividend Distribution for Q3 2025 and Declaration of Q4 2025 Dividend
On January 9, 2026, the Company paid a quarterly cash dividend of $0.13 per common share for the third quarter of 2025 to all shareholders of record as of December 29, 2025.
The Company has declared a quarterly cash dividend of $0.20 per common share for the fourth quarter of 2025 payable on or about April 10, 2026, to all shareholders of record as of March 27, 2026.
Fleet Updates
Newbuilding Contract for a Newcastlemax Vessel at Hantong Shipyard
In November 2025, the Company entered into an agreement for the acquisition of a newbuilding 211,000 dwt scrubber-fitted Newcastlemax vessel from Jiangsu Hantong Ship Heavy Industry Co., Ltd., with delivery expected in the second quarter of 2028. The purchase price is approximately $75.8 million. The first installment, representing 15% of the purchase price, has already been paid. The remaining installments are linked to the vessel’s construction milestones, with 30% of the purchase price payable over the next 2 years and the remaining 55% upon delivery of the vessel.
The new vessel will be built incorporating the latest technological advancements and eco-friendly design features, resulting in enhanced fuel efficiency and reduced emissions in line with the Company’s ongoing fleet renewal and decarbonization strategy.
Newbuilding Contract for a Second Capesize Vessel at Hengli Shipyard
In January 2026, the Company entered into an agreement with Hengli Shipbuilding (Dalian) Co., Ltd. and Hengli Shipbuilding (Singapore) Pte. Ltd. for the construction of a 181,500 dwt scrubber-fitted Capesize vessel. The contract price is approximately $75.2 million, with delivery expected in the third quarter of 2027. The purchase price will be paid in five installments, linked to the vessel’s construction milestones, with 45% of the purchase price payable over the next 14 months and the remaining 55% upon delivery of the vessel.
The new vessel will be built incorporating the latest technological advancements and eco-friendly design features, resulting in enhanced fuel efficiency and reduced emissions in line with the Company’s ongoing fleet renewal and decarbonization strategy.
M/V Dukeship – Disposal of Vessel through Bareboat Charter
In February 2026, the Company entered into an agreement with United Maritime Corporation (“United”), a related party, for the disposal of the M/V Dukeship through an 18-month bareboat charter. The charter period commenced following the delivery of the vessel on February 12, 2026. United has advanced a downpayment of $5.5 million and will pay a daily charter rate of $9,450, with a purchase obligation of $22.1 million at the end of the bareboat charter. A special committee of disinterested members of our Board of Directors negotiated the terms and approved the agreement.
Commercial Updates
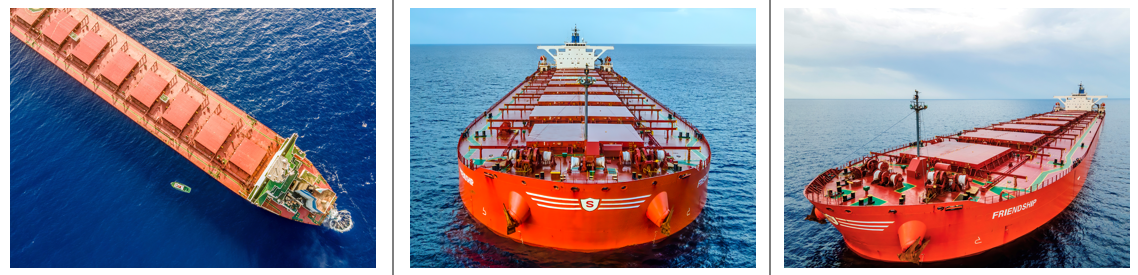
M/V Flagship – New T/C agreement
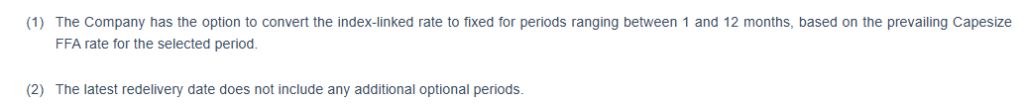
In December 2025, the M/V Flagship commenced a new T/C agreement with Cargill International SA with the agreement set to terminate between November 1, 2027 to February 1, 2028, each date subject to (+/- 15 days). The daily hire is based on the 5 T/C routes of the BCI, with an option for the Company to fix the rate for 3 to 9 months based on the prevailing Capesize FFA curve.
M/V Paroship – New T/C agreement
In December 2025, the M/V Paroship commenced a new T/C agreement with Oldendorff GMBH & CO. KG., Ltd for a period of about 20 to about 24 months. The daily hire is based on the 5 T/C routes of the BCI, with an option for the Company to fix the rate for 3 to 9 months based on the prevailing Capesize FFA curve. The Company will also receive most of the benefit from the scrubber profit-sharing scheme.
M/V Friendship – New T/C agreement
In January 2026, the M/V Friendship commenced a new T/C agreement with Glencore Freight Pte. Ltd (“Glencore”) for a period of about 10 to about 14 months. The daily hire is based on the 5 T/C routes of the BCI, with an option for the Company to fix the rate for 1 to 9 months based on the prevailing Capesize FFA curve.
M/V Partnership – New T/C agreement
In February 2026, the M/V Partnership commenced a new T/C agreement with Glencore for a period of about 12 to about 15 months. The daily hire is based on the 5 T/C routes of the BCI, with an option for the Company to fix the rate for 1 to 9 months based on the prevailing Capesize FFA curve. The Company will also receive most of the benefit from the scrubber profit-sharing scheme.
M/V Lordship – Time charter extension
In January 2026, the charterer of the M/V Lordship agreed to extend the time charter agreement in direct continuation from the previous agreement. The extension period will commence on August 21, 2026, for a duration of minimum January 1st, 2027 until maximum March 31st, 2027. The Company receives most of the benefit from the scrubber profit-sharing scheme while the daily hire will be based on a revised premium over the BCI.
M/V Hellasship – Time charter extension
In February 2026, the charterer of the M/V Hellasship agreed to extend the time charter agreement in direct continuation from the previous agreement. The extension period will commence on April 9, 2026, for a duration of minimum 12 to maximum 16 months. The daily hire is based on a revised premium over the BCI, while all other main terms of the time charter remain materially the same.
In December 2025, the Company entered into a new sustainability linked loan facility with Danish Ship Finance secured by the M/Vs Fellowship, Premiership, Championship and Flagship to refinance the sale and leaseback agreement for the M/V Flagship and to increase the existing indebtedness of the other three vessels.
The facility includes a new tranche of $16.8 million secured by the M/V Flagship, with a five-year term. The principal is repayable in 20 quarterly installments of $0.8 million each and a balloon of $1.8 million payable together with the final installment. The interest rate is 2.10% plus 3-month Term SOFR and can fluctuate by 0.05% based on certain emission reduction thresholds.
The additional top-up tranche of $7.3 million, secured by the M/Vs Fellowship, Premiership & Championship, has a three-and-a-half year term and is repayable in 14 quarterly payments of $0.5 million resulting in zero outstanding balance at maturity. The interest rate is 1.95% plus 3-month Term SOFR and can fluctuate by 0.05% based on certain emission reduction thresholds.
M/Vs Hellasship, Patriotship, Iconship & Newbuilding Capesize vessel – Huarong Sale and Leaseback agreements
In December 2025, the Company entered into three separate sale and leaseback agreements totaling $72.5 million for the M/Vs Hellasship, Patriotship & Iconship with entities affiliated with China Huarong Financial Leasing Co., Ltd. The proceeds were used to refinance the outstanding indebtedness of the respective vessels under three sale and leaseback agreements with AVIC International Leasing Co., Ltd. On January 8, 2026, the vessels were sold and chartered back on a bareboat basis for a period of 81 months. The Company has continuous options to purchase the vessels at predetermined prices, starting one year after the commencement date and a purchase obligation at expiry date of each charter. The charterhire principal for the three agreements amortizes in 27 quarterly installments of $2.0 million along with the aggregate purchase obligations of $18.3 million at the expiry of the bareboat charters. Each financing bears interest at a rate of 3-month Term SOFR plus 2.00% per annum, 55 bps lower than the rate of the refinanced agreements. The sale and leaseback agreements do not include any financial covenants or security value maintenance provisions.
Regarding the upcoming delivery of our newbuilding Capesize vessel previously announced, the Company has agreed to enter into a sale and leaseback agreement of $56.3 million to partially finance its acquisition with an entity affiliated with China Huarong Financial Leasing Co., Ltd., which will also provide pre-delivery financing for certain installments under the shipbuilding contract. Upon delivery, the vessel will be sold and chartered back for a period of 60 months. The Company will have continuous purchase options at predetermined prices, commencing one year after the charter commencement date and a purchase obligation at the expiry date. The charterhire principal amortizes in 20 quarterly installments of $0.6 million along with a purchase obligation of $43.5 million at the expiry of the bareboat charter. The financing will bear interest at a rate of 3-month Term SOFR plus 1.80% per annum, while pre-delivery financing amounts will accrue interest payable quarterly in arrears. The sale and leaseback agreement will not include any financial covenants or security value maintenance provisions.
M/V Partnership and Newbuilding Newcastlemax vessel – BOCL Sale and Leaseback agreement
The Company is in the process of finalizing a $26.5 million sale and leaseback agreement for the M/V Partnership with an affiliate of BOC Financial Leasing Corporation Limited to refinance the outstanding indebtedness of the respective vessel under the sale and leaseback agreement with Chugoku Bank, Ltd. The agreement will become effective upon the delivery of the M/V Partnership to the lessor which is expected in March 2026. The Company will sell and charter back the vessel on a bareboat basis for a period of 78 months and will have continuous options to repurchase the vessel at any time following the second anniversary of the delivery at predetermined prices as set forth in the agreement. The charterhire principal will amortize in 26 quarterly installments of $0.8 million along with a purchase option of $6.3 million at the expiry of the bareboat charter. The financing will bear an interest rate of 3-month Term SOFR plus 1.85% per annum, 105 bps lower than the rate of the refinanced agreement. The sale and leaseback agreement will not include any financial covenants or security value maintenance provisions.
Regarding the upcoming delivery of our newbuilding Newcastlemax vessel described above, the Company has agreed to enter into a sale and leaseback agreement of $57.8 million to partially finance its acquisition. The lessor will be an affiliate of BOC Financial Leasing Corporation Limited, which will also provide pre-delivery financing for certain installments under the shipsales contract. Upon delivery, the vessel will be sold and chartered back for a period of 96 months. The Company will have continuous purchase options at predetermined prices as set forth in the agreement, commencing two years after the charter commencement date. The charterhire principal will amortize in 32 quarterly installments of $0.7 million along with a purchase option of $36.3 million at the expiry of the bareboat charter. The financing will bear interest at a rate of 3-month Term SOFR plus 1.85% per annum, while pre-delivery financing amounts will accrue interest payable quarterly in arrears. The sale and leaseback agreement will not include any financial covenants or security value maintenance provisions.
Conference Call:
The Company’s management will host a conference call to discuss financial results on February 17, 2026, at 10:00 a.m. Eastern Time.
Audio Webcast and Earnings Presentation:
There will be a live, and then archived, webcast of the conference call and accompanying presentation available through the Company’s website. To access the presentation and listen to the archived audio file, visit our website, following the Webcast & Presentations section under our Investor Relations page. Participants to the live webcast should register on Seanergy’s website approximately 10 minutes prior to the start of the webcast, following this link.
Conference Call Details:
Participants have the option to register for the call using the following link. You can use any number from the list or add your phone number and let the system call you right away.
About Seanergy Maritime Holdings Corp.
Seanergy Maritime Holdings Corp. is a prominent pure-play Capesize shipping company publicly listed in the U.S. Seanergy provides marine dry bulk transportation services through a modern fleet of Capesize vessels. The Company’s operating fleet consists of 19 vessels (2 Newcastlemax and 17 Capesize) with an average age of approximately 14.6 years and an aggregate cargo carrying capacity of 3,452,408 dwt. Upon the delivery of the newbuilding vessels, the Company’s operating fleet will consist of 22 vessels (3 Newcastlemax and 19 Capesize), with an aggregate cargo carrying capacity of 4,025,908 dwt. Additionally, the Company owns one Capesize vessel that has been chartered out on a bareboat basis.
The Company is incorporated in the Republic of the Marshall Islands and has executive offices in Glyfada, Greece. The Company’s common shares trade on the Nasdaq Capital Market under the symbol “SHIP”.
This press release contains forward-looking statements (as defined in Section 27A of the Securities Act of 1933, as amended, and Section 21E of the Securities Exchange Act of 1934, as amended) concerning future events, including with respect to declaration of dividends, market trends and shareholder returns. Words such as “may”, “should”, “expects”, “intends”, “plans”, “believes”, “anticipates”, “hopes”, “estimates” and variations of such words and similar expressions are intended to identify forward-looking statements. These statements involve known and unknown risks and are based upon a number of assumptions and estimates, which are inherently subject to significant uncertainties and contingencies, many of which are beyond the control of the Company. Actual results differ materially from those expressed or implied by such forward-looking statements. Factors that could cause actual results to differ materially include, but are not limited to, the Company’s operating or financial results; the Company’s liquidity, including its ability to service its indebtedness; competitive factors in the market in which the Company operates; shipping industry trends, including charter rates, vessel values and factors affecting vessel supply and demand; future, pending or recent acquisitions and dispositions, business strategy, impacts of litigation, areas of possible expansion or contraction, and expected capital spending or operating expenses; risks associated with operations outside the United States; risks arising from trade disputes between the U.S. and China, including the re-imposition of reciprocal port fees; broader market impacts arising from trade disputes or war (or threatened war) or international hostilities, such as between the U.S. and Venezuela, Israel and Hamas or Iran, China and Taiwan and Russia and Ukraine; risks associated with the length and severity of pandemics; and other factors listed from time to time in the Company’s filings with the SEC, including its most recent annual report on Form 20-F. The Company’s filings can be obtained free of charge on the SEC’s website at www.sec.gov. Except to the extent required by law, the Company expressly disclaims any obligations or undertaking to release publicly any updates or revisions to any forward-looking statements contained herein to reflect any change in the Company’s expectations with respect thereto or any change in events, conditions or circumstances on which any statement is based.
Earnings Release: Tuesday, February 17, 2026, Before Market Open in New York Conference Call and Webcast: Tuesday, February 17, 2026, at 10:00 a.m. Eastern Time
GLYFADA, Greece, Feb. 12, 2026 (GLOBE NEWSWIRE) — Seanergy Maritime Holdings Corp. (the “Company” or “Seanergy”) (NASDAQ: SHIP) announced today that it will release its financial results for the fourth quarter and year ended December 31, 2025, prior to the open of the market in New York on Tuesday, February 17, 2026.
Seanergy’s senior management will conduct a conference call and simultaneous Internet webcast to review these results on Tuesday, February 17, 2026, at 10:00 a.m. Eastern Time.
Audio Webcast and Earnings Presentation: There will be a live, and then archived, webcast of the conference call and accompanying slides available through the Company’s website. To access the slides and listen to the archived audio file, visit our website, following the Webcast & Presentations section under our Investor Relations page. Participants to the live webcast should register on Seanergy’s website approximately 10 minutes prior to the start of the webcast, by following this link.
Conference Call Details: Participants have the option to register for the call using the following link. You can use any number from the list or add your phone number and let the system call you right away.
About Seanergy Maritime Holdings Corp. Seanergy Maritime Holdings Corp. is a prominent pure-play Capesize shipping company publicly listed in the U.S. Seanergy provides marine dry bulk transportation services through a modern fleet of Capesize vessels. The Company’s operating fleet consists of 20 vessels (2 Newcastlemax and 18 Capesize) with an average age of approximately 14.6 years and an aggregate cargo carrying capacity of approximately 3,633,861 dwt.
The Company is incorporated in the Republic of the Marshall Islands and has executive offices in Glyfada, Greece. The Company’s common shares trade on the Nasdaq Capital Market under the symbol “SHIP”.
Forward-Looking Statements This press release contains forward-looking statements (as defined in Section 27A of the Securities Act of 1933, as amended, and Section 21E of the Securities Exchange Act of 1934, as amended) concerning future events, including with respect to declaration of dividends, market trends and shareholder returns. Words such as “may”, “should”, “expects”, “intends”, “plans”, “believes”, “anticipates”, “hopes”, “estimates” and variations of such words and similar expressions are intended to identify forward-looking statements. These statements involve known and unknown risks and are based upon a number of assumptions and estimates, which are inherently subject to significant uncertainties and contingencies, many of which are beyond the control of the Company. Actual results differ materially from those expressed or implied by such forward-looking statements. Factors that could cause actual results to differ materially include, but are not limited to, the Company’s operating or financial results; the Company’s liquidity, including its ability to service its indebtedness; competitive factors in the market in which the Company operates; shipping industry trends, including charter rates, vessel values and factors affecting vessel supply and demand; future, pending or recent acquisitions and dispositions, business strategy, impacts of litigation, areas of possible expansion or contraction, and expected capital spending or operating expenses; risks associated with operations outside the United States; broader market impacts arising from trade disputes or war (or threatened war) or international hostilities, such as between Israel and Hamas or Iran, China and Taiwan and between Russia and Ukraine; risks associated with the length and severity of pandemics, including their effects on demand for dry bulk products and the transportation thereof; and other factors listed from time to time in the Company’s filings with the SEC, including its most recent annual report on Form 20-F. The Company’s filings can be obtained free of charge on the SEC’s website at www.sec.gov. Except to the extent required by law, the Company expressly disclaims any obligations or undertaking to release publicly any updates or revisions to any forward-looking statements contained herein to reflect any change in the Company’s expectations with respect thereto or any change in events, conditions or circumstances on which any statement is based.
For further information please contact: Seanergy Investor Relations Tel: +30 213 0181 522 E-mail: ir@seanergy.gr
Capital Link, Inc. Paul Lampoutis 230 Park Avenue Suite 1540 New York, NY 10169 Tel: (212) 661-7566 Email: seanergy@capitallink.com
GLYFADA, Greece, Sept. 30, 2025 (GLOBE NEWSWIRE) — Seanergy Maritime Holdings Corp. (NASDAQ: SHIP) (the “Company” or “Seanergy”) announced that it has successfully completed the strategic sale of its Capesize vessel, M/V Geniuship, further optimizing its fleet and enhancing liquidity.
The Company also reported the expiration of its Class E warrants on August 20, 2025. Upon the expiration of these warrants, Seanergy has no outstanding warrants or other convertible securities.
Sale of M/V Geniuship
The M/V Geniuship was a 170,057 dwt Capesize bulker, built in 2010 by Sungdong SB in South Korea, which was acquired by Seanergy in 2015. The vessel was sold for a gross price of approximately $21.6 million to an unaffiliated buyer. The delivery was completed successfully on September 10, 2025. The transaction generated net cash proceeds of approximately $12.0 million and is expected to result in an accounting profit of around $2.5 million, which will be recorded on Seanergy’s third quarter financial results.
Expiration of Class E Warrants
The Class E warrants were issued on August 20, 2020, with a five-year term and an exercise price as of the expiration date of $3.98 per share. Following warrant exercises and a tender offer by Seanergy to repurchase warrants in January 2023, Class E warrants to purchase 57,225 common shares remained outstanding as of their expiration date. As of August 20, 2025, the remaining Class E warrants terminated.
Following the expiration of the Class E Warrants and the prior expiration of the Class D warrants in April 2025, Seanergy has no outstanding warrants.
Stamatis Tsantanis, the Company’s Chairman & Chief Executive Officer, stated:
“We are pleased to announce the well-timed sale of our 15-year-old M/V Geniuship, that takes advantage of the favorable valuation environment in the sector. The sale was concluded prior to her upcoming dry-docking, resulting in significant capex savings for Seanergy. Moreover, the approximately $12.0 million net cash sale proceeds after the repayment of the underlying loan strengthened our liquidity position.
“This proactive sale aligns perfectly with our fleet renewal strategy and enhances both our liquidity position and earnings profile.
“The expiration of the Class E warrants along with the prior expiration of the Class D warrants this past April completes the streamlining of our capital structure and removes a longstanding overhang. This is a final step in eliminating legacy dilution risks from outstanding convertible securities and enabling cleaner value recognition for our shareholders.
“With a focused Capesize platform, no outstanding warrants, and a disciplined growth path, we are positioned to capture further upside as market fundamentals strengthen and maximize returns for our shareholders.”
About Seanergy Maritime Holdings Corp.
Seanergy Maritime Holdings Corp. is a prominent pure-play Capesize shipping company publicly listed in the U.S. Seanergy provides marine dry bulk transportation services through a modern fleet of Capesize vessels. The Company’s operating fleet consists of 20 vessels (2 Newcastlemax and 18 Capesize) with an average age of approximately 14.3 years and an aggregate cargo carrying capacity of approximately 3,633,861 dwt.
The Company is incorporated in the Republic of the Marshall Islands and has executive offices in Glyfada, Greece. The Company’s common shares trade on the Nasdaq Capital Market under the symbol “SHIP”.
This press release contains forward-looking statements (as defined in Section 27A of the Securities Act of 1933, as amended, and Section 21E of the Securities Exchange Act of 1934, as amended) concerning future events, including with respect to the declaration of dividends, market trends and shareholder returns. Words such as “may”, “should”, “expects”, “intends”, “plans”, “believes”, “anticipates”, “hopes”, “estimates” and variations of such words and similar expressions are intended to identify forward-looking statements. These statements involve known and unknown risks and are based upon a number of assumptions and estimates, which are inherently subject to significant uncertainties and contingencies, many of which are beyond the control of the Company. Actual results may differ materially from those expressed or implied by such forward-looking statements. Factors that could cause actual results to differ materially include, but are not limited to, the Company’s operating or financial results; the Company’s liquidity, including its ability to service its indebtedness; competitive factors in the market in which the Company operates; shipping industry trends, including charter rates, vessel values and factors affecting vessel supply and demand; future, pending or recent acquisitions and dispositions, business strategy, impacts of litigation, areas of possible expansion or contraction, and expected capital spending or operating expenses; risks associated with operations outside the United States; broader market impacts arising from trade disputes or war (or threatened war) or international hostilities, such as between Israel and Hamas or Iran, China and Taiwan and between Russia and Ukraine; risks associated with the length and severity of pandemics, including their effects on demand for dry bulk products and the transportation thereof; and other factors listed from time to time in the Company’s filings with the SEC, including its most recent annual report on Form 20-F. The Company’s filings can be obtained free of charge on the SEC’s website at www.sec.gov. Except to the extent required by law, the Company expressly disclaims any obligations or undertaking to release publicly any updates or revisions to any forward-looking statements contained herein to reflect any change in the Company’s expectations with respect thereto or any change in events, conditions or circumstances on which any statement is based.
Mark Reichman, Managing Director, Equity Research Analyst, Natural Resources, Noble Capital Markets, Inc.
Hans Baldau, Associate Analyst, Noble Capital Markets, Inc.
Refer to the full report for the price target, fundamental analysis, and rating.
Protecting the interests of all shareholders. Following a review of the company’s current ownership structure, FreightCar America announced that its Board of Directors adopted a limited-duration stockholder rights plan.The rights plan will expire on August 5, 2026, unless terminated earlier by the Board. The Rights Plan is intended to reduce the likelihood that any person or group gains control of the company through open-market accumulation or other tactics without paying an appropriate control premium. The plan also ensures the Board has sufficient time to make informed decisions that protect the interests of the company and all RAIL shareholders.
Increasing 2026 estimates. We have increased our 2026 EBITDA and EPS estimates to $53.6 million and $0.65, respectively, from $53.2 million and $0.64. Our estimate update reflects stronger deliveries in the second half of the year, with a full-year estimate of 4,850 compared with our previous estimate of 4,800. We now expect quarterly deliveries of: 1Q: 982, 2Q: 1,200, 3Q: 1,284, and 4Q: 1,384. Previously we had assumed: 1Q: 1,346, 2Q: 1,275, 3Q: 1,058, and 4Q: 1,121.
Equity Research is available at no cost to Registered users of Channelchek. Not a Member? Click ‘Join’ to join the Channelchek Community. There is no cost to register, and we never collect credit card information.
This Company Sponsored Research is provided by Noble Capital Markets, Inc., a FINRA and S.E.C. registered broker-dealer (B/D).
*Analyst certification and important disclosures included in the full report. NOTE: investment decisions should not be based upon the content of this research summary. Proper due diligence is required before making any investment decision.
ATHENS, Greece, June 18, 2025 (GLOBE NEWSWIRE) — Euroseas Ltd. (NASDAQ: ESEA, the “Company” or “Euroseas”), an owner and operator of container carrier vessels and provider of seaborne transportation for containerized cargoes, announced today its results for the three-month period ended March 31, 2025 and declared a common stock dividend.
First Quarter 2025 Financial Highlights:
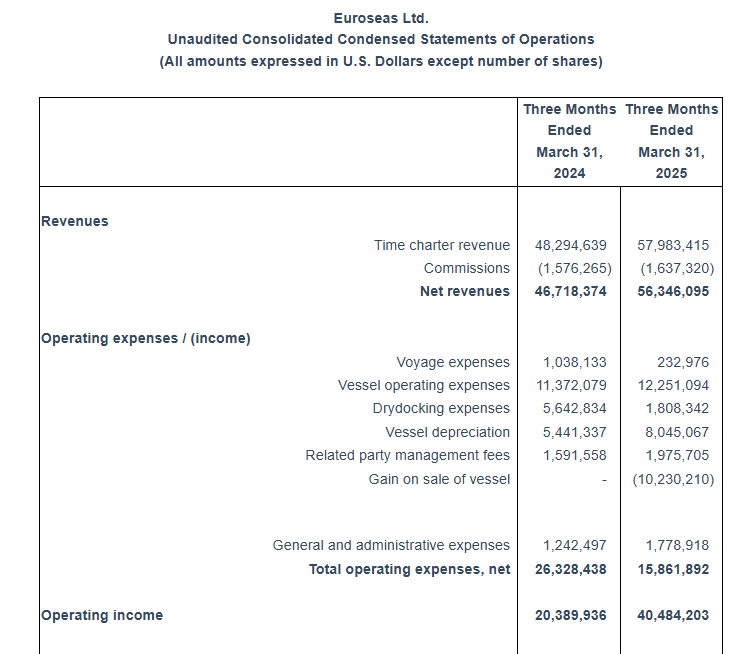
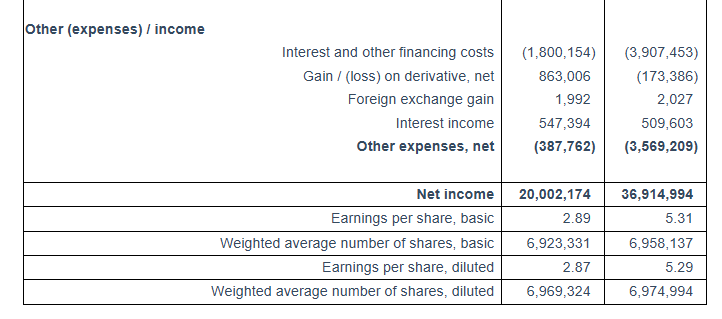
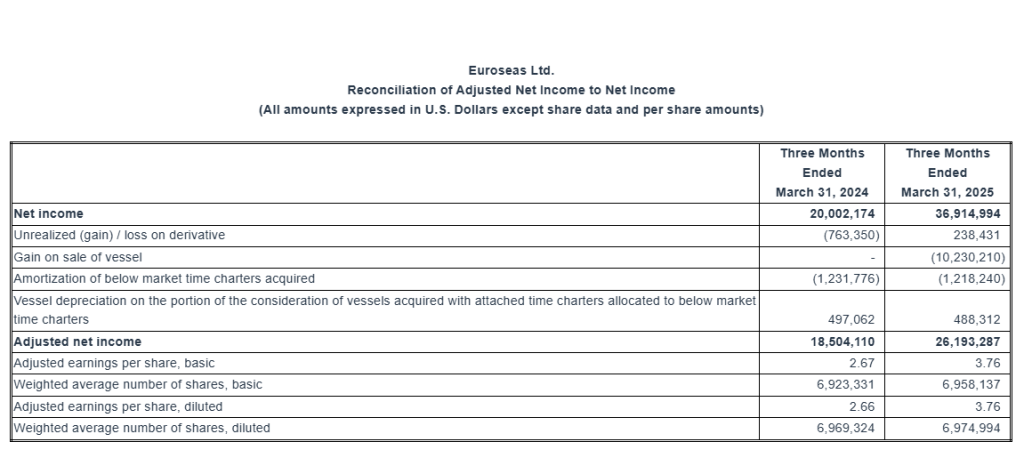
Total net revenues of $56.3 million. Net income of $36.9 million or $5.31 and $5.29 earnings per share basic and diluted, respectively. Adjusted net income1 for the period was $26.2 million or $3.76 per share basic and diluted.
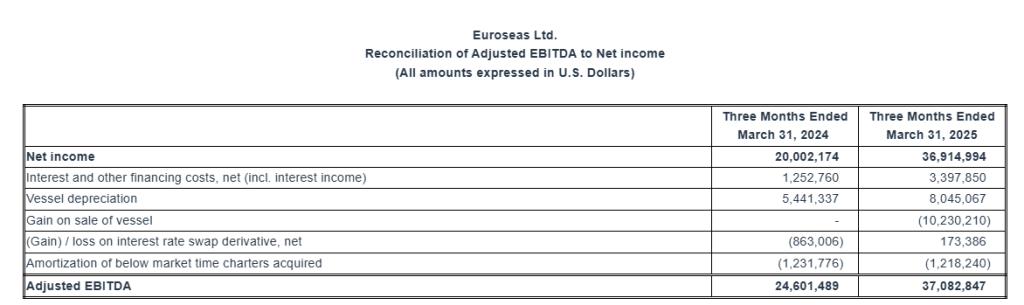
Adjusted EBITDA1 was $37.1 million.
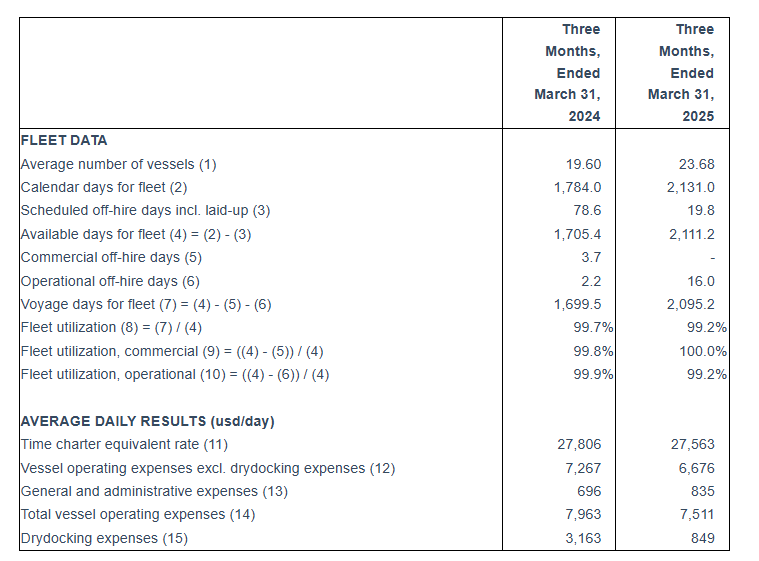
An average of 23.71 vessels were owned and operated during the first quarter of 2025 earning an average time charter equivalent rate of $27,563 per day.
Declared a quarterly dividend of $0.65 per share for the first quarter of 2025 payable on or about July 16, 2025 to shareholders of record on July 9, 2025, as part of the Company’s common stock dividend plan.
On March 17, 2025 the Company completed the spin-off of three of its subsidiaries containing its two older vessels, M/V Aegean Express and M/V Joanna, along with the proceeds from the earlier sale of the vessel M/V Diamantis P, into Euroholdings Ltd. (NASDAQ: EHLD). Beginning on March 18, 2025, Euroholdings Ltd. operates as an independent company.
On May 29, 2025, the Company announced that it has signed an agreement to sell M/V Marcos V, a 6,350 teu intermediate containership built in 2005, to an unaffiliated third party, for $50 million. The vessel is scheduled to be delivered to its buyer in October 2025. The Company is expected to recognize a gain on the sale in excess of $8.50 million, or $1.20 per share.
As of June 18, 2025 we had repurchased 463,074 of our common stock in the open market for a total of about $10.5 million, since the initiation of our share repurchase plan of up to $20 million announced in May 2022.
________________________ 1 Adjusted EBITDA, Adjusted net income and Adjusted earnings per share are not recognized measurements under US GAAP (GAAP) and should not be used in isolation or as a substitute for Euroseas financial results presented in accordance with GAAP. Refer to a subsequent section of the Press Release for the definitions and reconciliation of these measurements to the most directly comparable financial measures calculated and presented in accordance with GAAP.
Aristides Pittas, Chairman and CEO of Euroseas commented: “During the first quarter of 2025, the containership markets showed further strength, with both smaller and larger feeder segments seeing notable rate increases. This positive momentum has continued into the second quarter, with particularly strong gains in the smaller feeder segment. Market strength is also reflected in the secondhand S&P market, where demand for existing tonnage remains firm despite the continued delivery of newbuilds. Reflecting this dynamic, we successfully finalized the sale of one of our intermediate vessels, the M/V Marcos V, to an unaffiliated third party. The market strength is further reflected in our chartering activity resulting in almost 100% charter coverage for 2025 and in excess of 65% for 2026.
“Looking ahead, the containership sector may face notable challenges, primarily due to the high overall orderbook and the possibility that liner companies may resume transits through the Suez Canal. However, elevated geopolitical uncertainty driven by ongoing and escalating tensions between Iran and Israel compounded by uncertainty surrounding the U.S. Administration’s proposed tariffs add another layer of complexity. Specifically, on the supply-side while the orderbook remains high and represents the key challenge for the sector, it is heavily concentrated on larger vessel sizes. In contrast, the feeder and intermediate segments, where our fleet is concentrated, have historically low orderbooks; in addition, due to the higher proportion of older tonnage in these size segments, they are likely to experience a reduction in fleet supply over the coming years. This evolving fleet profile supports the view that, despite the potential risk of cascading from larger vessels, the fundamentals for feeder and intermediate containerships remain favorable.
“On the fleet growth front, we continue to consider ways of further modernizing our fleet. We will be soon retrofitting one more of our secondhand vessels with energy-saving devices. We have further improved our fleet profile by having transferred our two oldest ships to Euroholdings, a spin-off from our company, to pursue a separate independent market and investment strategy. Given our solid liquidity position, our Board has decided to maintain our high yielding quarterly dividend of $0.65 per share. We are also continuing our share buyback program, as our shares are trading at a substantial discount to our net asset value, despite the visibility of our revenues and earnings. As always, we remain committed to identifying attractive investment opportunities that enhance shareholder value and drive sustainable returns.”
Tasos Aslidis, Chief Financial Officer of Euroseas commented: “Our revenues for the first quarter of 2025 are increased by approximately 20% compared to the same period of 2024. This was mainly the result of the increased average number of vessels owned and operated in the first quarter of 2025, compared to the corresponding period of 2024. The Company operated an average of 23.68 vessels, versus 19.60 vessels during the same period last year. Net revenues amounted to $56.3 million for the first quarter of 2025 compared to $46.7 million for the first quarter of 2024.
“Total daily vessel operating expenses, including management fees, general and administrative expenses, but excluding drydocking costs, were $6,676 during the first quarter of 2025 compared $7,276 to the same quarter of last year. This was the result of the lower operating costs of the nine newbuilding vessels delivered during last year and in the first quarter of 2025. In the first quarter of 2024 the Company operated only five of these newbuilding vessels, while the rest were delivered gradually until January 2025.
“Adjusted EBITDA1 during the first quarter of 2025 was $37.1 million compared to $24.6 million achieved in the first quarter of last year.
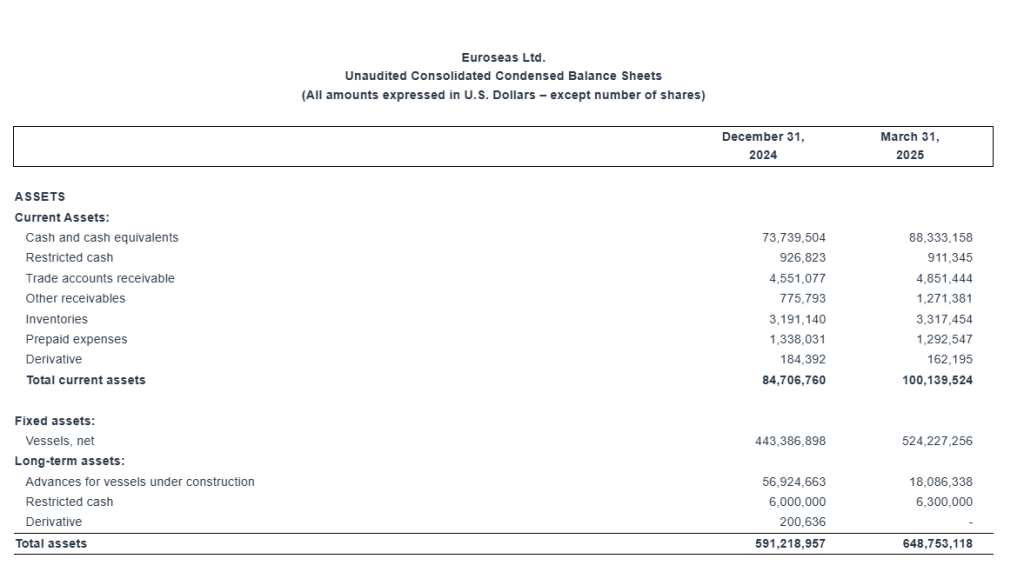
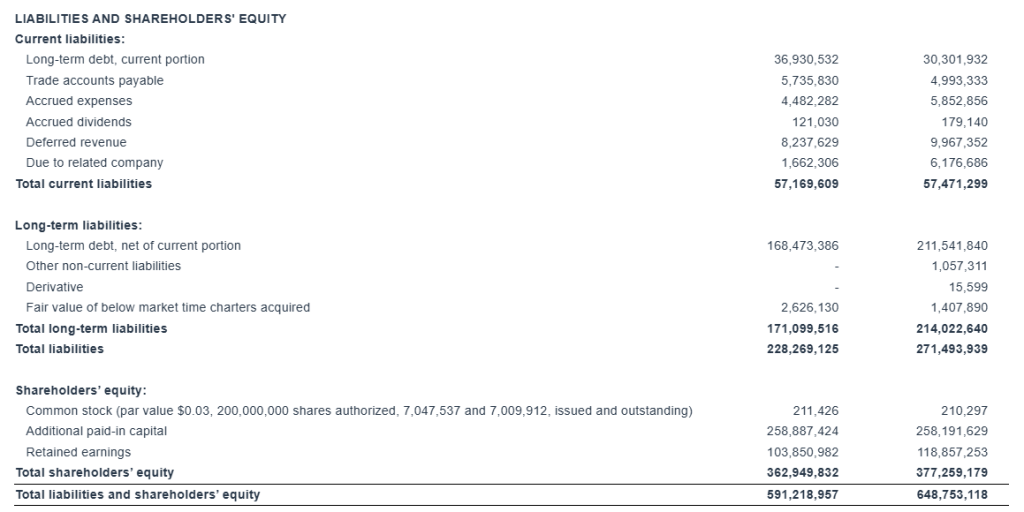
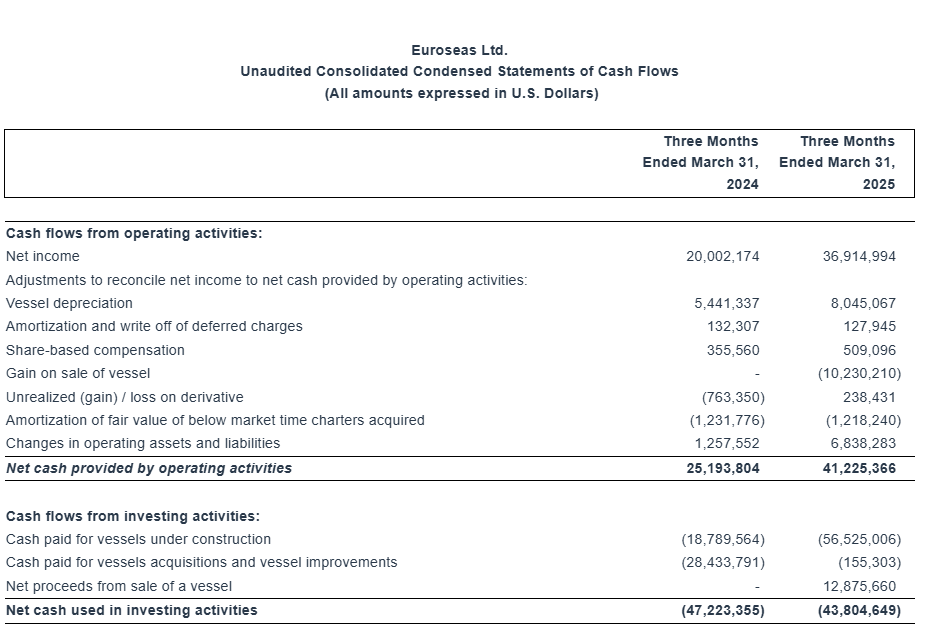
“As of March 31, 2025, our outstanding bank debt (before deducting the unamortized loan fees) was $244.0 million, versus restricted and unrestricted cash of approximately $95.5 million. As of the same date, our scheduled debt repayments over the next 12 months amounted to about $30.7 million (excluding the unamortized loan fees).”
First Quarter 2025 Results: For the first quarter of 2025, the Company reported total net revenues of $56.3 million representing an 20.6% increase over total net revenues of $46.7 million during the first quarter of 2024. On average, 23.68 vessels were owned and operated during the first quarter of 2025 earning an average time charter equivalent rate of $27,563 per day compared to 19.60 vessels in the same period of 2024 earning on average $27,806 per day. The Company reported a net income for the period of $36.9 million, as compared to a net income of $20.0 million for the first quarter of 2024.
Voyage expenses for the first quarter of 2025 amounted to $0.2 million as compared to voyage expenses of $1.0 million for the same period of 2024. The increased amount of 2024 is mainly attributable to bunkers consumption by three of our vessels (M/V “Synergy Antwerp”, M/V “Synergy Oakland” and M/V “Marcos”) during their drydock period.
Vessel operating expenses for the first quarter of 2025 amounted to $12.3 million as compared to $11.4 million for the same period of 2024. The increased amount is due to the higher number of vessels owned and operated in the first quarter of 2025 compared to the corresponding period of 2024.
Depreciation expense for the first quarter of 2025 amounted to $8.0 million compared to $5.4 million for the same period of 2024 due to the increased number of vessels in the Company’s fleet.
Related party management fees for the first quarter of 2025 increased to $2.0 million from $1.6 million for the same period of 2024 as a result of the higher number of vessels in our fleet and the adjustment for inflation in the daily vessel management fee, effective from January 1, 2025, increasing it from 810 Euros to 840 Euros.
In the first quarter of 2025 two of our vessels completed extensive repairs afloat for a total cost of $1.8 million. In the first quarter of 2024 three of our vessels completed their special survey with drydock for a total cost of $5.6 million.
General and administrative expenses slightly increased to $1.8 million in the first quarter of 2025, as compared to $1.2 million in the first quarter of 2024 due to increased professional fees and increased cost for our stock incentive plan.
Interest and other financing costs for the first quarter of 2025 amounted to $3.9 million. Capitalized interest charged on the cost of our newbuilding program was $0.1 million for the first quarter of 2025. For the same period of 2024 interest and other financing costs amounted $1.8 million and the capitalized interest charged on the cost of our newbuilding program was $1.4 million. This increase is due to the increased amount of debt in the current period compared to the same period of 2024. For the three months ended March 31, 2025 the Company recognized a $0.17 million loss on its interest rate swap contract, comprising a $0.07 million realized gain and a $0.24 million unrealized loss. For the three months ended March 31, 2024 the Company recognized a $0.86 million gain on its interest rate swap contracts, comprising a $0.10 million realized gain and a $0.76 million unrealized gain.
Adjusted EBITDA1 for the first quarter of 2025 was $37.1 million, compared to $24.6 million achieved for the first quarter of 2024, primarily higher revenues due to the higher number of vessels owned and operated.
Basic and diluted earnings per share for the first quarter of 2025 was $5.31 and $5.29, respectively, calculated on 6,958,137 basic and 6,974,994 diluted weighted average number of shares outstanding compared to basic and diluted earnings per share of $2.89 and $2.87, respectively for the first quarter of 2024, calculated on 6,923,331 basic and 6,969,324 diluted weighted average number of shares outstanding.
The adjusted earnings per share for the quarter ended March 31, 2025 would have been $3.76 per share basic and diluted, respectively, compared to adjusted earnings of $2.67 and $2.66 per share basic and diluted, respectively, for the first quarter of 2024. Usually, security analysts include Adjusted Net Income in their determination of published estimates of earnings per share.
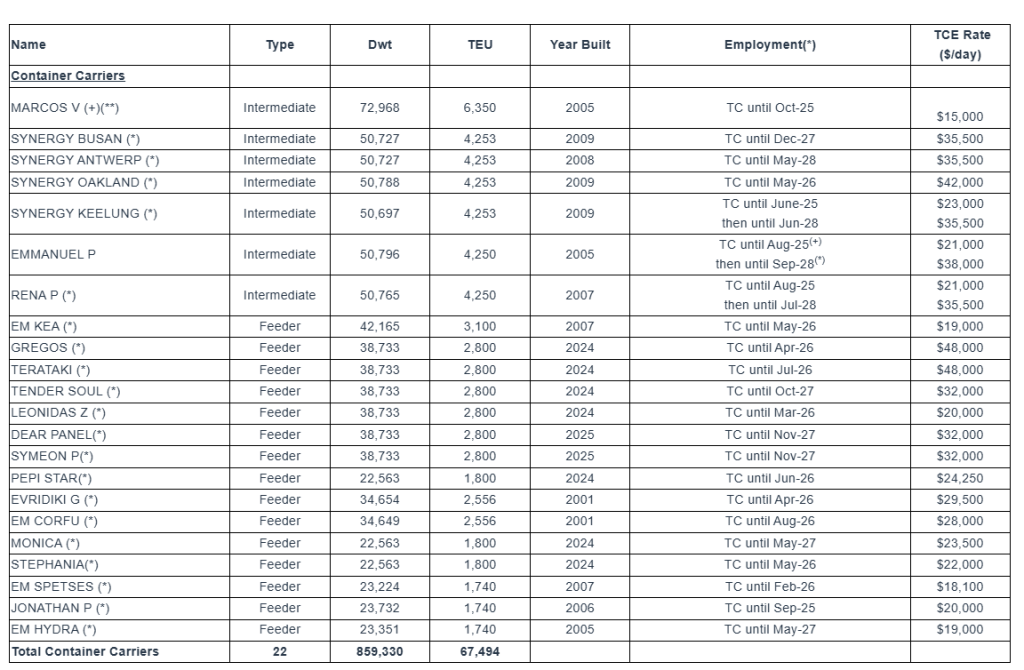
Fleet Profile: The Euroseas Ltd. fleet profile as of June 18, 2025 is as follows:
Summary Fleet Data:
(1) Average number of vessels is the number of vessels that constituted the Company’s fleet for the relevant period, as measured by the sum of the number of calendar days each vessel was a part of the Company’s fleet during the period divided by the number of calendar days in that period.
(2) Calendar days. We define calendar days as the total number of days in a period during which each vessel in our fleet was in our possession including off-hire days associated with major repairs, drydockings or special or intermediate surveys or days of vessels in lay-up. Calendar days are an indicator of the size of our fleet over a period and affect both the amount of revenues and the amount of expenses that we record during that period.
(3) The scheduled off-hire days including vessels laid-up, vessels committed for sale or vessels that suffered unrepaired damages, are days associated with scheduled repairs, drydockings or special or intermediate surveys or days of vessels in lay-up, or vessels that were committed for sale or suffered unrepaired damages.
(4) Available days. We define available days as the Calendar days in a period net of scheduled off-hire days as defined above. We use available days to measure the number of days in a period during which vessels were available to generate revenues.
(5) Commercial off-hire days. We define commercial off-hire days as days a vessel is idle without employment.
(6) Operational off-hire days. We define operational off-hire days as days associated with unscheduled repairs or other off-hire time related to the operation of the vessels.
(7) Voyage days. We define voyage days as the total number of days in a period during which each vessel in our fleet was in our possession net of commercial and operational off-hire days. We use voyage days to measure the number of days in a period during which vessels actually generate revenues or are sailing for repositioning purposes.
(8) Fleet utilization. We calculate fleet utilization by dividing the number of our voyage days during a period by the number of our available days during that period. We use fleet utilization to measure a company’s efficiency in finding suitable employment for its vessels and minimizing the amount of days that its vessels are off-hire for reasons such as unscheduled repairs or days waiting to find employment.
(9) Fleet utilization, commercial. We calculate commercial fleet utilization by dividing our available days net of commercial off-hire days during a period by our available days during that period.
(10) Fleet utilization, operational. We calculate operational fleet utilization by dividing our available days net of operational off-hire days during a period by our available days during that period.
(11) Time charter equivalent rate, or TCE, is a measure of the average daily net revenue performance of our vessels. Our method of calculating TCE is determined by dividing time charter revenue and voyage charter revenue, if any, net of voyage expenses by voyage days for the relevant time period. Voyage expenses primarily consist of port, canal and fuel costs that are unique to a particular voyage, which would otherwise be paid by the charterer under a time charter contract, or are related to repositioning the vessel for the next charter. TCE, which is a non-GAAP measure, provides additional meaningful information in conjunction with voyage revenues, the most directly comparable GAAP measure, because it assists our management in making decisions regarding the deployment and use of our vessels and because we believe that it provides useful information to investors regarding our financial performance. TCE is a standard shipping industry performance measure used primarily to compare period-to-period changes in a shipping company’s performance despite changes in the mix of charter types (i.e., spot voyage charters, time charters and bareboat charters) under which the vessels may be employed between the periods. Our definition of TCE may not be comparable to that used by other companies in the shipping industry.
(12) We calculate daily vessel operating expenses, which includes crew costs, provisions, deck and engine stores, lubricating oil, insurance, maintenance and repairs and related party management fees by dividing vessel operating expenses and related party management fees by fleet calendar days for the relevant time period. Drydocking expenses are reported separately.
(13) Daily general and administrative expenses are calculated by us by dividing general and administrative expenses by fleet calendar days for the relevant time period.
(14) Total vessel operating expenses, or TVOE, is a measure of our total expenses associated with operating our vessels. TVOE is the sum of vessel operating expenses, related party management fees and general and administrative expenses; drydocking expenses are not included. Daily TVOE is calculated by dividing TVOE by fleet calendar days for the relevant time period.
(15) Daily drydocking expenses is calculated by us by dividing drydocking expenses by the fleet calendar days for the relevant period, Drydocking expenses include expenses during drydockings that would have been capitalized and amortized under the deferral method. Drydocking expenses could vary substantially from period to period depending on how many vessels underwent drydocking during the period. The Company expenses drydocking expenses as incurred.
Conference Call and Webcast: Today, Wednesday, June 18, 2025 at 09:30 a.m. Eastern Time, the Company’s management will host a conference call and webcast to discuss the results.
Conference Call details: Participants should dial into the call 10 minutes before the scheduled time using the following numbers: 877 405 1226 (US Toll-Free Dial In) or +1 201 689 7823 (US and Standard International Dial In). Please quote “Euroseas” to the operator and/or conference ID 13754421. Click here for additional participant International Toll -Free access numbers.
Alternatively, participants can register for the call using the call me option for a faster connection to join the conference call. You can enter your phone number and let the system call you right away. Click here for the call me option.
Audio Webcast – Slides Presentation: There will be a live and then archived webcast of the conference call and accompanying slides, available on the Company’s website. To listen to the archived audio file, visit our website http://www.euroseas.gr and click on Company Presentations under our Investor Relations page. Participants to the live webcast should register on the website approximately 10 minutes prior to the start of the webcast.
The slide presentation for the first quarter ended March 31, 2025, will also be available in PDF format minutes prior to the conference call and webcast, accessible on the company’s website (www.euroseas.gr) on the webcast page. Participants to the webcast can download the PDF presentation.
Adjusted EBITDA Reconciliation:
Euroseas Ltd. considers Adjusted EBITDA to represent net income before interest and other financing costs, income taxes, depreciation, (gain) / loss on interest rate swap derivative, net, gain on sale of vessel, and amortization of fair value of below market time charters acquired. Adjusted EBITDA does not represent and should not be considered as an alternative to net income, as determined by United States generally accepted accounting principles, or GAAP. Adjusted EBITDA is included herein because it is a basis upon which the Company assesses its financial performance and liquidity position and because the Company believes that this non-GAAP financial measure assists our management and investors by increasing the comparability of our performance from period to period by excluding the potentially disparate effects between periods of financial costs, loss / (gain) on interest rate swaps, gain on sale of vessel, depreciation, and amortization of below market time charters acquired. The Company’s definition of Adjusted EBITDA may not be the same as that used by other companies in the shipping or other industries.
Adjusted net income and Adjusted earnings per share Reconciliation: Euroseas Ltd. considers Adjusted net income to represent net income before unrealized (gain) / loss on derivative, gain on sale of vessel, amortization of below market time charters acquired and vessel depreciation on the portion of the consideration of vessels acquired with attached time charters allocated to below market time charters. Adjusted net income and Adjusted earnings per share are included herein because we believe they assist our management and investors by increasing the comparability of the Company’s fundamental performance from period to period by excluding the potentially disparate effects between periods of the aforementioned items, which may significantly affect results of operations between periods.
Adjusted net income and Adjusted earnings per share do not represent and should not be considered as an alternative to net income or earnings per share, as determined by GAAP. The Company’s definition of Adjusted net income and Adjusted earnings per share may not be the same as that used by other companies in the shipping or other industries. Adjusted net income and Adjusted earnings per share are not adjusted for all non-cash income and expense items that are reflected in our statement of cash flows.
About Euroseas Ltd. Euroseas Ltd. was formed on May 5, 2005 under the laws of the Republic of the Marshall Islands to consolidate the ship owning interests of the Pittas family of Athens, Greece, which has been in the shipping business over the past 140 years. Euroseas trades on the NASDAQ Capital Market under the ticker ESEA.
Euroseas operates in the container shipping market. Euroseas’ operations are managed by Eurobulk Ltd., an ISO 9001:2008 and ISO 14001:2004 certified affiliated ship management company, which is responsible for the day-to-day commercial and technical management and operations of the vessels. Euroseas employs its vessels on spot and period charters and through pool arrangements.
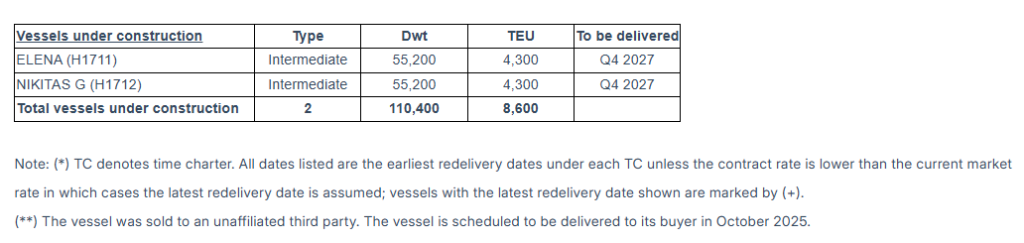
The Company has a fleet of 22 vessels, including 15 Feeder containerships and 7 Intermediate containerships. Euroseas 22 containerships have a cargo capacity of 67,494 teu. After the delivery of two intermediate containership newbuildings in the fourth quarter of 2027, Euroseas’ fleet will consist of 24 vessels with a total carrying capacity of 76,094 teu.
Forward Looking Statement This press release contains forward-looking statements (as defined in Section 27A of the Securities Act of 1933, as amended, and Section 21E of the Securities Exchange Act of 1934, as amended) concerning future events and the Company’s growth strategy and measures to implement such strategy; including expected vessel acquisitions and entering into further time charters. Words such as “expects,” “intends,” “plans,” “believes,” “anticipates,” “hopes,” “estimates,” and variations of such words and similar expressions are intended to identify forward-looking statements. Although the Company believes that the expectations reflected in such forward-looking statements are reasonable, no assurance can be given that such expectations will prove to have been correct. These statements involve known and unknown risks and are based upon a number of assumptions and estimates that are inherently subject to significant uncertainties and contingencies, many of which are beyond the control of the Company. Actual results may differ materially from those expressed or implied by such forward-looking statements. Factors that could cause actual results to differ materially include, but are not limited to changes in the demand for containerships, competitive factors in the market in which the Company operates; risks associated with operations outside the United States; and other factors listed from time to time in the Company’s filings with the Securities and Exchange Commission. The Company expressly disclaims any obligations or undertaking to release publicly any updates or revisions to any forward-looking statements contained herein to reflect any change in the Company’s expectations with respect thereto or any change in events, conditions or circumstances on which any statement is based.
ATHENS, Greece, June 16, 2025 (GLOBE NEWSWIRE) — Euroseas Ltd. (NASDAQ: ESEA), an owner and operator of container carrier vessels and provider of seaborne transportation for containerized cargoes, announced today that it will release its financial results for the first quarter ended March 31, 2025, on June 18, 2025, before market opens in New York.
On the same day, Wednesday, June 18 at 9:30 a.m. Eastern Time, the Company’s management will host a conference call and webcast to discuss the results.
ConferenceCalldetails: Participants should dial into the call 10 minutes before the scheduled time using the following numbers: 877 405 1226 (US Toll-Free Dial In) or +1 201 689 7823 (US and Standard International Dial In). Please quote “Euroseas” to the operator and/or conference ID 13754421. Click here for additional participant International Toll-Free access numbers.
Alternatively, participants can register for the call using the call me option for a faster connection to join the conference call. You can enter your phone number and let the system call you right away. Click here for the call me option.
AudioWebcast‐Slides Presentation: There will be a live and then archived webcast of the conference call and accompanying slides, available on the Company’s website. To listen to the archived audio file, visit our website http://www.euroseas.gr and click on Company Presentations under our Investor Relations page. Participants to the live webcast should register on the website approximately 10 minutes prior to the start of the webcast.
The slide presentation for the first quarter ended March 31, 2025, will also be available in PDF format minutes prior to the conference call and webcast, accessible on the company’s website (www.euroseas.gr) on the webcast page. Participants to the webcast can download the PDF presentation.
AboutEuroseasLtd. Euroseas Ltd. was formed on May 5, 2005 under the laws of the Republic of the Marshall Islands to consolidate the ship owning interests of the Pittas family of Athens, Greece, which has been in the shipping business over the past 140 years. Euroseas trades on the NASDAQ Capital Market under the ticker ESEA. Euroseas operates in the container shipping market. Euroseas’ operations are managed by Eurobulk Ltd., an ISO 9001:2008 and ISO 14001:2004 certified affiliated ship management company, which is responsible for the day-to-day commercial and technical management and operations of the vessels. Euroseas employs its vessels on spot and period charters and through pool arrangements. The Company has a fleet of 22 vessels, including 15 Feeder containerships and 7 Intermediate containerships. Euroseas 22 containerships have a cargo capacity of 67,494 teu. After the delivery of two feeder containership newbuildings in the the fourth quarter of 2027, Euroseas’ fleet will consist of 24 vessels with a total carrying capacity of 76,094 teu.
Euroseas Ltd. was formed on May 5, 2005 under the laws of the Republic of the Marshall Islands to consolidate the ship owning interests of the Pittas family of Athens, Greece, which has been in the shipping business over the past 140 years. Euroseas trades on the NASDAQ Capital Market under the ticker ESEA. Euroseas operates in the container shipping market. Euroseas’ operations are managed by Eurobulk Ltd., an ISO 9001:2008 and ISO 14001:2004 certified affiliated ship management company, which is responsible for the day-to-day commercial and technical management and operations of the vessels. Euroseas employs its vessels on spot and period charters and through pool arrangements.
Mark Reichman, Managing Director, Equity Research Analyst, Natural Resources, Noble Capital Markets, Inc.
Hans Baldau, Associate Analyst, Noble Capital Markets, Inc.
Refer to the full report for the price target, fundamental analysis, and rating.
New M/V Emmanuel P time charter contract. Euroseas Ltd. secured a new time charter contract for its 4,250 twenty-foot-equivalent (TEU) intermediate containership, M/V Emmanuel P, for a minimum of 36 months to a maximum period of 38 months, at the option of the charterer, at a gross daily rate of $38,000. The new contract represents a significant improvement compared to the previous rate of $21,000 per day. Following the completion of a scheduled drydock and installation of energy saving devices, the new charter is expected to commence upon delivery of the vessel from the shipyard in the first half of September.
Agreement to sell the M/V Marcos. Euroseas Ltd. recently signed an agreement to sell the M/V Marcos V, a 6,350 twenty-foot-equivalent unit (TEU) intermediate containership, to an unaffiliated third party for $50 million. The vessel will be delivered to the buyer in October 2025. ESEA expects to recognize a gain of ~$8.5 million, or $1.20 per share. The vessel was acquired in the fourth quarter of 2021 for $40 million. During its ownership, Euroseas Ltd. realized more than five times its original equity investment.
Equity Research is available at no cost to Registered users of Channelchek. Not a Member? Click ‘Join’ to join the Channelchek Community. There is no cost to register, and we never collect credit card information.
This Research is provided by Noble Capital Markets, Inc., a FINRA and S.E.C. registered broker-dealer (B/D).
*Analyst certification and important disclosures included in the full report. NOTE: investment decisions should not be based upon the content of this research summary. Proper due diligence is required before making any investment decision.
ATHENS, Greece, May 29, 2025 (GLOBE NEWSWIRE) — Euroseas Ltd. (NASDAQ: ESEA, the “Company” or “Euroseas”), an owner and operator of container carrier vessels and provider of seaborne transportation for containerized cargoes, announced today that it has signed an agreement to sell M/V Marcos V, an 6,350 teu intermediate containership built in 2005, to an unaffiliated third party, for $50 million. The vessel is scheduled to be delivered to its buyer in October 2025. The Company is expected to recognize a gain on the sale in excess of $8.50 million, or $1.20 per share.
Aristides Pittas, Chairman and CEO of Euroseas commented: “We are pleased to announce our agreement to sell our M/V Marcos V for a total price consideration of $50 million. The vessel was acquired in Q4 2021 for $40m, attached with a time charter contract at a rate of $42,000 per day for three years, plus a fourth year at the option of the charterer at $15,000 per day which was exercised. M/V Marcos V, upon its delivery to its new owners in October 2025, will have generated exceptional returns to our shareholders, realizing more than five times our original equity investment.”
Fleet Profile: The Euroseas Ltd. fleet profile is currently as follows:
Name
Type
Dwt
TEU
Year Built
Employment (*)
TCE Rate ($/day)
Container Carriers
MARCOS V(+)(***)
Intermediate
72,968
6,350
2005
TC until Oct-25
$15,000
SYNERGY BUSAN(*)
Intermediate
50,726
4,253
2009
TC until Dec-27
$35,500
SYNERGY ANTWERP(*)
Intermediate
50,726
4,253
2008
TC until May-28
$35,500
SYNERGY OAKLAND(*)
Intermediate
50,787
4,253
2009
TC until May-26
$42,000
SYNERGY KEELUNG(+)(*)
Intermediate
50,969
4,253
2009
TC until Jun-25 then until Jun-28
$23,000 $35,500
EMMANUEL P(+)
Intermediate
50,796
4,250
2005
TC until Aug-25
$21,000
RENA P(+)
Intermediate
50,796
4,250
2007
TC until Aug-25 then until Aug-28
$21,000 $35,500
EM KEA(*)
Feeder
42,165
3,100
2007
TC until May-26
$19,000
GREGOS(*)
Feeder
37,237
2,800
2023
TC until Apr-26
$48,000
TERATAKI(*)
Feeder
37,237
2,800
2023
TC until Jul-26
$48,000
TENDER SOUL(*)
Feeder
37,237
2,800
2024
TC until Oct-27
$32,000
LEONIDAS Z(*)
Feeder
37,237
2,800
2024
TC until Mar-26
$20,000
DEAR PANEL
Feeder
37,237
2,800
2025
TC until Nov-27
$32,000
SYMEON P
Feeder
37,237
2,800
2025
TC until Nov-27
$32,000
EVRIDIKI G(*)
Feeder
34,677
2,556
2001
TC until Apr-26
$29,500
EM CORFU(*)
Feeder
34,654
2,556
2001
TC until Aug-26
$28,000
STEPHANIA K(*)
Feeder
22,262
1,800
2024
TC until May-26
$22,000
MONICA(*)
Feeder
22,262
1,800
2024
TC until May-27
$23,500
PEPI STAR(*)
Feeder
22,262
1,800
2024
TC until Jun-26
$24,250
EM SPETSES(*)
Feeder
23,224
1,740
2007
TC until Feb-26
$18,100
JONATHAN P(*)
Feeder
23,357
1,740
2006
TC until Sep-25
$20,000
EM HYDRA(*)
Feeder
23,351
1,740
2005
TC until May-27
$19,000
Total Container Carriers on the Water
22
849,404
67,494
Vessels under construction
Type
Dwt
TEU
To be delivered
Employment
TCE Rate ($/day)
ELENA (H1711)
Intermediate
55,200
4,300
Q4 2027
NIKITAS G (H1712)
Intermediate
55,200
4,300
Q4 2027
Total under construction
2
110,400
8,600
Notes:
(*)TC denotes time charter. Charter duration indicates the earliest redelivery date; all dates listed are the earliest redelivery dates under each TC unless the contract rate is lower than the current market rate in which cases the latest redelivery date is assumed; vessels with the latest redelivery date shown are marked by (+). (**) Rate is net of commissions (which are typically 5-6.25%) (***) The vessel is sold and is expected to be delivered to its new owners in the fourth quarter of 2025
About Euroseas Ltd.
Euroseas Ltd. was formed on May 5, 2005 under the laws of the Republic of the Marshall Islands to consolidate the ship owning interests of the Pittas family of Athens, Greece, which has been in the shipping business over the past 140 years. Euroseas trades on the NASDAQ Capital Market under the ticker ESEA.
Euroseas operates in the container shipping market. Euroseas’ operations are managed by Eurobulk Ltd., an ISO 9001:2008 and ISO 14001:2004 certified affiliated ship management company, which is responsible for the day-to-day commercial and technical management and operations of the vessels. Euroseas employs its vessels on spot and period charters and through pool arrangements.
The Company has a fleet of 22 vessels, including 15 Feeder containerships and 7 Intermediate containerships with a cargo capacity of 67,494 teu. After the sale of M/V Marcos V and the delivery of the two intermediate containership newbuildings in 2027, Euroseas’ fleet will consist of 23 vessels with a total carrying capacity of 69,744 teu.
Forward Looking Statement
This press release contains forward-looking statements (as defined in Section 27A of the Securities Act of 1933, as amended, and Section 21E of the Securities Exchange Act of 1934, as amended) concerning future events and the Company’s growth strategy and measures to implement such strategy; including expected vessel acquisitions and entering into further time charters. Words such as “expects,” “intends,” “plans,” “believes,” “anticipates,” “hopes,” “estimates,” and variations of such words and similar expressions are intended to identify forward-looking statements. Although the Company believes that the expectations reflected in such forward-looking statements are reasonable, no assurance can be given that such expectations will prove to have been correct. These statements involve known and unknown risks and are based upon a number of assumptions and estimates that are inherently subject to significant uncertainties and contingencies, many of which are beyond the control of the Company. Actual results may differ materially from those expressed or implied by such forward-looking statements. Factors that could cause actual results to differ materially include, but are not limited to changes in the demand for containerships, competitive factors in the market in which the Company operates; risks associated with operations outside the United States; and other factors listed from time to time in the Company’s filings with the Securities and Exchange Commission. The Company expressly disclaims any obligations or undertaking to release publicly any updates or revisions to any forward-looking statements contained herein to reflect any change in the Company’s expectations with respect thereto or any change in events, conditions or circumstances on which any statement is based.
Seanergy Maritime Holdings Corp. is a prominent pure-play Capesize shipping company listed in the U.S. capital markets. Seanergy provides marine dry bulk transportation services through a modern fleet of Capesize vessels. The Company’s operating fleet consists of 18 vessels (1 Newcastlemax and 17 Capesize) with an average age of approximately 13.4 years and an aggregate cargo carrying capacity of approximately 3,236,212 dwt. Upon completion of the delivery of the previously announced Capesize vessel acquisition, the Company’s operating fleet will consist of 19 vessels (1 Newcastlemax and 18 Capesize) with an aggregate cargo carrying capacity of approximately 3,417,608 dwt. The Company is incorporated in the Marshall Islands and has executive offices in Glyfada, Greece. The Company’s common shares trade on the Nasdaq Capital Market under the symbol “SHIP”.
Mark Reichman, Managing Director, Equity Research Analyst, Natural Resources, Noble Capital Markets, Inc.
Hans Baldau, Associate Analyst, Noble Capital Markets, Inc.
Refer to the full report for the price target, fundamental analysis, and rating.
First quarter results. Seanergy reported first-quarter net revenues of $24.2 million, slightly ahead of our estimate of $23.5 million, due to a higher-than-expected time charter equivalent (TCE) rate. Adjusted EBITDA and earnings per share (EPS) were $8.0 million and a loss of $0.27, respectively, compared to our estimates of $6.1 million and a loss of $0.38. The better-than-anticipated results are reflective of higher revenues as well as lower costs due to savings in general and administrative expenses.
Updating estimates. We are increasing our 2025 revenue estimates to $142.9 million from $142.5 million. Additionally, we are raising our adjusted EBITDA and EPS estimates to $70.5 million and $0.74, respectively, up from $68.1 million and $0.59. These revisions are reflective of management’s guidance of better-than-expected TCE rates and fewer dry-docking days, resulting in higher operating days and lower expenses.
Equity Research is available at no cost to Registered users of Channelchek. Not a Member? Click ‘Join’ to join the Channelchek Community. There is no cost to register, and we never collect credit card information.
This Company Sponsored Research is provided by Noble Capital Markets, Inc., a FINRA and S.E.C. registered broker-dealer (B/D).
*Analyst certification and important disclosures included in the full report. NOTE: investment decisions should not be based upon the content of this research summary. Proper due diligence is required before making any investment decision.