Key Points: – Creation of a $5.2 billion domestic coal powerhouse – Enhanced operational and financial flexibility to navigate industry headwinds – Potential to extend the lifespan of the U.S. coal industry amid global energy shifts
The announcement of the merger between Consol Energy and Arch Resources marks a significant development in the U.S. coal industry. This $5.2 billion all-stock transaction will create a powerhouse player in the domestic coal market, poised to navigate the challenging landscape ahead.
At the core of this deal is the synergy between the two companies’ operations and market positions. Consol Energy and Arch Resources both specialize in high-quality bituminous coal, with a strong presence in the Appalachian region. By combining their resources, the merged entity, to be named Core Natural Resources, will control 11 mines, including some of the largest, lowest-cost, and highest-calorie domestic assets.
This consolidation is a strategic move to enhance competitiveness and resilience in the face of mounting pressures. The coal industry has faced a tumultuous year, with Consol Energy’s share price dropping 5.8% and Arch Resources’ declining 24%. The growing competition from renewable energy sources has put significant strain on the sector, underscoring the need for a more robust and adaptable player.
The merger is poised to deliver a range of operational and financial benefits. The companies expect to generate $110 to $140 million in synergies through cost reductions and enhanced market reach. Additionally, the larger scale and improved financial flexibility of the combined entity could better equip it to navigate the evolving energy landscape.
Notably, both Consol Energy and Arch Resources have maintained conservative balance sheets, with debt-to-equity ratios around 10% and sizeable cash reserves. This financial prudence suggests that the merged company will be well-positioned to weather any future industry headwinds.
The timing of this merger is particularly noteworthy, as it comes amid a backdrop of shifting global energy dynamics. While the long-term outlook for coal remains uncertain, the International Energy Agency (IEA) has reported that global coal demand is expected to remain stable in 2023 and 2024, driven primarily by continued growth in electricity demand from major economies like China and India.
This trend suggests that the phase-out of coal may not be as immediate as some have anticipated. The creation of a larger, more diversified domestic coal player through the Consol Energy-Arch Resources merger could help to bolster the industry’s position and provide a more robust foundation for its future.
Ultimately, this merger represents a strategic response to the challenges facing the coal industry. By combining their strengths, Consol Energy and Arch Resources aim to create a premier North American coal producer with enhanced capabilities and a stronger market presence. As the energy landscape continues to evolve, this merger could be a critical step in securing the long-term viability of domestic coal production.
As global markets continue to navigate choppy waters, one asset class has emerged as a beacon of stability and growth: gold. The precious metal has been on a remarkable upward trajectory, consistently making new highs and outperforming major stock market indexes. This trend has caught the attention of investors, particularly those interested in small-cap opportunities in the gold mining sector.
In recent months, gold prices have surged to record levels, breaking through previous resistance points and establishing new benchmarks. This impressive performance comes against a backdrop of economic uncertainty, inflationary pressures, and geopolitical tensions – factors that have historically driven investors towards safe-haven assets like gold.
The numbers speak for themselves: While the NASDAQ has posted a respectable year-to-date (YTD) gain of 12%, gold has outpaced it with a YTD increase of 16%. Looking at the year-over-year (YOY) performance, the NASDAQ is up 22%, but gold is not far behind with a 21% increase. These figures underscore gold’s resilience and its ability to keep pace with, and even outperform, one of the most dynamic stock market indexes.
Several key drivers are fueling gold’s ascent:
Inflation concerns: With central banks around the world implementing accommodative monetary policies to combat economic slowdowns, fears of inflation have intensified. Gold, long considered a hedge against inflation, has naturally attracted increased investor interest.
Weakening dollar: The US dollar’s relative weakness has made gold more attractive to international investors, as the metal becomes cheaper in other currencies.
Geopolitical tensions: Ongoing conflicts and trade disputes have heightened global uncertainty, prompting investors to seek refuge in gold’s perceived stability.
Low interest rates: With rates remaining at historically low levels, the opportunity cost of holding non-yielding assets like gold has decreased, making it more appealing to investors.
While major indexes like the S&P 500 and Dow Jones Industrial Average have experienced volatility, gold has steadily climbed. Its ability to outpace the NASDAQ’s YTD performance is particularly noteworthy, given the tech-heavy index’s reputation for growth.
This outperformance has significant implications for the small-cap investing landscape, particularly in the gold mining sector. Junior gold miners and exploration companies often exhibit a leveraged relationship to gold prices, meaning their stock prices can move more dramatically than the price of gold itself.
As gold prices rise, many of these smaller companies become increasingly viable, with previously marginal projects suddenly becoming profitable. This dynamic creates exciting opportunities for small-cap investors who are willing to do their due diligence and identify promising junior miners with solid fundamentals and strong growth potential.
However, it’s crucial for investors to approach this sector with caution. While the potential rewards can be substantial, junior gold stocks are known for their volatility. Thorough research, diversification, and a long-term perspective are essential when considering investments in this space.
Looking ahead, many analysts remain bullish on gold’s prospects. The combination of ongoing economic uncertainties, potential inflationary pressures, and the metal’s historical role as a store of value suggest that gold may continue its upward trajectory. This outlook bodes well for both direct investments in gold and strategic positions in carefully selected gold mining stocks.
In conclusion, gold’s stellar performance amidst current market conditions presents a compelling narrative for investors. Its ability to outshine major indexes while providing a hedge against economic uncertainties makes it an attractive option for portfolio diversification. For small-cap investors, the gold mining sector offers intriguing opportunities to capitalize on this trend, provided they approach it with the necessary research and risk management strategies.
As always, investors should consult with financial advisors and conduct thorough research before making investment decisions, especially in the dynamic and potentially volatile world of small-cap gold stocks.
Comstock (NYSE: LODE) innovates technologies that contribute to global decarbonization and circularity by efficiently converting under-utilized natural resources into renewable fuels and electrification products that contribute to balancing global uses and emissions of carbon. The Company intends to achieve exponential growth and extraordinary financial, natural, and social gains by building, owning, and operating a fleet of advanced carbon neutral extraction and refining facilities, by selling an array of complimentary process solutions and related services, and by licensing selected technologies to qualified strategic partners. To learn more, please visit www.comstock.inc.
Mark Reichman, Managing Director, Equity Research Analyst, Natural Resources, Noble Capital Markets, Inc.
Refer to the full report for the price target, fundamental analysis, and rating.
Proposed transaction with SBC Commerce. Comstock executed an indicative term sheet for $325 million, or $315 million net of transaction fees, in funding through SBC Commerce LLC (SBCC), a U.S. based private equity group. The transaction is contingent on final due diligence and applicable regulatory approvals and is expected to close in tranches over the next two to three months. At this point, we assume the transaction will close successfully within the contemplated time frame.
Infusion of growth capital to accelerate commercialization. The transaction provides a clear valuation marker for each of the company’s fuels, metals, and mining businesses and secures growth capital to accelerate commercialization efforts. SBCC will acquire Comstock’s industrial and commercial real estate and water rights in Nevada for $50 million, or $47 million net of transaction expenses.
Equity Research is available at no cost to Registered users of Channelchek. Not a Member? Click ‘Join’ to join the Channelchek Community. There is no cost to register, and we never collect credit card information.
This Company Sponsored Research is provided by Noble Capital Markets, Inc., a FINRA and S.E.C. registered broker-dealer (B/D).
*Analyst certification and important disclosures included in the full report. NOTE: investment decisions should not be based upon the content of this research summary. Proper due diligence is required before making any investment decision.
Mark Reichman, Managing Director, Equity Research Analyst, Natural Resources, Noble Capital Markets, Inc.
Refer to the full report for the price target, fundamental analysis, and rating.
Lithium carbonate production at the pilot plant. Century Lithium successfully added a lithium carbonate stage at the company’s lithium extraction facility which is part of the company’s Angel Island Mine project. Recall that Century recently changed the name of its Clayton Valley Lithium project to Angel Island Mine to distinguish it from other projects. Previously, concentrated lithium solutions from the pilot plant were treated by Saltworks Inc. at their facility in Richmond, British Columbia to produce samples of battery grade lithium carbonate.
Following through on the feasibility study. Adding the lithium carbonate stage at the pilot plant satisfies one of the recommendations contained in the recently published feasibility study. Being able to produce battery grade lithium on site further demonstrates the commercial viability of the project and will also help the company to better optimize the process from the direct lithium extraction (DLE) phase through to production of the final product. Century successfully treated 200 liters of concentrated lithium solution and produced 20 kilograms of high-grade lithium carbonate on site.
Equity Research is available at no cost to Registered users of Channelchek. Not a Member? Click ‘Join’ to join the Channelchek Community. There is no cost to register, and we never collect credit card information.
This Company Sponsored Research is provided by Noble Capital Markets, Inc., a FINRA and S.E.C. registered broker-dealer (B/D).
*Analyst certification and important disclosures included in the full report. NOTE: investment decisions should not be based upon the content of this research summary. Proper due diligence is required before making any investment decision.
August 6, 2024 – Vancouver, Canada – Century Lithium Corp. (TSXV:LCE) (OTCQX: CYDVF) (Frankfurt: C1Z) (Century Lithium or the Company) is pleased to report the successful addition of a lithium carbonate stage at the Company’s Lithium Extraction Facility (Pilot Plant) in Amargosa Valley, Nevada, USA, part of the Company’s 100%-owned Angel Island Mine (the Project). Prior to this addition, concentrated lithium solutions from the Pilot Plant were treated by Saltworks Inc. at their facility in Richmond B.C. where samples of battery quality lithium carbonate were produced. During the first days of startup of the lithium carbonate stage, Century’s team at the Pilot Plant successfully treated 200 liters of concentrated lithium solution and produced 20 kg of high-grade lithium carbonate onsite.
“At this point in time, the ability to make lithium carbonate at our Pilot Plant is an important step forward, in line with recommendations from our recently completed Feasibility Study” commented President and CEO Bill Willoughby. “The drop in lithium prices over the last year has taken a toll on the share price of all lithium companies. Despite the downturn, domestic production is still key to the security of supply in the U.S. While it is becoming well known that a vast amount of lithium is contained within the claystone deposits of Nevada, the benefit in unlocking these resources is the ability to produce a battery quality lithium product onsite and thereby reducing or eliminating the need for downstream processing.”
The Company continues work at the Pilot Plant, utilizing the Company’s patent-pending process for chloride leaching combined with Direct Lithium Extraction (DLE) to generate data as the Company works to identify further technological breakthroughs to make the extraction of lithium from clay more economic. Adding the lithium carbonate stage at the Pilot Plant is one of the recommendations made in the Feasibility Study, not only to further demonstrate that battery quality lithium carbonate can be made, but to better understand and minimize the recycle streams from the DLE stage through to final product in the process. With the assistance of engineers from Hargrove Engineers and Constructors, Century’s team configured equipment to run 40-liter batches of concentrated lithium solution though precipitation, washing and drying steps. Final assays on the lithium carbonate are pending.
Qualified Person
Todd Fayram, MMSA-QP and Senior Vice President, Metallurgy of Century Lithium is the qualified person as defined by National Instrument 43-101 and has approved the technical information in this release.
ABOUT CENTURY LITHIUM CORP.
Century Lithium Corp. is an advanced stage lithium company, focused on developing its 100%-owned Angel Island Mine in west-central Nevada, USA. Century Lithium recently completed a Feasibility Study on its Clayton Valley Lithium Project and is currently in the permitting stage, with the goal of becoming a domestic producer of lithium for the growing electric vehicle and battery storage market.
ON BEHALF OF CENTURY LITHIUM CORP. WILLIAM WILLOUGHBY, PhD., PE President & Chief Executive Officer
NEITHER THE TSX VENTURE EXCHANGE NOR ITS REGULATION SERVICES PROVIDER ACCEPTS RESPONSIBILITY FOR THE ADEQUACY OR ACCURACY OF THE CONTENT OF THIS NEWS RELEASE.
This release contains certain forward-looking statements within the meaning of applicable Canadian securities legislation. In certain cases, forward-looking statements can be identified by the use of words such as “plans”, “expects” or “does not anticipate”, or “believes”, or variations of such words and phrases or statements that certain actions, events or results “may”, “could”, “would”, “might” or “will be taken”, “occur” or “be achieved” and similar expressions suggesting future outcomes or statements regarding an outlook.
Forward-looking statements relate to any matters that are not historical facts and statements of our beliefs, intentions and expectations about developments, results and events which will or may occur in the future, without limitation, statements with respect to the potential development and value of the Project and benefits associated therewith, statements with respect to the expected project economics for the Project, such as estimates of life of mine, lithium prices, production and recoveries, capital and operating costs, IRR, NPV and cash flows, any projections outlined in the Feasibility Study in respect of the Project, the permitting status of the Project and the Company’s future development plans.
These and other forward-looking statements and information are subject to various known and unknown risks and uncertainties, many of which are beyond the ability of the Company to control or predict, that may cause their actual results, performance or achievements to be materially different from those expressed or implied thereby, and are developed based on assumptions about such risks, uncertainties and other factors set out herein.These risks include those described under the heading “Risk Factors” in the Company’s most recent annual information form and its other public filings, copies of which can be under the Company’s profile at www.sedarplus.com. The Company expressly disclaims any obligation to update-forward-looking information except as required by applicable law. No forward-looking statement can be guaranteed and actual future results may vary materially. Accordingly, readers are advised not to place reliance on forward-looking statements or information. Furthermore, Mineral Resources that are not Mineral Reserves do not have demonstrated economic viability.
ARLP is a diversified natural resource company that generates operating and royalty income from coal produced by its mining complexes and royalty income from mineral interests it owns in strategic oil & gas producing regions in the United States, primarily the Permian, Anadarko and Williston basins. ARLP currently produces coal from seven mining complexes its subsidiaries operate in Illinois, Indiana, Kentucky, Maryland and West Virginia. ARLP also operates a coal loading terminal on the Ohio River at Mount Vernon, Indiana. ARLP markets its coal production to major domestic and international utilities and industrial users and is currently the second largest coal producer in the eastern United States. In addition, ARLP is positioning itself as an energy provider for the future by leveraging its core technology and operating competencies to make strategic investments in the fast growing energy and infrastructure transition.
Mark Reichman, Managing Director, Equity Research Analyst, Natural Resources, Noble Capital Markets, Inc.
Refer to the full report for the price target, fundamental analysis, and rating.
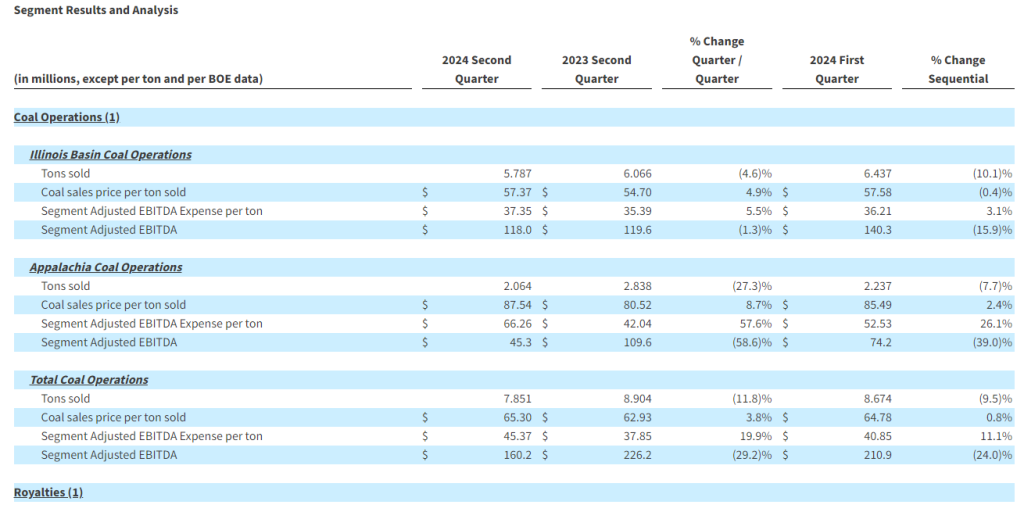
Second quarter financial results. Alliance reported second quarter EBITDA and earnings per unit (EPU) of $177.7 million and $0.77, respectively, compared to $249.2 million and $1.30 during the prior year period. We had forecast EBITDA and EPU of $196.9 million and $0.86. Revenue declined 7.6% to $593.4 million due to lower coal sales volumes, which declined 11.8% due to transportation delays that were partially offset by higher coal sales price realizations which increased 3.8% to $65.30 per ton. Alliance experienced a $3.7 million, or $0.03 per unit, decrease in the fair value of the partnership’s digital assets. Roughly 500,000 tons of coal sales were deferred and are expected to be made up during the remainder of the year.
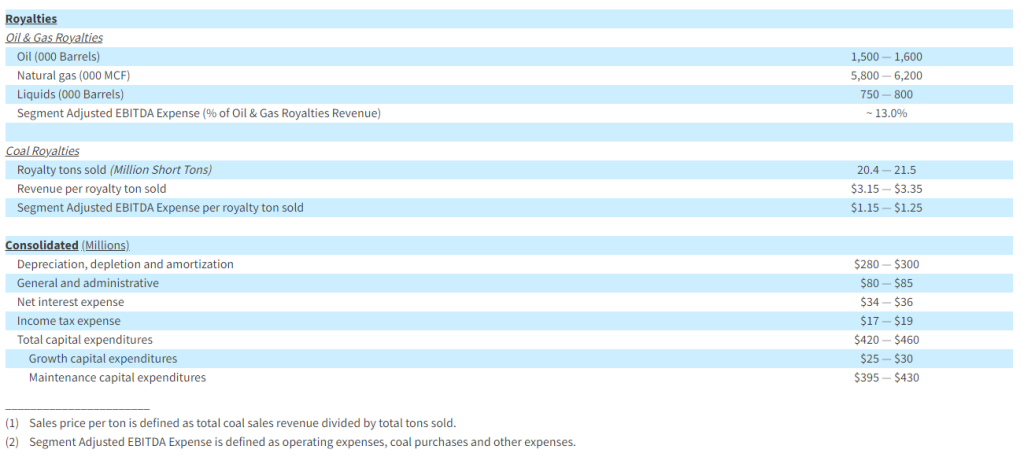
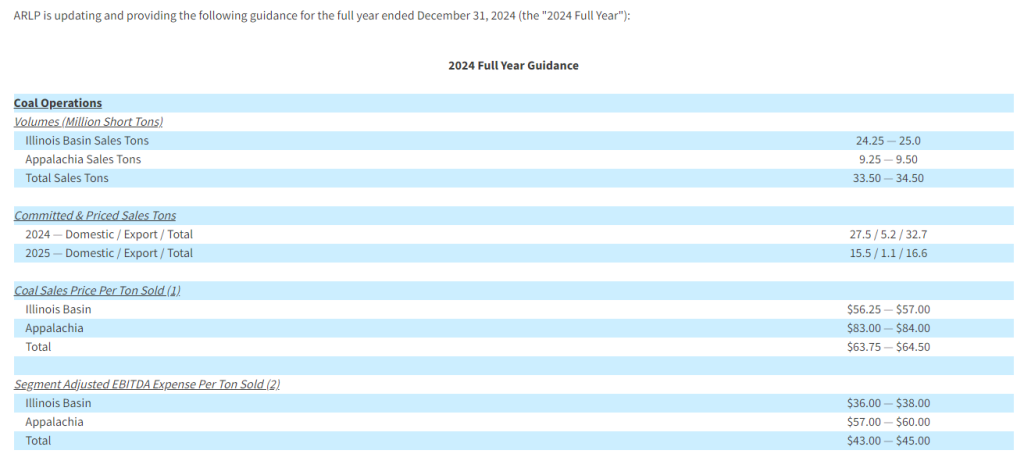
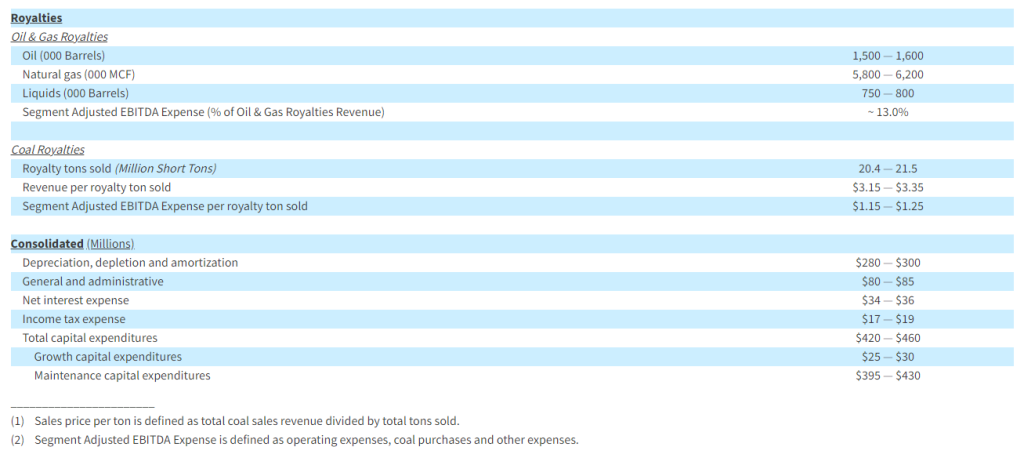
Updated 2024 corporate guidance. Management updated its 2024 guidance which calls for lower coal sales volumes and higher oil and gas royalty volumes. The lower coal sales guidance is based on uncertainty associated with coal export sales. While the guidance for coal sales volume was lowered, sales price realization expectations were increased at the midpoint of guidance.
Equity Research is available at no cost to Registered users of Channelchek. Not a Member? Click ‘Join’ to join the Channelchek Community. There is no cost to register, and we never collect credit card information.
This Company Sponsored Research is provided by Noble Capital Markets, Inc., a FINRA and S.E.C. registered broker-dealer (B/D).
*Analyst certification and important disclosures included in the full report. NOTE: investment decisions should not be based upon the content of this research summary. Proper due diligence is required before making any investment decision.
Second quarter 2024 total revenue of $593.4 million, net income of $100.2 million, and EBITDA of $177.7 million
Coal sales price realizations of $65.30 per ton sold, up 3.8% year-over-year
Increased oil & gas royalty volumes to 817 MBOE, up 6.8% year-over-year
In June 2024, issued $400 million in 8.625% Senior Notes due 2029 and redeemed outstanding balance of Senior Notes due 2025
Extended revolving credit facility maturity to March 2028
Enhanced liquidity position to $666.0 million, which included $203.7 million in cash and $462.3 million of borrowings available under credit facilities
In July 2024, declared quarterly cash distribution of $0.70 per unit, or $2.80 per unit annualized
TULSA, Okla.–(BUSINESS WIRE)– In the Condensed Consolidated Statements of Income and Operating Data table the figure for INCOME FROM OPERATIONS for the Three Months Ended June 2023 should read: 183,929 (instead of 10183,929).
The updated release reads:
ALLIANCE RESOURCE PARTNERS, L.P. REPORTS SECOND QUARTER FINANCIAL AND OPERATING RESULTS; DECLARES QUARTERLY CASH DISTRIBUTION OF $0.70 PER UNIT AND UPDATES 2024 GUIDANCE
2024 Quarter Highlights
Second quarter 2024 total revenue of $593.4 million, net income of $100.2 million, and EBITDA of $177.7 million
Coal sales price realizations of $65.30 per ton sold, up 3.8% year-over-year
Increased oil & gas royalty volumes to 817 MBOE, up 6.8% year-over-year
In June 2024, issued $400 million in 8.625% Senior Notes due 2029 and redeemed outstanding balance of Senior Notes due 2025
Extended revolving credit facility maturity to March 2028
Enhanced liquidity position to $666.0 million, which included $203.7 million in cash and $462.3 million of borrowings available under credit facilities
In July 2024, declared quarterly cash distribution of $0.70 per unit, or $2.80 per unit annualized
Alliance Resource Partners, L.P. (NASDAQ: ARLP) (“ARLP” or the “Partnership”) today reported financial and operating results for the three and six months ended June 30, 2024 (the “2024 Quarter” and “2024 Period,” respectively). This release includes comparisons of results to the three and six months ended June 30, 2023 (the “2023 Quarter” and “2023 Period,” respectively) and to the quarter ended March 31, 2024 (the “Sequential Quarter”). All references in the text of this release to “net income” refer to “net income attributable to ARLP.” For a definition of EBITDA and related reconciliation to its comparable GAAP financial measure, please see the end of this release.
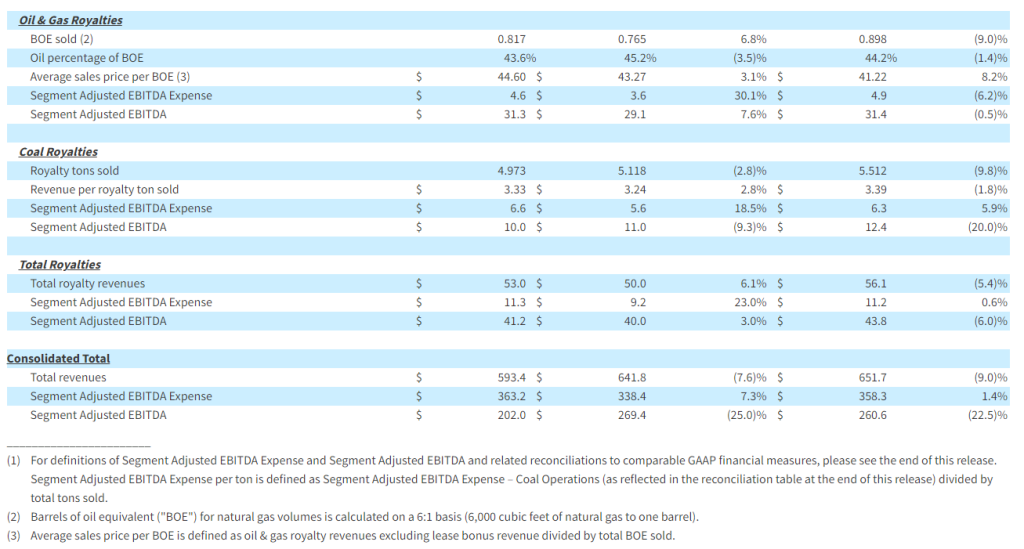
Total revenues in the 2024 Quarter decreased 7.6% to $593.4 million compared to $641.8 million for the 2023 Quarter primarily as a result of reduced coal sales volumes, which declined 11.8% primarily due to transportation delays, partially offset by increased coal sales price realizations, which rose 3.8% to $65.30 per ton sold in the 2024 Quarter compared to $62.93 per ton sold in the 2023 Quarter. Net income for the 2024 Quarter was $100.2 million, or $0.77 per basic and diluted limited partner unit, compared to $169.8 million, or $1.30 per basic and diluted limited partner unit, for the 2023 Quarter as a result of lower revenues and increased total operating expenses. EBITDA for the 2024 Quarter was $177.7 million compared to $249.2 million in the 2023 Quarter.
Compared to the Sequential Quarter, total revenues in the 2024 Quarter decreased 9.0% primarily as a result of lower tons sold. Lower revenues and a $3.7 million reduction in the fair value of our digital assets, partially offset by reduced operating expenses, reduced net income and EBITDA by 36.6% and 24.4%, respectively, compared to the Sequential Quarter.
Total revenues decreased 4.6% to $1.25 billion for the 2024 Period compared to $1.30 billion for the 2023 Period primarily due to lower coal sales, partially offset by higher oil & gas royalties and other revenues. Net income for the 2024 Period was $258.2 million, or $1.98 per basic and diluted limited partner unit, compared to $361.0 million, or $2.75 per basic and diluted limited partner unit, for the 2023 Period as a result of lower revenues and increased total operating expenses. EBITDA for the 2024 Period was $412.7 million compared to $520.1 million in the 2023 Period.
CEO Commentary
“During the 2024 Quarter we enhanced our liquidity position,” highlighted Joseph W. Craft III, Chairman, President, and Chief Executive Officer. “The successful completion of our Senior Notes offering further strengthened our balance sheet and represents a vote of confidence from the capital markets for our business strategy and plans for execution. As we have said time and again, reliable, affordable, baseload energy is a cornerstone of our nation’s economy, and our strong financial position means we are well-positioned to provide strategic energy supply from our well-capitalized and strategically located coal mines and growing minerals acreage portfolio for many years to come.”
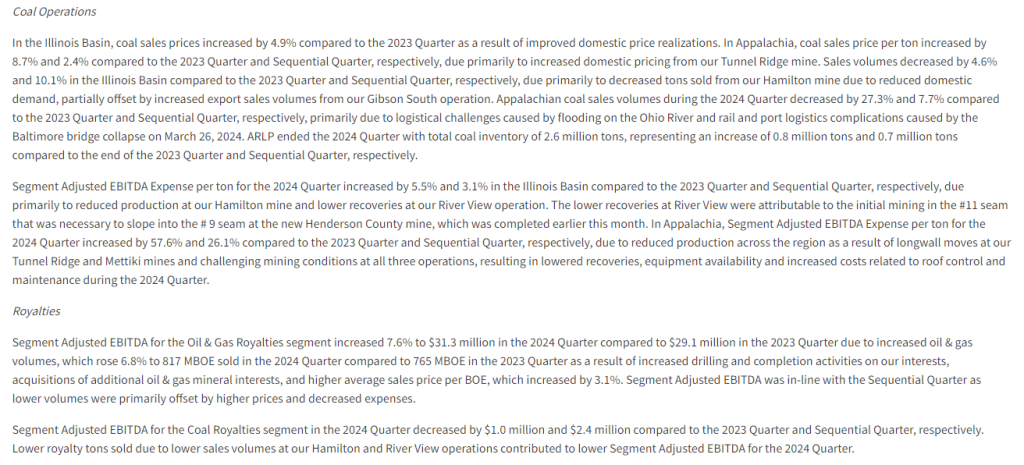
“Coal sales volumes during the 2024 Quarter were impacted by flooding on the Ohio River delaying barge deliveries. Rail and port logistics were disrupted by the Baltimore bridge incident, which as time progressed impacted shipments from our Appalachia rail operations. These delays, combined with lower export sales, lifted our inventories higher by 0.8 million tons compared to the Sequential Quarter,” commented Mr. Craft. “Our well-contracted order book continued to provide stability for our business, delivering improvements in coal sales pricing per ton compared to both the 2023 Quarter and the Sequential Quarter. Additionally, our Oil & Gas Royalties segment reported a 6.8% increase in BOE volumes year-over-year during the 2024 Quarter as our Permian-weighted minerals portfolio continues to realize production growth from recently drilled and completed wells.”
Balance Sheet and Liquidity
As of June 30, 2024, total debt and finance leases outstanding were $503.9 million, including $400 million in newly issued Senior Notes due 2029. The Partnership’s total and net leverage ratios were 0.61 times and 0.36 times debt to trailing twelve months Adjusted EBITDA, respectively, as of June 30, 2024. ARLP ended the 2024 Quarter with total liquidity of $666.0 million, which included $203.7 million of cash and cash equivalents and $462.3 million of borrowings available under its revolving credit and accounts receivable securitization facilities.
During the 2024 Quarter, the Partnership issued $400 million in 8.625% Senior Notes due 2029 and redeemed the outstanding balance of $284.6 million in ARLP’s 7.5% Senior Notes due 2025. The Partnership also amended its revolving credit facility to extend the maturity date to March 9, 2028.
Distributions
On July 26, 2024, we announced that the Board of Directors of ARLP’s general partner (the “Board”) approved a cash distribution to unitholders for the 2024 Quarter of $0.70 per unit (an annualized rate of $2.80 per unit), payable on August 14, 2024, to all unitholders of record as of the close of trading on August 7, 2024. The announced distribution is consistent with the cash distributions for the 2023 Quarter and Sequential Quarter.
Outlook
“For the first half of 2024, utility coal burn has been essentially flat with 2023,” commented Mr. Craft. “Since the start of this summer, cooling demand has been strong across many parts of the country driven by recent record-breaking temperatures and accelerating coal-based power generation. This is encouraging considering the very mild 2024 winter and persistently low natural gas prices. At the same time, while demand is holding up, U.S. thermal coal production has slowed significantly (Eastern U.S. production down 11% year-over-year) as utilities are relying on consuming coal from their elevated inventories to meet this demand. Weather forecasts suggest this heat wave will continue through August and an industry publication is projecting demand will exceed supply by close to 20 million tons in the second half of 2024.”
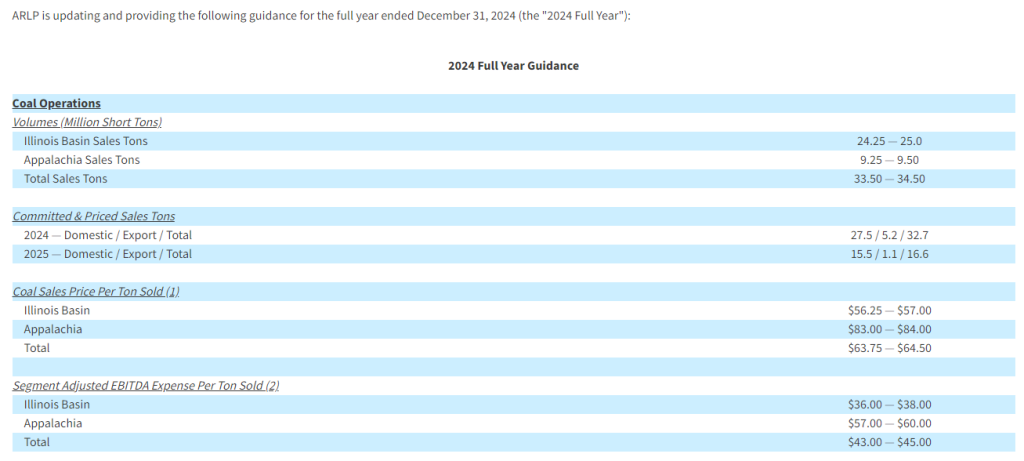
“Turning to the export markets, net back pricing for high sulfur Illinois Basin coal has declined to a level that we have decided it is prudent to slow down production for the back half of the year. Therefore, we are adjusting 2024 full-year guidance for our coal operations. At the midpoint, we now expect to sell approximately 34.0 million tons in 2024, or 2.6% below the mid-point of our original guidance for the year. Due to the increased summer burn, we now expect more than half of our uncontracted tonnage position will be sold in the domestic market.”
Mr. Craft continued, “Looking at our Oil & Gas Royalties platform, year-to-date performance and continued strong activity across our Permian Basin acreage has set the tone for another robust year. As a result, we are pleased to increase volumetric guidance across all three commodity streams within our Oil & Gas Royalties segment.”
Mr. Craft concluded, “The increase in coal-fired generation and inventory drawdown is constructive for the U.S. thermal coal market and for ARLP as we look forward to next year and beyond. We remain confident in the core fundamentals expected to drive rapid growth in electricity demand for many years to come, including the increasing power requirements stemming from AI, data centers, and the onshoring of U.S. manufacturing.”
Conference Call
A conference call regarding ARLP’s 2024 Quarter financial results is scheduled for today at 10:00 a.m. Eastern. To participate in the conference call, dial (877) 407-0784 and request to be connected to the Alliance Resource Partners, L.P. earnings conference call. International callers should dial (201) 689-8560 and request to be connected to the same call. Investors may also listen to the call via the “Investors” section of ARLP’s website at www.arlp.com .
An audio replay of the conference call will be available for approximately one week. To access the audio replay, dial U.S. Toll Free (844) 512-2921; International Toll (412) 317-6671 and request to be connected to replay using access code 13747640.
About Alliance Resource Partners, L.P.
ARLP is a diversified energy company that is currently the largest coal producer in the eastern United States, supplying reliable, affordable energy domestically and internationally to major utilities, metallurgical and industrial users. ARLP also generates operating and royalty income from mineral interests it owns in strategic coal and oil & gas producing regions in the United States. In addition, ARLP is evolving and positioning itself as a reliable energy partner for the future by pursuing opportunities that support the advancement of energy and related infrastructure.
News, unit prices and additional information about ARLP, including filings with the Securities and Exchange Commission (“SEC”), are available at www.arlp.com . For more information, contact the investor relations department of ARLP at (918) 295-7673 or via e-mail at investorrelations@arlp.com .
The statements and projections used throughout this release are based on current expectations. These statements and projections are forward-looking, and actual results may differ materially. These projections do not include the potential impact of any mergers, acquisitions or other business combinations that may occur after the date of this release. We have included more information below regarding business risks that could affect our results.
FORWARD-LOOKING STATEMENTS: With the exception of historical matters, any matters discussed in this press release are forward-looking statements that involve risks and uncertainties that could cause actual results to differ materially from projected results. Those forward-looking statements include expectations with respect to our future financial performance, coal and oil & gas consumption and expected future prices, our ability to increase unitholder distributions in future quarters, business plans and potential growth with respect to our energy and infrastructure transition investments, optimizing cash flows, reducing operating and capital expenditures, infrastructure projects at our existing properties, growth in domestic electricity demand, preserving liquidity and maintaining financial flexibility, and our future repurchases of units and senior notes, among others. These risks to our ability to achieve these outcomes include, but are not limited to, the following: decline in the coal industry’s share of electricity generation, including as a result of environmental concerns related to coal mining and combustion, the cost and perceived benefits of other sources of electricity and fuels, such as oil & gas, nuclear energy, and renewable fuels and the planned retirement of coal-fired power plants in the U.S.; our ability to provide fuel for growth in domestic energy demand, should it materialize; changes in macroeconomic and market conditions and market volatility, and the impact of such changes and volatility on our financial position; changes in global economic and geo-political conditions or changes in industries in which our customers operate; changes in commodity prices, demand and availability which could affect our operating results and cash flows; the outcome or escalation of current hostilities in Ukraine and the Israel-Gaza conflict; the severity, magnitude and duration of any future pandemics and impacts of such pandemics and of businesses’ and governments’ responses to such pandemics on our operations and personnel, and on demand for coal, oil, and natural gas, the financial condition of our customers and suppliers and operators, available liquidity and capital sources and broader economic disruptions; actions of the major oil-producing countries with respect to oil production volumes and prices could have direct and indirect impacts over the near and long term on oil & gas exploration and production operations at the properties in which we hold mineral interests; changes in competition in domestic and international coal markets and our ability to respond to such changes; potential shut-ins of production by the operators of the properties in which we hold oil & gas mineral interests due to low commodity prices or the lack of downstream demand or storage capacity; risks associated with the expansion of and investments into the infrastructure of our operations and properties; our ability to identify and complete acquisitions and to successfully integrate such acquisitions into our business and achieve the anticipated benefits therefrom; our ability to identify and invest in new energy and infrastructure transition ventures; the success of our development plans for our wholly owned subsidiary, Matrix Design Group, LLC, and our investments in emerging infrastructure and technology companies; dependence on significant customer contracts, including renewing existing contracts upon expiration; adjustments made in price, volume, or terms to existing coal supply agreements; the effects of and changes in trade, monetary and fiscal policies and laws, central bank policy actions including interest rates, bank failures and associated liquidity risks; the effects of and changes in taxes or tariffs and other trade measures adopted by the United States and foreign governments; legislation, regulations, and court decisions and interpretations thereof, both domestic and foreign, including those relating to the environment and the release of greenhouse gases, such as the Environmental Protection Agency’s recently promulgated emissions regulations for coal-fired power plants, mining, miner health and safety, hydraulic fracturing, and health care; deregulation of the electric utility industry or the effects of any adverse change in the coal industry, electric utility industry, or general economic conditions; investors’ and other stakeholders’ increasing attention to environmental, social, and governance matters; liquidity constraints, including those resulting from any future unavailability of financing; customer bankruptcies, cancellations or breaches to existing contracts, or other failures to perform; customer delays, failure to take coal under contracts or defaults in making payments; our productivity levels and margins earned on our coal sales; disruptions to oil & gas exploration and production operations at the properties in which we hold mineral interests; changes in equipment, raw material, service or labor costs or availability, including due to inflationary pressures; changes in our ability to recruit, hire and maintain labor; our ability to maintain satisfactory relations with our employees; increases in labor costs including costs of health insurance and taxes resulting from the Affordable Care Act, adverse changes in work rules, or cash payments or projections associated with workers’ compensation claims; increases in transportation costs and risk of transportation delays or interruptions; operational interruptions due to geologic, permitting, labor, weather, supply chain shortage of equipment or mine supplies, or other factors; risks associated with major mine-related accidents, mine fires, mine floods or other interruptions; results of litigation, including claims not yet asserted; foreign currency fluctuations that could adversely affect the competitiveness of our coal abroad; difficulty maintaining our surety bonds for mine reclamation as well as workers’ compensation and black lung benefits; difficulty in making accurate assumptions and projections regarding post-mine reclamation as well as pension, black lung benefits, and other post-retirement benefit liabilities; uncertainties in estimating and replacing our coal mineral reserves and resources; uncertainties in estimating and replacing our oil & gas reserves; uncertainties in the amount of oil & gas production due to the level of drilling and completion activity by the operators of our oil & gas properties; uncertainties in the future of the electric vehicle industry and the market for EV charging stations; the impact of current and potential changes to federal or state tax rules and regulations, including a loss or reduction of benefits from certain tax deductions and credits; difficulty obtaining commercial property insurance, and risks associated with our participation in the commercial insurance property program; evolving cybersecurity risks, such as those involving unauthorized access, denial-of-service attacks, malicious software, data privacy breaches by employees, insiders or others with authorized access, cyber or phishing attacks, ransomware, malware, social engineering, physical breaches, or other actions; and difficulty in making accurate assumptions and projections regarding future revenues and costs associated with equity investments in companies we do not control.
Additional information concerning these, and other factors can be found in ARLP’s public periodic filings with the SEC, including ARLP’s Annual Report on Form 10-K for the year ended December 31, 2023, filed on February 23, 2024,and ARLP’s Quarterly Report on Form 10-Q for the quarter ended March 31, 2024, filed on May 9, 2024. Except as required by applicable securities laws, ARLP does not intend to update its forward-looking statements.
Second quarter 2024 total revenue of $593.4 million, net income of $100.2 million, and EBITDA of $177.7 million
Coal sales price realizations of $65.30 per ton sold, up 3.8% year-over-year
Increased oil & gas royalty volumes to 817 MBOE, up 6.8% year-over-year
In June 2024, issued $400 million in 8.625% Senior Notes due 2029 and redeemed outstanding balance of Senior Notes due 2025
Extended revolving credit facility maturity to March 2028
Enhanced liquidity position to $666.0 million, which included $203.7 million in cash and $462.3 million of borrowings available under credit facilities
In July 2024, declared quarterly cash distribution of $0.70 per unit, or $2.80 per unit annualized
TULSA, Okla.–(BUSINESS WIRE)– Alliance Resource Partners, L.P. (NASDAQ: ARLP) (“ARLP” or the “Partnership”) today reported financial and operating results for the three and six months ended June 30, 2024 (the “2024 Quarter” and “2024 Period,” respectively). This release includes comparisons of results to the three and six months ended June 30, 2023 (the “2023 Quarter” and “2023 Period,” respectively) and to the quarter ended March 31, 2024 (the “Sequential Quarter”). All references in the text of this release to “net income” refer to “net income attributable to ARLP.” For a definition of EBITDA and related reconciliation to its comparable GAAP financial measure, please see the end of this release.
Total revenues in the 2024 Quarter decreased 7.6% to $593.4 million compared to $641.8 million for the 2023 Quarter primarily as a result of reduced coal sales volumes, which declined 11.8% primarily due to transportation delays, partially offset by increased coal sales price realizations, which rose 3.8% to $65.30 per ton sold in the 2024 Quarter compared to $62.93 per ton sold in the 2023 Quarter. Net income for the 2024 Quarter was $100.2 million, or $0.77 per basic and diluted limited partner unit, compared to $169.8 million, or $1.30 per basic and diluted limited partner unit, for the 2023 Quarter as a result of lower revenues and increased total operating expenses. EBITDA for the 2024 Quarter was $177.7 million compared to $249.2 million in the 2023 Quarter.
Compared to the Sequential Quarter, total revenues in the 2024 Quarter decreased 9.0% primarily as a result of lower tons sold. Lower revenues and a $3.7 million reduction in the fair value of our digital assets, partially offset by reduced operating expenses, reduced net income and EBITDA by 36.6% and 24.4%, respectively, compared to the Sequential Quarter.
Total revenues decreased 4.6% to $1.25 billion for the 2024 Period compared to $1.30 billion for the 2023 Period primarily due to lower coal sales, partially offset by higher oil & gas royalties and other revenues. Net income for the 2024 Period was $258.2 million, or $1.98 per basic and diluted limited partner unit, compared to $361.0 million, or $2.75 per basic and diluted limited partner unit, for the 2023 Period as a result of lower revenues and increased total operating expenses. EBITDA for the 2024 Period was $412.7 million compared to $520.1 million in the 2023 Period.
CEO Commentary
“During the 2024 Quarter we enhanced our liquidity position,” highlighted Joseph W. Craft III, Chairman, President, and Chief Executive Officer. “The successful completion of our Senior Notes offering further strengthened our balance sheet and represents a vote of confidence from the capital markets for our business strategy and plans for execution. As we have said time and again, reliable, affordable, baseload energy is a cornerstone of our nation’s economy, and our strong financial position means we are well-positioned to provide strategic energy supply from our well-capitalized and strategically located coal mines and growing minerals acreage portfolio for many years to come.”
“Coal sales volumes during the 2024 Quarter were impacted by flooding on the Ohio River delaying barge deliveries. Rail and port logistics were disrupted by the Baltimore bridge incident, which as time progressed impacted shipments from our Appalachia rail operations. These delays, combined with lower export sales, lifted our inventories higher by 0.8 million tons compared to the Sequential Quarter,” commented Mr. Craft. “Our well-contracted order book continued to provide stability for our business, delivering improvements in coal sales pricing per ton compared to both the 2023 Quarter and the Sequential Quarter. Additionally, our Oil & Gas Royalties segment reported a 6.8% increase in BOE volumes year-over-year during the 2024 Quarter as our Permian-weighted minerals portfolio continues to realize production growth from recently drilled and completed wells.”
Balance Sheet and Liquidity
As of June 30, 2024, total debt and finance leases outstanding were $503.9 million, including $400 million in newly issued Senior Notes due 2029. The Partnership’s total and net leverage ratios were 0.61 times and 0.36 times debt to trailing twelve months Adjusted EBITDA, respectively, as of June 30, 2024. ARLP ended the 2024 Quarter with total liquidity of $666.0 million, which included $203.7 million of cash and cash equivalents and $462.3 million of borrowings available under its revolving credit and accounts receivable securitization facilities.
During the 2024 Quarter, the Partnership issued $400 million in 8.625% Senior Notes due 2029 and redeemed the outstanding balance of $284.6 million in ARLP’s 7.5% Senior Notes due 2025. The Partnership also amended its revolving credit facility to extend the maturity date to March 9, 2028.
Distributions
On July 26, 2024, we announced that the Board of Directors of ARLP’s general partner (the “Board”) approved a cash distribution to unitholders for the 2024 Quarter of $0.70 per unit (an annualized rate of $2.80 per unit), payable on August 14, 2024, to all unitholders of record as of the close of trading on August 7, 2024. The announced distribution is consistent with the cash distributions for the 2023 Quarter and Sequential Quarter.
Outlook
“For the first half of 2024, utility coal burn has been essentially flat with 2023,” commented Mr. Craft. “Since the start of this summer, cooling demand has been strong across many parts of the country driven by recent record-breaking temperatures and accelerating coal-based power generation. This is encouraging considering the very mild 2024 winter and persistently low natural gas prices. At the same time, while demand is holding up, U.S. thermal coal production has slowed significantly (Eastern U.S. production down 11% year-over-year) as utilities are relying on consuming coal from their elevated inventories to meet this demand. Weather forecasts suggest this heat wave will continue through August and an industry publication is projecting demand will exceed supply by close to 20 million tons in the second half of 2024.”
“Turning to the export markets, net back pricing for high sulfur Illinois Basin coal has declined to a level that we have decided it is prudent to slow down production for the back half of the year. Therefore, we are adjusting 2024 full-year guidance for our coal operations. At the midpoint, we now expect to sell approximately 34.0 million tons in 2024, or 2.6% below the mid-point of our original guidance for the year. Due to the increased summer burn, we now expect more than half of our uncontracted tonnage position will be sold in the domestic market.”
Mr. Craft continued, “Looking at our Oil & Gas Royalties platform, year-to-date performance and continued strong activity across our Permian Basin acreage has set the tone for another robust year. As a result, we are pleased to increase volumetric guidance across all three commodity streams within our Oil & Gas Royalties segment.”
Mr. Craft concluded, “The increase in coal-fired generation and inventory drawdown is constructive for the U.S. thermal coal market and for ARLP as we look forward to next year and beyond. We remain confident in the core fundamentals expected to drive rapid growth in electricity demand for many years to come, including the increasing power requirements stemming from AI, data centers, and the onshoring of U.S. manufacturing.”
Conference Call
A conference call regarding ARLP’s 2024 Quarter financial results is scheduled for today at 10:00 a.m. Eastern. To participate in the conference call, dial (877) 407-0784 and request to be connected to the Alliance Resource Partners, L.P. earnings conference call. International callers should dial (201) 689-8560 and request to be connected to the same call. Investors may also listen to the call via the “Investors” section of ARLP’s website at www.arlp.com .
An audio replay of the conference call will be available for approximately one week. To access the audio replay, dial U.S. Toll Free (844) 512-2921; International Toll (412) 317-6671 and request to be connected to replay using access code 13747640.
About Alliance Resource Partners, L.P.
ARLP is a diversified energy company that is currently the largest coal producer in the eastern United States, supplying reliable, affordable energy domestically and internationally to major utilities, metallurgical and industrial users. ARLP also generates operating and royalty income from mineral interests it owns in strategic coal and oil & gas producing regions in the United States. In addition, ARLP is evolving and positioning itself as a reliable energy partner for the future by pursuing opportunities that support the advancement of energy and related infrastructure.
News, unit prices and additional information about ARLP, including filings with the Securities and Exchange Commission (“SEC”), are available at www.arlp.com . For more information, contact the investor relations department of ARLP at (918) 295-7673 or via e-mail at investorrelations@arlp.com .
The statements and projections used throughout this release are based on current expectations. These statements and projections are forward-looking, and actual results may differ materially. These projections do not include the potential impact of any mergers, acquisitions or other business combinations that may occur after the date of this release. We have included more information below regarding business risks that could affect our results.
FORWARD-LOOKING STATEMENTS: With the exception of historical matters, any matters discussed in this press release are forward-looking statements that involve risks and uncertainties that could cause actual results to differ materially from projected results. Those forward-looking statements include expectations with respect to our future financial performance, coal and oil & gas consumption and expected future prices, our ability to increase unitholder distributions in future quarters, business plans and potential growth with respect to our energy and infrastructure transition investments, optimizing cash flows, reducing operating and capital expenditures, infrastructure projects at our existing properties, growth in domestic electricity demand, preserving liquidity and maintaining financial flexibility, and our future repurchases of units and senior notes, among others. These risks to our ability to achieve these outcomes include, but are not limited to, the following: decline in the coal industry’s share of electricity generation, including as a result of environmental concerns related to coal mining and combustion, the cost and perceived benefits of other sources of electricity and fuels, such as oil & gas, nuclear energy, and renewable fuels and the planned retirement of coal-fired power plants in the U.S.; our ability to provide fuel for growth in domestic energy demand, should it materialize; changes in macroeconomic and market conditions and market volatility, and the impact of such changes and volatility on our financial position; changes in global economic and geo-political conditions or changes in industries in which our customers operate; changes in commodity prices, demand and availability which could affect our operating results and cash flows; the outcome or escalation of current hostilities in Ukraine and the Israel-Gaza conflict; the severity, magnitude and duration of any future pandemics and impacts of such pandemics and of businesses’ and governments’ responses to such pandemics on our operations and personnel, and on demand for coal, oil, and natural gas, the financial condition of our customers and suppliers and operators, available liquidity and capital sources and broader economic disruptions; actions of the major oil-producing countries with respect to oil production volumes and prices could have direct and indirect impacts over the near and long term on oil & gas exploration and production operations at the properties in which we hold mineral interests; changes in competition in domestic and international coal markets and our ability to respond to such changes; potential shut-ins of production by the operators of the properties in which we hold oil & gas mineral interests due to low commodity prices or the lack of downstream demand or storage capacity; risks associated with the expansion of and investments into the infrastructure of our operations and properties; our ability to identify and complete acquisitions and to successfully integrate such acquisitions into our business and achieve the anticipated benefits therefrom; our ability to identify and invest in new energy and infrastructure transition ventures; the success of our development plans for our wholly owned subsidiary, Matrix Design Group, LLC, and our investments in emerging infrastructure and technology companies; dependence on significant customer contracts, including renewing existing contracts upon expiration; adjustments made in price, volume, or terms to existing coal supply agreements; the effects of and changes in trade, monetary and fiscal policies and laws, central bank policy actions including interest rates, bank failures and associated liquidity risks; the effects of and changes in taxes or tariffs and other trade measures adopted by the United States and foreign governments; legislation, regulations, and court decisions and interpretations thereof, both domestic and foreign, including those relating to the environment and the release of greenhouse gases, such as the Environmental Protection Agency’s recently promulgated emissions regulations for coal-fired power plants, mining, miner health and safety, hydraulic fracturing, and health care; deregulation of the electric utility industry or the effects of any adverse change in the coal industry, electric utility industry, or general economic conditions; investors’ and other stakeholders’ increasing attention to environmental, social, and governance matters; liquidity constraints, including those resulting from any future unavailability of financing; customer bankruptcies, cancellations or breaches to existing contracts, or other failures to perform; customer delays, failure to take coal under contracts or defaults in making payments; our productivity levels and margins earned on our coal sales; disruptions to oil & gas exploration and production operations at the properties in which we hold mineral interests; changes in equipment, raw material, service or labor costs or availability, including due to inflationary pressures; changes in our ability to recruit, hire and maintain labor; our ability to maintain satisfactory relations with our employees; increases in labor costs including costs of health insurance and taxes resulting from the Affordable Care Act, adverse changes in work rules, or cash payments or projections associated with workers’ compensation claims; increases in transportation costs and risk of transportation delays or interruptions; operational interruptions due to geologic, permitting, labor, weather, supply chain shortage of equipment or mine supplies, or other factors; risks associated with major mine-related accidents, mine fires, mine floods or other interruptions; results of litigation, including claims not yet asserted; foreign currency fluctuations that could adversely affect the competitiveness of our coal abroad; difficulty maintaining our surety bonds for mine reclamation as well as workers’ compensation and black lung benefits; difficulty in making accurate assumptions and projections regarding post-mine reclamation as well as pension, black lung benefits, and other post-retirement benefit liabilities; uncertainties in estimating and replacing our coal mineral reserves and resources; uncertainties in estimating and replacing our oil & gas reserves; uncertainties in the amount of oil & gas production due to the level of drilling and completion activity by the operators of our oil & gas properties; uncertainties in the future of the electric vehicle industry and the market for EV charging stations; the impact of current and potential changes to federal or state tax rules and regulations, including a loss or reduction of benefits from certain tax deductions and credits; difficulty obtaining commercial property insurance, and risks associated with our participation in the commercial insurance property program; evolving cybersecurity risks, such as those involving unauthorized access, denial-of-service attacks, malicious software, data privacy breaches by employees, insiders or others with authorized access, cyber or phishing attacks, ransomware, malware, social engineering, physical breaches, or other actions; and difficulty in making accurate assumptions and projections regarding future revenues and costs associated with equity investments in companies we do not control.
Additional information concerning these, and other factors can be found in ARLP’s public periodic filings with the SEC, including ARLP’s Annual Report on Form 10-K for the year ended December 31, 2023, filed on February 23, 2024,and ARLP’s Quarterly Report on Form 10-Q for the quarter ended March 31, 2024, filed on May 9, 2024. Except as required by applicable securities laws, ARLP does not intend to update its forward-looking statements.
TULSA, Okla.–(BUSINESS WIRE)– Alliance Resource Partners, L.P. (NASDAQ: ARLP) today announced that the Board of Directors of ARLP’s general partner (“Board of Directors”) approved a cash distribution to its unitholders for the quarter ended June 30, 2024 (the “2024 Quarter”).
ARLP unitholders of record as of the close of trading on August 7, 2024 will receive a cash distribution for the 2024 Quarter of $0.70 per unit (an annualized rate of $2.80 per unit), payable on August 14, 2024. The announced distribution is consistent with the cash distributions of $0.70 per unit for the quarters ended June 30, 2023 and March 31, 2024.
As previously announced, ARLP will report financial results for the 2024 Quarter before the market opens on Monday, July 29, 2024 and Alliance management will discuss these results during a conference call beginning at 10:00 a.m. Eastern that same day.
To participate in the conference call, dial (877) 407-0784 and request to be connected to the Alliance Resource Partners, L.P. earnings conference call. International callers should dial (201) 689-8560 and request to be connected to the same call. Investors may also listen to the call via the “Investors” section of ARLP’s website at www.arlp.com.
An audio replay of the conference call will be available for approximately one week. To access the audio replay, dial U.S. Toll Free (844) 512-2921; International Toll (412) 317-6671 and request to be connected to replay using access code 13747640.
In addition to the cash distribution for the 2024 Quarter, ARLP is announcing that John H. Robinson will retire from the Board of Directors at the end of the year.
“John has been an invaluable asset of Alliance since 1999,” said Mr. Joseph W. Craft III, Chairman, President and CEO of ARLP’s general partner. “John’s service on the Board of Directors has been instrumental to ARLP’s success since its inception and we are grateful for his thoughtful guidance over the years and wish him the best in retirement.”
Mr. Robinson has stepped down as Chairman of the Compensation Committee, but he will remain a member of the Audit, Compensation and Conflicts Committee until his retirement at the end of the year. Board of Director member Nick Carter, who is a member of the Compensation Committee, has been appointed as Chairman of such committee. In addition, Wilson M. Torrence, who is the Chairman of the Audit Committee, has been appointed as a member of the Conflicts Committee.
ARLP is also announcing that on July 24, 2024, Paul H. Vining has been elected to the Board of Directors and will serve as the board’s lead director. In such capacity, Mr. Vining will assist the Board of Directors and ARLP’s management team on planning and other initiatives as directed from time to time by the Board of Directors or Mr. Craft.
“I am pleased to welcome Paul to the ARLP team,” Mr. Craft said. “Paul’s extensive background and leadership in the natural resources mining industry brings a unique level of knowledge and experience of global energy markets to the Board of Directors. We look forward to working with Paul as lead director to continue positioning ARLP as a reliable energy provider now and into the future.”
Mr. Vining has served as Chairman of the Board of Directors of Westmoreland Mining, LLC, a privately held coal producer, since October 2019, and as Chairman of the Board of Directors of The Frazier Quarry Inc. since July 2023. From May through July 2022, Mr. Vining served as Chairman of the Board of Directors of Allegiance Coal Limited (ASX: AHQ) and from 2016 to 2019 served as a member of the Board of Directors of the general partner of then NYSE-listed Foresight Energy LP. Mr. Vining began his career in 1979 as a mineral engineer and has held a variety of senior executive positions over the years with several companies, including as Chief Executive Officer of Minerals Refining Company throughout 2022, Executive Vice President Global Investment and Development for Xcoal Energy and Resources LLC from 2019 to 2021, and Chief Executive Officer of The Cline Group, LLC from 2015 to 2019. Prior to that, Mr. Vining held senior executive positions in several major companies including as Chief Operating Officer and then President of Alpha Natural Resources, Inc., President and Chief Operating Officer of Patriot Coal Company, Chief Executive Officer of Magnum Coal Company, Chief Commercial Officer of Arch Coal Inc. and Chief Commercial Officer of Peabody Energy, Corporation. Earlier in his career, Mr. Vining held various commercial and marketing positions at Massey Energy Company, Occidental Petroleum Corp., and ENI S.p.A. Mr. Vining holds a Bachelor and a Master of Science degree in Mining and Minerals Engineering from Columbia University and a Bachelor of Science degree in Chemistry from the College of William and Mary.
In addition to news regarding the Board of Directors, ARLP is announcing that Mark A. Watson has been promoted to the role of Senior Vice President – Operations and Technology of the Partnership’s general partner.
“Please join me in congratulating Mark on his promotion to Senior Vice President,” commented Mr. Craft. “Mark has been with Alliance since starting as an intern in 1994, holds a Bachelor of Science degree and a Master of Science degree in Electrical Engineering from the University of Kentucky, and has contributed significantly to the operations side as well as the technology development side of ARLP’s business over many years. Mark’s strong leadership and expertise at our Matrix Design Group (“Matrix”) has seen Matrix expand its products and services beyond the domestic underground mining industry into the international mining and industrial markets positioning Matrix to accelerate innovation and growth at ARLP. In Mark’s expanded role he will continue to lead Matrix as well as advance other technology growth opportunities in different markets for ARLP.”
Concurrent with this announcement we are providing qualified notice to brokers and nominees that hold ARLP units on behalf of non-U.S. investors under Treasury Regulation Section 1.1446-4(b) and (d) and Treasury Regulation Section 1.1446(f)-4(c)(2)(iii). Brokers and nominees should treat one hundred percent (100%) of ARLP’s distributions to non-U.S. investors as being attributable to income that is effectively connected with a United States trade or business. In addition, brokers and nominees should treat one hundred percent (100%) of the distribution as being in excess of cumulative net income for purposes of determining the amount to withhold. Accordingly, ARLP’s distributions to non-U.S. investors are subject to federal income tax withholding at a rate equal to the highest applicable effective tax rate plus ten percent (10%). Nominees, and not ARLP, are treated as the withholding agents responsible for withholding on the distributions received by them on behalf of non-U.S. investors.
About Alliance Resource Partners, L.P.
ARLP is a diversified energy company that is currently the largest coal producer in the eastern United States, supplying reliable, affordable energy domestically and internationally to major utilities, metallurgical and industrial users. ARLP also generates operating and royalty income from mineral interests it owns in strategic coal and oil & gas producing regions in the United States. In addition, ARLP is evolving and positioning itself as a reliable energy partner for the future by pursuing opportunities that support the advancement of energy and related infrastructure.
News, unit prices and additional information about ARLP, including filings with the Securities and Exchange Commission (“SEC”), are available at www.arlp.com. For more information, contact the investor relations department of ARLP at (918) 295-7673 or via e-mail at investorrelations@arlp.com.
Investor Relations Contact
Cary P. Marshall Senior Vice President and Chief Financial Officer 918-295-7673 investorrelations@arlp.com
Mark Reichman, Managing Director, Equity Research Analyst, Natural Resources, Noble Capital Markets, Inc.
Refer to the full report for the price target, fundamental analysis, and rating.
Augmenting the leadership team. Effective immediately, Maple Gold Mines Ltd. appointed Mr. Darwin Green, P. Geo., to its Board of Directors. Mr. Ian Cunningham-Dunlop, P. Eng., has been appointed Vice President, Technical Services effective on or before August 1, 2024. Both have impressive credentials which are summarized in the body of this note. As Mr. Kiran Patankar, CEO, has taken quick actions to reposition the company for successful outcomes, Mr. Green and Mr. Cunningham-Dunlop will strengthen the company’s ability to execute. Maple’s Chief Geologist and Engineer will report to Mr. Cunningham-Dunlop.
Upcoming events. We expect the company to hold a meeting of its Board of Directors ahead of releasing its second quarter financial results to the market in early August. On September 9, the company will host its annual meeting of shareholders at which time Maple Gold shareholders will vote on the recent joint venture restructuring transaction with Agnico Eagle Mines Limited (NYSE: AEM). Maple is also expected to provide a more detailed exploration update and plan later in the year prior to commencement of the company’s drilling program.
Equity Research is available at no cost to Registered users of Channelchek. Not a Member? Click ‘Join’ to join the Channelchek Community. There is no cost to register, and we never collect credit card information.
This Company Sponsored Research is provided by Noble Capital Markets, Inc., a FINRA and S.E.C. registered broker-dealer (B/D).
*Analyst certification and important disclosures included in the full report. NOTE: investment decisions should not be based upon the content of this research summary. Proper due diligence is required before making any investment decision.
July 23, 2024 – Vancouver, Canada – Century Lithium Corp. (TSXV:LCE) (OTCQX: CYDVF) (Frankfurt: C1Z)
Century Lithium (or the Company) announces it has changed the name of its 100%-owned Clayton Valley Lithium Project in Nevada, USA to the Angel Island Mine (the Project). In April 2024, the Company announced a positive Feasibility Study for the Project, making it one of the few advanced lithium projects being developed in the United States. As the Company now continues to work towards permitting the Project, regulators encouraged a name change for clarity in the permitting process. The Angel Island name distinguishes it from other mining and energy projects in the area by using the name of a topographical feature from the Project.
ABOUT ANGEL ISLAND
Angel Island is named for the ridge of older metavolcanic and clastic rocks bordering the west side of Century’s lithium clay deposit. The name itself dates to the 1800’s, one of three landforms in Clayton Valley named for islands in San Francisco Bay (Alcatraz and Goat islands being the other two). Of the three landforms, Angel Island is the largest, rising to a height 400 meters above the valley floor. Its presence on the east side of the valley, separating Century’s lithium clay deposit from the lithium brine operation of Albemarle Corp., is owed to uplift along a major northeast trending normal fault located along the western base of the ridge. Although not directly related to the formation of Century’s deposit, uplift of Angel Island along this fault was responsible for elevating the clay deposits east of the fault and bringing them to the surface where they are now accessible for mining. The harder rocks in the ridge also likely acted as a physical barrier protecting Century’s lithium clay deposit from erosion.
ABOUT CENTURY LITHIUM CORP.
Century Lithium Corp. is an advanced stage lithium company, focused on developing its 100%-owned Angel Island Mine in west-central Nevada, USA. Century Lithium recently completed a Feasibility Study on the Project and is currently in the permitting stage, with the goal of becoming a domestic producer of lithium for the growing electric vehicle and battery storage market.
ON BEHALF OF CENTURY LITHIUM CORP. WILLIAM WILLOUGHBY, PhD., PE President & Chief Executive Officer
NEITHER THE TSX VENTURE EXCHANGE NOR ITS REGULATION SERVICES PROVIDER ACCEPTS RESPONSIBILITY FOR THE ADEQUACY OR ACCURACY OF THE CONTENT OF THIS NEWS RELEASE.
This release contains certain forward-looking statements within the meaning of applicable Canadian securities legislation. In certain cases, forward-looking statements can be identified by the use of words such as “plans”, “expects” or “does not anticipate”, or “believes”, or variations of such words and phrases or statements that certain actions, events or results “may”, “could”, “would”, “might” or “will be taken”, “occur” or “be achieved” and similar expressions suggesting future outcomes or statements regarding an outlook.
Forward-looking statements relate to any matters that are not historical facts and statements of our beliefs, intentions and expectations about developments, results and events which will or may occur in the future, without limitation, statements with respect to the potential development and value of the Project and benefits associated therewith, statements with respect to the expected project economics for the Project, such as estimates of life of mine, lithium prices, production and recoveries, capital and operating costs, IRR, NPV and cash flows, any projections outlined in the Feasibility Study in respect of the Project, the permitting status of the Project and the Company’s future development plans.
These and other forward-looking statements and information are subject to various known and unknown risks and uncertainties, many of which are beyond the ability of the Company to control or predict, that may cause their actual results, performance or achievements to be materially different from those expressed or implied thereby, and are developed based on assumptions about such risks, uncertainties and other factors set out herein.These risks include those described under the heading “Risk Factors” in the Company’s most recent annual information form and its other public filings, copies of which can be under the Company’s profile at www.sedarplus.com. The Company expressly disclaims any obligation to update-forward-looking information except as required by applicable law. No forward-looking statement can be guaranteed, and actual future results may vary materially. Accordingly, readers are advised not to place reliance on forward-looking statements or information. Furthermore, Mineral Resources that are not Mineral Reserves do not have demonstrated economic viability.
Vancouver, British Columbia–(Newsfile Corp. – July 23, 2024) – Maple Gold Mines Ltd. (TSXV: MGM) (OTCQB: MGMLF) (FSE: M3G) (“Maple Gold” or the “Company“) is pleased to announce the appointments of Mr. Darwin Green, P.Geo. to its Board of Directors, effective immediately, and Mr. Ian Cunningham-Dunlop, P.Eng. to the position of Vice President, Technical Services, effective on or before August 1, 2024. Mr. Green is a veteran mining entrepreneur and professional geologist with a passion for discovery and value creation. Mr. Cunningham-Dunlop is a senior mining executive and professional engineer with over 40 years of diversified experience in domestic/international mineral exploration and advanced project development.
“We are thrilled to have attracted executives of Mr. Green’s and Mr. Cunningham-Dunlop’s caliber to help drive the Company’s next phase of growth,” stated Kiran Patankar, President and CEO of Maple Gold. “These key appointments further enhance the technical, capital markets and corporate governance expertise of our senior leadership team as we continue to transform into a premier Canadian gold exploration and development company. Their endorsement of Maple Gold speaks to the resource expansion, discovery and development potential of our district-scale gold projects in Québec.”
Darwin Green, P.Geo. – Director
Darwin Green, P.Geo. has over 30 years of experience in the minerals mining industry and brings significant industry, corporate and technical knowledge to the Company. He currently serves on the boards of NYSE-listed Contango ORE, Inc., TSX Venture Exchange-listed Onyx Gold Corp. and Evergold Corp., and as a Technical Advisor to other junior mining companies. Mr. Green previously served as Founder, Director, President and Chief Executive Officer of HighGold Mining Inc. from August 2019 until its recent acquisition by Contango ORE in July 2024 and has served as Founder and Executive Chairman of Onyx Gold since July 2023. Between November 2008 and December 2019, he served as the Vice President Exploration for Constantine Metal Resources Ltd. and prior to that, Mr. Green oversaw exploration and underground development programs at the Niblack (Cu-Au-Zn-Ag) deposit in Alaska, for which he received the Commissioner’s Award for Project Excellence by the State of Alaska. Mr. Green holds a B.Sc. from the University of British Columbia and an M.Sc. in Economic Geology from Carleton University.
Ian Cunningham Dunlop, P.Eng. – Vice President, Technical Services
Ian Cunningham-Dunlop, P.Eng. has a proven discovery track record and an excellent familiarity with Archean lode gold systems from work throughout Ontario, Québec, and West Africa. He currently serves as Executive Vice President with Onyx Gold and his extensive exploration and project management experience also includes HighGold Mining’s Johnson Tract (Au-Zn-Cu-Ag-Pb) project in Alaska, NewCastle Gold’s Castle Mountain gold project in California, True Gold Mining’s Karma gold mine in Burkina Faso, Fronteer Gold’s Long Canyon gold mine in Nevada and Agi Dagi/Kirazli/Halilaga/TV Tower gold and gold-copper projects in Turkey, and Aurora Energy’s Michelin uranium deposit in Labrador. Mr. Cunningham-Dunlop also led the exploration team at Homestake Mining’s/Barrick Gold’s Eskay Creek (Au-Ag-Cu-Pb-Zn) mine in British Columbia from 1997-2003 where he was awarded the B.C. & Yukon Chamber of Mines E.A. Scholz Award in October 2003 for “Outstanding Contribution to a Mining Development Project in B.C. and the Yukon”. He holds a B.Sc. in Geological Engineering from Queen’s University and is a Qualified Person under NI43-101.
Stock Option Issuance
The Company’s Board of Directors has approved the grant of stock options (“Options”) to purchase an aggregate of 1,075,000 common shares of the Company (each, a “Common Share”), with an exercise price of $0.085 per Common Share to certain employees, officers, directors and consultants. Once vested, each Option is exercisable into one Common Share for a period of five years from the grant date. The Company’s Equity Incentive Plan (the “Plan”) governs these Options, as well as the terms and conditions of their exercise, which is in accordance with policies of the TSX Venture Exchange. Further details regarding the Plan are set out in the Company’s Management Information Circular filed on May 15, 2023, which is available on SEDAR+.
About Maple Gold
Maple Gold Mines Ltd. is a Canadian advanced exploration company focused on advancing the district-scale Douay and Joutel gold projects located in Québec’s prolific Abitibi Greenstone Gold Belt. The projects benefit from exceptional infrastructure access and boast ~400 km2 of highly prospective ground including an established gold mineral resource at Douay with significant expansion potential as well as the past-producing Telbel and Eagle West mines at Joutel. In addition, the Company holds an exclusive option to acquire 100% of the Eagle Mine Property, a key part of the historical Joutel mining complex.
The district-scale property package also hosts a significant number of regional exploration targets along a 55-km strike length of the Casa Berardi Deformation Zone that have yet to be tested through drilling, making the project ripe for new gold and polymetallic discoveries. The Company is currently focused on carrying out exploration and drill programs to grow mineral resources and make new discoveries to establish an exciting new gold district in the heart of the Abitibi. For more information, please visit www.maplegoldmines.com.
NEITHER THE TSX VENTURE EXCHANGE NOR ITS REGULATION SERVICES PROVIDER (AS THAT TERM IS DEFINED IN THE POLICIES OF THE TSX VENTURE EXCHANGE) ACCEPTS RESPONSIBILITY FOR THE ADEQUACY OR ACCURACY OF THIS PRESS RELEASE.
Forward Looking Statements and Cautionary Notes:
This news release contains “forward-looking information” and “forward-looking statements” (collectively referred to as “forward-looking statements”) within the meaning of applicable Canadian securities legislation in Canada. Forward-looking statements are statements that are not historical facts; they are generally, but not always, identified by the words “expects,” “plans,” “anticipates,” “believes,” “intends,” “estimates,” “projects,” “aims,” “potential,” “goal,” “objective,”, “strategy”, “prospective,” and similar expressions, or that events or conditions “will,” “would,” “may,” “can,” “could” or “should” occur, or are those statements, which, by their nature, refer to future events. Forward-looking statements in this news release include, but are not limited to, statements about the resource expansion and discovery potential across the Company’s gold projects, and its intention to pursue such potential, and the Company’s exploration work and results from current and future work programs. Although the Company believes that forward-looking statements in this news release are reasonable, it can give no assurance that such expectations will prove to be correct, as forward-looking statements are based on assumptions, uncertainties and management’s best estimate of future events on the date the statements are made and involve a number of risks and uncertainties. Consequently, actual events or results could differ materially from the Company’s expectations and projections, and readers are cautioned not to place undue reliance on forward-looking statements. For a more detailed discussion of additional risks and other factors that could cause actual results to differ materially from those expressed or implied by forward-looking statements in this news release, please refer to the Company’s filings with Canadian securities regulators available on the System for Electronic Document Analysis and Retrieval Plus (SEDAR+) at www.sedarplus.ca or the Company’s website at www.maplegoldmines.com. Except to the extent required by applicable securities laws and/or the policies of the TSX Venture Exchange, the Company undertakes no obligation to, and expressly disclaims any intention to, update or revise any forward-looking statements whether as a result of new information, future events or otherwise.
Australia’s Woodside Energy has taken the energy sector by surprise, announcing its acquisition of Tellurian for $1.2 billion, staking its claim on the ambitious yet troubled Driftwood LNG project in Louisiana. This transaction marks a significant departure from Woodside’s traditionally conservative approach, signaling a dramatic shift in its global LNG strategy.
The Driftwood project, long considered one of the most challenging prospects in the U.S. LNG sector, has struggled to gain traction despite years of development efforts. Tellurian’s inability to secure long-term off-take agreements has been a persistent obstacle, leaving many industry analysts skeptical about the project’s viability. Woodside’s decision to take on this challenge represents a calculated risk that could potentially reshape the company’s position in the global energy market.
Woodside CEO Meg O’Neill has framed this acquisition as a strategic move to establish the company as an “LNG powerhouse.” However, this ambitious goal comes at a time when the energy industry is navigating complex transitions, with increasing pressure to reduce carbon emissions and pivot towards renewable sources. Woodside’s substantial investment in LNG infrastructure appears to run counter to these trends, raising questions about the long-term wisdom of such a commitment.
Perhaps the most intriguing aspect of this deal is Woodside’s proposed departure from the traditional U.S. LNG business model. Rather than adopting the typical tolling approach, where LNG facilities essentially function as processing units for natural gas, Woodside intends to implement a fully integrated strategy. This would encompass control from the wellhead to the final point of sale, potentially allowing for greater flexibility and profitability, but also introducing additional complexities and risks.
The timing of this acquisition is particularly noteworthy. With Europe actively diversifying its energy sources away from Russian gas and Asian demand for LNG continuing to grow, Woodside is positioning itself to capitalize on these market dynamics. However, the Driftwood project’s extended development timeline means that Woodside may miss out on the current favorable market conditions, potentially facing a different landscape upon project completion.
Woodside’s strategy to mitigate risk by bringing in partners and reducing its equity stake to around 50% is prudent, but may prove challenging. The project’s history of struggling to secure long-term commitments suggests that finding willing investors could be an uphill battle, even with Woodside’s involvement.
This transaction has the potential to be transformative for both Woodside and the broader LNG industry. If successful, it could catapult Woodside into the upper echelons of global LNG producers, surpassing even some of the oil and gas majors. However, the risks are substantial, and the execution of this strategy will be closely watched by industry observers and competitors alike.
Ultimately, Woodside’s acquisition of Tellurian and the Driftwood LNG project represents a high-stakes wager on the future of natural gas in the global energy mix. As the world grapples with the complexities of energy transition, Woodside’s bold move could either position them at the forefront of the LNG market or serve as a cautionary tale of misplaced optimism in a rapidly evolving industry.
As this ambitious project unfolds, it will undoubtedly provide valuable insights into the future direction of the LNG sector and the role of natural gas in the broader energy landscape. The industry will be watching closely to see if Woodside’s gambit pays off in this high-risk, high-reward venture.