BRENTWOOD, Tenn., June 10, 2025 (GLOBE NEWSWIRE) — CoreCivic, Inc. (NYSE: CXW) (“CoreCivic”) announced today that it has entered into a definitive agreement to acquire the Farmville Detention Center, a 736-bed facility constructed in 2010 and located in Farmville, Virginia. The transaction is expected to be consummated through the acquisition of 100% of the membership interests in entities that own the facility. Farmville Detention Center provides transportation, care, and civil detention services to adult male noncitizens through an Intergovernmental Service Agreement between Prince Edward County, Virginia and U.S. Immigration & Customs Enforcement (“ICE”), which expires in March 2029.
The total purchase price, amounting to $67.0 million, is expected to be funded with cash on hand and borrowing capacity under CoreCivic’s revolving bank credit facility. The acquisition, which is subject to the satisfaction of customary closing conditions, is expected to close effective July 1, 2025, and result in total annual incremental revenue of approximately $40.0 million.
Damon T. Hininger, CoreCivic’s Chief Executive Officer, commented, “We are pleased to expand our immigration solutions with this critical location, which ICE has used for many years — a need we expect to continue for the foreseeable future.” Patrick D. Swindle, CoreCivic’s President and Chief Operating Officer, added “We look forward to assuming the operation at this location, and welcoming more than 200 new employees to the CoreCivic team.”
About CoreCivic
CoreCivic is a diversified, government-solutions company with the scale and experience needed to solve tough government challenges in flexible, cost-effective ways. We provide a broad range of solutions to government partners that serve the public good through high-quality corrections and detention management, a network of residential and non-residential alternatives to incarceration to help address America’s recidivism crisis, and government real estate solutions. We are the nation’s largest owner of partnership correctional, detention and residential reentry facilities, and one of the largest operators of such facilities in the United States. We have been a flexible and dependable partner for government for more than 40 years. Our employees are driven by a deep sense of service, high standards of professionalism and a responsibility to help government better the public good. Learn more at www.corecivic.com.
This press release includes statements as to our beliefs and expectations of the outcome of future events that are forward-looking statements within the meaning of Section 21E of the Securities Exchange Act of 1934, as amended, and the Private Securities Litigation Reform Act of 1995, as amended. These forward-looking statements may include such words as “anticipate,” “estimate,” “expect,” “project,” “plan,” “intend,” “believe,” “may,” “will,” “should,” “can have,” “likely,” and other words and terms of similar meaning in connection with any discussion of the timing or nature of future operating or financial performance or other events. Such forward-looking statements may be affected by risks and uncertainties in CoreCivic’s business and market conditions. These forward-looking statements are subject to risks and uncertainties that could cause actual results to differ materially from the statements made. Important factors that could cause actual results to differ are described in the filings made from time to time by CoreCivic with the Securities and Exchange Commission (“SEC”) and include the risk factors described in CoreCivic’s Annual Report on Form 10-K for the fiscal year ended December 31, 2024, filed with the SEC on February 21, 2025. Except as required by applicable law, CoreCivic undertakes no obligation to update forward-looking statements made by it to reflect events or circumstances occurring after the date hereof or the occurrence of unanticipated events.
Contact:
Investors: David Garfinkle – Chief Financial Officer – (615) 263-3008
Media: Steve Owen – Vice President, Communications – (615) 263-3107
BOCA RATON, Fla.–(BUSINESS WIRE)–Jun. 10, 2025– The GEO Group, Inc. (NYSE: GEO) (“GEO” or the “Company”) announced today that the U.S. District Court, Central District of California (the “Court”) has approved a settlement in the case of Roman v. Wolf, which allows for immediate full intake at the GEO-owned, 1,940-bed Adelanto ICE Processing Center in California (the “Adelanto Center”).
The Court had previously issued several injunction orders, including an intake prohibition order issued more than four years ago, limiting the use of the Adelanto Center based on then-prevailing COVID-19 conditions.
At full occupancy, the Adelanto Center contract would be expected to generate up to approximately $31 million in additional incremental annualized revenues for GEO, with margins consistent with GEO’s company-owned Secure Services facilities.
ICE and GEO entered into a 15-year contract on December 19, 2019, for the provision of secure residential housing and support services at the Adelanto Center, consisting of a five-year base period followed by two five-year option periods. The current contract option period is effective through December 19, 2029.
George C. Zoley, Executive Chairman of GEO, said, “We believe the Adelanto Center plays an important role in helping ICE and the U.S. Department of Homeland Security fulfill their mission and operational priorities. We are proud of our approximately 350 employees at the Adelanto Center, whose dedication and professionalism have allowed GEO to establish a long-standing record of providing high-quality support services on behalf of ICE in the state of California.”
About The GEO Group
The GEO Group, Inc. (NYSE: GEO) is a leading diversified government service provider, specializing in design, financing, development, and support services for secure facilities, processing centers, and community reentry centers in the United States, Australia, South Africa, and the United Kingdom. GEO’s diversified services include enhanced in-custody rehabilitation and post-release support through the award-winning GEO Continuum of Care®, secure transportation, electronic monitoring, community-based programs, and correctional health and mental health care. GEO’s worldwide operations include the ownership and/or delivery of support services for 98 facilities totaling approximately 77,000 beds, including idle facilities and projects under development, with a workforce of up to approximately 18,000 employees.
Use of forward-looking statements
This news release may contain “forward-looking statements” within the meaning of Section 21E of the Securities Exchange Act of 1934, as amended, and the U.S. Private Securities Litigation Reform Act of 1995. Readers are cautioned not to place undue reliance on these forward-looking statements and any such forward-looking statements are qualified in their entirety by reference to the cautionary statements and risk factors contained in GEO’s filings with the U.S. Securities and Exchange Commission including its Form 10-K, 10-Q and 8-K reports. All forward-looking statements speak only as of the date of this news release and are based on current expectations and involve a number of assumptions, risks and uncertainties that could cause the actual results to differ materially from such forward-looking statements. Readers are strongly encouraged to read the full cautionary statements and risk factors contained in GEO’s filings with the U.S. Securities and Exchange Commission, including those referenced above. GEO disclaims any obligation to update or revise any forward-looking statements, except as required by law.
BOCA RATON, Fla.–(BUSINESS WIRE)–Jun. 9, 2025– The GEO Group, Inc. (NYSE: GEO) (“GEO” or the “Company”) announced today that U.S. Immigration and Customs Enforcement (“ICE”) has executed a contract modification, effective June 6, 2025, to activate a federal immigration processing center at the GEO-owned, 1,868-bed D. Ray James Facility (the “Facility”) in Folkston, Georgia under the existing intergovernmental service agreement (“IGSA”) involving the GEO-owned, 1,118-bed Folkston ICE Processing Center.
Under the modified IGSA, GEO expects to generate approximately $66 million in incremental annualized revenues in the first full year of operations, with margins consistent with GEO’s company-owned Secure Services facilities. GEO’s support services will include the exclusive use of this federal facility by ICE, along with security, maintenance, and food services, as well as access to recreational amenities, medical care, and legal counsel.
George C. Zoley, Executive Chairman of GEO, said, “We expect that our company-owned D. Ray James Facility in Georgia will play an important role in helping meet the need for increased federal immigration processing center bedspace. We are proud of our 40-year public-private partnership with ICE, and we stand ready to continue to help the federal government meet its expanded immigration enforcement priorities.”
About The GEO Group
The GEO Group, Inc. (NYSE: GEO) is a leading diversified government service provider, specializing in design, financing, development, and support services for secure facilities, processing centers, and community reentry centers in the United States, Australia, South Africa, and the United Kingdom. GEO’s diversified services include enhanced in-custody rehabilitation and post-release support through the award-winning GEO Continuum of Care®, secure transportation, electronic monitoring, community-based programs, and correctional health and mental health care. GEO’s worldwide operations include the ownership and/or delivery of support services for 98 facilities totaling approximately 77,000 beds, including idle facilities and projects under development, with a workforce of up to approximately 18,000 employees.
Use of forward-looking statements
This news release may contain “forward-looking statements” within the meaning of Section 21E of the Securities Exchange Act of 1934, as amended, and the U.S. Private Securities Litigation Reform Act of 1995. Readers are cautioned not to place undue reliance on these forward-looking statements and any such forward-looking statements are qualified in their entirety by reference to the cautionary statements and risk factors contained in GEO’s filings with the U.S. Securities and Exchange Commission including its Form 10-K, 10-Q and 8-K reports. All forward-looking statements speak only as of the date of this news release and are based on current expectations and involve a number of assumptions, risks and uncertainties that could cause the actual results to differ materially from such forward-looking statements. Readers are strongly encouraged to read the full cautionary statements and risk factors contained in GEO’s filings with the U.S. Securities and Exchange Commission, including those referenced above. GEO disclaims any obligation to update or revise any forward-looking statements, except as required by law.
Earnings Release Scheduled for Wednesday, May 7, 2025 Before the Market Opens
Conference Call Scheduled for Wednesday, May 7, 2025 at 11:00 AM (Eastern Time)
BOCA RATON, Fla.–(BUSINESS WIRE)–Apr. 23, 2025– The GEO Group, Inc. (NYSE:GEO) (“GEO”) will release its first quarter 2025 financial results on Wednesday, May 7, 2025 before the market opens. GEO has scheduled a conference call and simultaneous webcast for 11:00 AM (Eastern Time) on Wednesday, May 7, 2025.
Hosting the call for GEO will be George Zoley, Executive Chairman of the Board, J. David Donahue, Chief Executive Officer, and Mark Suchinski, Chief Financial Officer.
To participate in the teleconference, please contact one of the following numbers 5 minutes prior to the scheduled start time:
In addition, a live audio webcast of the conference call may be accessed on the Webcasts section of GEO’s investor relations home page at investors.geogroup.com. A webcast replay will remain available on the website for one year.
A telephonic replay will also be available through May 14, 2025. The replay numbers are 1-877-344-7529 (U.S.) and 1-412-317-0088 (International). The passcode for the telephonic replay is 7721870. If you have any questions, please contact GEO at 1-866-301-4436.
Joe Gomes, Managing Director, Equity Research Analyst, Generalist , Noble Capital Markets, Inc.
Refer to the bottom of the report for important disclosures
Emergency Funding. On Tuesday, the Department of Homeland Security submitted on SAM.gov for an emergency detention and related services strategic sourcing vehicle to bring an additional allotment of detention beds online nationwide, in compliance with the President’s Declaration of a National Emergency at the Southern Border of the United States and related Executive Orders. The maximum ceiling value of the vehicle is $45 billion.
Details. Under the RFP, the government anticipates making multiple indefinite delivery/indefinite quantity (IDIQ) contract awards. It appears the contract will have a two-year period of performance, from April 14, 2025, through April 13, 2027. Responses are due by April 4th. Under the scope of work, the vendor may be required to provide infrastructure, staffing, services, and/or supplies necessary to provide safe and secure confinement for aliens in the administrative custody of ICE. Ground transportation services may also be required.
Current ICE Population. ICE populations have increased significantly under the new Administration. ADP during the month of October was 38,714, which rose to 40,205 for the month of January. ADP for March 1 through March 22nd was 47,304, while the population on that date was 47,892, according to ICE. There has not yet been a significant change in ATD populations.
Implications. Given the timelines involved and the scope of work required, this ID/IQ would seem to favor the abilities of both CoreCivic and GEO, given their history in the sector and the number of idle facilities that can be brought back online. ICE’s budget in 2024 was $9.7 billion, with about $3.3 billion dedicated to Enforcement and Removal Operations, so a new max of $45 billion is a major jump. If these types of funds are put to use in a timely manner, the current financial projections for both CoreCivic and GEO would prove conservative, in our view.
Research reports on companies mentioned in this report are available by clicking below:
All statements or opinions contained herein that include the words “we”, “us”, or “our” are solely the responsibility of Noble Capital Markets, Inc.(“Noble”) and do not necessarily reflect statements or opinions expressed by any person or party affiliated with the company mentioned in this report. Any opinions expressed herein are subject to change without notice. All information provided herein is based on public and non-public information believed to be accurate and reliable, but is not necessarily complete and cannot be guaranteed. No judgment is hereby expressed or should be implied as to the suitability of any security described herein for any specific investor or any specific investment portfolio. The decision to undertake any investment regarding the security mentioned herein should be made by each reader of this publication based on its own appraisal of the implications and risks of such decision.
This publication is intended for information purposes only and shall not constitute an offer to buy/sell or the solicitation of an offer to buy/sell any security mentioned in this report, nor shall there be any sale of the security herein in any state or domicile in which said offer, solicitation or sale would be unlawful prior to registration or qualification under the securities laws of any such state or domicile. This publication and all information, comments, statements or opinions contained or expressed herein are applicable only as of the date of this publication and subject to change without prior notice. Past performance is not indicative of future results. Noble accepts no liability for loss arising from the use of the material in this report, except that this exclusion of liability does not apply to the extent that such liability arises under specific statutes or regulations applicable to Noble. This report is not to be relied upon as a substitute for the exercising of independent judgement. Noble may have published, and may in the future publish, other research reports that are inconsistent with, and reach different conclusions from, the information provided in this report. Noble is under no obligation to bring to the attention of any recipient of this report, any past or future reports. Investors should only consider this report as single factor in making an investment decision.
IMPORTANT DISCLOSURES
This publication is confidential for the information of the addressee only and may not be reproduced in whole or in part, copies circulated, or discussed to another party, without the written consent of Noble Capital Markets, Inc. (“Noble”). Noble seeks to update its research as appropriate, but may be unable to do so based upon various regulatory constraints. Research reports are not published at regular intervals; publication times and dates are based upon the analyst’s judgement. Noble professionals including traders, salespeople and investment bankers may provide written or oral market commentary, or discuss trading strategies to Noble clients and the Noble proprietary trading desk that reflect opinions that are contrary to the opinions expressed in this research report. The majority of companies that Noble follows are emerging growth companies. Securities in these companies involve a higher degree of risk and more volatility than the securities of more established companies. The securities discussed in Noble research reports may not be suitable for some investors and as such, investors must take extra care and make their own determination of the appropriateness of an investment based upon risk tolerance, investment objectives and financial status.
Company Specific Disclosures
The following disclosures relate to relationships between Noble and the company (the “Company”) covered by the Noble Research Division and referred to in this research report. Noble is not a market maker in any of the companies mentioned in this report. Noble intends to seek compensation for investment banking services and non-investment banking services (securities and non-securities related) with any or all of the companies mentioned in this report within the next 3 months
ANALYST CREDENTIALS, PROFESSIONAL DESIGNATIONS, AND EXPERIENCE
Senior Equity Analyst focusing on Basic Materials & Mining. 20 years of experience in equity research. BA in Business Administration from Westminster College. MBA with a Finance concentration from the University of Missouri. MA in International Affairs from Washington University in St. Louis. Named WSJ ‘Best on the Street’ Analyst and Forbes/StarMine’s “Best Brokerage Analyst.” FINRA licenses 7, 24, 63, 87
WARNING
This report is intended to provide general securities advice, and does not purport to make any recommendation that any securities transaction is appropriate for any recipient particular investment objectives, financial situation or particular needs. Prior to making any investment decision, recipients should assess, or seek advice from their advisors, on whether any relevant part of this report is appropriate to their individual circumstances. If a recipient was referred to Noble Capital Markets, Inc. by an investment advisor, that advisor may receive a benefit in respect of transactions effected on the recipients behalf, details of which will be available on request in regard to a transaction that involves a personalized securities recommendation. Additional risks associated with the security mentioned in this report that might impede achievement of the target can be found in its initial report issued by Noble Capital Markets, Inc.. This report may not be reproduced, distributed or published for any purpose unless authorized by Noble Capital Markets, Inc..
RESEARCH ANALYST CERTIFICATION
Independence Of View All views expressed in this report accurately reflect my personal views about the subject securities or issuers.
Receipt of Compensation No part of my compensation was, is, or will be directly or indirectly related to any specific recommendations or views expressed in the public appearance and/or research report.
Ownership and Material Conflicts of Interest Neither I nor anybody in my household has a financial interest in the securities of the subject company or any other company mentioned in this report.
BRENTWOOD, Tenn., March 07, 2025 (GLOBE NEWSWIRE) — CoreCivic, Inc. (NYSE: CXW) (CoreCivic or the Company) announced today that, effective March 17, 2025, Dawn Smith, Stacey Tank, and Nina Tran will be appointed as independent members of the Company’s Board of Directors (the Board), expanding the Board from eleven to fourteen directors, thirteen of whom have been determined by the Board to be independent. CoreCivic’s new board members are expected to join various board committees in the future.
Additionally, on March 7, 2025, Robert Dennis notified the Company of his intent not to stand for re-election as a member of the Board at the Company’s 2025 Annual Meeting of Stockholders (the Annual Meeting). The Company previously announced on February 27, 2025, that Anne L. Mariucci also notified the Company of her intent not to stand for re-election as a member of the Board at the Annual Meeting. Ms. Mariucci and Mr. Dennis will serve their remaining terms and will resign from the Board, including from service on the Board’s various committees, at the Annual Meeting. The size of the Board will be reduced to twelve at the Annual Meeting.
“We are excited to have Dawn, Stacey, and Nina join our Board,” said Damon Hininger, CoreCivic’s Chief Executive Officer. “Each brings unique skills and vision to our Board. Dawn has a deep background in corporate law, operational leadership and information technology. Stacey holds executive leadership positions in both commercial and non-profit entities, and has leadership experience at large publicly-traded companies. Nina brings decades of financial and accounting expertise and executive leadership with a focus on real estate.”
“We are also extremely grateful for the valuable contributions and long service of our board members, Anne Mariucci and Bob Dennis, who have been on CoreCivic’s board for 13 years and 12 years, respectively. We believe the Company truly is better for their counsel through many transformational years, and we wish them well.”
S. Dawn Smith, 61, serves as President of Cologix, Inc. (Cologix) since August 2018 and was formerly its President and Chief Operating Officer. At Cologix, she has responsibility for driving all aspects of design, construction, engineering, and operations of the firm’s extensive infrastructure of secure, hyperscale edge data center sites and solutions. Additionally, Ms. Smith is responsible for the IT, legal, HR and procurement functions at Cologix. She previously served as the executive vice president and chief legal officer of McAfee, where she led the legal and government relations organization globally. Prior to McAfee, Ms. Smith was the senior vice president and chief legal officer at VMware. She previously served in legal advisory roles at Wilson Sonsini Goodrich & Rosati and as a partner at Morrison & Foerster LLP, where she practiced for nearly a decade in corporate and securities law, including mergers and acquisitions, public company corporate governance, compliance, and venture capital transactions. Also, Ms. Smith served in the U.S. Navy’s nuclear propulsion program which manages the design, construction, and operation of nuclear-powered ships and facilities. She currently serves on the board of directors of Health Catalyst, Inc. Ms. Smith holds a B.S. from the U.S. Naval Academy, an M.B.A. from Providence College, and a J.D. from Stanford Law School.
Stacey Tank, 43, currently serves as Chief Executive Officer of Bespoke Beauty Brands, a role she has held since September 2023. Additionally, Ms. Tank is a Board Member at Interior Logic Group, Inc., where she serves on the Audit and Compliance committees. Previously, Ms. Tank served as Chief Transformation Officer of the Heineken Company and at The Home Depot, her responsibilities included leading the multi-billion-dollar Home Depot Installation Services and Home Depot Measurement Services businesses. She also served as President of The Home Depot Foundation. Ms. Tank is the Founder and CEO of Our Happy Place, a non-profit focused on childhood mental wellness. Ms. Tank is a fellow at the Aspen Institute and the World Economic Forum and holds a Bachelor of Science in Marketing Management and Television-Radio-Film from Syracuse University.
Nina A. Tran, 56, currently serves as a board member of American Asset Trust, a publicly-traded real estate investment trust (REIT) where she also serves on the Audit and Corporate Governance and Nominations Committee. Ms. Tran also currently serves as a director and is the audit committee chairperson of both Compass Datacenters and Catalyst Impact Fund. Currently, Ms. Tran is an advisor to Roofstock, Inc., a leading proptech platform for single-family rental investors. From March 2021 until December 2022, Ms. Tran served as the chief financial officer for Pacaso, a real estate technology company focused on second home co-ownership. From 2016 to 2021, Ms. Tran was the chief financial officer at Veritas Investments, Inc., an owner and manager of mixed-use real estate properties. From 2013 to 2016, Ms. Tran served as the chief financial officer of Starwood Waypoint Residential Trust, a leading publicly-traded REIT that owns and operates single-family rental homes. Prior to joining Starwood Waypoint, Ms. Tran spent 18 years at Prologis, Inc., the largest publicly-traded global industrial REIT. Ms. Tran served as senior vice president and chief accounting officer, and most recently as chief global process officer, where she helped lead the merger integration between AMB and Prologis. Prior to Prologis, Ms. Tran was a senior associate with PricewaterhouseCoopers. From 2016 to 2024, Ms. Tran served on the board of directors and was the audit committee chairperson of Apartment Income REIT before the company was taken private. Ms. Tran also previously served on the advisory board of the Asian Pacific Fund. Ms. Tran holds a Bachelor of Science degree in Accounting at California State University East Bay.
About CoreCivic
CoreCivic is a diversified, government-solutions company with the scale and experience needed to solve tough government challenges in flexible, cost-effective ways. We provide a broad range of solutions to government partners that serve the public good through high-quality corrections and detention management, a network of residential and non-residential alternatives to incarceration to help address America’s recidivism crisis, and government real estate solutions. We are the nation’s largest owner of partnership correctional, detention and residential reentry facilities, and believe we are the largest private owner of real estate used by government agencies in the United States. We have been a flexible and dependable partner for government for more than 40 years. Our employees are driven by a deep sense of service, high standards of professionalism and a responsibility to help government better the public good. Learn more at www.corecivic.com.
Contact:
Investors: Michael Grant – Managing Director, Investor Relations – (615) 263-6957
Media: Steve Owen – Vice President, Communications – (615) 263-3107
BRENTWOOD, Tenn., March 05, 2025 (GLOBE NEWSWIRE) — CoreCivic, Inc. (NYSE: CXW) (“CoreCivic”) announced today that it has agreed under an amended intergovernmental services agreement (IGSA) between the City of Dilley, Texas, and U.S. Immigration and Customs Enforcement (ICE) to resume operations and care for up to 2,400 individuals at the South Texas Family Residential Center in Dilley, Texas (the Dilley Facility). Simultaneously, CoreCivic has entered into a new lease agreement with Target Hospitality Corporation (Target), the owner of the facility, over a period co-terminus with the ICE agreement.
The Dilley Facility was purpose-built for ICE in 2014 to provide an appropriate setting for a family population. CoreCivic managed the Dilley Facility from its construction in 2014 through August 2024, when funding for the contract with ICE was terminated and the facility was idled. CoreCivic will again be responsible for providing residential services in an open and safe environment that offers residents indoor and outdoor recreational activities, life skills, counseling, group interaction, and access to religious and legal services. In addition, CoreCivic will assume the additional responsibility of onsite medical care. Food services will be provided by Target.
The amended IGSA expires in March 2030 and may be further extended through bilateral modification. The agreement provides for a fixed monthly payment in accordance with a graduated schedule to correlate with the activation of each neighborhood within the facility. Total annual revenue once fully activated is expected to be approximately $180 million, inclusive of medical services. We began pre-activation activities earlier this year and expect this award to be accretive to earnings beginning in the second quarter of 2025.
Damon T. Hininger, CoreCivic’s Chief Executive Officer, commented, “With this award and the additional capacity provided to ICE through four contract modifications we announced last week, we are grateful for the trust our government partner has placed in us. We have an extensive supply of available beds, either owned directly or provided by third parties like Target, that provides our government partners the flexibility to satisfy their immediate and long-term needs in a cost-effective manner. We are entering a period when our government partners — particularly our federal government partners — are expected to have increased demand. We anticipate continued robust contracting activity throughout 2025 that will help meet their growing needs.”
Patrick Swindle, CoreCivic’s President and Chief Operating Officer stated, “We are offering our staff the opportunity to transfer to the Dilley Facility and expect many who accept transfer opportunities will be professionals who previously provided services at the facility prior to its closure last year, expediting the activation process. We are also pleased to again work with Target, which has been a fantastic partner since our relationship began in 2014.”
About CoreCivic
CoreCivic is a diversified, government-solutions company with the scale and experience needed to solve tough government challenges in flexible, cost-effective ways. We provide a broad range of solutions to government partners that serve the public good through high-quality corrections and detention management, a network of residential and non-residential alternatives to incarceration to help address America’s recidivism crisis, and government real estate solutions. We are the nation’s largest owner of partnership correctional, detention and residential reentry facilities, and believe we are the largest private owner of real estate used by government agencies in the United States. We have been a flexible and dependable partner for government for more than 40 years. Our employees are driven by a deep sense of service, high standards of professionalism and a responsibility to help government better the public good. Learn more at www.corecivic.com.
This press release includes statements as to our beliefs and expectations of the outcome of future events that are forward-looking statements within the meaning of Section 21E of the Securities Exchange Act of 1934, as amended, and the Private Securities Litigation Reform Act of 1995, as amended. These forward-looking statements may include such words as “anticipate,” “estimate,” “expect,” “project,” “plan,” “intend,” “believe,” “may,” “will,” “should,” “can have,” “likely,” and other words and terms of similar meaning in connection with any discussion of the timing or nature of future operating or financial performance or other events. Such forward-looking statements may be affected by risks and uncertainties in CoreCivic’s business and market conditions. These forward-looking statements are subject to risks and uncertainties that could cause actual results to differ materially from the statements made. Important factors that could cause actual results to differ are described in the filings made from time to time by CoreCivic with the Securities and Exchange Commission (“SEC”) and include the risk factors described in CoreCivic’s Annual Report on Form 10-K for the fiscal year ended December 31, 2024, filed with the SEC on February 21, 2025. Except as required by applicable law, CoreCivic undertakes no obligation to update forward-looking statements made by it to reflect events or circumstances occurring after the date hereof or the occurrence of unanticipated events.
Contact:
Investors: Michael Grant – Managing Director, Investor Relations – (615) 263-6957 Media: Steve Owen – Vice President, Communications – (615) 263-3107
BRENTWOOD, Tenn., Feb. 27, 2025 (GLOBE NEWSWIRE) — CoreCivic, Inc. (NYSE: CXW) (“CoreCivic”) announced today that it has entered into contract modifications to add capacity for up to a total of 784 detainees from U.S. Immigration and Customs Enforcement (“ICE”) at its 2,016-bed Northeast Ohio Correctional Center, its 1072-bed Nevada Southern Detention Center, and its 1,600-bed Cimarron Correctional Facility in Oklahoma. In addition, CoreCivic has obtained a contract modification to specify that ICE may use up to 252 beds at its 2,672-bed Tallahatchie County Correctional Facility in Mississippi.
CoreCivic currently cares for approximately 650 residents under a contract with the U.S. Marshals Service (“USMS”), as well as 925 residents under a contract with the Ohio Department of Rehabilitation and Correction at the Northeast Ohio Correctional Center. CoreCivic currently cares for approximately 800 residents under a contract with the USMS at the Nevada Southern Detention Center, and approximately 1,100 residents under a contract with the USMS at the Cimarron Correctional Facility. CoreCivic currently cares for approximately 1,400 residents at the Tallahatchie County Correctional Facility under contracts with eight different customers.
Damon T. Hininger, CoreCivic’s Chief Executive Officer, commented, “We are pleased to provide U.S. Immigration and Customs Enforcement with this additional capacity. We have an extensive supply of available beds that provides our government partners the flexibility to satisfy their immediate and long-term needs in a cost-effective manner. I am particularly proud of our dedicated team of professionals at each of these three facilities who are capable of managing these diverse customer requirements. We are entering a period where our government partners, particularly our federal government partners, are expected to have increased demand. We anticipate additional contracting activity that will help satisfy their growing needs.”
About CoreCivic
CoreCivic is a diversified, government-solutions company with the scale and experience needed to solve tough government challenges in flexible, cost-effective ways. We provide a broad range of solutions to government partners that serve the public good through high-quality corrections and detention management, a network of residential and non-residential alternatives to incarceration to help address America’s recidivism crisis, and government real estate solutions. We are the nation’s largest owner of partnership correctional, detention and residential reentry facilities, and believe we are the largest private owner of real estate used by government agencies in the United States. We have been a flexible and dependable partner for government for more than 40 years. Our employees are driven by a deep sense of service, high standards of professionalism and a responsibility to help government better the public good. Learn more at www.corecivic.com.
This press release includes forward-looking statements as to our beliefs and expectations of the outcome of future events including increasing demand from our government partners, particularly our federal government partners, and the prospects of growth in CoreCivic’s business. These forward-looking statements may include such words as “anticipate,” “estimate,” “expect,” “project,” “plan,” “intend,” “believe,” “may,” “will,” “should,” “can have,” “likely,” and other words and terms of similar meaning in connection with any discussion of the timing or nature of future operating or financial performance or other events. Such forward-looking statements may be affected by risks and uncertainties in CoreCivic’s business and market conditions. These forward-looking statements are subject to risks and uncertainties that could cause actual results to differ materially from the statements made. Important factors that could cause actual results to differ are described in the filings made from time to time by CoreCivic with the Securities and Exchange Commission (“SEC”) and include the risk factors described in CoreCivic’s Annual Report on Form 10-K for the fiscal year ended December 31, 2024, filed with the SEC on February 21, 2025. Except as required by applicable law, CoreCivic undertakes no obligation to update forward-looking statements made by it to reflect events or circumstances occurring after the date hereof or the occurrence of unanticipated events.
Contact:
Investors: Michael Grant – Managing Director, Investor Relations – (615) 263-6957 Media: Steve Owen – Vice President, Communications – (615) 263-3107
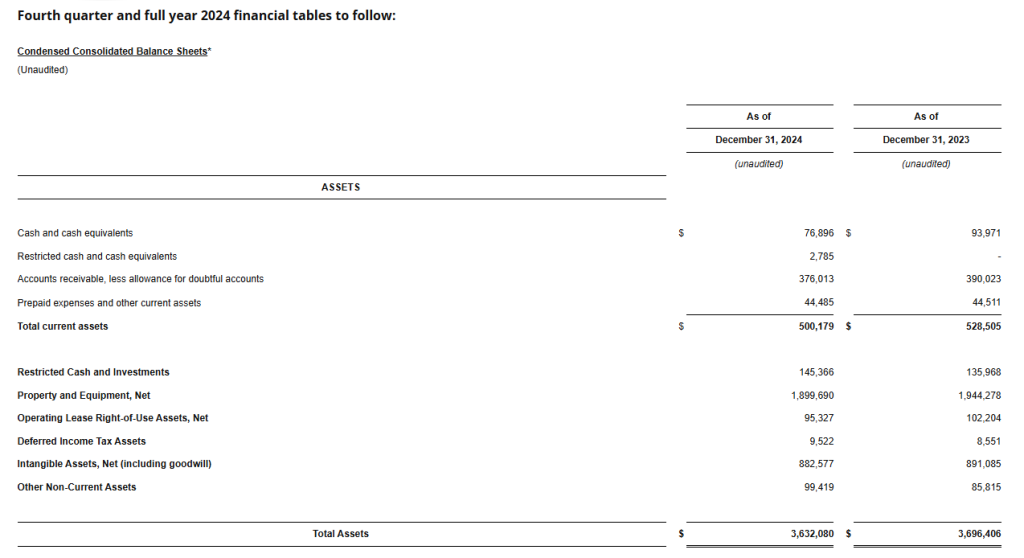
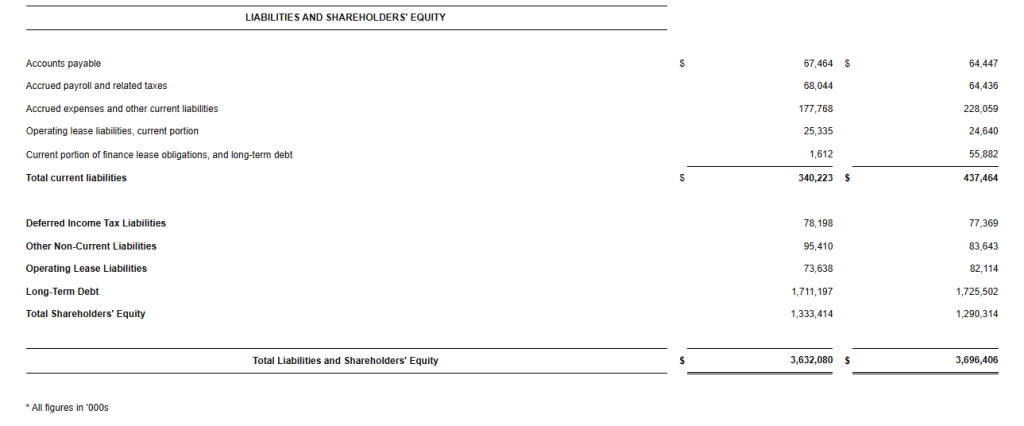
BOCA RATON, Fla.–(BUSINESS WIRE)–Feb. 27, 2025– The GEO Group, Inc. (NYSE: GEO) (“GEO”), a leading provider of contracted support services for secure facilities, processing centers, and reentry centers, as well as enhanced in-custody rehabilitation, post-release support, and electronic monitoring programs, reported today its financial results for the fourth quarter and full year 2024.
Fourth Quarter 2024 Highlights
Total revenues of $607.7 million
Net Income of $15.5 million
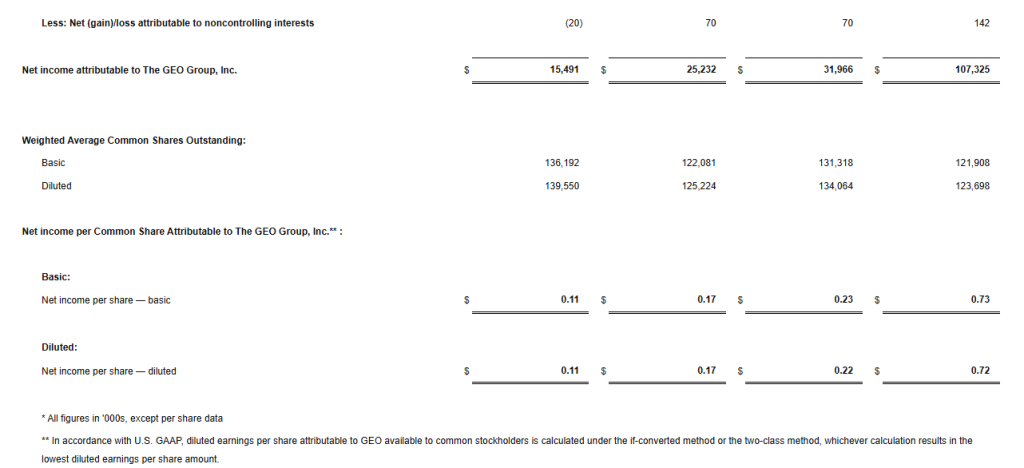
Net Income Attributable to GEO of $0.11 per diluted share
Adjusted Net Income of $0.13 per diluted share
Adjusted EBITDA of $108.0 million
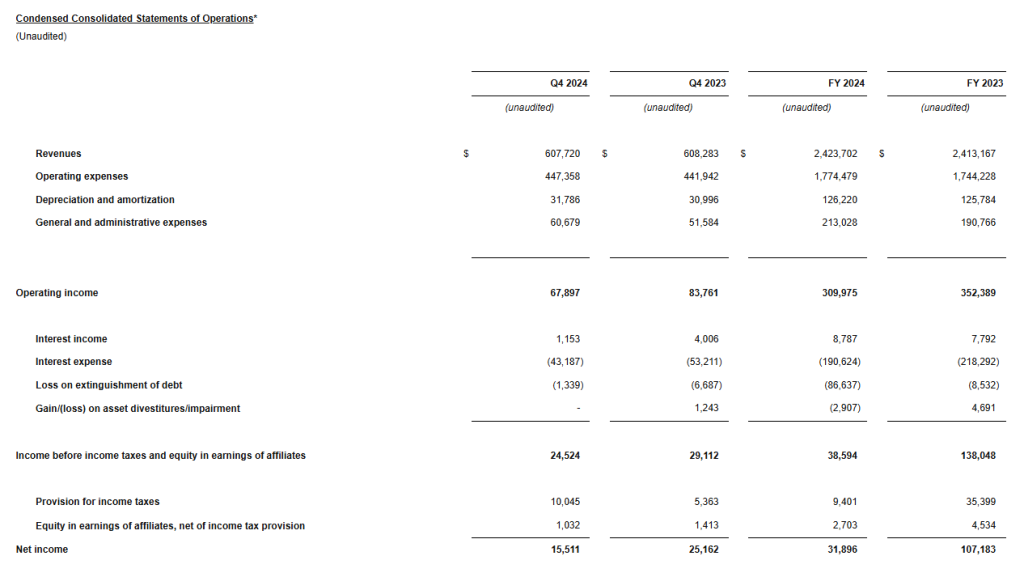
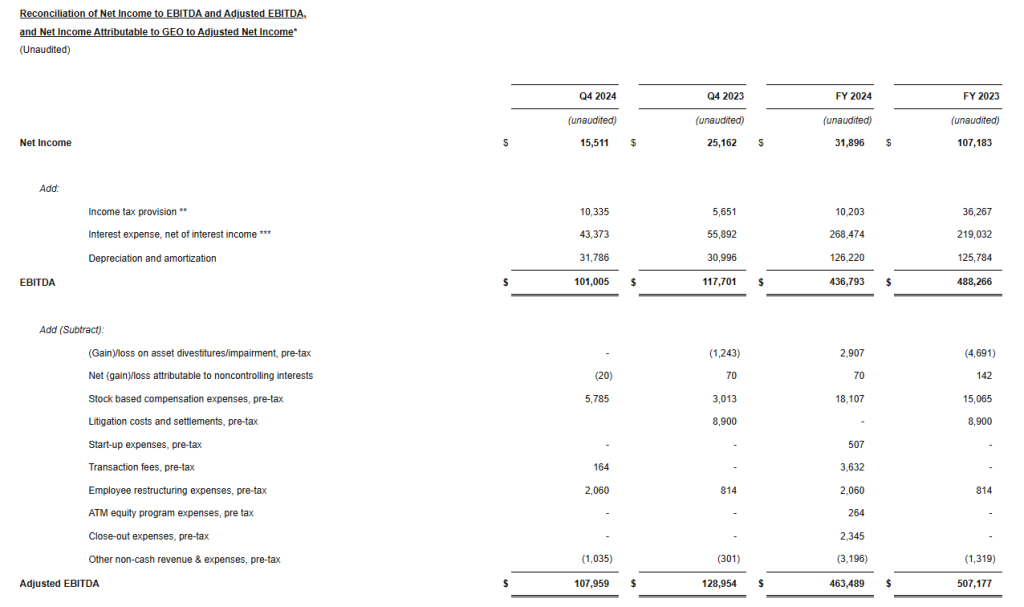
For the fourth quarter 2024, we reported net income attributable to GEO of $15.5 million, or $0.11 per diluted share, compared to net income attributable to GEO of $25.2 million, or $0.17 per diluted share, for the fourth quarter 2023.
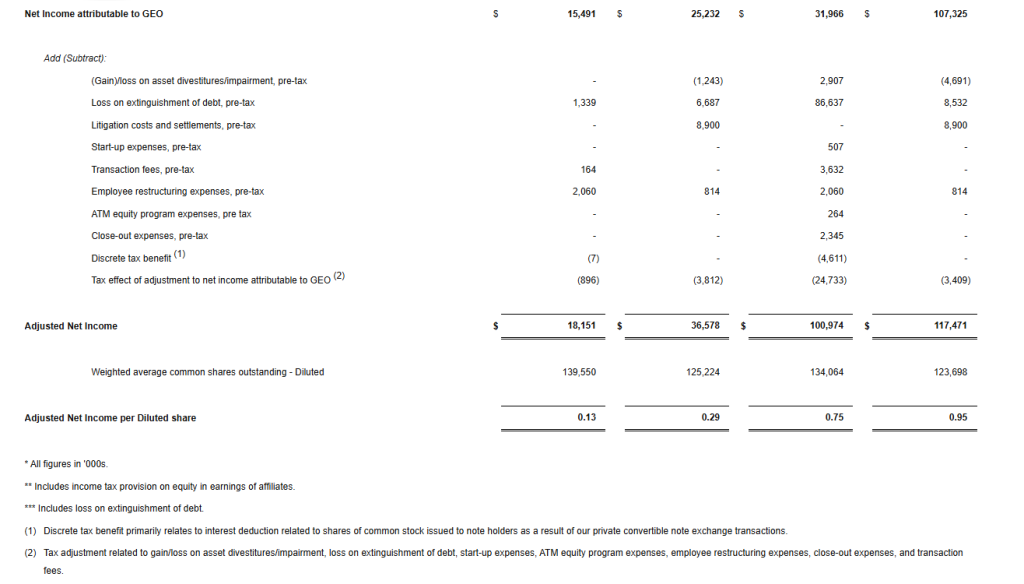
Fourth quarter 2024 results reflect costs associated with the extinguishment of debt of $1.3 million, pre-tax, $0.2 million in transaction fees, pre-tax, and $2.1 million in employee restructuring expenses, pre-tax. Excluding these unusual items, we reported adjusted net income for the fourth quarter 2024 of $18.2 million, or $0.13 per diluted share, compared to $36.6 million, or $0.29 per diluted share, for the fourth quarter 2023.
We reported total revenues for the fourth quarter 2024 of $607.7 million compared to $608.3 million for the fourth quarter 2023. We reported fourth quarter 2024 Adjusted EBITDA of $108.0 million, compared to $129.0 million for the fourth quarter 2023.
Our fourth quarter of 2024 results reflect higher general and administrative expenses, which were partly the result of the previously announced reorganization of our management team and additional professional fees we incurred in anticipation of future growth projects and related operational activity during 2025.
Our revenues for the fourth quarter of 2024 increased sequentially from the third quarter of 2024 and were in line with our previous guidance; however, our earnings and Adjusted EBITDA were below our previous expectations, primarily due to the higher general and administrative expenses incurred during the fourth quarter of 2024.
George C. Zoley, Executive Chairman of GEO, said, “During the fourth quarter of 2024, we completed the previously announced reorganization of our senior management team and incurred additional professional fees in anticipation of what we expect to be unprecedented future growth opportunities and significant operational activity during 2025. In 2024, we also incurred $9 million of our previously announced $70 million investment to strengthen our capabilities to deliver expanded detention capacity, secure transportation, and electronic monitoring services to U.S. Immigration and Customs Enforcement (“ICE”) and the federal government.
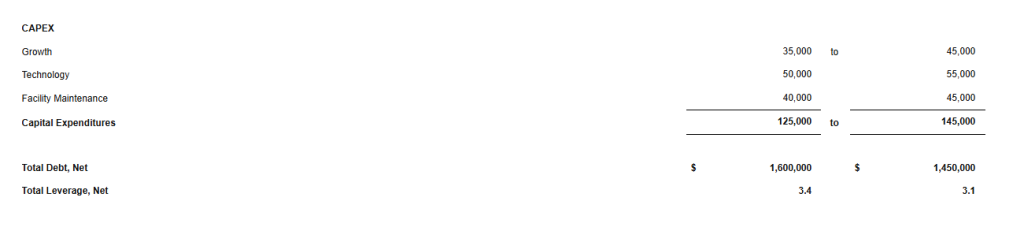
In addition to taking these important steps, we remain focused on reducing our net debt, deleveraging our balance sheet, and exploring options to return capital to shareholders in the future. In 2025, we expect to further reduce our total net debt by approximately $150 million to $175 million, bringing our total net debt to approximately $1.55 billion.”
Full Year 2024 Highlights
Total revenues of $2.42 billion
Net Income of $31.9 million
Net Income Attributable to GEO of $0.22 per diluted share, reflects costs associated with the extinguishment of debt of $86.6 million, pre-tax
Adjusted Net Income of $0.75 per diluted share
Adjusted EBITDA of $463.5 million
For the full year 2024, we reported net income attributable to GEO of $32.0 million, or $0.22 per diluted share, compared to net income attributable to GEO of $107.3 million, or $0.72 per diluted share, for the full year 2023. Results for the full year 2024 reflect costs associated with the extinguishment of debt of $86.6 million, pre-tax.
Excluding the costs associated with the extinguishment of debt and other unusual items, we reported adjusted net income for the full year 2024 of $101.0 million, or $0.75 per diluted share, compared to $117.5 million, or $0.95 per diluted share, for the full year 2023.
We reported total revenues for the full year 2024 of $2.42 billion compared to $2.41 billion for the full year 2023. We reported Adjusted EBITDA for the full year 2024 of $463.5 million, compared to $507.2 million for the full year 2023.
Financial Guidance
Today, we issued our initial financial guidance for 2025. Consistent with our long-standing practice, our initial guidance does not include the impact of any new contract awards that have not been previously announced.
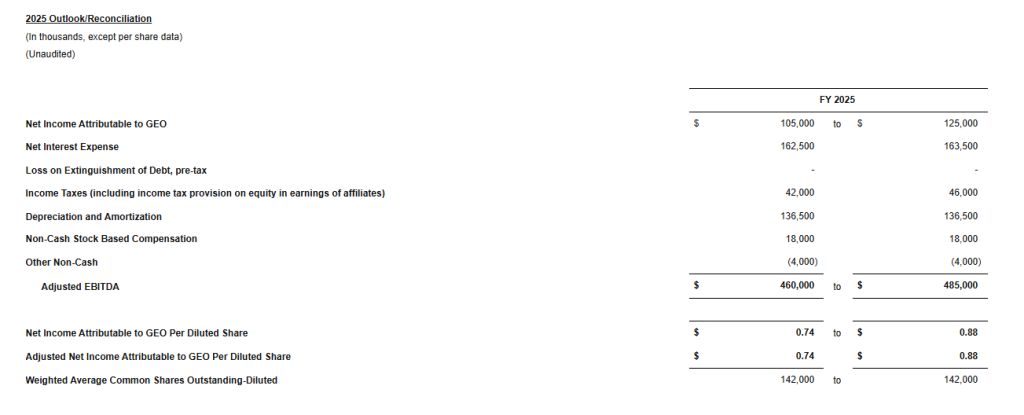
For the full year 2025, we expect Net Income Attributable to GEO to be in a range of 74 cents to 88 cents per diluted share, on revenues of approximately $2.5 billion and based on an effective tax rate of approximately 28 percent, inclusive of known discrete items. We expect our full year 2025 Adjusted EBITDA to be between $460 million and $485 million.
While our initial financial guidance for 2025 does not include an assumption for any new contract awards that have not been previously announced, we anticipate several additional opportunities could materialize during the year, which would provide significant upside to our current forecast. As we progress through the year and the likelihood and timing of these opportunities become clearer, we will adjust our 2025 financial guidance accordingly.
We expect total Capital Expenditures for the full year 2025 to be between $125 million and $145 million, including the impact of the $70 million investment we announced in December of 2024 to strengthen our capabilities to deliver expanded detention capacity, secure transportation, and electronic monitoring services to ICE and the federal government. This incremental $70 million investment is comprised of $47 million to renovate existing Secure Services facilities, $9 million of which was already spent in 2024; $16 million to ramp up the production of additional GPS tracking devices; and $7 million to expand our secure transportation assets.
Recent Developments
We announced today that we have been awarded a 15-year, fixed-price contract by ICE to provide support services for the establishment of a federal immigration processing center at the company-owned, 1,000-bed Delaney Hall Facility (the “Facility”) in Newark, New Jersey. GEO’s support services include the exclusive use of the Facility by ICE, along with security, maintenance, and food services, as well as access to recreational amenities, medical care, and legal counsel.
The new support services contract is expected to generate in excess of $60 million in annualized revenues for GEO in the first full year of operations, with margins consistent with GEO’s company-owned Secure Services facilities. GEO estimates the 15-year value of the contract with normal cost of living adjustments to be approximately $1 billion. GEO expects to reactivate the Facility in the second quarter of 2025 with revenues and earnings from the new contract normalizing during the second half of 2025.
Balance Sheet
At the end of the fourth quarter 2024, our net debt totaled approximately $1.7 billion, and our net leverage was approximately 3.7 times Adjusted EBITDA. We ended the fourth quarter of 2024 with approximately $77 million in cash and cash equivalents and approximately $214 million in total available liquidity.
Conference Call Information
We have scheduled a conference call and webcast for today at 11:00 AM (Eastern Time) to discuss our fourth quarter and full year 2024 financial results as well as our outlook. The call-in number for the U.S. is 1-877-250-1553 and the international call-in number is 1-412-542-4145. In addition, a live audio webcast of the conference call may be accessed on the Webcasts section under the News, Events and Reports tab of GEO’s investor relations webpage at investors.geogroup.com. A replay of the webcast will be available on the website for one year. A telephonic replay of the conference call will be available through March 6, 2025, at 1-877-344-7529 (U.S.) and 1-412-317-0088 (International). The participant passcode for the telephonic replay is 3882673.
About The GEO Group
The GEO Group, Inc. (NYSE: GEO) is a leading diversified government service provider, specializing in design, financing, development, and support services for secure facilities, processing centers, and community reentry centers in the United States, Australia, South Africa, and the United Kingdom. GEO’s diversified services include enhanced in-custody rehabilitation and post-release support through the award-winning GEO Continuum of Care®, secure transportation, electronic monitoring, community-based programs, and correctional health and mental health care. GEO’s worldwide operations include the ownership and/or delivery of support services for 99 facilities totaling approximately 79,000 beds, including idle facilities and projects under development, with a workforce of up to approximately 18,000 employees.
Reconciliation Tables and Supplemental Information
GEO has made available Supplemental Information which contains reconciliation tables of Net Income Attributable to GEO to Adjusted Net Income, and Net Income to EBITDA and Adjusted EBITDA, along with supplemental financial and operational information on GEO’s business and other important operating metrics. The reconciliation tables are also presented herein. Please see the section below titled “Note to Reconciliation Tables and Supplemental Disclosure – Important Information on GEO’s Non-GAAP Financial Measures” for information on how GEO defines these supplemental Non-GAAP financial measures and reconciles them to the most directly comparable GAAP measures. GEO’s Reconciliation Tables can be found herein and in GEO’s Supplemental Information available on GEO’s investor webpage at investors.geogroup.com.
Note to Reconciliation Tables and Supplemental Disclosure – Important Information on GEO’s Non-GAAP Financial Measures
Adjusted Net Income, EBITDA, and Adjusted EBITDA are non-GAAP financial measures that are presented as supplemental disclosures. GEO has presented herein certain forward-looking statements about GEO’s future financial performance that include non-GAAP financial measures, including Net Debt, Net Leverage, and Adjusted EBITDA.
The determination of the amounts that are included or excluded from these non-GAAP financial measures is a matter of management judgment and depends upon, among other factors, the nature of the underlying expense or income amounts recognized in a given period.
While we have provided a high level reconciliation for the guidance ranges for full year 2025, we are unable to present a more detailed quantitative reconciliation of the forward-looking non-GAAP financial measures to their most directly comparable forward-looking GAAP financial measures because management cannot reliably predict all of the necessary components of such GAAP measures.
The quantitative reconciliation of the forward-looking non-GAAP financial measures will be provided for completed annual and quarterly periods, as applicable, calculated in a consistent manner with the quantitative reconciliation of non-GAAP financial measures previously reported for completed annual and quarterly periods.
Net Debt is defined as gross principal debt less cash from restricted subsidiaries. Net Leverage is defined as Net Debt divided by Adjusted EBITDA.
EBITDA is defined as net income adjusted by adding provisions/(benefit) for income tax, interest expense, net of interest income, and depreciation and amortization. Adjusted EBITDA is defined as EBITDA adjusted for (gain)/loss on asset divestitures/impairment, pre-tax, net loss attributable to non-controlling interests, stock-based compensation expenses, pre-tax, litigation costs and settlements, pre-tax, start-up expenses, pre-tax, transaction fees, pre-tax, one-time employee restructuring expenses, pre-tax, ATM equity program expenses, pre-tax, close-out expenses, pre-tax, other non-cash revenue and expenses, pre-tax, and certain other adjustments as defined from time to time.
Given the nature of our business as a real estate owner and operator, we believe that EBITDA and Adjusted EBITDA are helpful to investors as measures of our operational performance because they provide an indication of our ability to incur and service debt, to satisfy general operating expenses, to make capital expenditures, and to fund other cash needs or reinvest cash into our business.
We believe that by removing the impact of our asset base (primarily depreciation and amortization) and excluding certain non-cash charges, amounts spent on interest and taxes, and certain other charges that are highly variable from year to year, EBITDA and Adjusted EBITDA provide our investors with performance measures that reflect the impact to operations from trends in occupancy rates, per diem rates and operating costs, providing a perspective not immediately apparent from net income.
The adjustments we make to derive the non-GAAP measures of EBITDA and Adjusted EBITDA exclude items which may cause short-term fluctuations in income from continuing operations and which we do not consider to be the fundamental attributes or primary drivers of our business plan and they do not affect our overall long-term operating performance.
EBITDA and Adjusted EBITDA provide disclosure on the same basis as that used by our management and provide consistency in our financial reporting, facilitate internal and external comparisons of our historical operating performance and our business units and provide continuity to investors for comparability purposes.
Adjusted Net Income is defined as net income/(loss) attributable to GEO adjusted for certain items which by their nature are not comparable from period to period or that tend to obscure GEO’s actual operating performance, including for the periods presented (gain)/loss on asset divestitures/impairment, pre-tax, loss on the extinguishment of debt, pre-tax, litigation costs and settlements, pre-tax, start-up expenses, pre-tax, transaction fees, pre-tax, one-time employee restructuring expenses, pre-tax, ATM equity program expenses, pre-tax, close-out expenses, pre-tax, discrete tax benefit, and tax effect of adjustments to net income attributable to GEO.
Safe-Harbor Statement
This press release contains forward-looking statements regarding future events and future performance of GEO that involve risks and uncertainties that could materially and adversely affect actual results, including statements regarding GEO’s financial guidance for the full year of 2025, statements regarding GEO’s focus on reducing net debt, deleveraging its balance sheet, positioning itself to explore options to return capital to shareholders in the future, making investments to strengthen GEO’s capabilities and deliver expanded detention capacity, secure transportation, and electronic monitoring services, pursuing unprecedented future growth opportunities and significant operational activity, and the upside this could have on GEO’s future financial results and financial guidance, and GEO’s ability to scale up the delivery of diversified services to support the future needs of its government agency partners. Forward-looking statements generally can be identified by the use of forward-looking terminology such as “may,” “will,” “expect,” “anticipate,” “intend,” “plan,” “believe,” “seek,” “estimate,” or “continue” or the negative of such words and similar expressions. Risks and uncertainties that could cause actual results to vary from current expectations and forward-looking statements contained in this press release include, but are not limited to: (1) GEO’s ability to meet its financial guidance for 2025 given the various risks to which its business is exposed; (2) GEO’s ability to deleverage and repay, refinance or otherwise address its debt maturities in an amount and on terms commercially acceptable to GEO, and on the timeline it expects or at all; (3) GEO’s ability to identify and successfully complete any potential sales of company-owned assets and businesses or potential acquisitions of assets or businesses on commercially advantageous terms on a timely basis, or at all; (4) changes in federal and state government policy, orders, directives, legislation and regulations that affect public-private partnerships with respect to secure, correctional and detention facilities, processing centers and reentry centers; (5) changes in federal immigration policy; (6) public and political opposition to the use of public-private partnerships with respect to secure correctional and detention facilities, processing centers and reentry centers; (7) any continuing impact of the COVID-19 global pandemic on GEO and GEO’s ability to mitigate the risks associated with COVID-19; (8) GEO’s ability to sustain or improve company-wide occupancy rates at its facilities; (9) fluctuations in GEO’s operating results, including as a result of contract terminations, contract renegotiations, changes in occupancy levels and increases in GEO’s operating costs; (10) general economic and market conditions, including changes to governmental budgets and its impact on new contract terms, contract renewals, renegotiations, per diem rates, fixed payment provisions, and occupancy levels; (11) GEO’s ability to address inflationary pressures related to labor related expenses and other operating costs; (12) GEO’s ability to timely open facilities as planned, profitably manage such facilities and successfully integrate such facilities into GEO’s operations without substantial costs; (13) GEO’s ability to win management contracts for which it has submitted proposals and to retain existing management contracts; (14) risks associated with GEO’s ability to control operating costs associated with contract start-ups; (15) GEO’s ability to successfully pursue growth opportunities and continue to create shareholder value; (16) GEO’s ability to obtain financing or access the capital markets in the future on acceptable terms or at all; and (17) other factors contained in GEO’s Securities and Exchange Commission periodic filings, including its Form 10-K, 10-Q and 8-K reports, many of which are difficult to predict and outside of GEO’s control.
Earnings Release Scheduled for Wednesday, August 7, 2024 Before the Market Opens
Conference Call Scheduled for Wednesday, August 7, 2024 at 11:00 AM (Eastern Time)
BOCA RATON, Fla.–(BUSINESS WIRE)–Jul. 9, 2024– The GEO Group, Inc. (NYSE:GEO) (“GEO”) will release its second quarter 2024 financial results on Wednesday, August 7, 2024 before the market opens. GEO has scheduled a conference call and simultaneous webcast for 11:00 AM (Eastern Time) on Wednesday, August 7, 2024.
Hosting the call for GEO will be George C. Zoley, Executive Chairman of the Board, Brian R. Evans, Chief Executive Officer, Mark Suchinski, Chief Financial Officer, Wayne Calabrese, President and Chief Operating Officer, and James Black, President, GEO Secure Services.
To participate in the teleconference, please contact one of the following numbers 5 minutes prior to the scheduled start time:
In addition, a live audio webcast of the conference call may be accessed on the Webcasts section of GEO’s investor relations home page at investors.geogroup.com. A webcast replay will remain available on the website for one year.
A telephonic replay will also be available through August 14, 2024. The replay numbers are 1-877-344-7529 (U.S.) and 1-412-317-0088 (International). The passcode for the telephonic replay is 4116450. If you have any questions, please contact GEO at 1-866-301-4436.
For more than 70 years, Vectrus has provided critical mission support for our customers’ toughest operational challenges. As a high-performing organization with exceptional talent, deep domain knowledge, a history of long-term customer relationships, and groundbreaking technical expertise, we deliver innovative, mission-matched solutions for our military and government customers worldwide. Whether it’s base operations support, supply chain and logistics, IT mission support, engineering and digital integration, security, or maintenance, repair and overhaul, our customers count on us for on-target solutions that increase efficiency, reduce costs, improve readiness, and strengthen national security. Vectrus is headquartered in Colorado Springs, Colo., and includes about 8,100 employees spanning 205 locations in 28 countries. In 2021, Vectrus generated sales of $1.8 billion. For more information, visit the company’s website at www.vectrus.com or connect with Vectrus on Facebook, Twitter, and LinkedIn.
Joe Gomes, CFA, Managing Director, Equity Research Analyst, Generalist , Noble Capital Markets, Inc.
Joshua Zoepfel, Research Associate, Noble Capital Markets, Inc.
Refer to the full report for the price target, fundamental analysis, and rating.
Repricing and Extension. Yesterday, V2X announced a repricing and extension of its $907 million First Lien term loan. The actions are another step by management to enhance the capital structure, in our view, and should lead to lower interest costs and additional financial flexibility.
Details. Under the repricing, the annual interest margin was reduced by 50 basis points to 2.75%. Additionally, the 10-basis point credit spread adjustment was eliminated from the Company’s Secured Overnight Financing Rate, further improving the anticipated savings from the repricing. The company also extended the maturity of the loan by two years to December 2030.
Equity Research is available at no cost to Registered users of Channelchek. Not a Member? Click ‘Join’ to join the Channelchek Community. There is no cost to register, and we never collect credit card information.
This Company Sponsored Research is provided by Noble Capital Markets, Inc., a FINRA and S.E.C. registered broker-dealer (B/D).
*Analyst certification and important disclosures included in the full report. NOTE: investment decisions should not be based upon the content of this research summary. Proper due diligence is required before making any investment decision.
Earnings Release Scheduled for Tuesday, May 7, 2024 Before the Market Opens
Conference Call Scheduled for Tuesday, May 7, 2024 at 11:00 AM (Eastern Time)
BOCA RATON, Fla.–(BUSINESS WIRE)–Apr. 22, 2024– The GEO Group, Inc. (NYSE:GEO) (“GEO”) will release its first quarter 2024 financial results on Tuesday, May 7, 2024 before the market opens. GEO has scheduled a conference call and simultaneous webcast for 11:00 AM (Eastern Time) on Tuesday, May 7, 2024.
Hosting the call for GEO will be George C. Zoley, Executive Chairman of the Board, Brian R. Evans, Chief Executive Officer, Shayn March, Acting Chief Financial Officer, Wayne Calabrese, President and Chief Operating Officer, and James Black, President, GEO Secure Services.
To participate in the teleconference, please contact one of the following numbers 5 minutes prior to the scheduled start time:
In addition, a live audio webcast of the conference call may be accessed on the Webcasts section of GEO’s investor relations home page at investors.geogroup.com. A webcast replay will remain available on the website for one year.
A telephonic replay will also be available through May 14, 2024. The replay numbers are 1-877-344-7529 (U.S.) and 1-412-317-0088 (International). The passcode for the telephonic replay is 2879740. If you have any questions, please contact GEO at 1-866-301-4436.
BOCA RATON, Fla.–(BUSINESS WIRE)–Apr. 18, 2024– The GEO Group (NYSE: GEO) (“GEO” or the “Company”) announced today that it has closed a private offering of $1.275 billion aggregate principal amount of senior notes, comprised of $650.0 million aggregate principal amount of 8.625% senior secured notes due 2029 (the “Secured Notes”) and $625.0 million aggregate principal amount of 10.25% senior unsecured notes due 2031 (the “Unsecured Notes” and, together with the Secured Notes, the “Notes”), exempt from the registration requirements of the Securities Act of 1933, as amended (the “Securities Act”). The Notes are guaranteed by GEO’s domestic subsidiaries that are guarantors under a new senior secured credit facility and outstanding senior notes. GEO also announced today that it has closed a new five-year $450.0 million Term Loan B (the “Term Loan”), bearing interest at SOFR plus 5.25%, under a new $760.0 million senior secured credit facility. The new senior secured credit facility also includes a five-year revolving line of credit for $310.0 million.
The offering of the Notes and the new Term Loan resulted in net proceeds of approximately $1.67 billion, after deducting the initial purchasers’ discount and estimated expenses payable by GEO. GEO intends to use the net proceeds of the offering of the Notes, borrowings under the new Term Loan, and cash on hand to refinance approximately $1.5 billion of existing indebtedness, including to fund the repurchase, redemption or other discharge of the Company’s existing Tranche 1 Term Loan and Tranche 2 Term Loan under its prior senior credit facility, the 9.50% senior second lien secured notes, the 10.50% senior second lien secured notes, and the 6.00% senior notes due 2026, to pay related premiums, transaction fees and expenses, and for general corporate purposes of the Company. GEO also intends to retire or settle a portion of the 6.50% exchangeable senior notes due 2026 issued by GEO Corrections Holdings, Inc., using shares of GEO common stock and cash. GEO expects to fund the cash portion of the retirement or settlement, which is expected to total up to $177.1 million, using a combination of the net proceeds from the offering of the Notes and cash on hand. Nothing in this press release should be construed as an offer to purchase, notice of redemption or a solicitation of an offer to purchase any of the existing term loans or notes.
The Notes were offered and sold in the United States only to persons reasonably believed to be “qualified institutional buyers” pursuant to Rule 144A under the Securities Act, and outside the United States only to non-U.S. persons pursuant to Regulation S under the Securities Act. The Notes have not been registered under the Securities Act or any state securities laws and may not be offered or sold in the United States absent registration or an applicable exemption from the registration requirements under the Securities Act and applicable state laws. This news release does not constitute an offer to sell or the solicitation of an offer to buy, nor shall there be any sale of the Notes in any jurisdiction in which such offer, solicitation or sale would be unlawful prior to registration or qualification under the securities laws of any such jurisdiction.
About The GEO Group
The GEO Group, Inc. (NYSE: GEO) is a leading diversified government service provider, specializing in design, financing, development, and support services for secure facilities, processing centers, and community reentry centers in the United States, Australia, South Africa, and the United Kingdom. GEO’s diversified services include enhanced in-custody rehabilitation and post-release support through the award-winning GEO Continuum of Care®, secure transportation, electronic monitoring, community-based programs, and correctional health and mental health care. GEO’s worldwide operations include the ownership and/or delivery of support services for 100 facilities totaling approximately 81,000 beds, including idle facilities and projects under development, with a workforce of up to approximately 18,000 employees.
Use of forward-looking statements
This press release includes forward-looking statements regarding GEO’s intended use of the net proceeds. These forward-looking statements may be affected by risks and uncertainties in GEO’s business and market conditions. This information is qualified in its entirety by cautionary statements and risk factor disclosure contained in GEO’s Securities and Exchange Commission filings, including GEO’s report on Form 10-K for the year ended December 31, 2023, and GEO’s reports on Form 10-Q and Form 8-K filed with the Commission. GEO wishes to caution readers that certain important factors may have affected and could in the future affect GEO’s actual results and could cause GEO’s actual results for subsequent periods to differ materially from those expressed in any forward-looking statement made by or on behalf of GEO, including the risks that the repurchase, redemption or other discharge of its Tranche 1 Term Loan and Tranche 2 Term Loan under its existing senior credit facility, the 9.50% senior second lien secured notes, the 10.50% senior second lien secured notes, and the 6.00% senior notes due 2026 cannot be successfully completed, and that the retirement or settlement of a portion of the 6.50% exchangeable senior notes due 2026 issued by GEO Corrections Holdings, Inc. cannot be successfully completed. GEO undertakes no obligation to update forward-looking statements to reflect events or circumstances after the date hereof, except as required by law.