A perfect storm is brewing in the US housing market. Mortgage rates have surged above 7% just as millennials, the largest generation, reach peak homebuying age. This collision of rising interest rates and unmet demand is causing substantial disruption, as seen in the sharp decline in home sales, cautious builders and a looming affordability crisis that threatens the broader economy.
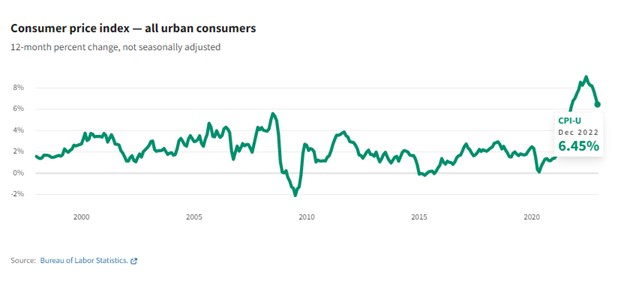
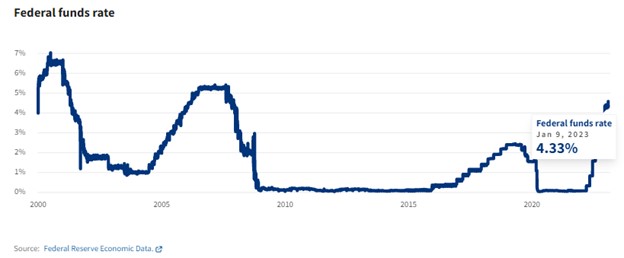
Mortgage rates have taken off as the Federal Reserve aggressively raises interest rates to fight inflation. The average 30-year fixed rate recently hit 7.18%, according to Freddie Mac, the highest level since 2001. This has severely hampered housing affordability and demand. Fannie Mae, the mortgage finance giant, forecasts total home sales will drop to 4.8 million this year, the slowest pace since 2011 when the housing market was still recovering from the Great Recession.
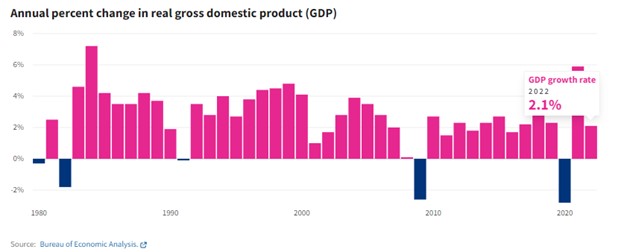
Fannie Mae expects sales to struggle through 2024 as rates remain elevated. It predicts the US economy will enter a recession in early 2024, further dragging down the housing market. Home prices are also likely to drop as high rates impede sales. This could hurt consumer confidence and discretionary spending, considering the critical role housing plays in household wealth.
Higher rates have pumped up monthly mortgage payments and made homes less affordable. Take a $500,000 home purchased with a 20% down payment. At a 2.86% mortgage rate two years ago, the monthly payment would have been $1,656. With rates now at 7.18%, that same home has a monthly cost of $3,077, according to calculations by Axios. That 87% payment surge makes purchasing unattainable for many buyers.
These affordability challenges are hitting just as millennials reach peak homebuying age. The largest cohorts of this generation were born in the late 1980s and early 1990s, making them between 32 and 34 years old today. That’s when marriage, childbearing and demand for living space typically accelerate.
However, homebuilders have been reluctant to significantly ramp up construction with rates so high. Housing starts experienced a significant decline of 11.3% in August, according to Census Bureau data, driven by a decline in apartment buildings. Single-family starts dipped 4.3% to an annual pace of 941,000, 16% below the average from mid-2020 to mid-2022. Homebuilder sentiment has also plunged, according to the National Association of Home Builders.
This pullback in new construction comes even as there is strong interest from millennials and other buyers. Though mortgage rates moderated the overheated housing market earlier this year, national home prices remain just below their all-time highs, up 13.5% from two years ago, according to the S&P Case-Shiller index.
Some analysts say the only solution is to significantly boost supply. But that seems unlikely with builders cautious and financing costs high. The housing crisis has no quick fix and will continue to be an anchor on the broader economy. Millennials coming of age and mortgage rates spiraling upwards have sparked a perfect storm, broken the housing market, and darkened the country’s economic outlook.