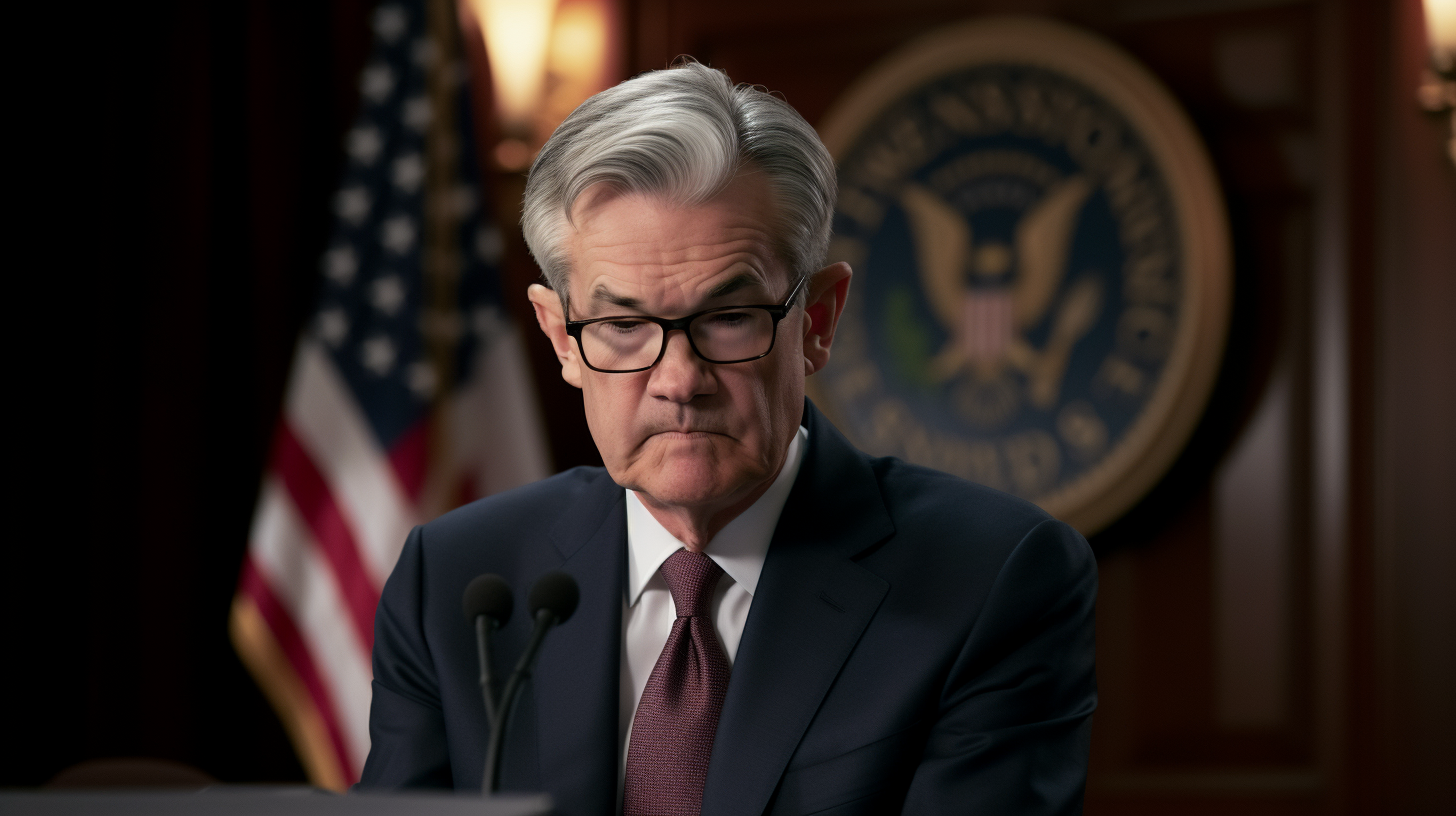
The Federal Reserve announced its widely expected decision on Wednesday to maintain interest rates at a new 22-year high after an aggressive series of hikes intended to cool inflation. The Fed kept its benchmark rate in a range of 5.25-5.50%, indicating it remains committed to tamping down price increases through restrictive monetary policy.
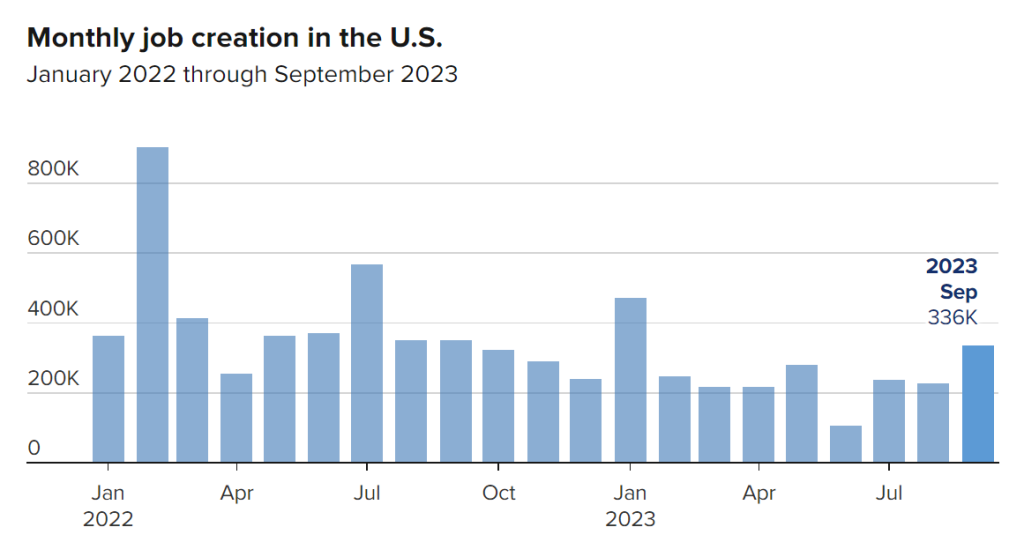
In its statement, the Fed upgraded its assessment of economic activity to “strong” in the third quarter, a notable shift from “solid” in September. The upgrade likely reflects the blockbuster 4.9% annualized GDP growth in Q3, driven by resilient consumer spending.
However, the Fed made clear further rate hikes could still occur if economic conditions warrant. The central bank is treading cautiously given uncertainty around how past tightening will impact growth and jobs.
For consumers, the Fed’s hiking campaign this year has significantly increased the cost of borrowing for homes, cars, and credit cards. Mortgage rates have essentially doubled from a year ago, deterring many would-be home buyers and slowing the housing market. Auto loan rates are up roughly 3 percentage points in 2023, increasing monthly payments. The average credit card interest rate now sits around 19%, the highest since 1996.
Savers are finally benefitting from higher yield on savings accounts, CDs, and Treasury bonds after years of paltry returns. But overall, households are facing greater financial strain from pricier loans that could eventually crimp spending and economic momentum if rates stay elevated.
 |
“The Fed is deliberately slowing demand to get inflation in check, and that painful process is underway,” noted Bankrate chief financial analyst Greg McBride. “For consumers, the impact is being felt most acutely in the higher costs of homes, autos, and credit card debt.”
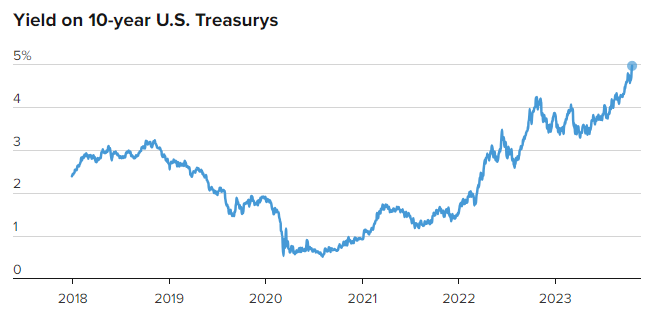
Investors have also felt the brunt of aggressive Fed tightening through increased market volatility and falling valuations. The S&P 500 has sunk over 20% from January’s record high, meeting the technical definition of a bear market. Rising Treasury yields have put pressure on stocks, especially higher growth technology names.
Still, stocks rebounded in October based on hopes that easing inflation could allow the Fed to slow or pause rate increases soon. Markets are betting rates could start declining in 2024 if inflation continues trending down. But that remains uncertain.
“The Fed is data dependent, so until they see clear evidence that inflation is on a sustainable downward trajectory, they have to keep tightening,” said Chris Taylor, portfolio manager at Morgan Stanley. “Markets are cheering lower inflation readings, but the Fed can’t declare victory yet.”
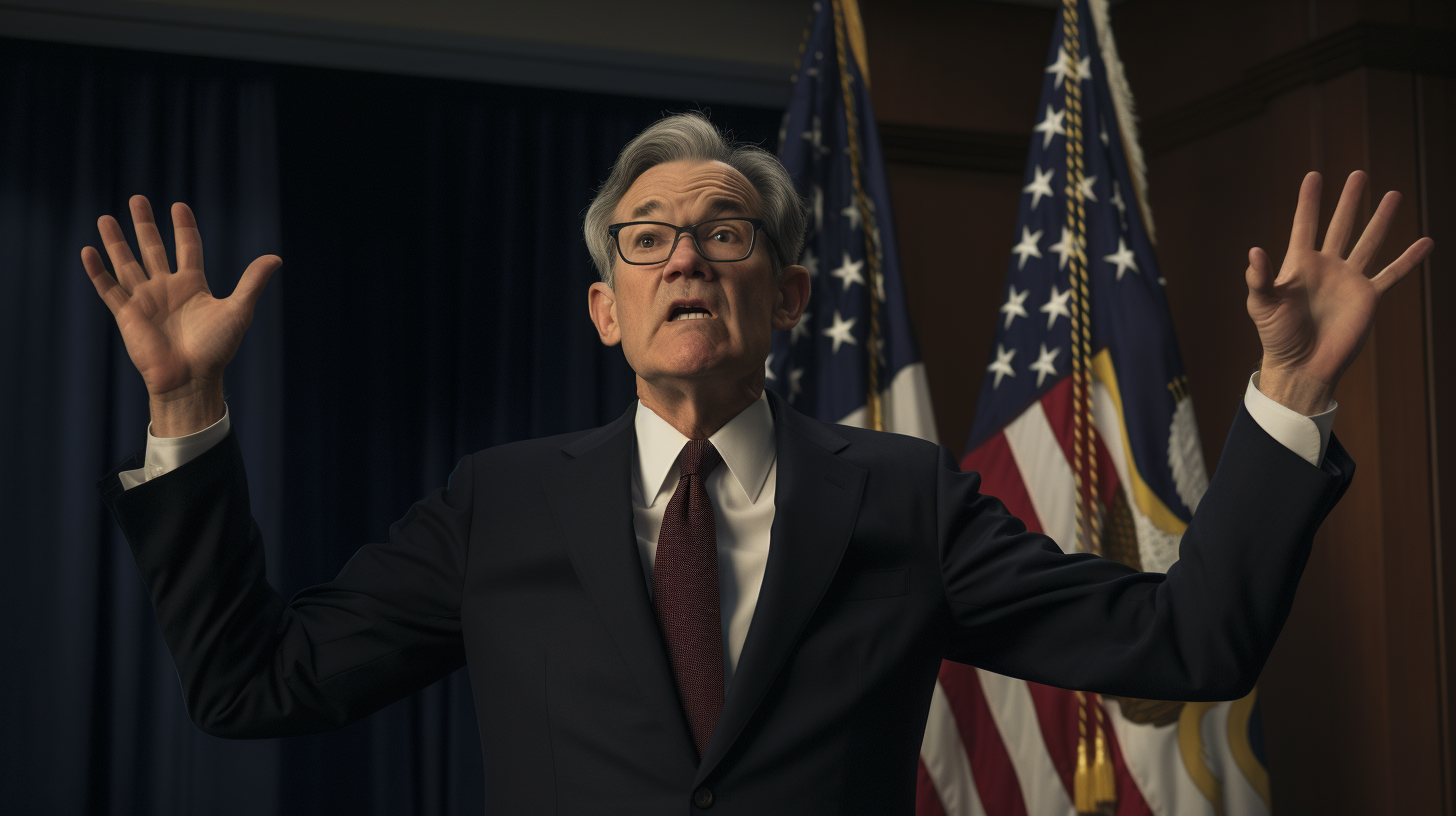
In his post-meeting press conference, Fed Chair Jerome Powell emphasized that officials have “some ways to go” before stopping rate hikes. Powell indicated the Fed plans to hold rates at a restrictive level for some time to ensure inflation is contained.
With consumer and business spending still relatively healthy, the Fed currently believes the economy can withstand additional tightening for now. But Powell acknowledged a downturn is possible as the delayed impacts of higher rates materialize.
For investors, the path ahead likely entails continued volatility until more predictable Fed policy emerges. But markets appear reassured by the central bank’s data-dependent approach. As inflation slowly declines, hopes are growing that the end of the Fed’s aggressive hiking cycle may come into focus sometime in 2024, potentially setting the stage for an economic and market rebound.