German consumer goods giant Henkel AG is writing one of the largest checks in prestige hair care history, agreeing to acquire OLAPLEX Holdings (NASDAQ: OLPX) for approximately $1.4 billion in a cash deal that values shares at $2.06 apiece — a 55% premium over where the stock closed on March 25.
For small and microcap investors, this transaction is a textbook case study in what a strategic acquirer will pay for a brand with durable IP, a loyal professional channel, and a story of operational recovery.
From Lab Disruptor to Acquisition Target
OLAPLEX launched in 2014 with a singular innovation: Complete Bond Technology, a chemistry-driven approach to repairing hair bonds during and after chemical services. The product found its home in salons first, building a credibility-driven distribution model that competitors struggled to replicate.
Private equity firm Advent International backed the company and took it public, helping scale it from a single-product disruptor into a multi-SKU hair health platform. But OLAPLEX’s post-IPO journey has been rocky. The stock, which once traded well above $20, has languished amid slowing consumer demand, intense competition in the prestige hair segment, and a multi-year transformation program the company undertook to reset its cost structure, marketing engine, and go-to-market model.
That turnaround, while painful for shareholders who held on too long, appears to have made the company an attractive acquisition for Henkel, which recognized the rebuilt infrastructure and brand credibility as assets worth paying a premium for.
What Henkel Gets
Henkel is acquiring more than a brand — it is acquiring distribution leverage. OLAPLEX has established direct-to-consumer channels and specialty retail presence across North America that complement Henkel’s broader international footprint. The deal gives Henkel immediate access to the professional stylist and salon community, a channel both companies serve but through different product lines.
For Henkel, the acquisition represents an accelerated path into the premium science-led hair care category without years of organic brand-building. The company gains OLAPLEX’s product innovation pipeline and its recognition among consumers across demographics and hair types.
The Private Equity Exit
Advent International, which controlled a majority of OLAPLEX’s voting stock, approved the transaction by written consent — effectively sealing the deal without requiring a broader shareholder vote. Advent will fully exit its position at closing, bookending an investment that helped build a globally recognized brand even if the public market returns disappointed many retail investors.
J.P. Morgan Securities is advising OLAPLEX on the transaction, which is expected to close in the second half of 2026, pending regulatory approval.
What This Signals for the Market
The OLAPLEX deal underscores a persistent theme in the consumer sector: global strategics are still willing to pay substantial premiums for brands with defensible science-based positioning and professional channel relationships, even when the public market has long since moved on. For small and microcap investors tracking M&A, OLPX is a reminder that a beaten-down stock with genuine brand equity is not always a broken business — sometimes it is just a business waiting for the right buyer.
Michael Kupinski, Director of Research, Equity Research Analyst, Digital, Media & Technology , Noble Capital Markets, Inc.
Jacob Mutchler, Research Associate, Noble Capital Markets, Inc.
Refer to the full report for the price target, fundamental analysis, and rating.
Highlights from a fireside chat. This report highlights a fireside chat with Adolfo Villagomez, CEO, who discussed the company’s four pillar initiative to transform the company into a more efficient, growth focused company.
Improving the company’s cost structure. Management has implemented a comprehensive review of the organization’s operations with the goal of reducing redundancies and improving productivity. The company is targeting approximately $50 million in run-rate cost savings across fiscal years 2026 and 2027, achieved through initiatives such as workforce streamlining, supply chain optimization, procurement improvements, and the reduction of organizational layers.
Equity Research is available at no cost to Registered users of Channelchek. Not a Member? Click ‘Join’ to join the Channelchek Community. There is no cost to register, and we never collect credit card information.
This Company Sponsored Research is provided by Noble Capital Markets, Inc., a FINRA and S.E.C. registered broker-dealer (B/D).
*Analyst certification and important disclosures included in the full report. NOTE: investment decisions should not be based upon the content of this research summary. Proper due diligence is required before making any investment decision.
Allegiant Travel Company (NASDAQ: ALGT) and Sun Country Airlines (NASDAQ: SNCY) cleared a critical regulatory hurdle this morning, announcing the early termination of the Hart-Scott-Rodino antitrust waiting period — meaning the U.S. Department of Justice has signed off on Allegiant’s proposed acquisition of Sun Country without objection. The milestone moves one of the more strategically compelling small-cap airline consolidations in years meaningfully closer to the finish line.
The deal, originally announced in January 2026, is structured as a $1.5 billion cash-and-stock transaction that offered Sun Country shareholders a premium of nearly 20% over the stock’s last close before the announcement. With DOJ clearance now secured, the primary remaining conditions are approval from the U.S. Department of Transportation and a shareholder vote from both companies. Closing is targeted for the second or third quarter of 2026.
Both carriers occupy a niche that the major airlines have largely ignored — leisure travelers flying from small and mid-sized cities to vacation destinations. Allegiant, based in Las Vegas, has built its entire model around non-stop routes linking secondary markets to resort towns. Sun Country, operating out of Minneapolis, runs a hybrid model combining scheduled passenger service, charter operations, and an Amazon cargo business that generated record full-year revenue of $1.13 billion in 2025 — its fifth consecutive profitable year.
Together, the combined carrier would serve roughly 22 million annual customers, operate across nearly 175 cities, and cover more than 650 routes with a fleet of 195 aircraft. Neither airline competes heavily for the same routes, which likely explains why the DOJ review resolved quickly and without required divestitures — a favorable signal for deal certainty.
At the time of the deal announcement, Allegiant carried a market cap of approximately $1.37 billion and Sun Country traded below $700 million — both firmly in small-cap territory. This transaction is a reminder that some of the most structurally sound consolidation plays in the market are happening below the radar of mainstream financial media, which remains fixated on mega-cap M&A.
The leisure travel segment has proven more resilient than traditional scheduled carriers across multiple economic cycles. Consumers continue to prioritize experiences and affordable vacation travel, and both Allegiant and Sun Country have built disciplined, asset-light models well-suited to capitalize on that demand. Sun Country’s diversified revenue streams — cargo, charter, and scheduled service — add a layer of earnings stability to the combined entity that pure-play passenger carriers often lack.
The DOT’s interim exemption approval is the next significant milestone, followed by formal shareholder votes at both companies. Neither hurdle is considered unusually high risk at this stage, and most observers expect the transaction to close on schedule. Allegiant has flagged the combination as accretive to earnings power and expects meaningful cost synergies from consolidating operations, maintenance programs, and corporate overhead.
For small-cap investors tracking consolidation trends in the airline sector, the Allegiant-Sun Country merger is a case study in how smaller carriers are quietly reshaping the competitive landscape — one nonstop leisure route at a time.
Joe Gomes, CFA, Managing Director, Equity Research Analyst, Generalist , Noble Capital Markets, Inc.
Refer to the full report for the price target, fundamental analysis, and rating.
Overview. Fourth quarter and full year 2025 results came in-line with management’s January 12, 2026 pre-announcement, with fourth quarter revenue of $207 million and full year revenue of $806 million. Notably, all brands demonstrated a sequential improvement in comparable sales during the quarter. Fourth quarter consolidated comparable sales declined approximately 1.8%, representing about 4 points of sequential improvement from the third quarter. And this momentum has continued in the new year.
4Q25 Results. For the fourth quarter, total GAAP revenue was approximately $207 million compared to $222 million in the prior year quarter. Adjusted EBITDA was $28.1 million compared to $31 million in the prior year quarter, a decrease of 9.5%. ONE Group reported a net loss, before preferred stock dividends, of $6.4 million compared to net income of $1.6 million in 4Q24.
Equity Research is available at no cost to Registered users of Channelchek. Not a Member? Click ‘Join’ to join the Channelchek Community. There is no cost to register, and we never collect credit card information.
This Company Sponsored Research is provided by Noble Capital Markets, Inc., a FINRA and S.E.C. registered broker-dealer (B/D).
*Analyst certification and important disclosures included in the full report. NOTE: investment decisions should not be based upon the content of this research summary. Proper due diligence is required before making any investment decision.
Cintas Corporation (Nasdaq: CTAS) announced an agreement to acquire UniFirst Corporation (NYSE: UNF) in a transaction valued at approximately $5.5 billion, marking one of the largest consolidations in the North American uniform and workplace services industry.
The deal brings together two family-founded companies with long histories serving businesses with uniform rental programs, facility services, and workplace safety products. For investors, the transaction highlights a broader trend toward scale and operational efficiency in a fragmented but highly competitive service sector.
Under the terms of the agreement, UniFirst shareholders will receive $155 in cash and 0.7720 shares of Cintas stock for each share held. Based on Cintas’ closing price of $200.77 on March 9, 2026, the consideration represents a combined value of $310 per share for UniFirst. The transaction carries an implied enterprise value of roughly $5.5 billion.
Once combined, the companies will serve approximately 1.5 million business customers across North America, providing uniforms, facility services products, and safety programs to a wide range of industries.
The uniform rental and facility services market has grown increasingly competitive as companies seek larger service footprints and more efficient logistics networks. The combination of Cintas and UniFirst is expected to expand route density, improve processing capacity, and enhance supply chain efficiency.
Cintas management said integrating UniFirst’s service infrastructure and route networks could strengthen the company’s ability to compete with both traditional uniform service providers and alternative procurement models, including direct-purchase programs and hybrid service models.
Operational integration also extends to technology investments, including systems that support route management, inventory tracking, and service delivery optimization.
For investors, these types of scale-driven efficiencies are often central to consolidation strategies in service-heavy industries where route density and logistics can significantly influence operating margins.
Cintas expects to generate approximately $375 million in operating cost synergies within four years following the closing of the transaction. These savings are projected to come from material sourcing efficiencies, production and service cost improvements, and reductions in selling, general, and administrative expenses.
The company also expects the transaction to become accretive to earnings per share by the end of the second full fiscal year after closing.
At closing, Cintas anticipates maintaining a net leverage ratio of roughly 1.5x debt to EBITDA, reflecting a balance between acquisition financing and balance sheet flexibility.
The cash portion of the purchase price will be funded through a combination of cash on hand, committed credit lines, and other financing sources. Morgan Stanley Senior Funding, KeyBank, and Wells Fargo have provided fully committed bridge financing for the transaction.
The boards of directors of both companies have unanimously approved the transaction. Entities affiliated with the Croatti family—founders of UniFirst—control roughly two-thirds of the company’s voting power and have entered into a voting support agreement in favor of the deal.
Members of the Croatti family also plan to retain an ownership position in the combined company, aligning them with the long-term performance of the merged entity.
The transaction is expected to close in the second half of 2026, subject to regulatory approvals and approval from UniFirst shareholders.
Cintas recently reported preliminary fiscal third-quarter revenue of $2.84 billion for the period ending February 28, 2026, representing an 8.9% year-over-year increase and 8.2% organic growth.
UniFirst is scheduled to report its fiscal second-quarter 2026 results on April 1.
If completed as expected, the acquisition would further solidify Cintas’ position as one of the largest providers of uniform rental and facility services in North America, while continuing a broader trend of consolidation across business services sectors where scale, logistics, and customer relationships play critical roles.
Michael Kupinski, Director of Research, Equity Research Analyst, Digital, Media & Technology , Noble Capital Markets, Inc.
Jacob Mutchler, Research Associate, Noble Capital Markets, Inc.
Refer to the full report for the price target, fundamental analysis, and rating.
Solid finish to the year.The company reported Q4 revenue of $146.6 million and adj. EBITDA of $9.9 million, both of which were largely in line with our estimates of $145.4 million and $9.1 million, respectively. Furthermore, revenue increased 1% year over year and 6% sequentially, reflecting the expected back-end weighted cadence, while strong cost controls drove meaningful profitability improvement.
Cost discipline drives earnings growth. SG&A declined $1.4 million year over year, and EBITDA increased 19% to $8.6 million, resulting in a 90 basis point improvement in EBITDA margin. EPS of $0.23, nearly doubled from the comparable prior-year quarter.
Equity Research is available at no cost to Registered users of Channelchek. Not a Member? Click ‘Join’ to join the Channelchek Community. There is no cost to register, and we never collect credit card information.
This Company Sponsored Research is provided by Noble Capital Markets, Inc., a FINRA and S.E.C. registered broker-dealer (B/D).
*Analyst certification and important disclosures included in the full report. NOTE: investment decisions should not be based upon the content of this research summary. Proper due diligence is required before making any investment decision.
– Total net sales of $146.6 million versus $145.4 million in prior year fourth quarter –
– Net income of $3.5 million versus $2.1 million in prior year fourth quarter –
– EBITDA of $8.6 million versus $7.3 million in prior year fourth quarter –
– Provides full-year outlook –
ST. PETERSBURG, Fla., March 03, 2026 (GLOBE NEWSWIRE) — Superior Group of Companies, Inc. (NASDAQ: SGC) (the “Company”), today announced its fourth quarter 2025 results.
“We finished the year with a solid fourth quarter, growing our consolidated revenues while simultaneously reducing expenses which resulted in 19% year-over-year EBITDA growth and earnings per share that nearly doubled,” said Michael Benstock, Chief Executive Officer. “In addition, our quarterly results again demonstrated the back-end weighted nature of our business, with 6% sequential top line growth and earnings per share up 28%. We’re pleased with our recent progress driving efficiencies and containing costs which will allow us to emerge from these uncertain times even stronger, and have today introduced our 2026 Outlook reflecting further growth anticipated for both revenue and EPS. This year we plan to expand our growing new business pipelines by capturing market share across our three attractive end markets with quality, innovative solutions, while leveraging our efficiencies and diverse supply base to further expand margins. Enabled by our strong balance sheet, returning capital to shareholders through our attractive dividend even while investing for future growth remains a pillar of our strategy in our quest to further enhance long-term shareholder value.”
Fourth Quarter Results
For the fourth quarter ended December 31, 2025, net sales increased to $146.6 million compared to fourth quarter 2024 net sales of $145.4 million. Pretax income increased to $4.1 million compared to $2.5 million in the fourth quarter of 2024. Net income increased to $3.5 million or $0.23 per diluted share compared to $2.1 million or $0.13 per diluted share for the fourth quarter of 2024.
2026 Full-Year Outlook
The Company forecasts full-year 2026 net sales in the range of $572 million to $585 million, up from 2025 net sales of $566.2 million, and forecasts full-year earnings per diluted share in the range of $0.54 to $0.66, up from $0.46 in 2025.
Webcast and Conference Call
The Company will host a webcast and conference call at 5:00 pm Eastern Time today. The live webcast and archived replay can be accessed in the investor relations section of the Company’s website at https://ir.superiorgroupofcompanies.com/Presentations. Interested individuals may also join the teleconference by dialing 1-844-861-5505 for U.S. dialers and 1-412-317-6586 for International dialers. The Canadian Toll-Free number is 1-866-605-3852. Please ask to be joined to the Superior Group of Companies call. A telephone replay of the teleconference will be available through March 17, 2026. To access the replay, dial 1-855-669-9658 in the United States and Canada or 1-412-317-0088 from international locations. Please reference conference number 6514610 for replay access.
Disclosure Regarding Forward Looking Statements
Certain matters discussed in this press release are “forward-looking statements” intended to qualify for the safe harbors from liability established by the Private Securities Litigation Reform Act of 1995. These forward-looking statements can generally be identified by use of the words “may,” “will,” “should,” “could,” “expect,” “anticipate,” “estimate,” “believe,” “intend,” “project,” “potential,” or “plan” or the negative of these words or other variations on these words or comparable terminology. Forward-looking statements in this press release may include, without limitation: (1) projections of revenue, income, and other items relating to our financial position and results of operations, including short-term and long-term plans for cash (2) statements of our plans, objectives, strategies, goals and intentions, (3) statements regarding the capabilities, capacities, market position and expected development of our business operations and (4) statements of expected industry and general economic trends.
Such forward-looking statements are subject to certain risks and uncertainties that may materially adversely affect the anticipated results. Such risks and uncertainties include, but are not limited to, the following: the impact of competition; uncertainties related to tariffs, duties, trade wars and related matters, supply disruptions, inflationary environments (including with respect to shipping costs and the cost of finished goods and raw materials and shipping costs), employment levels (including labor shortages), and general economic and political conditions in the areas of the world in which the Company operates or from which it sources its supplies or the areas of the United States of America (“U.S.” or “United States”) in which the Company’s customers are located; changes in the healthcare, retail chain, food service, transportation and other industries where uniforms and service apparel are worn; our ability to identify suitable acquisition targets, discover liabilities associated with such businesses during the diligence process, successfully integrate any acquired businesses, or successfully manage our expanding operations; the price and availability of raw materials; attracting and retaining senior management and key personnel; the Company’s ability to maintain effective internal control over financial reporting; and other factors described in the Company’s filings with the Securities and Exchange Commission, including those described in the “Risk Factors” section of our Annual Report on Form 10-K for the fiscal year ended December 31, 2025 entitled “Risk Factors”. Shareholders, potential investors and other readers are urged to consider these factors carefully in evaluating the forward-looking statements made herein and are cautioned not to place undue reliance on such forward-looking statements. The forward-looking statements made herein are only made as of the date of this press release and we disclaim any obligation to publicly update such forward-looking statements to reflect subsequent events or circumstances, except as may be required by law.
About Superior Group of Companies, Inc. (SGC):
Established in 1920, Superior Group of Companies is comprised of three attractive business segments each serving large, fragmented and growing addressable markets. Across Branded Products, Healthcare Apparel and Contact Centers, each segment enables businesses to create extraordinary brand engagement experiences for their customers and employees. SGC’s commitment to service, quality, advanced technology, and omnichannel commerce provides unparalleled competitive advantages. We are committed to enhancing shareholder value by continuing to pursue a combination of organic growth and strategic acquisitions. For more information, visit www.superiorgroupofcompanies.com.
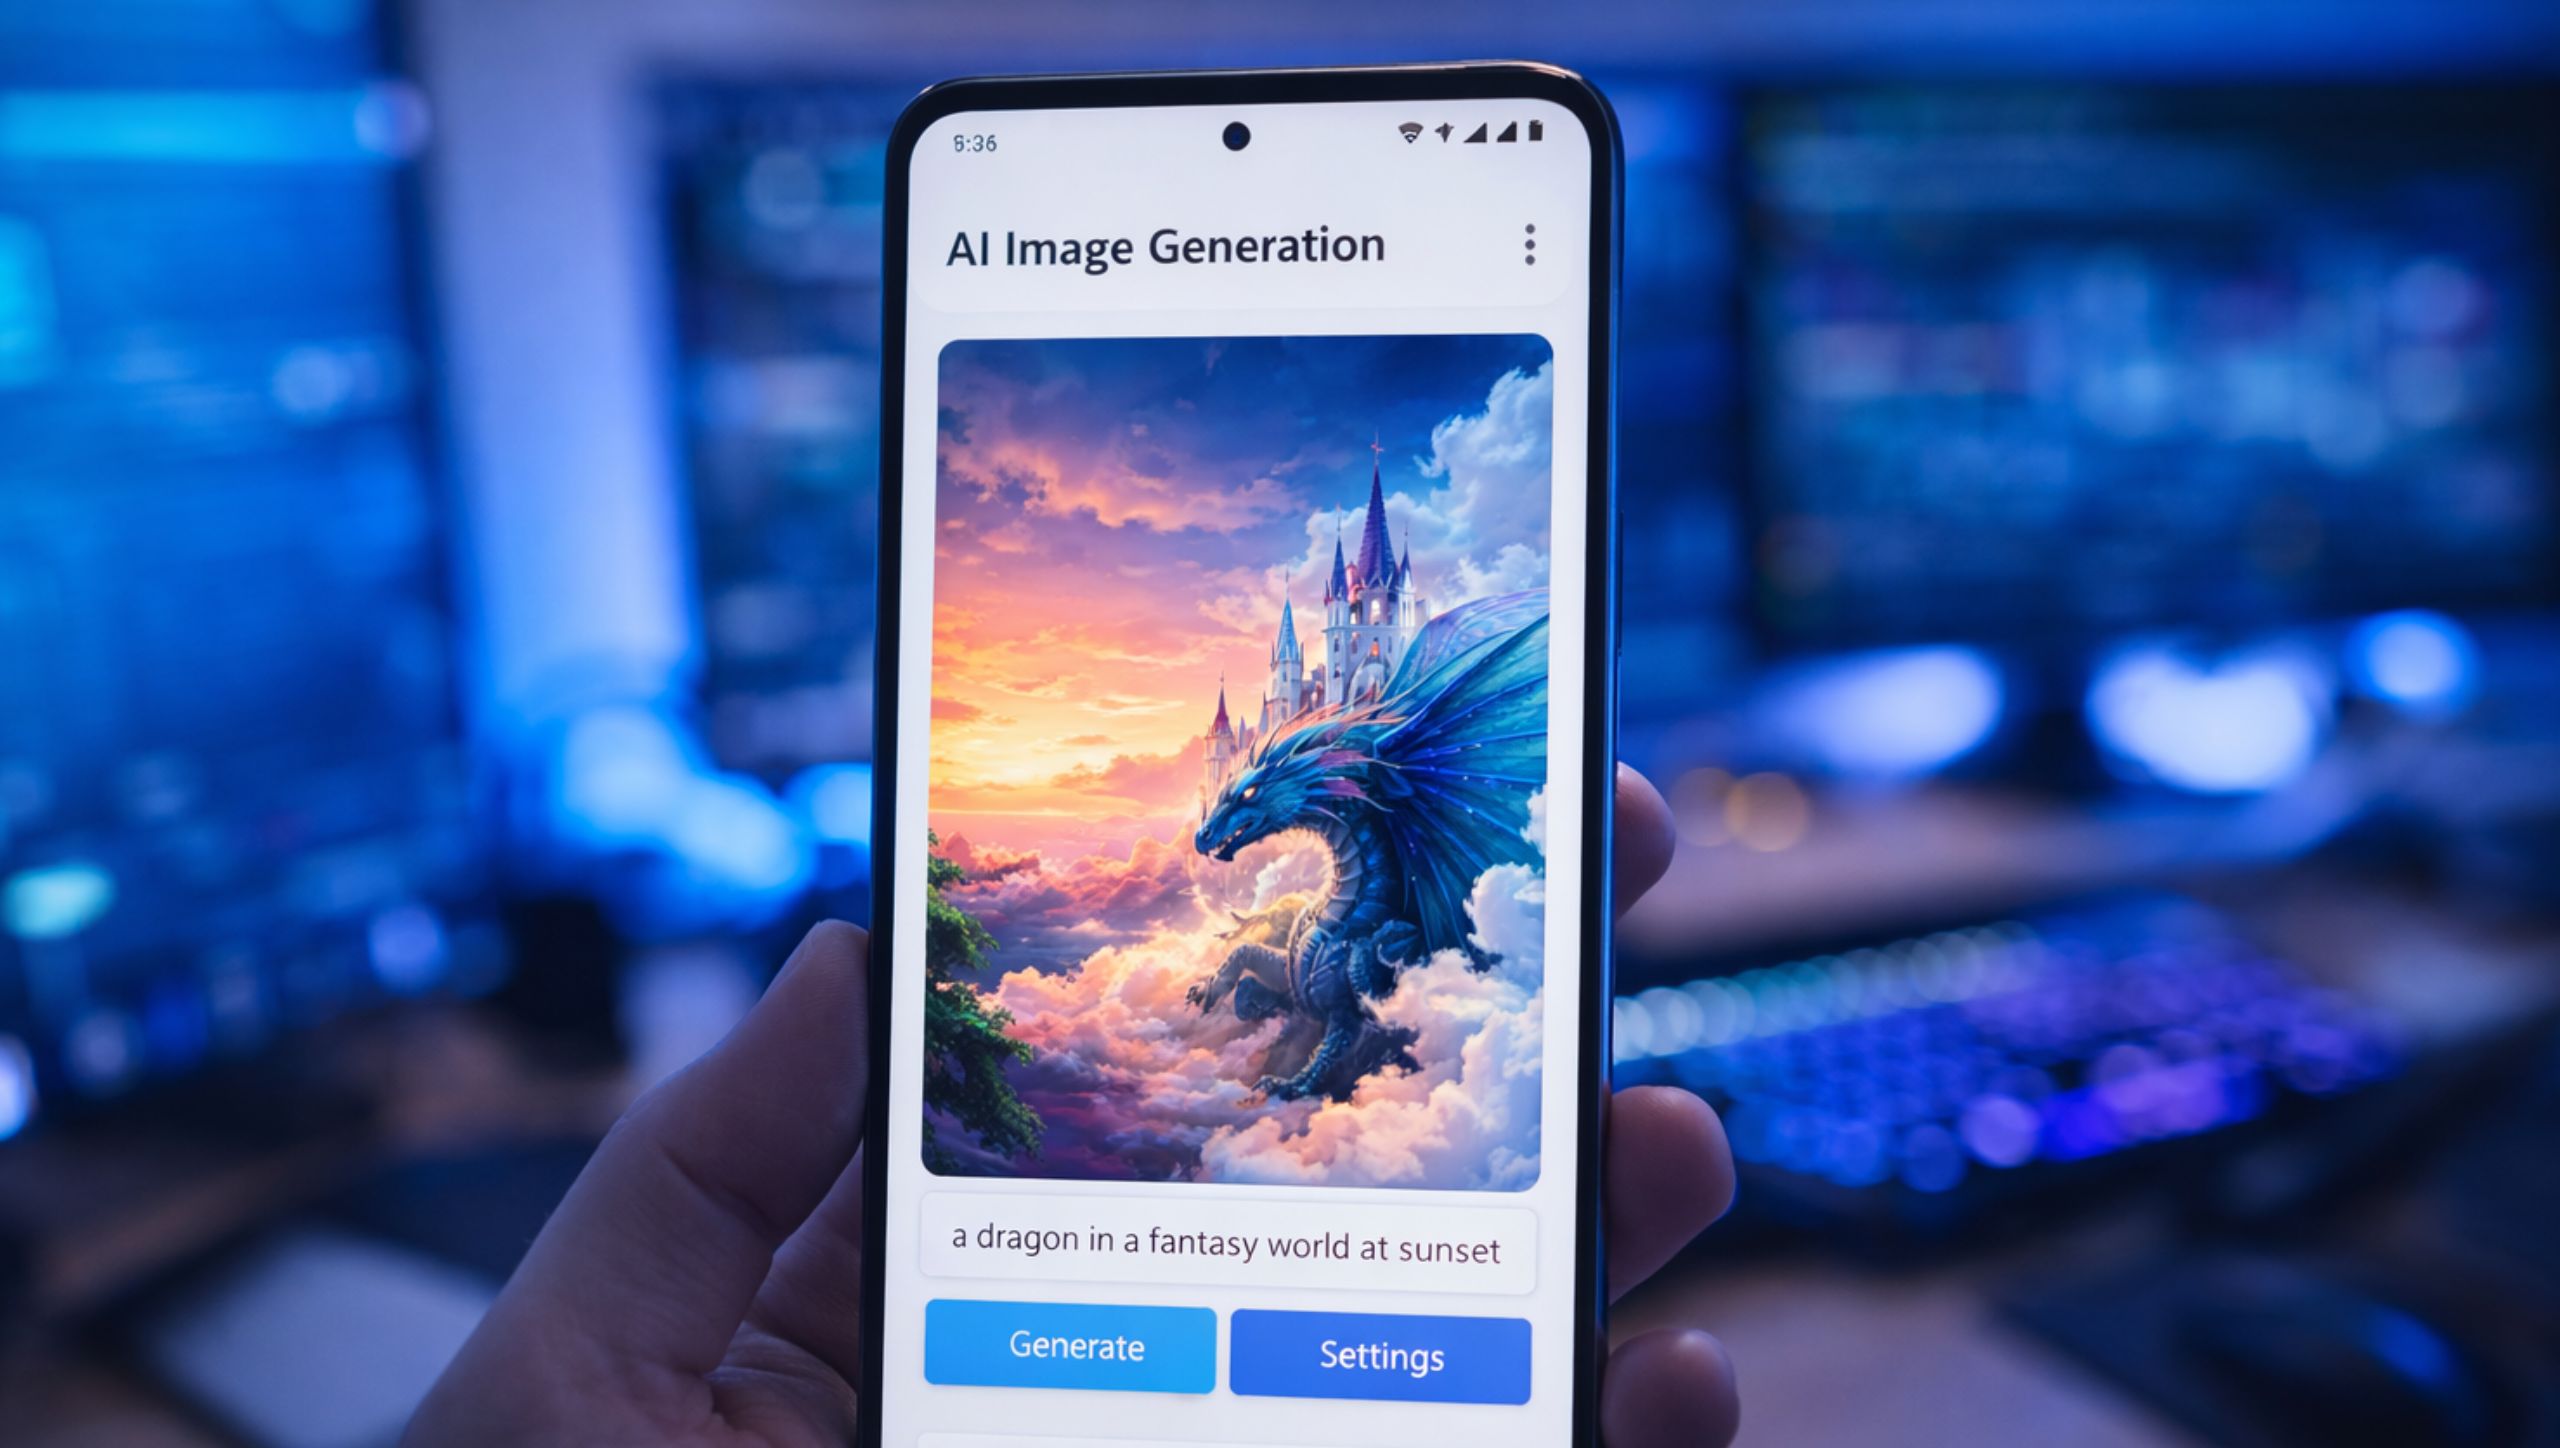
Google is doubling down on generative AI with the launch of Nano Banana 2, the latest version of its viral AI image generator. The update, announced Thursday, is designed to make the tool faster, more precise and better at rendering text — a key improvement for use cases such as marketing mockups, greeting cards and branded visuals. The rollout underscores how aggressively large technology platforms are iterating in the increasingly competitive AI image and video market.
Shares of Alphabet traded lower alongside the broader tech market, but the Nano Banana refresh highlights the company’s continued push to integrate generative AI deeper into its Gemini ecosystem.
Nano Banana first launched in August and quickly gained traction online as users shared AI-generated images across social platforms. Google followed with Nano Banana Pro in November, built on Gemini 3 Pro, targeting higher-fidelity and more accuracy-sensitive use cases.
Nano Banana 2 is now positioned as the speed-optimized successor.
According to Google, the new model incorporates “advanced world knowledge,” pulling real-time information from Gemini to produce more accurate visual renderings. The company emphasized three primary upgrades: faster generation, improved instruction-following and more precise text rendering inside images — an area where AI image models have historically struggled.
While Nano Banana Pro will remain available for high-fidelity tasks requiring maximum factual precision, Nano Banana 2 is being positioned for rapid creation and integrated image-search grounding. The new version will replace its predecessor across Gemini’s Fast, Thinking and Pro tiers.
The move comes as AI image and video tools are becoming mainstream consumer products. Users can now generate increasingly sophisticated visuals from simple text prompts, blurring the line between professional and consumer-grade creative tools.
Competition in the space is intensifying.
OpenAI launched its video-generation model Sora in 2024, drawing massive demand. Adobe has continued expanding Firefly, integrating generative AI across its creative software suite. ByteDance has also introduced its Seedance video-generation tool, though it has faced legal scrutiny from major studios over alleged intellectual property violations.
The rapid adoption of AI creative tools has also fueled debate around copyright, training data and the protection of original content. Media and entertainment companies have raised concerns that generative models may infringe on protected works, increasing regulatory and legal uncertainty across the sector.
For investors, Google’s Nano Banana 2 rollout highlights a broader capital allocation theme in 2026: speed of iteration is becoming a competitive advantage in AI.
Large platforms are not only investing heavily in infrastructure — such as GPUs and data centers — but are also racing to deliver user-facing AI products that drive engagement, subscription upgrades and enterprise adoption.
The generative AI market is still in its early innings. However, with major players rolling out new versions in rapid succession, product cycles are shortening, and differentiation is increasingly tied to performance, reliability and integration with broader ecosystems.
Nano Banana 2 may be an incremental upgrade. But in today’s AI arms race, incremental improvements — delivered quickly — can shape market leadership.
Patrick McCann, CFA, Research Analyst, Noble Capital Markets, Inc.
Michael Kupinski, Director of Research, Equity Research Analyst, Digital, Media & Technology , Noble Capital Markets, Inc.
Refer to the full report for the price target, fundamental analysis, and rating.
Q4 results. Perfect reported Q4 revenue of $18.1 million, up 14.2% Y/Y and largely in line with our estimate of $18.2 million, while adj. EBITDA of $1.4 million exceeded our forecast of $1.0 million, representing 8% margins. Excluding a one-time goodwill write-off, the company would have generated operating income, underscoring improving cost discipline and operating leverage.
B2C momentum the primary growth driver. Management noted that strong demand for AI-powered content creation is driving engagement across the YouCam app portfolio. Generative AI photo and video tools remain key contributors, and we believe Perfect’s expertise with these technologies positions it well to benefit from sustained demand for personalized, AI-enabled digital experiences.
Equity Research is available at no cost to Registered users of Channelchek. Not a Member? Click ‘Join’ to join the Channelchek Community. There is no cost to register, and we never collect credit card information.
This Company Sponsored Research is provided by Noble Capital Markets, Inc., a FINRA and S.E.C. registered broker-dealer (B/D).
*Analyst certification and important disclosures included in the full report. NOTE: investment decisions should not be based upon the content of this research summary. Proper due diligence is required before making any investment decision.
Travelzoo® provides its 30 million members with exclusive offers and one-of-a-kind experiences personally reviewed by our deal experts around the globe. We have our finger on the pulse of outstanding travel, entertainment, and lifestyle experiences. We work in partnership with more than 5,000 top travel suppliers—our long-standing relationships give Travelzoo members access to irresistible deals.
Michael Kupinski, Director of Research, Equity Research Analyst, Digital, Media & Technology , Noble Capital Markets, Inc.
Jacob Mutchler, Research Associate, Noble Capital Markets, Inc.
Refer to the full report for the price target, fundamental analysis, and rating.
Softer than expected Q4 Results. The company reported Q4 revenue of $22.5 million, an increase of 9%, and adj. EBITDA of $1.0 million, both of which were below our estimates of $23.0 million and $3.3 million, respectively. Importantly, the modestly softer than expected results were largely driven by weakness in advertising and commerce revenue. Increased marketing spend and elevated G&A expenses due to a non-recurring corporate event adversely affected EBITDA.
Customer acquisition efficiency. Customer acquisition costs averaged $34 per member in Q4, compared to $28 in Q1, $38 in Q2, and $40 in Q3, reflecting continued investment in subscriber growth. Management highlighted rapid payback economics, with annual membership fees collected upfront and supplemented by transaction revenue. Acquisition costs are expensed immediately, impacting near-term profitability, though the strategy is intended to expand recurring revenue and strengthen the advertising platform over time.
Equity Research is available at no cost to Registered users of Channelchek. Not a Member? Click ‘Join’ to join the Channelchek Community. There is no cost to register, and we never collect credit card information.
This Company Sponsored Research is provided by Noble Capital Markets, Inc., a FINRA and S.E.C. registered broker-dealer (B/D).
*Analyst certification and important disclosures included in the full report. NOTE: investment decisions should not be based upon the content of this research summary. Proper due diligence is required before making any investment decision.
ST. PETERSBURG, Fla., Feb. 05, 2026 (GLOBE NEWSWIRE) — The Board of Directors of Superior Group of Companies, Inc. (NASDAQ: SGC) today announced that it has declared a quarterly dividend of $0.14 per share, payable February 27, 2026, to shareholders of record as of February 16, 2026.
About Superior Group of Companies, Inc. (SGC): Established in 1920, Superior Group of Companies is comprised of three attractive business segments each serving large, fragmented and growing addressable markets. Across Healthcare Apparel, Branded Products and Contact Centers, each segment enables businesses to create extraordinary brand engagement experiences for their customers and employees. SGC’s commitment to service, quality, advanced technology, and omnichannel commerce provides unparalleled competitive advantages. We are committed to enhancing shareholder value by continuing to pursue a combination of organic growth and strategic acquisitions. For more information visit www.superiorgroupofcompanies.com.
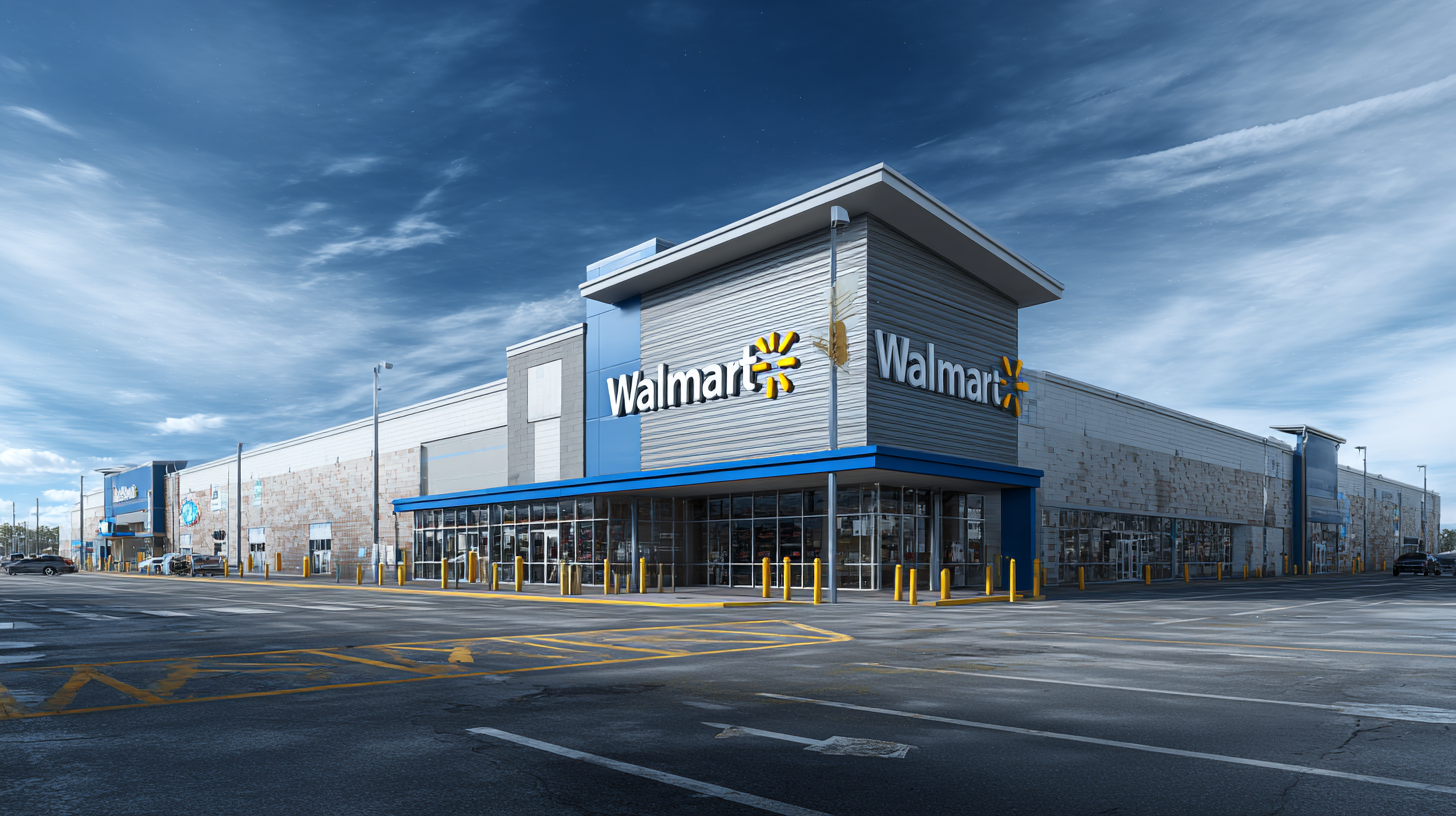
Walmart has officially joined the $1 trillion market-cap club, a milestone once reserved almost exclusively for Big Tech giants. Shares of the world’s largest retailer surged to record highs this week, pushing its valuation past the trillion-dollar mark for the first time in its 60-plus-year history. The move underscores a profound shift in how investors view Walmart—not merely as a defensive, low-margin retailer, but as a technology-enabled consumer platform built for the modern economy.
At the core of Walmart’s rise is its ability to thrive across economic cycles. While inflation and tighter budgets have driven value-conscious consumers toward lower prices, Walmart has simultaneously attracted higher-income shoppers through faster delivery, broader online assortments, and improved digital experiences. That rare ability to gain market share both up and down the income ladder has become one of its most powerful competitive advantages.
The transformation did not happen overnight. After lagging peers in e-commerce during the early 2000s, Walmart spent years rebuilding its digital foundation. Today, its online marketplace spans everything from groceries and household staples to luxury resale items and collectibles. More importantly, Walmart has built a fast-growing ecosystem around its core retail business, including advertising, membership programs, fulfillment services, and data-driven logistics—higher-margin segments that investors increasingly reward with premium valuations.
Technology is now central to Walmart’s strategy. The company has been aggressively deploying artificial intelligence across its operations to improve scheduling, inventory management, pricing, and supply-chain efficiency. Recent partnerships with Alphabet and OpenAI signal an ambition to embed Walmart directly into emerging AI-driven shopping workflows, allowing consumers to browse and purchase products through conversational platforms like ChatGPT and Google’s Gemini. These initiatives have helped reframe Walmart as a serious tech contender rather than a legacy retailer playing catch-up.
Investor confidence has followed. Walmart’s stock is up double digits this year, outperforming the broader market and earning a spot in the Nasdaq 100 Index—an unusual distinction for a consumer staples company. Analysts point to consistent execution, disciplined cost control, and management’s willingness to reinvest savings into price leadership as key drivers of continued momentum.
Still, the trillion-dollar valuation raises questions about how much upside remains. Walmart now trades at more than 40 times forward earnings, near all-time highs, leaving less room for error. Competition is intensifying as Amazon doubles down on speed and logistics, Aldi expands its U.S. footprint, and Target works to revive growth through design-focused merchandising. Execution missteps or slowing consumer demand could test investor patience.
Yet Walmart’s recent decision to raise full-year sales and profit guidance has helped quiet some concerns. Management continues to signal a conservative outlook, a strategy that has historically set the stage for earnings beats. With fourth-quarter results approaching, the market will be watching closely for confirmation that Walmart can sustain growth while justifying its premium multiple.
Ultimately, Walmart’s ascent into the trillion-dollar club reflects a broader reality: scale, data, logistics, and technology now matter as much in retail as they do in software. By combining everyday value with digital innovation, Walmart has rewritten its investment narrative—and in the process, secured its place among the most valuable companies on the planet.
For more than 45 years, 1-800-Flowers.com has offered truly original floral arrangements, plants and unique gifts to celebrate birthdays, anniversaries, everyday occasions, and seasonal holidays, and to deliver comfort during times of grief. Backed by a caring team obsessed with service, 1-800-Flowers.com provides customers thoughtful ways to express themselves and connect with the most important people in their lives. 1-800-Flowers.com is part of the 1-800-FLOWERS.COM, Inc. family of brands. Shares in 1-800-FLOWERS.COM, Inc. are traded on the NASDAQ Global Select Market, ticker symbol: FLWS.
Michael Kupinski, Director of Research, Equity Research Analyst, Digital, Media & Technology , Noble Capital Markets, Inc.
Jacob Mutchler, Research Associate, Noble Capital Markets, Inc.
Refer to the full report for the price target, fundamental analysis, and rating.
Difficult quarter. Fiscal Q2 revenue of $702.2 million declined by a disappointing 9.5%, but was in line with our conservative estimate of $702.0 million. Adj. EBITDA was $98.1 million, beating our estimate of $89.5 million by 9.6%. In our view, the results reflect the company’s initiative to focus on efficient use of marketing spend.
Cost actions are working, but benefits are not fully visible yet. Operating expenses declined meaningfully year over year, and the company has already achieved approximately $15 million in annualized run-rate cost savings. However, temporary consulting and incentive compensation costs related to the transformation are delaying the full earnings benefit. As these costs roll off, underlying profitability should improve.
Equity Research is available at no cost to Registered users of Channelchek. Not a Member? Click ‘Join’ to join the Channelchek Community. There is no cost to register, and we never collect credit card information.
This Company Sponsored Research is provided by Noble Capital Markets, Inc., a FINRA and S.E.C. registered broker-dealer (B/D).
*Analyst certification and important disclosures included in the full report. NOTE: investment decisions should not be based upon the content of this research summary. Proper due diligence is required before making any investment decision.