CULVER CITY, Calif., March 14, 2024 (GLOBE NEWSWIRE) — Snail, Inc. (Nasdaq: SNAL) (“Snail Games” or “the Company”), a leading global independent developer and publisher of interactive digital entertainment, recently shared the latest significant update for Survivor Mercs, an Early Access rogue-lite action game. This update introduces enhancements that deepen strategic gameplay and enrich the player experience, bringing Survivor Mercs closer to the release of its full 1.0 version. These improvements not only enhance the player experience but also aim to expand the game’s market appeal.
Launched in Early Access in September 2023 by Snail Games’ indie publishing arm Wandering Wizard, in collaboration with the developer Wolpertinger Games, Survivor Mercs has captivated players with its unique blend of rogue-lite action and shooter genres. Since its launch, Wolpertinger and Snail Games have been committed to continuously enhancing Survivor Mercs with new content, features, and improvements. The latest update, version 0.9.9, introduces comprehensive gameplay mechanics enhancements, including the Genome Lab 2.0 for Trait research, the Gene Synthesizer room for tailoring Commanders’ Traits, an innovative Armor System, enhanced enemy AI, performance optimizations, and UI improvements for a seamless and enriched gameplay experience.
“We are thrilled to announce this major update for Survivor Mercs, marking a significant step in the game’s development,” said Jim Tsai, CEO of Snail, Inc. “By enhancing gameplay mechanics and integrating community feedback into our development process, we continue to strengthen our market appeal and reaffirm our player-first approach. As we move closer to the full 1.0 launch of Survivor Mercs, we are excited about its potential to broaden our market and player reach. Our commitment to supporting indie developers and offering high-quality gaming experiences to players around the world remains steadfast.”
Play Survivor Mercs on Steam Learn more on Discord
About Snail, Inc.- https://www.snailgamesusa.com/ Snail is a leading, global independent developer and publisher of interactive digital entertainment for consumers around the world, with a premier portfolio of premium games designed for use on a variety of platforms, including consoles, PCs and mobile devices.
Wandering Wizard- https://wanderingwizard.com/ Wandering Wizard is an indie publishing label by Snail Games. The new branch is dedicated to bringing independent western developed games to the global market. Wandering Wizard is based in Los Angeles, California.
Forward Looking Statements This press release contains statements that constitute forward-looking statements. Many of the forward-looking statements contained in this press release can be identified by the use of forward-looking words such as “anticipate,” “believe,” “could,” “expect,” “should,” “plan,” “intend,” “may,” “predict,” “continue,” “estimate” and “potential,” or the negative of these terms or other similar expressions. Forward-looking statements appear in a number of places in this press release and include, but are not limited to, statements regarding Snail’s intent, belief or current expectations.
Michael Kupinski, Director of Research, Equity Research Analyst, Digital, Media & Technology , Noble Capital Markets, Inc.
Patrick McCann, CFA, Research Analyst, Noble Capital Markets, Inc.
Refer to the full report for the price target, fundamental analysis, and rating.
Posts strong Q4 results. Q4 revenues increased a solid 15.2% to $59.7 million, nicely above our $56.2 million estimate. In addition, gross profit margins were strong at 53.1% (above our 48.4% estimate), supporting better than expected adj. EBITDA ($13.6 million versus our estimate of $10.4 million).
Prepares for cookie-less world. Management indicated that it is working with Google and has visibility into a cookie-less future. Google has already deprecated cookies in 1% of its Chrome users and is expected to complete the transition in the third quarter 2024. Given that AdTheorent does not rely on consumer IDs, we believe that the company is well positioned to benefit in a post cookie environment.
Equity Research is available at no cost to Registered users of Channelchek. Not a Member? Click ‘Join’ to join the Channelchek Community. There is no cost to register, and we never collect credit card information.
This Company Sponsored Research is provided by Noble Capital Markets, Inc., a FINRA and S.E.C. registered broker-dealer (B/D).
*Analyst certification and important disclosures included in the full report. NOTE: investment decisions should not be based upon the content of this research summary. Proper due diligence is required before making any investment decision.
Saga Communications, Inc. is a broadcast company whose business is primarily devoted to acquiring, developing and operating radio stations. Saga currently owns or operates broadcast properties in 27 markets, including 79 FM and 33 AM radio stations. Saga’s strategy is to operate top billing radio stations in mid sized markets, defined as markets ranked (by market revenues) from 20 to 200. Saga’s radio stations employ a myriad of programming formats, including Active Rock, Adult Album Alternative, Adult Contemporary, Country, Classic Country, Classic Hits, Classic Rock, Contemporary Hits Radio, News/Talk, Oldies and Urban Contemporary. In operating its stations, Saga concentrates on the development of strong decentralized local management, which is responsible for the day-to-day operations of the stations in their market area and is compensated based on their financial performance as well as other performance factors that are deemed to effect the long-term ability of the stations to achieve financial objectives. Saga began operations in 1986 and became a publicly traded company in December 1992. The stock trades on NASDAQ under the ticker symbol “SGA”.
Michael Kupinski, Director of Research, Equity Research Analyst, Digital, Media & Technology , Noble Capital Markets, Inc.
Jacob Mutchler, Research Associate, Noble Capital Markets, Inc.
Refer to the full report for the price target, fundamental analysis, and rating.
Delivers good Q4 results. Total company revenues of $29.1 million was slightly better than our $28.5 million estimate. The Q4 revenue decline of a modest 3.3% was due to the absence of Political advertising. However, it was among the best in an industry which reflected revenue declines between 6% to 14% among its peers. Adj. EBITDA was $4.5 million versus our $4.0 million estimate.
Announces special dividend. The company declared its first variable dividend of $0.60 per share to be paid on April 5, 2024 with a record date of March 18, 2024. The dividend will be funded by cash on the company’s balance sheet. This variable dividend is in addition to the regular quarterly dividend and a recent $2 per share special dividend.
Equity Research is available at no cost to Registered users of Channelchek. Not a Member? Click ‘Join’ to join the Channelchek Community. There is no cost to register, and we never collect credit card information.
This Company Sponsored Research is provided by Noble Capital Markets, Inc., a FINRA and S.E.C. registered broker-dealer (B/D).
*Analyst certification and important disclosures included in the full report. NOTE: investment decisions should not be based upon the content of this research summary. Proper due diligence is required before making any investment decision.
Entravision Communications Corporation is a diversified Spanish-language media company utilizing a combination of television and radio operations to reach Hispanic consumers across the United States, as well as the border markets of Mexico. Entravision owns and/or operates 53 primary television stations and is the largest affiliate group of both the top-ranked Univision television network and Univision’s TeleFutura network, with television stations in 20 of the nation’s top 50 Hispanic markets. The Company also operates one of the nation’s largest groups of primarily Spanish-language radio stations, consisting of 48 owned and operated radio stations.
Michael Kupinski, Director of Research, Equity Research Analyst, Digital, Media & Technology , Noble Capital Markets, Inc.
Jacob Mutchler, Research Associate, Noble Capital Markets, Inc.
Refer to the full report for the price target, fundamental analysis, and rating.
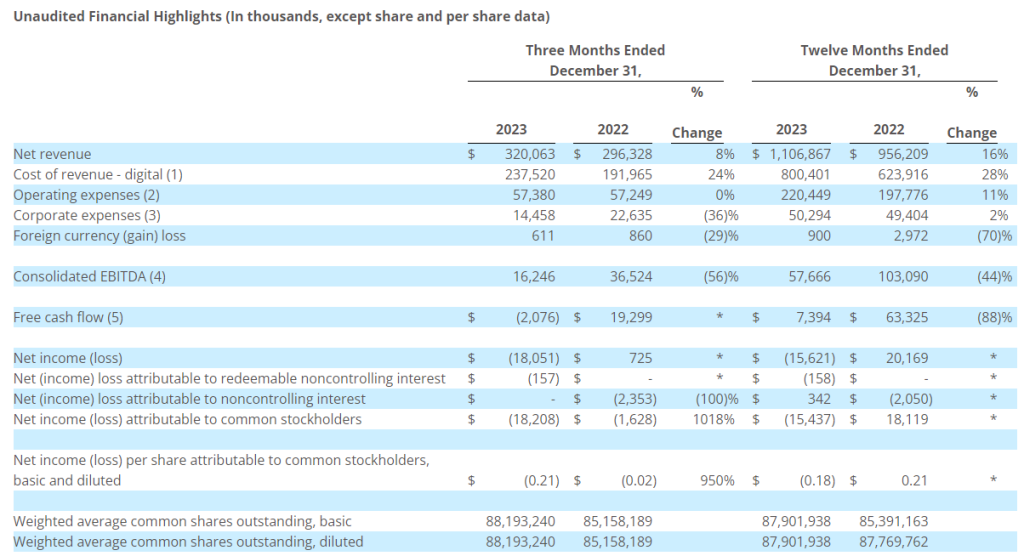
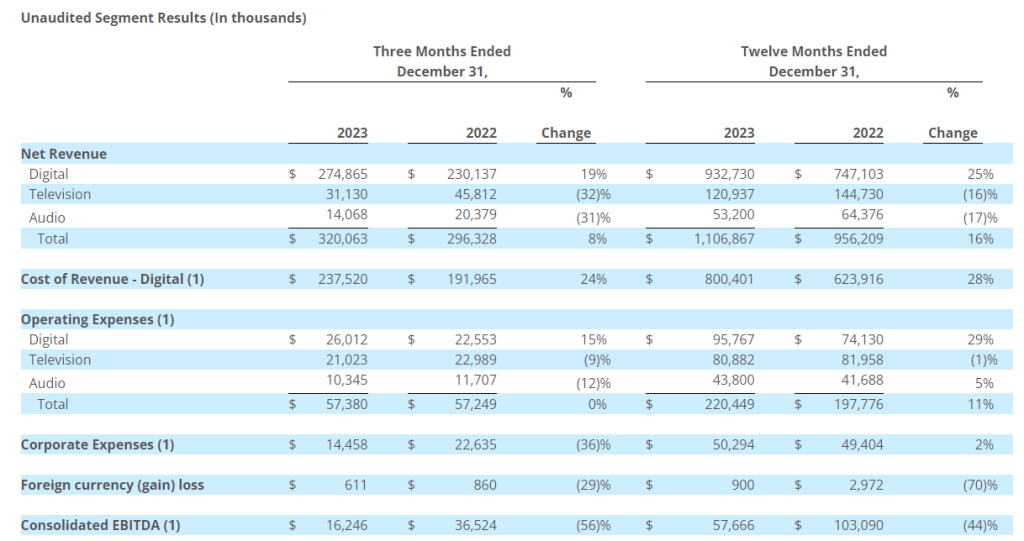
Mixed Q4 results. Total company Q4 revenue of $320.1 million, an increase of 8.0%, was better than our $309.7 million estimate, driven by 19% growth in its Digital businesses. Both TV and Radio declined in the quarter due to the absence of year earlier Political advertising. Q4 adj. EBITDA of $16.2 million was slightly below our $19.0 million estimate.
Meta takes its business in-house. The recent financial results were overshadowed by a late announcement that Meta plans to take its advertising sales in-house, ending its relationship with Entravision and all its sales partners. Meta accounted for roughly 52% of total company revenues and 40% of adj. EBITDA in 2023.
Equity Research is available at no cost to Registered users of Channelchek. Not a Member? Click ‘Join’ to join the Channelchek Community. There is no cost to register, and we never collect credit card information.
This Company Sponsored Research is provided by Noble Capital Markets, Inc., a FINRA and S.E.C. registered broker-dealer (B/D).
*Analyst certification and important disclosures included in the full report. NOTE: investment decisions should not be based upon the content of this research summary. Proper due diligence is required before making any investment decision.
Provides Update on Digital Commercial Partnership with Meta Platforms
Declares Quarterly Cash Dividend of $0.05 Per Share Payable on March 29, 2024
Company to Cancel Today’s Conference Call
SANTA MONICA, Calif.–(BUSINESS WIRE)– Entravision Communications Corporation (NYSE: EVC), a leading global advertising solutions, media and technology company, today announced financial results for the three- and twelve-month periods ended December 31, 2023, and provided an update on its digital commercial partnership with Meta Platforms. Entravision is canceling the conference call scheduled for 5 p.m. Eastern Time today.
Digital Commercial Partnerships Business Update
Through Entravision Global Partners, our digital commercial partnerships business, the Company acts as an intermediary between primarily global media companies and advertisers. These global media companies include Meta, for whom the Company acts as an Authorized Sales Partner (ASP), ByteDance, X Corp., Spotify, Snap and Pinterest, as well as other media companies, in 31 countries throughout the world.
On March 4, 2024, the Company received a communication from Meta that it intends to wind down its ASP program globally and end its relationship with all of its ASPs, including Entravision, by July 1, 2024. For full year 2023, the Company estimates Meta’s ASP program represented approximately $23.8 million of the Company’s $57.7 million total consolidated EBITDA and $586.4 million of the Company’s $1,106.9 million of total consolidated revenue. Entravision has initiated a review of its operating strategy and cost structure and will provide an update on associated plans as soon as practicable.
As of December 31, 2023, Entravision reported $118.9 million of cash and marketable securities. The Company is in compliance with all debt covenants under its current credit facility and, except for quarterly principal scheduled payments, has no maturities under that facility until March 17, 2028.
“While we are disappointed in Meta’s decision, we are confident in Entravision’s long-term opportunities given the strength of our advertising and marketing platforms and the need for our solutions globally. We are conducting an extensive review of our strategy and cost structure to reinforce our operating foundation and ensure we are best positioned to capitalize on Entravision’s global, market leading advertising, media and technology solutions. Our balance sheet is solid with a strong cash position to support the business as we navigate these changes,” said Michael Christenson, Chief Executive Officer.
(1)
Consists primarily of the costs of online media acquired from third-party publishers. Media cost is classified as cost of revenue in the period in which the corresponding revenue is recognized.
(2)
Operating expenses include direct operating and selling, general and administrative expenses. Included in operating expenses are $2.3 million and $2.8 million of non-cash stock-based compensation for the three-month periods ended December 31, 2023 and 2022, respectively, and $9.5 million and $5.7 million of non-cash stock-based compensation for the twelve-month periods ended December 31, 2023 and 2022, respectively.
(3)
Corporate expenses include $4.4 million and $9.2 million of non-cash stock-based compensation for the three-month periods ended December 31, 2023 and 2022, respectively, and $14.2 million and $14.3 million of non-cash stock-based compensation for the twelve-month periods ended December 31, 2023 and 2022, respectively.
(4)
Consolidated EBITDA means net income (loss) plus gain (loss) on sale of assets, depreciation and amortization, non-cash impairment charge, non-cash stock-based compensation included in operating and corporate expenses, net interest expense, other operating gain (loss), gain (loss) on debt extinguishment, income tax (expense) benefit, equity in net income (loss) of nonconsolidated affiliate, non-cash losses, syndication programming amortization less syndication programming payments, revenue from the Federal Communications Commission, or FCC, spectrum incentive auction less related expenses, expenses associated with investments, EBITDA attributable to redeemable noncontrolling interest, acquisitions and dispositions and certain pro-forma cost savings. We use the term consolidated EBITDA because that measure is defined in our 2017 Credit Agreement and 2023 Credit Agreement, and does not include gain (loss) on sale of assets, depreciation and amortization, non-cash impairment charge, non-cash stock-based compensation, net interest expense, other income (loss), gain (loss) on debt extinguishment, income tax (expense) benefit, equity in net income (loss) of nonconsolidated affiliate, non-cash losses, syndication programming amortization less syndication programming payments, revenue from FCC spectrum incentive auction less related expenses, expenses associated with investments, EBITDA attributable to redeemable noncontrolling interest, acquisitions and dispositions and certain pro-forma cost savings.
(5)
Free cash flow is defined as consolidated EBITDA less cash paid for income taxes, net interest expense, capital expenditures (less amounts reimbursed by landlord) and non-recurring cash expenses plus dividend income, and other operating gain (loss). Net interest expense is defined as interest expense, less non-cash interest expense relating to amortization of debt finance costs, and less interest income.
Net revenue for the fourth quarter and full year of 2023 increased primarily due to an increase in advertising revenue from our digital commercial partners business, and from various acquisitions, which did not fully contribute to our financial results in the comparable prior period. The increase was partially offset by a decrease in political advertising revenue in our television and audio segments.
Cost of revenue for the fourth quarter and full year of 2023 increased primarily due to the increase in digital advertising revenue.
Operating expenses for the fourth quarter of 2023 remained constant.
Operating expenses for the year ended December 31, 2023 increased primarily due to expenses associated with the increase in advertising revenue, increases in salary expense and non-cash stock-based compensation, rent expense, and expenses from various acquisitions, which did not fully contribute to our financial results in the comparable prior period.
Corporate expenses for the fourth quarter of 2023 decreased primarily due to non-recurring severance expense incurred in the fourth quarter of 2022 upon the passing of our former Chief Executive Officer, and due to a decrease in bonus expense.
Corporate expenses for the year ended December 31, 2023 increased primarily due to professional service fees, audit fees and rent expense, partially offset by a decrease in severance expense incurred in 2022 upon the passing of our former Chief Executive Officer, and due to a decrease in bonus expense.
Quarterly Cash Dividend
The Company announced today that its Board of Directors approved a quarterly cash dividend to shareholders of $0.05 per share on the Company’s Class A and Class U common stock, in an aggregate amount of $4.4 million. The quarterly dividend will be payable on March 29, 2024 to shareholders of record as of the close of business on March 15, 2024, and the common stock will trade ex-dividend on March 14, 2024. The Company currently anticipates that future cash dividends will be paid on a quarterly basis; however, any decision to pay future cash dividends will be subject to approval by the Board.
Non-GAAP Financial Measures
This press release contains certain non-GAAP financial measures as defined by SEC Regulation G. The GAAP financial measure most directly comparable to each of these non-GAAP financial measures, and a table reconciling each of these non-GAAP financial measures to its most directly comparable GAAP financial measure is included beginning on page 8.
Balance Sheet and Related Metrics
Cash and marketable securities as of December 31, 2023 totaled $118.9 million. Total debt as defined in the Company’s credit agreement was $210.6 million. Net of $50 million of cash and marketable securities, total leverage as defined in the Company’s credit agreement was 2.8 times as of December 31, 2023. Net of total cash and marketable securities, total leverage was 1.6 times.
(1)
Cost of revenue, operating expenses, corporate expenses, and consolidated EBITDA are defined on page 2.
About Entravision Communications Corporation
Entravision is a global advertising solutions, media and technology company. Over the past three decades, we have strategically evolved into a digital powerhouse, expertly connecting brands to consumers in the U.S., Latin America, Europe, Asia and Africa. Our digital segment, the company’s largest by revenue, offers a full suite of end-to-end advertising services. We have commercial partnerships with Meta, X Corp. (formerly known as Twitter), TikTok, and Spotify, and marketers can use our Smadex and other platforms to deliver targeted advertising to audiences around the globe. In the U.S., we maintain a diversified portfolio of television and radio stations that target Hispanic audiences and complement our global digital services. Entravision remains the largest affiliate group of the Univision and UniMás television networks. Shares of Entravision Class A Common Stock trade on the NYSE under ticker: EVC. Learn more about our offerings at entravision.com or connect with us on LinkedIn and Facebook.
Forward-Looking Statements
This press release contains certain forward-looking statements. These forward-looking statements, which are included in accordance with the safe harbor provisions of the Private Securities Litigation Reform Act of 1995, may involve known and unknown risks, uncertainties and other factors that may cause the Company’s actual results and performance in future periods to be materially different from any future results or performance suggested by the forward-looking statements in this press release. Although the Company believes the expectations reflected in such forward-looking statements are based upon reasonable assumptions, it can give no assurance that actual results will not differ materially from these expectations, and the Company disclaims any duty to update any forward-looking statements made by the Company. From time to time, these risks, uncertainties and other factors are discussed in the Company’s filings with the Securities and Exchange Commission.
Codere Online refers, collectively, to Codere Online Luxembourg, S.A. and its subsidiaries. Codere Online launched in 2014 as part of the renowned casino operator Codere Group. Codere Online offers online sports betting and online casino through its state-of-the art website and mobile application. Codere currently operates in its core markets of Spain, Italy, Mexico, Colombia, Panama and the City of Buenos Aires (Argentina). Codere Online’s online business is complemented by Codere Group’s physical presence throughout Latin America, forming the foundation of the leading omnichannel gaming and casino presence in the region.
Michael Kupinski, Director of Research, Equity Research Analyst, Digital, Media & Technology , Noble Capital Markets, Inc.
Patrick McCann, CFA, Research Analyst, Noble Capital Markets, Inc.
Refer to the full report for the price target, fundamental analysis, and rating.
Solid Q4 results. The company reported Q4 revenue of €50.1 million, handily beating our estimate of €39.0 million by 28.5%. Adj. EBITDA in the quarter was a loss of €4.1 million, better than our estimate of a loss of €6.2 million.
Growth in key markets. The company’s solid Q4 performance was driven by year over year revenue growth of 56% in Mexico and 17% in Spain. In both countries, the number of users and spend per customer increased compared with Q3. Notably, the company displayed year-over-year growth, in spite of tough comps in Q4 against such big events as the World Cup.
Equity Research is available at no cost to Registered users of Channelchek. Not a Member? Click ‘Join’ to join the Channelchek Community. There is no cost to register, and we never collect credit card information.
This Company Sponsored Research is provided by Noble Capital Markets, Inc., a FINRA and S.E.C. registered broker-dealer (B/D).
*Analyst certification and important disclosures included in the full report. NOTE: investment decisions should not be based upon the content of this research summary. Proper due diligence is required before making any investment decision.
Codere Online refers, collectively, to Codere Online Luxembourg, S.A. and its subsidiaries. Codere Online launched in 2014 as part of the renowned casino operator Codere Group. Codere Online offers online sports betting and online casino through its state-of-the art website and mobile application. Codere currently operates in its core markets of Spain, Italy, Mexico, Colombia, Panama and the City of Buenos Aires (Argentina). Codere Online’s online business is complemented by Codere Group’s physical presence throughout Latin America, forming the foundation of the leading omnichannel gaming and casino presence in the region.
Michael Kupinski, Director of Research, Equity Research Analyst, Digital, Media & Technology , Noble Capital Markets, Inc.
Patrick McCann, CFA, Research Analyst, Noble Capital Markets, Inc.
Refer to the full report for the price target, fundamental analysis, and rating.
Solid Q4 results. The company reported Q4 revenue of €50.1 million, handily beating our estimate of €39.0 million by 28.5%. Adj. EBITDA in the quarter was a loss of $4.1 million, better than our estimate of a loss of €6.2 million, illustrated in Figure #1 Q4 Results. The better than expected Q4 results were driven by strong revenue growth in Mexico and Spain.
Market performances. The company’s solid Q4 performance was driven by year over year revenue growth of 56% in Mexico and 17% in Spain. In both Mexico and Spain, the number of users and spend per customer increased compared with Q3. Notably, the company displayed strong year-over-year growth, in spite of tough comps in Q4 against such big events as the World Cup.
Equity Research is available at no cost to Registered users of Channelchek. Not a Member? Click ‘Join’ to join the Channelchek Community. There is no cost to register, and we never collect credit card information.
This Company Sponsored Research is provided by Noble Capital Markets, Inc., a FINRA and S.E.C. registered broker-dealer (B/D).
*Analyst certification and important disclosures included in the full report. NOTE: investment decisions should not be based upon the content of this research summary. Proper due diligence is required before making any investment decision.
Total revenue was €46.9 mm in Q4 2023, while net gaming revenue1 was €50.1 mm in the period, 32% and 33% above those from Q4 2022, respectively.
Mexico revenue was €22.6 mm in Q4 2023, while net gaming revenue1 was €25.1 mm in the period, 54% above Q4 2022.
Spain revenue (and net gaming revenue) reached €20.8 mm in Q4 2023, 17% above Q4 2022.
Net loss was €1.0 mm in Q4 2023 versus a net loss of €17.4 mm in Q4 2022.
Total cash position of €41 mm as of December 31, 2023.
Providing full year 2024 net gaming revenue outlook of €185-200 mm and expect to generate positive Adjusted. EBITDA and cash flow.
Madrid, Spain and Tel Aviv, Israel, February 29, 2024 – (GLOBE NEWSWIRE) Codere Online (Nasdaq: CDRO / CDROW, the “Company”), a leading online gaming operator in Spain and Latin America, has released its preliminary unaudited2 financial results for the fourth quarter and year ended December 31, 2023.
Below are the main financial and operating metrics of the period.
Quarter ended December 31
Year ended December 31
2022
2023
Chg. %
2022
2023
Chg. %
Net Gaming Revenue (EUR mm)1
Spain
17.8
20.8
17%
60.0
75.7
26%
Mexico
16.3
25.1
54%
51.1
81.7
60%
Colombia
2.3
2.3
–
7.9
8.5
8%
Other
1.3
1.8
38%
3.9
6.0
54%
Total
37.7
50.1
33%
122.9
171.9
40%
Avg. Monthly Active Players (000s)3
Spain
41.3
47.4
15%
38.1
42.3
11%
Mexico
50.8
59.1
16%
38.5
52.5
37%
Colombia
38.5
23.0
(40%)
28.7
24.3
(15%)
Other
11.2
9.6
(14%)
7.9
9.2
17%
Total
141.8
139.2
(2%)
113.1
128.3
13%
Aviv Sher, CEO of Codere Online, stated, “In Q4 2023 we delivered an impressive 33% growth in net gaming revenue to €50 million, our highest ever quarterly figure, despite a tough comp with the World Cup in the prior year period. Our strategic focus on Mexico and Spain, where we are seeing a strong return on marketing investment, has proven successful, with significant increases in both our active customer base and spend per customer. Casino continued to exceed our expectations with a second consecutive quarter contributing 58% of total net gaming revenue in the period.”
Mr. Sher further added, “Our net gaming revenue in Mexico grew by 54% in the fourth quarter, reaching more than €25 million, whereas net gaming revenue in Spain, grew by 17%, to nearly €21 million. We were able to grow our active customer base by more than 15% in both markets in the quarter which we believe is impressive considering the similar level of marketing investment in these countries in 2023 versus the prior year.”
Oscar Iglesias, CFO of Codere Online, stated, “Our fourth quarter results have allowed us to reach nearly €172 million of net gaming revenue for the full year, 19% above the midpoint of the initial €140-150 mm outlook we provided early last year. This outperformance, combined with the overall lower level of marketing investment, also allowed us to deliver a better than expected negative €12mm in Adjusted EBITDA versus the initial outlook of negative €20-30mm.”
Mr. Iglesias further added, “We are very encouraged by our performance in 2023 which further supports our expectation that we will generate positive Adjusted EBITDA and cash flow for the full year in 2024, a year in which we expect net gaming revenue of €185-200 mm. In short, we expect to deliver upon our original commitment to investors to be a profitable company in the third year after de-SPAC and are more committed than ever to creating meaningful value for our shareholders.”
Conference Call Information
Codere Online’s management will host a conference call to discuss the results and provide a business update at 8:30 am US Eastern Time today, February 29, 2024. Dial-in details as well as the audio webcast and presentation will be accessible on Codere Online’s website at www.codereonline.com. A recording of the webcast will also be available following the conference call.
Reconciliation of Revenue (IFRS) to Net Gaming Revenue (non-IFRS)
Quarter ended December 31
Year ended December 31
Figures in EUR mm
2022
2023
Chg. %
2022
2023
Chg. %
Total
Revenue
35.6
46.9
32%
115.7
162.6
41%
(+) Accounting Adjustments4
2.1
3.1
48%
7.2
9.2
28%
Net Gaming Revenue
37.7
50.1
33%
122.9
171.9
40%
Spain
Revenue
17.8
20.8
17%
60.0
75.7
26%
(+) Accounting Adjustments4
–
–
n.m.
–
–
n.m.
Net Gaming Revenue
17.8
20.8
17%
60.0
75.7
26%
Mexico
Revenue
14.5
22.6
56%
45.5
73.3
61%
(+) Accounting Adjustments4
1.8
2.5
39%
5.6
8.4
50%
Net Gaming Revenue
16.3
25.1
54%
51.1
81.7
60%
Colombia
Revenue
2.4
2.8
17%
7.0
9.3
33%
(+) Accounting Adjustments4
(0.1)
(0.5)
n.m.
0.9
(0.8)
n.m.
Net Gaming Revenue
2.3
2.3
–
7.9
8.5
8%
Other
Revenue
0.9
0.7
(22%)
3.2
4.4
38%
(+) Accounting Adjustments4
0.4
1.1
n.m.
0.7
1.6
129%
Net Gaming Revenue
1.3
1.8
38%
3.9
6.0
54%
About Codere Online Codere Online refers, collectively, to Codere Online Luxembourg, S.A. and its subsidiaries. Codere Online launched in 2014 as part of the renowned casino operator Codere Group. Codere Online offers online sports betting and online casino through its state-of-the art website and mobile applications. Codere currently operates in its core markets of Spain, Mexico, Colombia, Panama and the City of Buenos Aires (Argentina). Codere Online’s online business is complemented by Codere Group’s physical presence in Spain and throughout Latin America, forming the foundation of the leading omnichannel gaming and casino presence.
About Codere Group Codere Group is a multinational group devoted to entertainment and leisure. It is a leading player in the private gaming industry, with four decades of experience and with presence in seven countries in Europe (Spain and Italy) and Latin America (Argentina, Colombia, Mexico, Panama, and Uruguay).
Note on Rounding. Due to decimal rounding, numbers presented throughout this report may not add up precisely to the totals and subtotals provided, and percentages may not precisely reflect the absolute figures.
Forward-Looking Statements Certain statements in this document may constitute “forward-looking statements” within the meaning of the “safe harbor” provisions of the United States Private Securities Litigation Reform Act of 1995. Forward-looking statements include, but are not limited to, statements regarding Codere Online Luxembourg, S.A. and its subsidiaries (collectively, “Codere Online”) or Codere Online’s or its management team’s expectations, hopes, beliefs, intentions or strategies regarding the future. In addition, any statements that refer to projections, forecasts or other characterizations of future events or circumstances, including any underlying assumptions, are forward-looking statements. The words “anticipate,” “believe,” “continue,” “could,” “estimate,” “expect,” “intends,” “may,” “might,” “plan,” “possible,” “potential,” “predict,” “project,” “should,” “would” and similar expressions may identify forward-looking statements, but the absence of these words does not mean that a statement is not forward-looking. Forward-looking statements in this document may include, for example, statements about Codere Online’s financial performance and, in particular, the potential evolution and distribution of its net gaming revenue; any prospective and illustrative financial information; and changes in Codere Online’s strategy, future operations and target addressable market, financial position, estimated revenues and losses, projected costs, prospects and plans.
These forward-looking statements are based on information available as of the date of this document and current expectations, forecasts and assumptions, and involve a number of judgments, risks and uncertainties. Accordingly, forward-looking statements should not be relied upon as representing Codere Online’s or its management team’s views as of any subsequent date, and Codere Online does not undertake any obligation to update forward-looking statements to reflect events or circumstances after the date they were made, whether as a result of new information, future events or otherwise, except as may be required under applicable securities laws.
As a result of a number of known and unknown risks and uncertainties, Codere Online’s actual results or performance may be materially different from those expressed or implied by these forward-looking statements. There may be additional risks that Codere Online does not presently know or that Codere Online currently believes are immaterial that could also cause actual results to differ from those contained in the forward-looking statements. Some factors that could cause actual results to differ include (i) changes in applicable laws or regulations, including online gaming, privacy, data use and data protection rules and regulations as well as consumers’ heightened expectations regarding proper safeguarding of their personal information, (ii) the impacts and ongoing uncertainties created by regulatory restrictions, changes in perceptions of the gaming industry, changes in policies and increased competition, and geopolitical events such as war, (iii) the ability to implement business plans, forecasts, and other expectations and identify and realize additional opportunities, (iv) the risk of downturns and the possibility of rapid change in the highly competitive industry in which Codere Online operates, (v) the risk that Codere Online and its current and future collaborators are unable to successfully develop and commercialize Codere Online’s services, or experience significant delays in doing so, (vi) the risk that Codere Online may never achieve or sustain profitability, (vii) the risk that Codere Online will need to raise additional capital to execute its business plan, which may not be available on acceptable terms or at all, (viii) the risk that Codere Online experiences difficulties in managing its growth and expanding operations, (ix) the risk that third-party providers, including the Codere Group, are not able to fully and timely meet their obligations, (x) the risk that the online gaming operations will not provide the expected benefits due to, among other things, the inability to obtain or maintain online gaming licenses in the anticipated time frame or at all, (xi) the risk that Codere Online is unable to secure or protect its intellectual property, and (xii) the possibility that Codere Online may be adversely affected by other political, economic, business, and/or competitive factors. Additional information concerning certain of these and other risk factors is contained in Codere Online’s filings with the U.S. Securities and Exchange Commission (the “SEC”). All subsequent written and oral forward-looking statements concerning Codere Online or other matters and attributable to Codere Online or any person acting on their behalf are expressly qualified in their entirety by the cautionary statements above.
Financial Information and Non-GAAP Financial Measures Codere Online’s financial statements are prepared in accordance with International Financial Reporting Standards as issued by the International Accounting Standards Board (“IFRS”), which can differ in certain significant respects from generally accepted accounting principles in the United States of America (“U.S. GAAP”).
This document includes certain financial measures not presented in accordance with U.S. GAAP or IFRS (“non-GAAP”), such as, without limitation, net gaming revenue and Adjusted EBITDA. These non-GAAP financial measures are not measures of financial performance in accordance with U.S. GAAP or IFRS and may exclude items that are significant in understanding and assessing Codere Online’s financial results. Therefore, these measures should not be considered in isolation or as an alternative to revenue, net income, cash flows from operations or other measures of profitability, liquidity or performance under U.S. GAAP or IFRS. You should be aware that Codere Online’s presentation of these measures may not be comparable to similarly-titled measures used by other companies. In addition, the audit of Codere Online’s financial statements in accordance with PCAOB standards, may impact how Codere Online currently calculates its non-GAAP financial measures, and we cannot assure you that there would not be differences, and such differences could be material.
Codere Online believes that the use of these non-GAAP financial measures provides an additional tool for investors to use in evaluating ongoing operating results and trends in comparing Codere Online’s financial measures with other similar companies, many of which present similar non-GAAP financial measures to investors. These non-GAAP financial measures are subject to inherent limitations as they reflect the exercise of judgments by management about which expense and income are excluded or included in determining these non-GAAP financial measures. Reconciliations of non-GAAP financial measures to their most directly comparable measure under IFRS are included herein.
This document may include certain projections of non-GAAP financial measures. Codere Online is unable to quantify certain amounts that would be required to be included in the most directly comparable U.S. GAAP or IFRS financial measures without unreasonable effort, due to the inherent difficulty and variability of accurately forecasting the occurrence and financial impact of the various adjusting items necessary for such comparable measures or such reconciliation that have not yet occurred, are out of our control, or cannot be reasonably predicted, ascertained or assessed, which could have a material impact on its future IFRS financial results. Consequently, no disclosure of estimated comparable U.S. GAAP or IFRS measures is included and no reconciliation of the forward-looking non-GAAP financial measures is included.
Use of Projections This document contains financial forecasts with respect to Codere Online’s business and projected financial results, including net gaming revenue and adjusted EBITDA. Codere Online’s independent auditors have not audited, reviewed, compiled or performed any procedures with respect to the projections for the purpose of their inclusion in this document, and accordingly, they did not express an opinion or provide any other form of assurance with respect thereto for the purpose of this document. These projections should not be relied upon as being necessarily indicative of future results. The assumptions and estimates underlying the prospective financial information are inherently uncertain and are subject to a wide variety of significant business, economic and competitive risks and uncertainties that could cause actual results to differ materially from those contained in the prospective financial information. See “Forward-Looking Statements” above. Accordingly, there can be no assurance that the prospective results are indicative of the future performance of Codere Online or that actual results will not differ materially from those presented in the prospective financial information. Inclusion of the prospective financial information in this document should not be regarded as a representation by any person that the results contained in the prospective financial information will be achieved.
For further information on the limitations and assumptions underlying these projections, please refer to Codere Online’s filings with the SEC.
Preliminary Information This document contains figures, financial metrics, statistics and other information that is preliminary and subject to change (the “Preliminary Information”). The Preliminary Information has not been audited, reviewed, or compiled by any independent registered public accounting firm. This Preliminary Information is subject to ongoing review including, where applicable, by Codere Online’s independent auditors. Accordingly, no independent registered public accounting firm has expressed an opinion or any other form of assurance with respect to the Preliminary Information. During the course of finalizing such Preliminary Information, adjustments to such Preliminary Information presented herein may be identified, which may be material. Codere Online undertakes no obligation to update or revise the Preliminary Information set forth in this document as a result of new information, future events or otherwise, except as otherwise required by law. The Preliminary Information may differ from actual results. Therefore, you should not place undue reliance upon this Preliminary Information. The Preliminary Information is not a comprehensive statement of financial results, and should not be viewed as a substitute for full financial statements prepared in accordance with IFRS. In addition, the Preliminary Information is not necessarily indicative of the results to be achieved in any future period.
No Offer or Solicitation This document does not constitute an offer to sell or the solicitation of an offer to buy any securities, nor will there be any sale of securities in any states or jurisdictions in which such offer, solicitation or sale would be unlawful prior to registration or qualification under the securities laws of any such jurisdiction. No offering of securities will be made except by means of a prospectus meeting the requirements of section 10 of the Securities Act of 1933, as amended, or an exemption therefrom.
Industry and Market Data In this document, Codere Online relies on and refers to certain information and statistics obtained from publicly available information and third-party sources, which it believes to be reliable. Codere Online has not independently verified the accuracy or completeness of any such publicly-available and third-party information, does not make any representation as to the accuracy or completeness of such data and does not undertake any obligation to update such data after the date of this document. You are cautioned not to give undue weight to such industry and market data.
Contacts:
Investors and Media Guillermo Lancha Director, Investor Relations and Communications Guillermo.Lancha@codere.com (+34)-628-928-152
1 Net Gaming Revenue is a non-IFRS measure. Please see reconciliation of Net Gaming Revenue to Revenue at the end of the report. 2 See “Preliminary Information” below. 3 Average Monthly Active Players include real money (i.e. exclude free bets) sports betting and casino actives. 4 Figures primarily reflect differences in recognition of revenue related to certain partner and affiliate agreements in place in Colombia, VAT impact from entry fees in Mexico and the impact from the application of inflation accounting (IAS 29) in Argentina.
Travelzoo® provides its 30 million members with exclusive offers and one-of-a-kind experiences personally reviewed by our deal experts around the globe. We have our finger on the pulse of outstanding travel, entertainment, and lifestyle experiences. We work in partnership with more than 5,000 top travel suppliers—our long-standing relationships give Travelzoo members access to irresistible deals.
Michael Kupinski, Director of Research, Equity Research Analyst, Digital, Media & Technology , Noble Capital Markets, Inc.
Jacob Mutchler, Research Associate, Noble Capital Markets, Inc.
Refer to the full report for the price target, fundamental analysis, and rating.
In Line Q4 results. Q4 revenues were $21.2 million, in line with our $21.8 million estimate. The results reflected disparity in performance, however, between North America (up 5%) and Europe (up 34%). Adj. EBITDA was $5.3 million versus our $4.7 million estimate.
Pent up travel demand. We believe that 2023 reflected another year of pent up travel demand by travel enthusiasts following the pandemic. The fourth quarter, however, indicated that the strong advertising demand may be waning, particularly in North America, possibly as travelers face economic challenges. North American revenue growth decelerated from 28% in Q3 to 5% in Q4.
Equity Research is available at no cost to Registered users of Channelchek. Not a Member? Click ‘Join’ to join the Channelchek Community. There is no cost to register, and we never collect credit card information.
This Company Sponsored Research is provided by Noble Capital Markets, Inc., a FINRA and S.E.C. registered broker-dealer (B/D).
*Analyst certification and important disclosures included in the full report. NOTE: investment decisions should not be based upon the content of this research summary. Proper due diligence is required before making any investment decision.
Cumulus Media (NASDAQ: CMLS) is an audio-first media company delivering premium content to over a quarter billion people every month — wherever and whenever they want it. Cumulus Media engages listeners with high-quality local programming through 406 owned-and-operated radio stations across 86 markets; delivers nationally-syndicated sports, news, talk, and entertainment programming from iconic brands including the NFL, the NCAA, the Masters, CNN, the AP, the Academy of Country Music Awards, and many other world-class partners across more than 9,500 affiliated stations through Westwood One, the largest audio network in America; and inspires listeners through the Cumulus Podcast Network, its rapidly growing network of original podcasts that are smart, entertaining and thought-provoking. Cumulus Media provides advertisers with personal connections, local impact and national reach through broadcast and on-demand digital, mobile, social, and voice-activated platforms, as well as integrated digital marketing services, powerful influencers, full-service audio solutions, industry-leading research and insights, and live event experiences. Cumulus Media is the only audio media company to provide marketers with local and national advertising performance guarantees. For more information visit www.cumulusmedia.com.
Michael Kupinski, Director of Research, Equity Research Analyst, Digital, Media & Technology , Noble Capital Markets, Inc.
Jacob Mutchler, Research Associate, Noble Capital Markets, Inc.
Refer to the full report for the price target, fundamental analysis, and rating.
Meets expectations. The company reported revenue of $221.3 million, which was in-line with our estimate of $220.6 million. Adj. EBITDA in the quarter was $22.8 million, beating our estimate of $20.5 million by 11.2%. Notably, digital revenues performed strongly in the quarter, growing 5.0% from the prior year period.
Q1 off to a lackluster start. Management provided total company advertising pacings to be down low single digits in the first quarter. While this is a significant sequential improvement from the 11.9% decrease in Q4 (which reflected the absence of Political), it is lackluster. The first quarter does not benefit from Political advertising, but the lackluster, high margin core and Network advertising will take a toll on margins. As such, we are lowering our Q1 revenue and adj. EBITDA estimates.
Equity Research is available at no cost to Registered users of Channelchek. Not a Member? Click ‘Join’ to join the Channelchek Community. There is no cost to register, and we never collect credit card information.
This Research is provided by Noble Capital Markets, Inc., a FINRA and S.E.C. registered broker-dealer (B/D).
*Analyst certification and important disclosures included in the full report. NOTE: investment decisions should not be based upon the content of this research summary. Proper due diligence is required before making any investment decision.
CULVER CITY, Calif., Feb. 27, 2024 (GLOBE NEWSWIRE) — Snail, Inc. (Nasdaq: SNAL) (“Snail Games” or the “Company”), a leading global independent developer and publisher of interactive digital entertainment, today announced its strategic integration of AI technology into its game development process, marking a significant step in gaming innovation.
By consistently evaluating the latest AI tools, Snail Games is introducing pivotal advancements in game development. The Company is transforming the art pipeline with cutting-edge text-to-3D model technology and pioneering the generation of resources and biomes on a planetary scale. These AI-driven innovations are not only enhancing development efficiency but also enabling the creation of more immersive and engaging gaming worlds. Central to Snail Games’ philosophy is the player-first approach, ensuring quality and cost optimization to deliver unparalleled, yet accessible gaming experiences.
This player-first approach is evident in Snail Games’ recent initiatives. The launch of Zombie Within, a horror-infused social deduction game, and the ARK Survival Ascended’s Premium Mods program both demonstrate the Company’s dedication to listening to player feedback and enriching player experiences through innovative development. Zombie Within continues the legacy of Snail’s popular social deduction game ‘West Hunt.’ Additionally, the Premium Mods program for ARK Survival Ascended represents a forward-thinking approach to community engagement, rewarding modder creativity and empowering player interaction. Offering creators an industry-leading 50% share of revenue generated, Snail Games aims to incentivize innovation and encourage the development of high-quality mods that enhance the gaming experience and gives players the opportunity to help shape the ARK franchise.
“Our evaluation and integration of AI technology into our development process is a step forward in our mission to deliver high-quality, engaging, and accessible games,” said Jim Tsai, CEO of Snail, Inc. “Our major endeavors are grounded in our player-first strategy and our exploration of new frontiers in game development.”
About Snail, Inc.
Snail, Inc. is a leading global independent developer and publisher of interactive digital entertainment for consumers around the world, with a premier portfolio of premium games designed for use on a variety of platforms, including consoles, PC’s and mobile devices.
Forward-Looking Statements
This press release contains statements that constitute forward-looking statements. Many of the forward-looking statements contained in this press release can be identified by the use of forward-looking words such as “anticipate,” “believe,” “could,” “expect,” “should,” “plan,” “intend,” “may,” “predict,” “continue,” “estimate” and “potential,” or the negative of these terms or other similar expressions. Forward-looking statements appear in a number of places in this press release and include, but are not limited to, statements regarding Snail’s intent, belief or current expectations. These forward-looking statements include information about possible or assumed future results of Snail’s business, financial condition, results of operations, liquidity, plans and objectives. The statements Snail makes regarding the following matters are forward-looking by their nature: growth prospects and strategies; launching new games and additional functionality to games that are commercially successful, including the launch of ARK: Survival Ascended, ARK: The Animated Series and ARK 2; expectations regarding significant drivers of future growth; its ability to retain and increase its player base and develop new video games and enhance existing games; competition from companies in a number of industries, including other game developers and publishers and both large and small, public and private Internet companies; its relationships with third-party platforms such as Xbox Live and Game Pass, PlayStation Network, Steam, Epic Games Store, the Apple App Store, the Google Play Store, My Nintendo Store and the Amazon Appstore; expectations for future growth and performance; and assumptions underlying any of the foregoing.
Gray Television is a multimedia company headquartered in Atlanta, Georgia. We are the nation’s largest owner of top-rated local television stations and digital assets in the United States. Our television stations serve 113 television markets that collectively reach approximately 36 percent of US television households. This portfolio includes 80 markets with the top-rated television station and 100 markets with the first and/or second highest rated television station. We also own video program companies Raycom Sports, Tupelo Honey, PowerNation Studios and Third Rail Studios.
Michael Kupinski, Director of Research, Equity Research Analyst, Digital, Media & Technology , Noble Capital Markets, Inc.
Jacob Mutchler, Research Associate, Noble Capital Markets, Inc.
Refer to the full report for the price target, fundamental analysis, and rating.
Q4 Results. The company reported Q4 revenue of $864.0 million, edging our estimate of $857.0 million by 0.8%. Notably, Adj. EBITDA in the quarter was a strong $216.0 million, surpassing our estimate of $189.0 million by 14.3%. The results are illustrated in Figure #1 Q4 Results. The quarter was driven by lower than expected operating expenses. Importantly, the company is anticipating a favorable influx of high margin political revenue in 2024.
2024 outlook. In our view, the company stands to benefit from several favorable factors in 2024. Notably, we are forecasting $655.0 million in high margin political revenue for full year 2024, which should aid the company in its debt reduction efforts. Additionally, the company’s production companies are guided to produce $110.0 million in revenue in 2024, a step up from $86 million in 2023. We believe there could be positive upside in our 2024 estimates.
Equity Research is available at no cost to Registered users of Channelchek. Not a Member? Click ‘Join’ to join the Channelchek Community. There is no cost to register, and we never collect credit card information.
This Research is provided by Noble Capital Markets, Inc., a FINRA and S.E.C. registered broker-dealer (B/D).
*Analyst certification and important disclosures included in the full report. NOTE: investment decisions should not be based upon the content of this research summary. Proper due diligence is required before making any investment decision.
The E.W. Scripps Company (NASDAQ: SSP) is a diversified media company focused on creating a better-informed world. As one of the nation’s largest local TV broadcasters, Scripps serves communities with quality, objective local journalism and operates a portfolio of 61 stations in 41 markets. The Scripps Networks reach nearly every American through the national news outlets Court TV and Newsy and popular entertainment brands ION, Bounce, Defy TV, Grit, ION Mystery, Laff and TrueReal. Scripps is the nation’s largest holder of broadcast spectrum. Scripps runs an award-winning investigative reporting newsroom in Washington, D.C., and is the longtime steward of the Scripps National Spelling Bee. Founded in 1878, Scripps has held for decades to the motto, “Give light and the people will find their own way.”
Michael Kupinski, Director of Research, Equity Research Analyst, Digital, Media & Technology , Noble Capital Markets, Inc.
Jacob Mutchler, Research Associate, Noble Capital Markets, Inc.
Refer to the full report for the price target, fundamental analysis, and rating.
Exceeds Q4 estimates. Q4 was solid, beating our revenue estimate by 3.8% and our adj. EBITDA estimate by 13.4%. Revenues were down 9.6% to $615.8 million due to the absence of year earlier Political and weak National advertising. Recent cost initiatives allowed the company to improve adj. EBITDA margins to 19.1% versus our 17.5% estimate.
Improving advertising trends. The company reported a 1% increase in Core advertising with a favorable outlook of flat to up 1% for the upcoming quarter. Furthermore, its Network business appears to be on the mend, with significantly higher (30%) scatter prices heading into an upfront season. Lastly, management provided guidance for Political that was higher than our estimate to a range of $210 million to $250 million.
Equity Research is available at no cost to Registered users of Channelchek. Not a Member? Click ‘Join’ to join the Channelchek Community. There is no cost to register, and we never collect credit card information.
This Research is provided by Noble Capital Markets, Inc., a FINRA and S.E.C. registered broker-dealer (B/D).
*Analyst certification and important disclosures included in the full report. NOTE: investment decisions should not be based upon the content of this research summary. Proper due diligence is required before making any investment decision.