Release – Cocrystal Pharma Presents Phase 1 Results for Pan-Viral Inhibitor CDI-988 at Department of Defense Medical Conference

Research News and Market Data on COCP

August 05, 2025

 Download as PDF

  • All CDI-988 doses, ranging from 100 mg to 1200 mg, in the Phase 1 study were well tolerated
  • Company expects to initiate Phase 1b study with CDI-988 in norovirus-infected healthy subjects later this year
  • Lack of approved norovirus treatments or vaccines creates critical unmet medical need

BOTHELL, Wash., Aug. 05, 2025 (GLOBE NEWSWIRE) — Cocrystal Pharma, Inc. (Nasdaq: COCP) announces the presentation of favorable safety and tolerability data from a randomized, double-blinded, placebo-controlled Phase 1 study with its oral, direct-acting pan-viral inhibitor CDI-988 at the 2025 Military Health System Research Symposium (MHSRS), being held August 4-7 in Kissimmee, Florida. The results support Cocrystal’s continued clinical development of CDI-988 as a potential norovirus prophylaxis and treatment.

In An Oral Pan-viral Protease Inhibitor for the Prevention and Treatment of Norovirus and Coronavirus Infections: Mechanism of Action and Phase 1 Study Results, Sam Lee, Ph.D., Cocrystal President and co-CEO, discussed findings from the CDI-988 Phase 1 single-ascending (SAD) and multiple-ascending (MAD) cohorts. Data indicate that all doses, ranging from 100 mg to 1200 mg, were well tolerated. Overall treatment-emergent adverse events among CDI-988 subjects were 28% (10/36) compared with 40% (4/10) among placebo subjects for the SAD cohorts, and 53% (19/36) and 92% (11/12), respectively, for the MAD cohorts. Headache was the most common adverse event. All subjects in the SAD cohorts and all but one in the MAD cohorts completed the study. No severe treatment-emergent adverse events, no clinically relevant ECG changes and no clinically significant pathology results were reported from the CDI-988 Phase 1 single-ascending (SAD) and multiple-ascending (MAD) cohorts.

“Consistent with interim results from the Phase 1 study, CDI-988 was well-tolerated with a favorable safety profile across all dose levels tested in this study,” said Dr. Lee. “Our plan to continue CDI-988’s clinical development for norovirus is particularly relevant for the military, where this highly transmissible pathogen poses significant operational and economic risks. In confined settings such as naval vessels and military installations, norovirus can rapidly spread, causing debilitating gastrointestinal symptoms that could compromise mission readiness.

“The absence of approved norovirus treatments or vaccines creates a critical unmet medical need,” he added. “Norovirus presents significant vaccine development challenges due to its high genetic variability and mutation rate. CDI-988’s mechanism of action targeting viral replication and its broad-spectrum coverage offers a promising solution as a potential prophylactic and therapeutic intervention across all norovirus genogroups including GII.4 and GII.17. This could be a new approach to outbreak prevention and management. We expect to initiate a Phase 1b challenge study with CDI-988 in norovirus-infected healthy subjects later this year.”

MHSRS is an annual educational symposium with approximately 4,000 attendees that provides a collaborative environment for military medical care providers with deployment experience, research and academic scientists, international partners and industry on research and related healthcare initiatives falling under the topic areas of combat casualty care, military operational medicine, clinical and rehabilitative medicine, information sciences, military infectious diseases and radiation health effects. More information is available here.

Pan-viral Protease Inhibitor CDI-988
CDI-988 was designed and developed with Cocrystal’s proprietary structure-based platform technology as a broad-spectrum inhibitor to a highly conserved region in the active site of 3CL viral proteases. Based on a novel mechanism of action and superior broad-spectrum antiviral activity, CDI-988 represents a compelling first potential oral treatment for noroviruses, and for coronaviruses.

Norovirus Infection
Norovirus is a common and highly contagious virus that afflicts people of all ages and causes symptoms of acute gastroenteritis including nausea, vomiting, stomach pain and diarrhea, as well as fatigue, fever and dehydration. Norovirus outbreaks occur most commonly in semi-closed communities such as hospitals, nursing homes, childcare facilities, cruise ships, schools and disaster relief sites. Norovirus infections are estimated to cost society approximately $60 billion annually worldwide.

Structure-Based Drug Discovery Platform Technology
Cocrystal’s proprietary structural biology, along with its expertise in enzymology and medicinal chemistry, enable its development of novel antiviral agents. The Company’s platform provides a three-dimensional structure of inhibitor complexes at near-atomic resolution, providing immediate insight to guide Structure Activity Relationships. This helps to identify novel binding sites and allows for a rapid turnaround of structural information through highly automated X-ray data processing and refinement. The goal of this technology is to facilitate the development of novel broad-spectrum antivirals for the treatment of acute and chronic viral diseases.

About Cocrystal Pharma, Inc.
Cocrystal Pharma, Inc. is a clinical-stage biotechnology company discovering and developing novel antiviral therapeutics that target the replication process of influenza viruses, coronaviruses (including SARS-CoV-2), noroviruses and hepatitis C viruses. Cocrystal employs unique structure-based technologies and Nobel Prize-winning expertise to create antiviral drugs. For further information about Cocrystal, please visit www.cocrystalpharma.com.

Cautionary Note Regarding Forward-Looking Statements
This press release contains forward-looking statements within the meaning of the Private Securities Litigation Reform Act of 1995, including statements regarding the potential efficacy of CDI-988 as a potential breakthrough for norovirus prophylaxis and treatment, and the potential characteristics of and market for such product candidate and the Company’s plan to initiate a Phase 1b study in 2025. The words “believe,” “may,” “estimate,” “continue,” “anticipate,” “intend,” “should,” “plan,” “could,” “target,” “potential,” “is likely,” “will,” “expect” and similar expressions, as they relate to us, are intended to identify forward-looking statements. We have based these forward-looking statements largely on our current expectations and projections about future events. Some or all of the events anticipated by these forward-looking statements may not occur. Important factors that could cause actual results to differ from those in the forward-looking statements include, but are not limited to, our need for additional capital to fund our operations over the next 12 months, risks relating to our ability to obtain regulatory approval for and proceed with clinical trials including recruiting volunteers and procuring materials for such studies by our clinical research organizations and vendors, the results of such studies, our and our collaboration partners’ technology and software performing as expected, general risks arising from clinical studies, receipt of regulatory approvals, regulatory changes, and potential development of effective treatments and/or vaccines by competitors, potential mutations in a virus we are targeting that may result in variants that are resistant to a product candidate we develop, the impact of the Trump Administration’s policies and actions on regulation affecting the FDA and other healthcare agencies and potential staffing issues resulting therefrom, as well as other government actions such as tariffs which may cause delays or force us to incur additional costs to proceed without development programs. Further information on our risk factors is contained in our filings with the SEC, including our Annual Report on Form 10-K for the year ended December 31, 2024. Any forward-looking statement made by us herein speaks only as of the date on which it is made. Factors or events that could cause our actual results to differ may emerge from time to time, and it is not possible for us to predict all of them. We undertake no obligation to publicly update any forward-looking statement, whether as a result of new information, future developments or otherwise, except as may be required by law.

Investor Contact:
Alliance Advisors IR
Jody Cain
310-691-7100
jcain@allianceadvisors.com

# # #

Primary Logo

Source: Cocrystal Pharma, Inc.

Released August 5, 2025

Release – Graham Corporation Reports First Quarter Fiscal 2026 Results

Research News and Market Data on GHM

August 05, 2025 6:30am EDT

First Quarter Fiscal 2026 Highlights:

  • Revenue increased 11% to $55.5 million, reflecting the strength of the Company’s product portfolio and diversified revenue base
  • Gross profit increased 19% to $14.7 million; Gross margin improved 170 basis points to 26.5%
  • Net income per diluted share increased 56% to $0.42; adjusted net income per diluted share1 increased 36% to $0.45
  • Net income increased 55% to $4.6 million; Adjusted EBITDA1 increased 33% to $6.8 million; Adjusted EBITDA margin1 improved 200 basis points to 12.3%  
  • Orders2 were $125.9 million, driven by large defense orders; Book-to-Bill ratio2 of 2.3x and backlog2 of $482.9 million
  • Strong balance sheet with no debt, $10.8 million in cash, and access to $44.3 million under its revolving credit facility at quarter end to support growth initiatives
  • Reiterating full year fiscal 2026 guidance for all metrics provided; Remain on track to reach strategic goal of 8% to 10% annual organic revenue growth and low to mid-teen Adjusted EBITDA margins by fiscal 2027

BATAVIA, N.Y.–(BUSINESS WIRE)– Graham Corporation (NYSE: GHM) (“GHM” or the “Company”), a global leader in the design and manufacture of mission critical fluid, power, heat transfer and vacuum technologies for the Defense, Energy & Process, and Space industries, today reported financial results for its first quarter for the fiscal year ending March 31, 2026 (“fiscal 2026”).

Graham’s President and Chief Executive Officer, Matthew J. Malone stated, “The start of fiscal 2026 demonstrates continued strength across our diversified product portfolio. We delivered strong growth in our Energy & Process markets, driven by execution on major commercial projects and robust aftermarket demand, along with increasing momentum in emerging energy segments such as small modular reactors (“SMRs”) and cryogenics. In addition, our Defense business continues to perform well, supported by recent follow-on orders, including $86.5 million to support the Virginia Class submarine program in May and $25.5 million for the MK48 Mod 7 Heavyweight Torpedo program in July, reaffirming our position as a trusted supplier to the U.S. Navy.”

Mr. Malone continued, “We remain focused on high-return initiatives that drive long-term value creation, including numerous in-process capital investments expected to generate returns above 20%. These initiatives include automated welding, enhanced radiographic testing technologies, and our new cryogenic testing facility in Florida, which we expect will improve margins and create new revenue opportunities. I’m also pleased to announce that we’ve completed the expansion of our Batavia defense facility this month. With these investments, we believe Graham is well-positioned to drive sustainable growth, deliver for our customers, and continue expanding margins.”

Quarterly net sales of $55.5 million increased 11%, or $5.5 million. Sales to the Energy & Process market contributed $5.7 million to growth driven by increased sales in the Chemical/Petrochemical and New Energy industries. The increase in Chemical/Petrochemical sales was largely due to a surface condenser order for a North American net-zero carbon emissions ethylene cracker received in June 2024, while the increase in New Energy sales was driven by increased sales to the hydrogen and SMR markets. Aftermarket sales to the Energy & Process and Defense markets of $10.4 million remained strong and were 33% higher than the prior year. See supplemental data for a further breakdown of sales by market and region.

Gross profit for the quarter increased $2.4 million to $14.7 million compared to the prior-year period of $12.4 million. As a percentage of sales, gross profit margin increased 170 basis points to 26.5%, compared to the first quarter of fiscal 2025. Increased leverage on fixed overhead costs due to the higher volume of sales discussed above, as well as an improved mix of sales related to higher margin aftermarket sales, and better execution and pricing on defense contracts were the primary drivers of this increase. For the first quarter of fiscal 2026, the impact of tariffs was not material to our consolidated financial statements in comparison to the prior year. However, we still estimate the range of potential impact of increased tariffs for the full year to be between $2 million to $5 million.

Selling, general and administrative expense (“SG&A”), including amortization, totaled $9.8 million, an increase of $0.6 million compared with the prior year. This increase reflects the investments we are making in our operations, our employees, and our technology. As a percentage of sales, SG&A, including amortization, of 17.7% decreased 90 basis points compared to the prior year period, reflective of our financial discipline.

Cash Management and Balance Sheet
As expected, cash used by operating activities totaled $2.3 million for the quarter-ending June 30, 2025, primarily due to the payment of fiscal 2025 bonuses including the supplemental Barber-Nichols earnout bonus of $4.3 million in connection with the acquisition. As of June 30, 2025, cash and cash equivalents were $10.8 million, compared with $21.6 million as of March 31, 2025.

Capital expenditures for the first quarter fiscal 2025 were $7.0 million, focused on capacity expansion, increasing capabilities, and productivity improvements. All major capital projects are on time.

The Company had no debt outstanding as of June 30, 2025, with $44.3 million available on its revolving credit facility after taking into account outstanding letters of credit.

Orders, Backlog, and Book-to-Bill Ratio
See supplemental data filed with the Securities and Exchange Commission on Form 8-K and provided on the Company’s website for a further breakdown of orders and backlog by market. See “Key Performance Indicators” below for important disclosures regarding Graham’s use of these metrics ($ in millions).

Orders for the first quarter of fiscal 2026 increased to $125.9 million, including the remaining $86.5 million of a $136.5 million follow-on order in support of the U.S. Navy’s Virginia Class Submarine program. Aftermarket orders for the Energy & Process and Defense markets remained strong and totaled $10.5 million for the first quarter of fiscal 2026, increasing 16% over the prior year. Book-to-bill for the first quarter of fiscal 2026 was 2.3x. Note that orders tend to be lumpy given the nature of our business (i.e. large capital projects) and in particular, orders to the Defense industry, which span multiple years and can be significantly larger in size.

Backlog at quarter end was $482.9 million, a 22% increase over the prior-year period. Approximately 35% to 40% of orders currently in backlog are expected to be converted to sales in the next twelve months, another 25% to 30% are expected to convert to sales within one to two years, and the remaining beyond two years. Approximately 87% of our backlog at June 30, 2025, was to the Defense industry, which we believe provides stability and visibility to our business.

Fiscal 2026 Outlook
Based upon the results for the first quarter of fiscal 2026, as well as our expectations for the remainder of the fiscal year, we are reiterating our full year fiscal 2026 guidance provided earlier this year as follows:

Our expectations for sales and profitability assume that we will be able to operate our production facilities at planned capacity, have access to our global supply chain including our subcontractors, do not experience any global disruptions, and experience no impact from any other unforeseen events.

Webcast and Conference Call
GHM’s management will host a conference call and live webcast on August 5, 2025 at 11:00 a.m. Eastern Time (“ET”) to review its financial results as well as its strategy and outlook. The review will be accompanied by a slide presentation, which will be made available immediately prior to the conference call on GHM’s investor relations website.

A question-and-answer session will follow the formal presentation. GHM’s conference call can be accessed by calling (412)-317-5195. Alternatively, the webcast can be monitored from the events section of GHM’s investor relations website.

A telephonic replay will be available from 3:00 p.m. ET today through Tuesday, August 12, 2025. To listen to the archived call, dial (412) 317-6671 and enter conference ID number 10201479 or access the webcast replay via the Company’s website at ir.grahamcorp.com, where a transcript will also be posted once available.

About Graham Corporation
Graham is a global leader in the design and manufacture of mission critical fluid, power, heat transfer and vacuum technologies for the Defense, Energy & Process, and Space industries. Graham Corporation and its family of global brands are built upon world-renowned engineering expertise in vacuum and heat transfer, cryogenic pumps, and turbomachinery technologies, as well as its responsive and flexible service and the unsurpassed quality customers have come to expect from the Company’s products and systems. Graham Corporation routinely posts news and other important information on its website, grahamcorp.com, where additional information on Graham Corporation and its businesses can be found.

Safe Harbor Regarding Forward Looking Statements
This news release contains forward-looking statements within the meaning of Section 27A of the Securities Act of 1933, as amended, and Section 21E of the Securities Exchange Act of 1934, as amended.

Forward-looking statements are subject to risks, uncertainties and assumptions and are identified by words such as “continue,” “expects,” “future,” “outlook,” “believes,” “could,” “guidance,” “may”, “will,” “plan” and other similar words. All statements addressing operating performance, events, or developments that Graham Corporation expects or anticipates will occur in the future, including but not limited to, profitability of future projects and the business, its ability to deliver to plan, its ability to continue to strengthen relationships with customers in the Defense industry, its ability to secure future projects and applications, expected expansion and growth opportunities, anticipated sales, revenues, adjusted EBITDA, adjusted EBITDA margins, capital expenditures and SG&A expenses, the timing of conversion of backlog to sales, orders, market presence, profit margins, tax rates, foreign sales operations, customer preferences, changes in market conditions in the industries in which it operates, changes in general economic conditions and customer behavior, forecasts regarding the timing and scope of the economic recovery in its markets, and its acquisition and growth strategy, are forward-looking statements. Because they are forward-looking, they should be evaluated in light of important risk factors and uncertainties. These risk factors and uncertainties are more fully described in Graham Corporation’s most recent Annual Report filed with the Securities and Exchange Commission (the “SEC”), included under the heading entitled “Risk Factors”, and in other reports filed with the SEC.

Should one or more of these risks or uncertainties materialize or should any of Graham Corporation’s underlying assumptions prove incorrect, actual results may vary materially from those currently anticipated. In addition, undue reliance should not be placed on Graham Corporation’s forward-looking statements. Except as required by law, Graham Corporation disclaims any obligation to update or publicly announce any revisions to any of the forward-looking statements contained in this news release.

Non-GAAP Financial Measures
Adjusted EBITDA is defined as consolidated net income (loss) before net interest expense, income taxes, depreciation, amortization, other acquisition related expenses, and other unusual/nonrecurring expenses. Adjusted EBITDA margin is defined as Adjusted EBITDA as a percentage of sales. Adjusted EBITDA and Adjusted EBITDA margin are not measures determined in accordance with generally accepted accounting principles in the United States, commonly known as GAAP. Nevertheless, Graham believes that providing non-GAAP information, such as Adjusted EBITDA and Adjusted EBITDA margin, is important for investors and other readers of Graham’s financial statements, as it is used as an analytical indicator by Graham’s management to better understand operating performance. Moreover, Graham’s credit facility also contains ratios based on Adjusted EBITDA. Because Adjusted EBITDA and Adjusted EBITDA margin are non-GAAP measures and are thus susceptible to varying calculations, Adjusted EBITDA, and Adjusted EBITDA margin, as presented, may not be directly comparable to other similarly titled measures used by other companies.

Adjusted net income and adjusted net income per diluted share are defined as net income and net income per diluted share as reported, adjusted for certain items and at a normalized tax rate. Adjusted net income and adjusted net income per diluted share are not measures determined in accordance with GAAP, and may not be comparable to the measures as used by other companies. Nevertheless, Graham believes that providing non-GAAP information, such as adjusted net income and adjusted net income per diluted share, is important for investors and other readers of the Company’s financial statements and assists in understanding the comparison of the current quarter’s and current fiscal year’s net income and net income per diluted share to the historical periods’ net income and net income per diluted share. Graham also believes that adjusted net income per share, which adds back intangible amortization expense related to acquisitions, provides a better representation of the cash earnings of the Company.

Forward-Looking Non-GAAP Measures
Adjusted EBITDA and adjusted EBITDA margin are non-GAAP measures. The Company is unable to present a quantitative reconciliation of these forward-looking non-GAAP financial measures to their most directly comparable forward-looking GAAP financial measures because such information is not available, and management cannot reliably predict the necessary components of such GAAP measures without unreasonable effort largely because forecasting or predicting our future operating results is subject to many factors out of our control or not readily predictable. In addition, the Company believes that such reconciliations would imply a degree of precision that would be confusing or misleading to investors. The unavailable information could have a significant impact on the Company’s fiscal 2025 financial results. These non-GAAP financial measures are preliminary estimates and are subject to risks and uncertainties, including, among others, changes in connection with purchase accounting, quarter-end, and year-end adjustments. Any variation between the Company’s actual results and preliminary financial estimates set forth above may be material.

Key Performance Indicators
In addition to the foregoing non-GAAP measures, management uses the following key performance metrics to analyze and measure the Company’s financial performance and results of operations: orders, backlog, and book-to-bill ratio. Management uses orders and backlog as measures of current and future business and financial performance, and these may not be comparable with measures provided by other companies. Orders represent written communications received from customers requesting the Company to provide products and/or services. Backlog is defined as the total dollar value of net orders received for which revenue has not yet been recognized. Management believes tracking orders and backlog are useful as they often times are leading indicators of future performance. In accordance with industry practice, contracts may include provisions for cancellation, termination, or suspension at the discretion of the customer.

The book-to-bill ratio is an operational measure that management uses to track the growth prospects of the Company. The Company calculates the book-to-bill ratio for a given period as net orders divided by net sales.

Given that each of orders, backlog, and book-to-bill ratio are operational measures and that the Company’s methodology for calculating orders, backlog and book-to-bill ratio does not meet the definition of a non-GAAP measure, as that term is defined by the U.S. Securities and Exchange Commission, a quantitative reconciliation for each is not required or provided.

View full release here.

For more information:
Christopher J. Thome
Vice President – Finance and CFO
Phone: (585) 343-2216

Tom Cook
Investor Relations
(203) 682-8250
Tom.Cook@icrinc.com

Source: Graham Corporation

Released August 5, 2025

Release – Cadrenal Therapeutics Announces Clinical Trial Initiation Plans for Tecarfarin in Patients with End-Stage Kidney Disease (ESKD) Transitioning to Dialysis

Research News and Market Data on CVKD

Advances knowledge about the use of tecarfarin in patients with severe kidney impairment, including dialysis

Pivotal step forward in pursuit of ESKD + Atrial Fibrillation (AFib) registration trial

Addresses a critical current treatment gap in patients with ESKD

PONTE VEDRA, Fla. – Cadrenal Therapeutics, Inc. (Nasdaq: CVKD), a biopharmaceutical company focused on developing transformative therapeutics that specifically address limitations of current anticoagulation therapy, today announced clinical trial initiation plans for its lead late-stage drug candidate, tecarfarin, in patients with ESKD who are transitioning to dialysis. Enrollment is planned to begin later this year and will include patients with and without atrial fibrillation (AFib).

Patients with severe kidney disease are already at high risk for thrombotic cardiovascular events such as myocardial infarction and stroke, along with a much greater risk of AFib and venous thromboembolism compared to subjects with normal kidney function. When ESKD patients require dialysis, their transition period comes with even greater risk of myocardial infarction, stroke, and a substantial increase in mortality.

“There is a critical need for safe, effective anticoagulants for use in ESKD patients,” said Quang X. Pham, Chairman and CEO of Cadrenal Therapeutics. “Tecarfarin’s orphan drug and fast-track designations in ESKD patients with AFib underscore this need, and we are excited to advance this program. This study will be an important step forward for the continued development of tecarfarin in ESKD and in other areas with real opportunities to improve patient outcomes with a potentially better vitamin K antagonist.”

Currently, there is limited evidence supporting the use of anticoagulant therapy in dialysis patients. Dialysis patients are often excluded from clinical trials due to their high underlying risk profile, and studies of direct oral anticoagulants (DOACs) in this patient population have not provided clear answers. Furthermore, a recent Phase 2 trial of chronic hemodialysis patients sponsored by a global company showed no benefit from the new class of Factor XI inhibitors in maintaining vascular access graft patency. To date, no prospective studies have examined the benefit of oral anticoagulation in preventing thrombotic events at the time of dialysis initiation.

“Initiating dialysis carries substantial excess risk of cardiovascular events and mortality, and to date, this risk has not been sufficiently addressed. Tecarfarin, a next-generation Vitamin K antagonist with a unique metabolism pathway that is not significantly affected by kidney impairment, has potential promise in this area of unmet need,” said Wolfgang Winkelmayer, Professor of Medicine and Chief of Nephrology at Baylor College of Medicine in Houston, Texas.

About Cadrenal Therapeutics, Inc.

Cadrenal Therapeutics, Inc. is a biopharmaceutical company developing transformative therapeutics to address limitations of current anticoagulation therapy specifically. Cadrenal’s lead investigational product is tecarfarin, a novel oral vitamin K antagonist anticoagulant that is designed to address unmet needs in anticoagulation therapy. Tecarfarin is a reversible anticoagulant (blood thinner) designed to prevent heart attacks, strokes, and deaths due to blood clots in patients requiring chronic anticoagulation. Although warfarin is widely used off-label for several indications, extensive clinical and real-world data have shown it can have significant, serious side effects. With tecarfarin, Cadrenal is advancing an innovative solution to address the unmet needs in anticoagulation therapy, aiming to reduce the clinical complexities of managing Vitamin K antagonists and where DOACs remain inadequate or unproven.

Tecarfarin received Orphan Drug Designation (ODD) and fast-track status for the prevention of systemic thromboembolism (blood clots) of cardiac origin in patients with end-stage kidney disease and atrial fibrillation (ESKD+AFib). The company also received ODD for the prevention of thromboembolism and thrombosis in patients with implanted mechanical circulatory support devices, including Left Ventricular Assist Devices (LVADs). The company has submitted an Orphan Drug Designation Request to the US FDA for patients with chronic kidney disease who have an implanted mechanical heart valve (and consequently require lifelong anticoagulation with a VKA) who also have genetic predisposition to impaired CYP2C9 metabolism, and resulting associated challenges with achieving reliable degrees of anticoagulation with the long-term use of warfarin.

Cadrenal is opportunistically pursuing business development initiatives with a longer-term focus on creating a pipeline of cardiovascular therapeutics. For more information, visit https://www.cadrenal.com/and connect with us on LinkedIn.

Safe Harbor

Any statements in this press release about future expectations, plans, and prospects, as well as any other statements regarding matters that are not historical facts, may constitute “forward-looking statements.” The words “anticipate,” “believe,” “continue,” “could,” “estimate,” “expect,” “intend,” “may,” “plan,” “potentially,” “predict,” “project,” “should,” “target,” “will,” “would” and similar expressions are intended to identify forward-looking statements, although not all forward-looking statements contain these identifying words. These statements include statements regarding initiation of clinical trial for tecarfarin in patients with ESKD transitioning to dialysis; initiation of registration trial in patients with ESKD and AFib, developing transformative therapeutics to specifically address limitations of current anticoagulation therapy; addressing a critical current treatment gap in patients with ESKD; enrollment in the planned clinical trial beginning later this year; the planned study being an important step forward for the continued development of tecarfarin in ESKD; improving patient outcomes with a potentially better vitamin K antagonist; tecarfarin offering potential promise in patients initiating dialysis; addressing the unmet needs in anticoagulation therapy; and Cadrenal’s ability to pursue business development initiatives with a longer-term focus on creating a pipeline of cardiovascular therapeutics. Actual results may differ materially from those indicated by such forward-looking statements as a result of various important factors, including the ability to develop transformative therapeutics to specifically address limitations of current anticoagulation therapy; the ability to address a critical current treatment gap in patients with ESKD; the ability to advance an innovative solution to address the unmet needs in anticoagulation therapy; the ability to initiate and successfully complete clinical trials on time and achieve desired results and benefits as expected; the ability of Cadrenal to build a pipeline of specialized cardiovascular therapeutics and other assets and the other risk factors described in the Company’s Annual Report on Form 10-K for the year ended December 31, 2024, and the Company’s subsequent filings with the Securities and Exchange Commission, including subsequent periodic reports on Quarterly Reports on Form 10-Q and Current Reports on Form 8-K. Any forward-looking statements contained in this press release speak only as of the date hereof and, except as required by federal securities laws, the Company specifically disclaims any obligation to update any forward-looking statement, whether as a result of new information, future events, or otherwise.

Corporate and Investor Relations

Paul Sagan

LaVoieHealthScience

(617) 865-0041

psagan@lavoiehealthscience.com

Media

Andrew Korda

LaVoieHealthScience

(617) 865-0043

akorda@lavoiehealthscience.com

V2X (VVX) – Solid 2Q25 Results


Tuesday, August 05, 2025

V2X builds innovative solutions that integrate physical and digital environments by aligning people, actions, and technology. V2X is embedded in all elements of a critical mission’s lifecycle to enhance readiness, optimize resource management, and boost security. The company provides innovation spanning national security, defense, civilian, and international markets. With a global team of approximately 16,000 professionals, V2X enables mission success by injecting AI and machine learning capabilities to meet today’s toughest challenges across all operational domains.

Joe Gomes, CFA, Managing Director, Equity Research Analyst, Generalist , Noble Capital Markets, Inc.

Refer to the full report for the price target, fundamental analysis, and rating.

2Q25 Results. Revenue came in at $1.078 billion, essentially flat with last year’s $1.072 billion and was in-line with our $1.08 billion estimate. Helped by the pull forward of the conclusion of a non-recurring contractual commitment, adjusted EBITDA was $82.4 million, or a 7.6% margin, compared to $72.3 million, or a 6.7% margin, last year. V2X reported adjusted EPS of $1.33 for 2Q25, up from $0.83 in 2Q24.

Moving Up to Franchise Programs. Highlighted by last week’s T-6 services award, V2X’s pipeline is reflecting larger, franchise type programs. These programs typically leverage all of V2X’s mission critical capabilities. Management noted the 3-year qualified pipeline is now approximately $50 billion in size.


Get the Full Report

Equity Research is available at no cost to Registered users of Channelchek. Not a Member? Click ‘Join’ to join the Channelchek Community. There is no cost to register, and we never collect credit card information.

This Company Sponsored Research is provided by Noble Capital Markets, Inc., a FINRA and S.E.C. registered broker-dealer (B/D).

*Analyst certification and important disclosures included in the full report. NOTE: investment decisions should not be based upon the content of this research summary. Proper due diligence is required before making any investment decision. 

Steelcase (SCS) – To Be Acquired for $18.30/sh


Tuesday, August 05, 2025

Joe Gomes, CFA, Managing Director, Equity Research Analyst, Generalist , Noble Capital Markets, Inc.

Refer to the full report for the price target, fundamental analysis, and rating.

To Be Acquired. Steelcase has entered into an agreement to be acquired by HNI Corporation in a cash and stock transaction with total consideration of approximately $2.2 billion to Steelcase common shareholders, or about $18.30/sh, an 80% premium to Friday’s close.

Details. Under the terms of the agreement, Steelcase shareholders will receive $7.20 in cash and 0.2192 shares of HNI common stock for each share of Steelcase. The implied per share purchase price of $18.30 is based on HNI’s closing share price of $50.62 on Friday, August 1, 2025, reflecting a valuation multiple at transaction close for Steelcase of approximately 5.8x TTM adjusted EBITDA, inclusive of run-rate cost synergies of $120 million. Upon closing, HNI shareholders will own approximately 64%, and Steelcase shareholders will own approximately 36% of the combined company. The deal is expected to close by year-end.


Get the Full Report

Equity Research is available at no cost to Registered users of Channelchek. Not a Member? Click ‘Join’ to join the Channelchek Community. There is no cost to register, and we never collect credit card information.

This Company Sponsored Research is provided by Noble Capital Markets, Inc., a FINRA and S.E.C. registered broker-dealer (B/D).

*Analyst certification and important disclosures included in the full report. NOTE: investment decisions should not be based upon the content of this research summary. Proper due diligence is required before making any investment decision. 

InPlay Oil (IPOOF) – Delek Group Ltd. to Acquire Major Stake in InPlay Oil


Tuesday, August 05, 2025

InPlay Oil is a junior oil and gas exploration and production company with operations in Alberta focused on light oil production. The company operates long-lived, low-decline properties with drilling development and enhanced oil recovery potential as well as undeveloped lands with exploration possibilities. The common shares of InPlay trade on the Toronto Stock Exchange under the symbol IPO and the OTCQX Exchange under the symbol IPOOF.

Mark Reichman, Managing Director, Equity Research Analyst, Natural Resources, Noble Capital Markets, Inc.

Hans Baldau, Associate Analyst, Noble Capital Markets, Inc.

Refer to the full report for the price target, fundamental analysis, and rating.

Delek Group to acquire major stake in InPlay.  Delek Group Ltd. (TASE: DLEKG) executed a definitive agreement to acquire Obsidian Energy’s (TSX: OBE, NYSE American: OBE) common share position in InPlay Oil, consisting of 9,139,784 common shares representing approximately 32.7% of InPlay’s issued and outstanding shares. Subject to certain adjustments, the purchase price is C$10.00 per InPlay share, representing an aggregate transaction value of C$91,397,840. Recall that Obsidian received the shares as partial consideration for its April sale of Pembina Cardium assets to InPlay Oil. The transaction with Delek is expected to close in the first half of August 2025 and remains subject to satisfaction or waiver of certain closing conditions.

Rationale. Delek is an independent exploration and production company based in Israel that has embarked on an international expansion with a focus on high-potential opportunities in the North Sea and North America. Delek views Canada as a strong and stable jurisdiction for oil and gas investment and identified InPlay as an attractive partner in the Canadian energy sector due to its strong record of operational performance and successful acquisitions. Delek holds a 52% equity interest in Ithaca Energy plc and has played a key role in supporting Ithaca’s production growth since the time of its initial investment.


Get the Full Report

Equity Research is available at no cost to Registered users of Channelchek. Not a Member? Click ‘Join’ to join the Channelchek Community. There is no cost to register, and we never collect credit card information.

This Company Sponsored Research is provided by Noble Capital Markets, Inc., a FINRA and S.E.C. registered broker-dealer (B/D).

*Analyst certification and important disclosures included in the full report. NOTE: investment decisions should not be based upon the content of this research summary. Proper due diligence is required before making any investment decision. 

FreightCar America (RAIL) – Second Quarter Financial Results Exceed Expectations


Tuesday, August 05, 2025

Mark Reichman, Managing Director, Equity Research Analyst, Natural Resources, Noble Capital Markets, Inc.

Refer to the full report for the price target, fundamental analysis, and rating.

Second quarter financial results. FreightCar America generated adjusted net income of $3.8 million or $0.11 per share, compared to our estimate of $2.0 million or $0.06 per share. Second quarter revenue of $118.6 million exceeded our estimate of $100.6 million. Rail car deliveries were 939 units compared to 1,159 units during the prior year period and our estimate of 850. The year-over-year decline was attributed to a strategic shift in the product mix toward higher-margin rail cars. As a percentage of revenue, second quarter gross margin increased to 15.0% compared to 12.5% during the prior year period and our 12.7% estimate. Adjusted EBITDA amounted to $10.0 million compared to our $8.8 million estimate and represented an EBITDA margin of 8.4%. RAIL generated adjusted free cash flow of $7.9 million and ended the quarter with $61.4 million in cash and cash equivalents.

Favorable outlook. During the second quarter, RAIL received 1,226 new rail car orders valued at $106.9 million. With a backlog of 3,624 units valued at $316.9 million, we expect deliveries to accelerate throughout the year. During the quarter, RAIL increased utilization across its four production lines, enhanced productivity, and benefited from a higher-margin product mix. The company is advancing its growth strategy by investing in its tank car capabilities, which it expects to strengthen its cost position and support long-term accretive growth.


Get the Full Report

Equity Research is available at no cost to Registered users of Channelchek. Not a Member? Click ‘Join’ to join the Channelchek Community. There is no cost to register, and we never collect credit card information.

This Company Sponsored Research is provided by Noble Capital Markets, Inc., a FINRA and S.E.C. registered broker-dealer (B/D).

*Analyst certification and important disclosures included in the full report. NOTE: investment decisions should not be based upon the content of this research summary. Proper due diligence is required before making any investment decision. 

Commercial Vehicle Group (CVGI) – First Look: 2Q25 Shows Some Improvement but End Markets Remain Challenging


Tuesday, August 05, 2025

Joe Gomes, CFA, Managing Director, Equity Research Analyst, Generalist , Noble Capital Markets, Inc.

Refer to the full report for the price target, fundamental analysis, and rating.

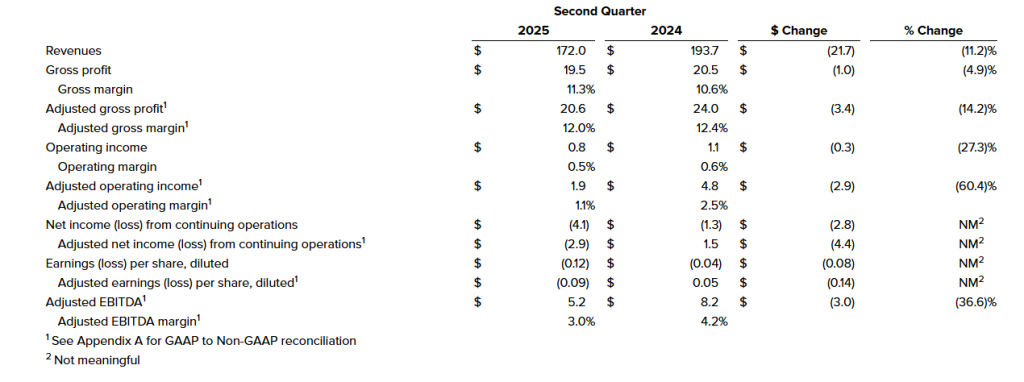
2Q25 Results. Revenue came in at $172 million, down from $193.7 million a year ago, but above our $158 million estimate. Adjusted EBITDA was $5.2 million, down from $8.2 million a year ago, and in-line with our $5 million estimate. Net loss from continuing operations was $4.1 million, or a loss of $0.12/sh, versus $1.3 million, or a loss of $0.04/sh in 2Q24. Adjusted net loss was $0.09/sh in 2Q25 versus adjusted EPS of $0.05 last year. We had forecasted a net loss of $2 million, or a loss of $0.06/sh.

Highlights. Gross margin improved 80 bp sequentially to 11.3% due to operational efficiency improvements. Free cash flow was $17.3 million, up $16.5 million, due to better working capital management. Net debt decreased $31.8 million compared to the year end 2024 level.


Get the Full Report

Equity Research is available at no cost to Registered users of Channelchek. Not a Member? Click ‘Join’ to join the Channelchek Community. There is no cost to register, and we never collect credit card information.

This Company Sponsored Research is provided by Noble Capital Markets, Inc., a FINRA and S.E.C. registered broker-dealer (B/D).

*Analyst certification and important disclosures included in the full report. NOTE: investment decisions should not be based upon the content of this research summary. Proper due diligence is required before making any investment decision. 

New U.S. Pharma Tariffs Could Shake Global Drug Supply Chains

Key Points:
– U.S. plans to impose steep pharmaceutical import tariffs starting at 150%, eventually rising to 250%.
– Industry analysts warn of price shocks, supply disruptions, and increased pressure on U.S. manufacturing.
– The tariffs come amid broader U.S. trade actions targeting semiconductors, copper, and EU goods.

The U.S. pharmaceutical industry is bracing for major potential disruption following the announcement of proposed import tariffs on foreign-made drugs. The new tariffs, set to begin at 150% and rise to 250% within 18 months, signal a dramatic policy shift intended to reduce reliance on overseas pharmaceutical manufacturing and boost domestic production.

The move is part of a broader effort by the U.S. government to reassert control over critical supply chains. Alongside pharmaceuticals, new duties are also targeting semiconductors, copper, and goods from multiple trading partners, including the European Union, Canada, Brazil, and India.

While the intention is to bolster U.S. drug manufacturing and reduce vulnerability during global health crises, some experts caution that the aggressive timeline and steep rates could create short-term turbulence in pricing and availability. A significant portion of both generic and brand-name pharmaceuticals sold in the U.S. are either manufactured or sourced from foreign plants — particularly in India, China, and parts of Europe.

Economists warn that higher tariffs could increase costs for American consumers and health systems. “Any sudden increase in tariffs on widely used medications will likely lead to a ripple effect — from importers to hospitals and pharmacies, and ultimately to patients,” said one analyst at a Washington-based policy institute. In an industry already grappling with rising R&D costs and supply chain stressors, the added tariff burden may push smaller pharmaceutical companies to the brink or force them to pass costs along to consumers.

Large U.S.-based manufacturers with strong domestic infrastructure may benefit from reduced competition and new federal incentives aimed at onshoring production. However, the buildout of new facilities and regulatory approvals for domestic production can take years — potentially creating a supply-demand gap in the interim.

Global reactions have been swift. India, a leading supplier of generic drugs to the U.S., criticized the planned tariff hikes as discriminatory, especially in light of existing tensions over oil trade. Meanwhile, trade partners in the EU and Brazil are closely monitoring developments, particularly as the U.S. continues to renegotiate trade terms and tariff structures across multiple sectors.

The pharmaceutical tariffs are just one facet of a broader strategy that also includes revoking the de minimis rule on small imports and instituting high duties on copper and semiconductor products. Each of these actions represents a clear shift toward protectionist policies and reshoring of critical industries.

For the pharmaceutical sector, the coming months could be pivotal. Companies may accelerate reshoring strategies or lobby for exemptions on essential or life-saving drugs. With implementation expected to begin soon, the industry — and the patients who rely on it — may be facing an era of significant transition.

HNI Corporation to Acquire Steelcase in $2.2 Billion Deal, Creating Industry Powerhouse

HNI Corporation has announced a definitive agreement to acquire Steelcase Inc. in a cash-and-stock deal valued at approximately $2.2 billion. The strategic acquisition unites two iconic names in workplace furniture and design, combining their strengths in innovation, manufacturing, and dealer networks to form a dominant force in the commercial interiors market.

Under the terms of the deal, Steelcase shareholders will receive $7.20 in cash and 0.2192 shares of HNI common stock for each Steelcase share they own. Based on HNI’s stock price as of August 1, 2025, the total purchase price comes to about $18.30 per share. Once finalized, HNI shareholders will own roughly 64% of the combined entity, while Steelcase shareholders will hold the remaining 36%.

HNI Chairman and CEO Jeffrey Lorenger emphasized the complementary nature of the merger, stating, “This acquisition brings together two respected companies with strong brands and decades of leadership in the industry.” Lorenger will continue to lead the combined company, which will retain HNI’s headquarters in Muscatine, Iowa, and keep Steelcase’s base in Grand Rapids, Michigan.

The new entity will have a pro forma annual revenue of $5.8 billion and adjusted EBITDA of approximately $745 million, with anticipated annual cost synergies of $120 million. Financially, the acquisition positions the company for long-term earnings growth, with projections for accretive non-GAAP EPS by 2027 and a return to pre-acquisition leverage within 18 to 24 months.

The companies’ combined strengths span across corporate, healthcare, education, hospitality, and small-to-midsize business markets. With their complementary product portfolios and broad dealer networks, the merger enhances their ability to serve a wider range of customers with innovative solutions for modern workspaces. Both firms bring decades of product design expertise and a shared commitment to purpose-driven leadership and environmental stewardship.

Steelcase CEO Sara Armbruster called the merger a “bold step” that ushers in a new era for the company, employees, and customers. “Together, we will redefine what’s possible in the world of work, workers, and workplaces,” she said.

The transaction has received strong early support from key stakeholders. Some Steelcase shareholders have already agreed to vote in favor of the deal, and committed financing is in place from JPMorgan Chase and Wells Fargo. The merger is expected to close by the end of 2025, pending shareholder and regulatory approvals.

Advisors for the deal include J.P. Morgan Securities for HNI, and Goldman Sachs and BofA Securities for Steelcase. Legal counsel is being provided by Davis Polk & Wardwell for HNI and Skadden, Arps, Slate, Meagher & Flom for Steelcase.

The deal signals a major consolidation in the commercial furniture sector and positions the combined company to lead the evolution of the workplace at a time when hybrid work, digital transformation, and sustainable design continue to reshape business environments.

Release – FreightCar America, Inc. Reports Second Quarter 2025 Results

Research News and Market Data on RAIL

08/04/2025

Delivered Gross Margin of 15%, Expansion of 250 Basis Points
Operating Cash Flow of $8.5 Million and Adjusted Free Cash Flow of $7.9 Million
Strong Order Intake Driven by Operational Flexibility, Reaffirmed Full Year Guidance

CHICAGO, Aug. 04, 2025 (GLOBE NEWSWIRE) — FreightCar America, Inc. (NASDAQ: RAIL) (“FreightCar America” or the “Company”), a diversified manufacturer and supplier of railroad freight cars, railcar parts and components, today reported results for the second quarter ended June 30, 2025.

Second Quarter 2025 Highlights

  • Revenues of $118.6 million, compared to $147.4 million in the second quarter of 2024, with railcar deliveries of 939 units compared to 1,159 units in the prior year period
  • Gross margin of 15.0% with gross profit of $17.8 million, compared to gross margin of 12.5% with gross profit of $18.4 million in the second quarter of 2024
  • Net income of $11.7 million, or $0.34 per share, and Adjusted net income of $3.8 million, or $0.11 per share, reflecting a $51.9 million benefit from a valuation allowance release, partially offset by a $47.6 million non-cash adjustment from the change in warrant liability due to share price appreciation
  • Adjusted EBITDA was $10.0 million, representing a margin of 8.4%, compared to $12.1 million and a margin of 8.2% in the second quarter of 2024
  • Received new orders for 1,226 railcars within the quarter valued at $106.9 million
  • Ended the quarter with a backlog of 3,624 units valued at $316.9 million, up approximately 300 units from prior quarter, reflecting strong order activity and healthy demand

“In the second fiscal quarter, we delivered on our commercial excellence initiatives across the business, supported by strong order intake and healthy customer demand,” said Nick Randall, President and Chief Executive Officer of FreightCar America. “We increased utilization across our four production lines, delivered improved productivity, and benefited from a richer product mix from disciplined pricing. Our ability to remain agile and responsive to customer needs continues to be a key differentiator, particularly in rebuilds and conversions, enabling us to capture meaningful opportunities in a dynamic market.”

Randall continued, “While broader market uncertainty earlier in the year delayed some order activity, we believe the underlying fundamentals point to a meaningful replacement cycle ahead. As that takes shape, our agile manufacturing presence positions us well to capture incremental demand and grow our share. At the same time, we continue to advance our growth strategy by investing in our tank car capabilities, which we expect will strengthen our cost position and support long-term value creation.”

Fiscal Year 2025 Outlook

The Company has reaffirmed outlook for fiscal year 2025 as follows:

 Fiscal 2025 OutlookYear-over-Year Growth at Midpoint
Railcar Deliveries4,500 – 4,900 Railcars7.7%
Revenue$530 – $595 million0.6%
Adjusted EBITDA1$43 – $49 million7.0%

1. The Company does not provide a reconciliation of forward-looking Adjusted EBITDA guidance due to the inherent difficulty in forecasting and quantifying adjustments necessary to calculate such non-GAAP measure without unreasonable effort. Material changes to such adjustments, including warrant liability and non-core operating items, could affect future GAAP results.

Mike Riordan, Chief Financial Officer of FreightCar America, added, “We’re pleased to reaffirm our full-year guidance, supported by strong margin performance and continued commercial execution across the business, with order activity supporting our healthy backlog. In addition, this quarter marked our fifth consecutive quarter of positive operating cash flow, reflecting the consistency and sustainability of our cash generation engine. Our focus on working capital discipline and operational efficiency has positioned us well to maintain momentum and invest in growth opportunities as we deliver strong performance in the second half of the year.”

Second Quarter 2025 Conference Call & Webcast Information

The Company will host a conference call and live webcast on Tuesday, August 5, at 11:00 a.m. (Eastern Time) to discuss its second quarter 2025 financial results. FreightCar America invites shareholders and other interested parties to listen to its financial results conference call. Teleconference details are as follows:

An audio replay of the conference call will be available beginning at 3:00 p.m. (Eastern Time) on Tuesday, August 5, 2025, until 11:59 p.m. (Eastern Time) on Tuesday, August 19, 2025. To access the replay, please dial (844) 512-2921 or (412) 317-6671. The replay passcode is 13754875. An archived version of the webcast will also be available on the FreightCar America Investor Relations website.

About FreightCar America

FreightCar America, headquartered in Chicago, Illinois, is a leading designer, producer and supplier of railroad freight cars, railcar parts and components. We also specialize in railcar repairs, complete railcar rebody services and railcar conversions that repurpose idled rail assets back into revenue service. Since 1901, our customers have trusted us to build quality railcars that are critical to economic growth and instrumental to the North American supply chain. To learn more about FreightCar America, visit www.freightcaramerica.com.

Forward-Looking Statements

This press release contains statements relating to our expected financial performance, financial condition, and/or future business prospects, events and/or plans that are “forward-looking statements” as defined under the Private Securities Litigation Reform Act of 1995. Forward-looking statements represent our estimates and assumptions only as of the date of this press release. Our actual results may differ materially from the results described in or anticipated by our forward-looking statements due to certain risks and uncertainties. These risks and uncertainties relate to, among other things, the cyclical nature of our business; adverse geopolitical, economic and market conditions, including inflation; material disruption in the movement of rail traffic for deliveries; fluctuating costs of raw materials, including steel and aluminum; delays in the delivery of raw materials; our ability to maintain relationships with our suppliers of railcar components; our reliance upon a small number of customers that represent a large percentage of our sales; the variable purchase patterns of our customers and the timing of completion; delivery and customer acceptance of orders; the highly competitive nature of our industry; the risk of lack of acceptance of our new railcar offerings; potential unexpected changes in laws, rules, and regulatory requirements, including tariffs and trade barriers (including recent United States tariffs imposed or threatened to be imposed on China, Canada, Mexico and other countries and any retaliatory actions taken by such countries); and other competitive factors. The factors listed above are not exhaustive. New factors emerge from time to time that may cause our business not to develop as we expect, and it is not possible for us to predict all of them. We expressly disclaim any duty to provide updates to any forward-looking statements made in this press release, whether as a result of new information, future events or otherwise.

Non-GAAP Financial Measures

This press release includes measures not derived in accordance with generally accepted accounting principles (“GAAP”), such as EBITDA, Adjusted EBITDA, Adjusted net income (loss), Adjusted EPS, Free cash flow and Adjusted free cash flow. These non-GAAP measures should not be considered in isolation or as a substitute for any measure derived in accordance with GAAP and may also be inconsistent with similar measures presented by other companies. Reconciliations of these measures to the applicable most closely comparable GAAP measures, and reasons for the Company’s use of these measures, are presented in the attached pages.

Investor Contact: RAILIR@Riveron.com

View full release here.

Primary Logo

Source: FreightCar America, Inc.

View all news

Release – CVG Reports Second Quarter 2025 Results

Research News and Market Data on CVGI

August 4, 2025

Second quarter sales of $172 million, EPS of $(0.12), Adjusted EBITDA of $5.2 million
Continued strong free cash flow generation
Updates full year 2025 guidance

NEW ALBANY, Ohio, Aug. 04, 2025 (GLOBE NEWSWIRE) — CVG (NASDAQ: CVGI), a diversified industrial products and services company, today announced financial results for its second quarter ended June 30, 2025.

Second Quarter 2025 Highlights (Results from Continuing Operations; compared with prior year, where comparisons are noted)

  • Revenues of $172.0 million, down 11.2%, primarily due to softening in global demand.
  • Operating income of $0.8 million, adjusted operating income of $1.9 million, down compared to operating income of $1.1 million and adjusted operating income of $4.8 million. The decrease in operating income was driven primarily by lower sales volumes.
  • Net loss from continuing operations of $4.1 million, or $(0.12) per diluted share and adjusted net loss of $2.9 million, or $(0.09) per diluted share, compared to net loss from continuing operations of $1.3 million, or $(0.04) per diluted share and adjusted net income of $1.5 million, or $0.05 per diluted share.
  • Adjusted EBITDA of $5.2 million, down 36.6%, with an adjusted EBITDA margin of 3.0%, down from 4.2%.
  • Free cash flow of $17.3 million, up $16.5 million, due to better working capital management. Net debt decreased $31.8 million compared to the year end 2024 level.
  • Gross margin expansion of 80 basis points versus Q1 2025 due to operational efficiency improvements.

James Ray, President and Chief Executive Officer, said, “Despite continued macroeconomic volatility, particularly a softening in Construction and Agriculture and Class 8 end markets and ongoing concerns around tariff impacts, we were pleased with continued momentum in our second quarter results, which were highlighted by strong free cash generation. During the quarter, we made progress in implementing operational improvements and right sizing our manufacturing footprint, which drove sequential gross margin improvement for the second consecutive quarter. Additionally, as part of our efforts to preserve margin performance, we are continuing our efforts to further reduce our targeted SG&A levels, and we are having constructive negotiations with customers as it relates to mitigating tariff impacts.”

Mr. Ray continued, “We are encouraged by the improved performance in our Global Electrical Systems segment, driven by new business wins outside of the Construction and Agriculture end markets, which continue to see lower demand. The Global Electrical Systems segment also saw margin expansion despite revenues being flat year-over-year. Across our enterprise, we remain focused on execution, delivery, and driving operational efficiency, while managing the potential impact of trade policy.”

Andy Cheung, Chief Financial Officer, added, “We were pleased to see continued strong free cash generation in the quarter, as well as continued improvement in gross margin, as the benefits of our strategic initiatives take hold. Given our successful working capital initiatives, we are raising our free cash outlook to at least $30 million for the full fiscal year. Continued free cash generation and debt paydown remain key focus areas moving forward. During the quarter, we completed the refinancing of our credit facilities, which will further benefit our strategic initiatives and provide increased financial flexibility as we look to drive further cost reductions, margin improvement, and overall operational efficiency.”

Second Quarter Financial Results from Continuing Operations
(amounts in millions except per share data and percentages)

Consolidated Results from Continuing Operations

Second Quarter 2025 Results

  • Second quarter 2025 revenues were $172.0 million, compared to $193.7 million in the prior year period, a decrease of 11.2%. The overall decrease in revenues was due to lower sales as a result of a softening in customer demand across all segments.
  • Operating income in the second quarter 2025 was $0.8 million compared to $1.1 million in the prior year period. The decrease in operating income was attributable to the impact of lower sales volumes. Second quarter 2025 adjusted operating income was $1.9 million, compared to $4.8 million in the prior year period.
  • Interest associated with debt and other expenses was $2.3 million and $2.4 million for the second quarter 2025 and 2024, respectively.
  • Net loss from continuing operations was $4.1 million, or $(0.12) per diluted share, for the second quarter 2025 compared to net loss of $1.3 million, or $(0.04) per diluted share, in the prior year period. Second quarter 2025 adjusted net loss from continuing operations was $2.9 million, or $(0.09) per diluted share, compared to adjusted net income of $1.5 million, or $0.05 per diluted share.

On June 30, 2025, the Company had $30.3 million of outstanding borrowings on its U.S. revolving credit facility and $4.2 million outstanding borrowings on its China credit facility, $45.3 million of cash and $90.6 million of availability from the credit facilities (subject to customary borrowing base and other conditions), resulting in total liquidity of $135.9 million.

Second Quarter 2025 Segment Results

Global Seating Segment

  • Revenues were $74.5 million compared to $82.4 million for the prior year period, a decrease of 9.6%, due to lower sales volume as a result of decreased customer demand.
  • Operating income was $2.7 million, compared to $2.1 million in the prior year period, an increase of 29.1%, primarily attributable to lower SG&A expenses. Second quarter 2025 adjusted operating income was $3.1 million compared to $2.9 million in the prior year period.

Global Electrical Systems Segment

  • Revenues were $53.6 million compared to $53.6 million in the prior year period, essentially flat.
  • Operating income was $0.7 million compared to an operating loss of $0.5 million in the prior year period. The increase in operating income was primarily attributable to lower salary expense and lower restructuring costs in the current period compared to the prior period. Second quarter 2025 adjusted operating income was $1.2 million compared to $0.8 million in the prior year period.

Trim Systems and Components Segment

  • Revenues were $43.9 million compared to $57.6 million in the prior year period, a decrease of 23.8%, primarily as a result of decreased customer demand.
  • Operating income was $0.1 million compared to $2.3 million in the prior year period, a decrease of $2.2 million. The decrease in operating income was primarily attributable to lower sales volumes. Second quarter 2025 adjusted operating income was $0.3 million compared to $4.0 million in the prior year period.

Outlook

CVG updated the Company’s outlook for the full year 2025, based on current market conditions:

MetricPrior 2025 Outlook ($ millions)2025 Outlook ($ millions)
Net Sales$660- $690$650- $670
Adjusted EBITDA$22 – $27$21 – $25
Free Cash Flow> $20> $30
   

This outlook reflects, among others, current industry forecasts for North America Class 8 truck builds. According to ACT Research, 2025 North American Class 8 truck production levels are expected to be at 252,000 units. The 2024 actual Class 8 truck builds according to the ACT Research was 332,372 units.

Construction and Agriculture end markets are projected to decline approximately 5-15% in 2025. However, we expect the contribution from new business wins outside of Construction and Agriculture end markets in Electrical Systems to soften this decline.

GAAP to Non-GAAP Reconciliation

A reconciliation of GAAP to non-GAAP financial measures referenced in this release is included as Appendix A to this release.

Conference Call

A conference call to discuss this press release is scheduled for Tuesday, August 5, 2025, at 8:30 a.m. ET. Management intends to reference the Q2 2025 Earnings Call Presentation during the conference call. To participate, dial (800) 549-8228 using conference code 72110. International participants dial (289) 819-1520 using conference code 72110.

This call is being webcast and can be accessed through the “Investors” section of CVG’s website at ir.cvgrp.com, where it will be archived for one year.

A telephonic replay of the conference call will be available for a period of two weeks following the call. To access the replay, dial (888) 660-6264 using access code 72110#.

Company Contact
Andy Cheung
Chief Financial Officer
CVG
IR@cvgrp.com

Investor Relations Contact
Ross Collins or Stephen Poe
Alpha IR Group
CVGI@alpha-ir.com

About CVG

CVG is a global provider of systems, assemblies and components to the global commercial vehicle market and the electric vehicle market. We deliver real solutions to complex design, engineering and manufacturing problems while creating positive change for our customers, industries and communities we serve. Information about the Company and its products is available on the internet at www.cvgrp.com.

Forward-Looking Statements

This press release contains forward-looking statements that are subject to risks and uncertainties. These statements often include words such as “believe”, “anticipate”, “plan”, “expect”, “intend”, “will”, “should”, “could”, “would”, “project”, “continue”, “likely”, and similar expressions. In particular, this press release may contain forward-looking statements about the Company’s expectations for future periods with respect to its plans to improve financial results, the future of the Company’s end markets, changes in the Class 8 and Class 5-7 North America truck build rates, performance of the global construction and agricultural equipment business, the Company’s prospects in the wire harness and electric vehicle markets, the Company’s initiatives to address customer needs, organic growth, the Company’s strategic plans and plans to focus on certain segments, competition faced by the Company, volatility in and disruption to the global economic environment including global supply chain constraints, inflation and labor shortages, tariffs and counter-measures, financial covenant compliance, anticipated effects of acquisitions, production of new products, plans for capital expenditures, and the Company’s financial position or other financial information. These statements are based on certain assumptions that the Company has made in light of its experience as well as its perspective on historical trends, current conditions, expected future developments and other factors it believes are appropriate under the circumstances. Actual results may differ materially from the anticipated results because of certain risks and uncertainties, including those included in the Company’s filings with the SEC. There can be no assurance that statements made in this press release relating to future events will be achieved. The Company undertakes no obligation to update or revise forward-looking statements to reflect changed assumptions, the occurrence of unanticipated events or changes to future operating results over time. All subsequent written and oral forward-looking statements attributable to the Company or persons acting on behalf of the Company are expressly qualified in their entirety by such cautionary statements.

Other Information

Throughout this document, certain numbers in the tables or elsewhere may not sum due to rounding. Rounding may have also impacted the presentation of certain year-on-year percentage changes.

View full release here.

Primary Logo

Source: Commercial Vehicle Group, Inc.

Release – V2X Delivers Solid Second Quarter Results and Increases Full-Year Adjusted EPS Guidance

Research News and Market Data on VVX

August 04, 2025

Second Quarter and Recent Highlights

  • Revenue of $1.08 billion and net income of $22.4 million
  • Adjusted net income1 of $42.3 million, up 61% y/y
  • Adjusted EBITDA1 of $82.4 million, with a margin of 7.6%
  • Diluted EPS of $0.70; Adjusted diluted EPS1 of $1.33, up 59% y/y
  • Improved net debt by $200 million y/y
  • Established $100 million share repurchase authorization
  • Awarded $4.3 billion T-6 aircraft program

RESTON, Va., Aug. 4, 2025 /PRNewswire/ — V2X, Inc. (NYSE: VVX) announced second quarter 2025 financial results. “Our second quarter results reflect V2X’s ability to execute in all market environments and further demonstrate the resiliency of our business,” said Jeremy C. Wensinger, President and Chief Executive Officer. “We believe the overall trends in our market remain positive and that V2X is well positioned to leverage our mission expertise and full lifecycle capabilities to deliver next generation data-enabled solutions that enhance readiness and customer outcomes.”

Mr. Wensinger continued, “We are bringing innovation and new approaches to rapidly deploy solutions for improved readiness, which was exemplified by the recent $4.3 billion T-6 program award. The T-6 aircraft is widely used in a multi-service aviation training program that is critical to ensure new pilot readiness.  This award is an example of the strategy we are executing and it’s an honor to have been selected to help ensure that pilots in the U.S. Air Force, Navy, and Army will be trained and ready for their next mission. V2X will use commercial-based approaches to provide full spectrum supply chain management solutions to enable this essential training-mission for over 700 aircraft.”

“I’d like to thank all our employees for their contributions during the quarter and specifically recognize the recent success achieving full operational capability on the Army’s largest training program. This is a remarkable accomplishment, which will ensure the delivery of critical training related services to Army warfighters worldwide by infusing cutting-edge innovations to meet ever-evolving needs.” 

Mr. Wensinger concluded, “We are transforming V2X to be a leader in data-enabled mission solutions across all domains. The growth initiatives fueling this advancement include optimizing our core for on contract growth, leveraging capabilities into adjacent markets, extending new offerings, and strategically investing both internally and externally. We are executing on these initiatives today and believe they will accelerate growth, create differentiation, and yield value in the years to come.”

Second Quarter 2025 Results

“V2X reported revenue of $1.08 billion in the quarter,” said Shawn Mural, Senior Vice President and Chief Financial Officer. “The performance in the second quarter was strong and provides additional confidence to deliver on our full year commitments. The second quarter results reflect the great job our team has done in optimizing and refining our processes and procedures. I’m very proud of what we have been able to achieve over the past year.”

“For the quarter, the Company reported operating income of $52.9 million and adjusted operating income1 of $77.3 million, increasing $11.5 million dollars or 18% from the prior year. V2X delivered adjusted EBITDA1 of $82.4 million, with a margin of 7.6%. Net income for the quarter was $22.4 million dollars. Adjusted net income1 was $42.3 million dollars, increasing $16.1 million dollars or 61% year-over-year. Second quarter GAAP diluted EPS was $0.70. Adjusted diluted EPS1 for the quarter was $1.33, increasing 59% year-over-year.”

“Second quarter net cash provided by operating activities was $28.5 million. Adjusted net cash provided by operating activities1 increased $112.1 million year-over-year to $58.3 million.”

Mr. Mural continued, “During the quarter we further progressed our capital allocation strategy by establishing a $100 million share repurchase authorization. We believe the strong cash flow characteristics of our business support V2X’s ability to create additional long-term value through the efficient deployment of capital. The core tenets of our deployment strategy include opportunistically repurchasing shares, strategic acquisitions, internal investments for growth, and reducing leverage via debt reduction.”

Increasing 2025 Adjusted EPS1 Guidance

Mr. Mural concluded, “Given the year-to-date performance and trends in our business, the Company is increasing its adjusted EPS guidance for 2025 and reaffirming its revenue, adjusted EBITDA, and adjusted net cash1 ranges.”

Guidance is as follows:

$ millions, except for per share amountsPrior 2025 GuidanceUpdated 2025 Guidance
Revenue$4,375$4,500$4,375$4,500
Adjusted EBITDA1$305$320$305$320
Adjusted Diluted Earnings Per Share1$4.45$4.85$4.65$4.95
Adjusted Net Cash Provided by
Operating Activities1
$150$170$150$170

The Company is not providing a quantitative reconciliation with respect to the foregoing forward-looking non-GAAP measures in reliance on the “unreasonable efforts” exception set forth in the SEC rules because certain financial information, the probable significance of which cannot be determined, is not available and cannot be reasonably estimated. For example, unusual, one-time, non-ordinary, or non-recurring costs, which relate to mergers and acquisitions (“M&A”), integration and related activities cannot be reasonably estimated. Forward-looking statements are based upon current expectations and are subject to factors that could cause actual results to differ materially from those suggested here, including those factors set forth in the Safe Harbor Statement below. 

Second Quarter Conference Call

Management will conduct a conference call with analysts and investors at 4:30 p.m. ET on Monday, August 4, 2025. U.S.-based participants may dial in to the conference call at 877-300-8521, while international participants may dial 412-317-6026. A live webcast of the conference call as well as an accompanying slide presentation will be available here: https://app.webinar.net/MPvl2xBdpg3

A replay of the conference call will be posted on the V2X website shortly after completion of the call and will be available for one year. A telephonic replay will also be available through August 18, 2025, at 844-512-2921 (domestic) or 412-317-6671 (international) with passcode 10200918. 

Presentation slides that will be used in conjunction with the conference call will also be made available online in advance on the “investors” section of the Company’s website at https://gov2x.com. V2X recognizes its website as a key channel of distribution to reach public investors and as a means of disclosing material non-public information to comply with its obligations under the U.S. Securities and Exchange Commission (“SEC”) Regulation FD.

1   See “Key Performance Indicators and Non-GAAP Financial Measures” for descriptions and reconciliations.

About V2X

V2X builds innovative solutions that integrate physical and digital environments by aligning people, actions, and technology. V2X is embedded in all elements of a critical mission’s lifecycle to enhance readiness, optimize resource management, and boost security. The company provides innovation spanning national security, defense, civilian, and international markets. With a global team of approximately 16,000 professionals, V2X enables mission success by injecting AI and machine learning capabilities to meet today’s toughest challenges across all operational domains.

Investor ContactMedia Contact
Mike Smith, CFAAngelica Spanos Deoudes
IR@goV2X.comCommunications@goV2X.com
719-637-5773571-338-5195

Safe Harbor Statement

Safe Harbor Statement under the Private Securities Litigation Reform Act of 1995 (the “Act”): Certain material presented herein includes forward-looking statements intended to qualify for the safe harbor from liability established by the Act.

Forward-looking statements generally can be identified by the use of forward-looking terminology such as “may,” “will,” “expect,” “intend,” “estimate,” “anticipate,” “believe,” “could,” “potential,” “continue” or similar terminology. These statements are based on the beliefs and assumptions of the management of the Company based on information currently available to management. Forward-looking statements in this press release, include, but are not limited to our future performance and capabilities; all of the statements and items listed under “Increasing 2025 Adjusted EPS Guidance” above and other assumptions contained therein for purposes of such guidance; our belief that prior performance provides substantial visibility for future performance; market trends; our expectations that the foreign military sales and international markets represent a large and growing addressable opportunity; and our belief that our strategy, visibility, and targeted growth opportunities provide substantial opportunities for value creation.

These forward-looking statements are not guarantees of future performance, conditions, or results, and involve a number of known and unknown risks, uncertainties, assumptions, and other important factors, many of which are outside our management’s control, which could cause actual results to differ materially from the results discussed in the forward-looking statements.  In addition, forward-looking statements are subject to certain risks and uncertainties that could cause actual results to differ materially from the Company’s historical experience and our present expectations or projections. For a discussion of some of the risks and uncertainties that could cause actual results to differ from such forward-looking statements, see the risks and other factors detailed from time to time in our Annual Report on Form 10-K, Quarterly Reports on Form 10-Q, and other filings with the SEC.

We undertake no obligation to update any forward-looking statements, whether as a result of new information, future events or otherwise, except as required by applicable law.

View full release here.

Cision View original content to download multimedia:https://www.prnewswire.com/news-releases/v2x-delivers-solid-second-quarter-results-and-increases-full-year-adjusted-eps-guidance-302520929.html

SOURCE V2X, Inc.