Release – Conduent Reports First Quarter 2024 Financial Results

Research News and Market Data on CNDT

MAY 01, 2024

Key Q1 2024 Highlights

  • Revenue: $921M
  • Pre-tax Income: $127M
  • Adj. EBITDA Margin(1): 7.5%
  • New business signings ACV(2): $99M
  • Net ARR Activity Metric(2) (TTM): $17M

FLORHAM PARK, NJ, May 1, 2024 – Conduent (NASDAQ: CNDT), a global technology-led business process solutions and services company, today announced its first quarter 2024 financial results.

Cliff Skelton, Conduent President and Chief Executive Officer stated, “Q1 2024 is a continued reflection of progress in our portfolio performance overlaid by timing considerations and variations across our segments. While Revenue exceeded expectations and Adjusted EBITDA/Margin were broadly in line with expectations, sales performance lagged due to the timing of several opportunities between Q1 and Q2. The diversity of our portfolio is further evidenced by a strong quarter in Transportation, improvement in Commercial and some softness in Government.”

“Earlier today we announced the closure of the sale of our Curbside Management and Public Safety businesses. In addition, we expect to finalize the BenefitWallet transaction in May. We will continue to rationalize our portfolio to enable future growth with efficient and effective capital deployment.”

“Finally, as previously stated, 2024 represents what we believe to be the trough in our growth turnaround.  With the continued backing of our strong client base, partnerships with some of the leading global technology firms such as Microsoft and Oracle, and 57,000 dedicated associates, we expect continued progress along our 3-year journey and that progress is directly in line with our plan.”

Key Financial Q1 2024 Results

($ in millions, except margin and per share data)Q1 2024Q1 2023Current Quarter Y/Y B/(W)
Revenue$921$922(0.1)%
GAAP Net Income (Loss)$99$(6)n/m
Adjusted EBITDA(1)$69$90(23.3)%
Adjusted EBITDA Margin (1)7.5%9.8%(230) bps
GAAP Income (Loss) Before Income Tax$127$(8)n/m
GAAP Diluted EPS$0.46$(0.04)n/m
Adjusted Diluted EPS(1)$(0.09)$0.00n/m
Cash Flow from Operating Activities$(37)$(12)(208)%
Adjusted Free Cash Flow(1)$(60)$(37)(62)%

Performance Commentary

During the first quarter of 2024, we completed the first tranche of the BenefitWallet portfolio transfer, receiving $164 million as the pro-rata share of the purchase price. Following the completion of the second tranche on April 11, 2024, we expect the third and final tranche of the BenefitWallet portfolio transfer to be completed by the end of the second quarter of 2024.

As a result of the completion of the first and second tranches of the BenefitWallet portfolio transfer, we prepaid $259 million of principal of our Term Loan B.

Other portfolio rationalization efforts include the closure of the sale of the Curbside Management and Public Safety businesses.

Pre-tax income (loss) for the first quarter of 2024 was $127 million versus $(8) million in the prior year period. This increase is primarily driven by the gain on the transfer of the BenefitWallet portfolio.

Q1 2024 Adjusted EBITDA of $69 million and Adjusted EBITDA Margin of 7.5% were in line with our expectations.

Revenue for the first quarter of 2024 was substantially unchanged versus the prior year.

Conduent’s nearly $1.0 billion total liquidity position remains strong with long-dated debt maturities and a modest net leverage ratio.

In the first quarter, we repurchased approximately 4.8 million shares of our common stock in connection with our ongoing share repurchase program.

Additional Q1 2024 Performance Highlights

Conduent achieved several milestones in technology-led solutions, operational excellence and culture, including:

  • Collaborated in partnership with Microsoft on an initiative across the Conduent portfolio to drive innovation using Microsoft Azure OpenAI Services;
  • Recently partnered with Oracle to streamline transaction processing by the migration of on-premises Oracle Exadata environment to the cloud with Oracle Database@Azure;
  • Recognized as a Leader in CX Services Transformation NEAT – Cost Optimization Focus by NelsonHall;
  • Named “GovTech Top 100 Company” for the third consecutive year; and
  • Named Newsweek America’s Greatest Workplaces for Women and Diversity 2024.

FY 2024 Outlook(2,3)

 FY 2023 ActualsFY 2024 Outlook(2,3)
Revenue$3,722M $3,600M – $3,700M
Adj. EBITDA(1) / Adj. EBITDA Margin(1)$378M / 10.2%8% – 9%
Adj. Free Cash Flow(1) as % of Adj. EBITDA(1)(1.3)%5% – 10%

(1)  Refer to Appendix for definition and complete Non-GAAP reconciliations of Adjusted EBITDA, Adjusted EBITDA Margin, Adjusted Diluted EPS and Adjusted Free Cash Flow.
(2) Refer to Appendix for definition.
(3) Refer to Appendix for additional information regarding non-GAAP outlook. FY 2024 Outlook is not adjusted for completed or anticipated divestiture activity or use of such proceeds.

Conference Call

Management will present the results during a conference call and webcast on May 1, 2024 at 9:00 a.m. ET.

The call will be available by live audio webcast along with the news release and online presentation slides at https://investor.conduent.com/.

The conference call will also be available by calling 877-407-4019 toll-free. If requested, the conference ID for this call is 13745034.

The international dial-in is 1-201-689-8337. The international conference ID is also 13745034.

A recording of the conference call will be available by calling 1-877-660-6853 three hours after the conference call concludes. The replay ID is 13745034.

The telephone recording will be available until May 15, 2024.

About Conduent  

Conduent delivers digital business solutions and services spanning the commercial, government and transportation spectrum – creating valuable outcomes for its clients and the millions of people who count on them. The Company leverages cloud computing, artificial intelligence, machine learning, automation and advanced analytics to deliver mission-critical solutions. Through a dedicated global team of approximately 57,000 associates, process expertise and advanced technologies, Conduent’s solutions and services digitally transform its clients’ operations to enhance customer experiences, improve performance, increase efficiencies and reduce costs. Conduent adds momentum to its clients’ missions in many ways including disbursing approximately $100 billion in government payments annually, enabling 2.3 billion customer service interactions annually, empowering millions of employees through HR services every year and processing nearly 13 million tolling transactions every day. Learn more at www.conduent.com.

Non-GAAP Financial Measures

We have reported our financial results in accordance with accounting principles generally accepted in the U.S. (U.S. GAAP). In addition, we have discussed our financial results using non-GAAP measures. We believe these non-GAAP measures allow investors to better understand the trends in our business and to better understand and compare our results. Accordingly, we believe it is necessary to adjust several reported amounts, determined in accordance with U.S. GAAP, to exclude the effects of certain items as well as their related tax effects. Management believes that these non-GAAP financial measures provide an additional means of analyzing the results of the current period against the corresponding prior period. However, these non-GAAP financial measures should be viewed in addition to, and not as a substitute for, our reported results prepared in accordance with U.S. GAAP. Our non-GAAP financial measures are not meant to be considered in isolation or as a substitute for comparable U.S. GAAP measures and should be read only in conjunction with our Consolidated Financial Statements prepared in accordance with U.S. GAAP. Our management regularly uses our non-GAAP financial measures internally to understand, manage and evaluate our business and make operating decisions. Providing such non-GAAP financial measures to investors allows for a further level of transparency as to how management reviews and evaluates our business results and trends. These non-GAAP measures are among the primary factors management uses in planning for and forecasting future periods. Compensation of our executives is based in part on the performance of our business based on certain of these non-GAAP measures. Refer to the “Non-GAAP Financial Measures” section attached to this release for a discussion of these non-GAAP measures and their reconciliation to the reported U.S. GAAP measures.

Forward-Looking Statements

This press release, any exhibits or attachments to this release, and other public statements we make may contain “forward-looking statements” as defined in the Private Securities Litigation Reform Act of 1995. The words “anticipate,” “believe,” “estimate,” “expect,” “plan,” “intend,” “will,” “aim,” “should,” “could,” “forecast,” “target,” “may,” “continue to,” “endeavor,” “if,” “growing,” “projected,” “potential,” “likely,” “see,” “ahead,” “further,” “going forward,” “on the horizon,” and similar expressions (including the negative and plural forms of such words and phrases), as they relate to us, are intended to identify forward-looking statements, but the absence of these words does not mean that a statement is not forward-looking. All statements other than statements of historical fact included in this press release or any attachment to this press release are forward-looking statements, including, but not limited to, statements regarding our financial results, condition and outlook; changes in our operating results; general market and economic conditions; statements regarding portfolio divestitures, such as the transfer of the BenefitWallet portfolio and the sale of the Curbside Management and Public Safety Solutions businesses, including all statements regarding anticipated timing of closing of such divestitures; Conduent’s liquidity position remaining strong; statements regarding our portfolio rationalization plan, including continuing to rationalize our portfolio to enable future growth with efficient and effective capital deployment; 2024 representing what we believe to be the trough in our growth turnaround; and expectations of continued progress along our 3-year journey being directly in line with our plan; and our projected financial performance for the full year 2024 and 2025, including all statements made under the section captioned “FY 2024 Outlook” within this release. These statements reflect our current views with respect to future events and are subject to certain risks, uncertainties and assumptions, many of which are outside of our control, that could cause actual results to differ materially from those expected or implied by such forward-looking statements contained in this press release, any exhibits to this press release and other public statements we make.

Important factors and uncertainties that could cause our actual results to differ materially from those in our forward-looking statements include, but are not limited to: risks related to pending dispositions, including the transfer of the Company’s BenefitWallet’s portfolio and the sale of the Company’s Curbside Management and Public Safety Solutions businesses, including but not limited to the Company’s ability to realize the benefits anticipated from such transactions, unexpected costs, liabilities or delays in connection with such transactions, and the significant transaction costs associated with such transactions; government appropriations and termination rights contained in our government contracts; the competitiveness of the markets in which we operate; our ability to renew commercial and government contracts, including contracts awarded through competitive bidding processes; our ability to recover capital and other investments in connection with our contracts; our reliance on third-party providers; risk and impact of geopolitical events and increasing geopolitical tensions (such as the wars in the Ukraine and Middle East), macroeconomic conditions, natural disasters and other factors in a particular country or region on our workforce, customers and vendors; our ability to deliver on our contractual obligations properly and on time; changes in interest in outsourced business process services; claims of infringement of third-party intellectual property rights; our ability to estimate the scope of work or the costs of performance in our contracts; the loss of key senior management and our ability to attract and retain necessary technical personnel and qualified subcontractors; our failure to develop new service offerings and protect our intellectual property rights; our ability to modernize our information technology infrastructure and consolidate data centers; expectations relating to environmental, social and governance considerations; utilization of our stock repurchase program; the failure to comply with laws relating to individually identifiable information and personal health information; the failure to comply with laws relating to processing certain financial transactions, including payment card transactions and debit or credit card transactions; breaches of our information systems or security systems or any service interruptions; our ability to comply with data security standards; developments in various contingent liabilities that are not reflected on our balance sheet, including those arising as a result of being involved in a variety of claims, lawsuits, investigations and proceedings; risks related to divestitures and acquisitions; risk and impact of potential goodwill and other asset impairments; our significant indebtedness and the terms of such indebtedness; our failure to obtain or maintain a satisfactory credit rating and financial performance; our ability to obtain adequate pricing for our services and to improve our cost structure; our ability to collect our receivables, including those for unbilled services; a decline in revenues from, or a loss of, or a reduction in business from or failure of significant clients; fluctuations in our non-recurring revenue; increases in the cost of voice and data services or significant interruptions in such services; our ability to receive dividends or other payments from our subsidiaries; and other factors that are set forth in the “Risk Factors” section, the “Legal Proceedings” section, the “Management’s Discussion and Analysis of Financial Condition and Results of Operations” section and other sections in our 2023 Annual Report on Form 10-K, as well as in our Quarterly Reports on Form 10-Q and Current Reports on Form 8-K filed with or furnished to the Securities and Exchange Commission. Any forward-looking statements made by us in this release speak only as of the date on which they are made. We are under no obligation to, and expressly disclaim any obligation to, update or alter our forward-looking statements, whether because of new information, subsequent events or otherwise, except as required by law.

CONDUENT INCORPORATED
CONDENSED CONSOLIDATED STATEMENTS OF INCOME (LOSS) (UNAUDITED)

  Three Months Ended March 31,
(in millions, except per share data)  2024   2023 
Revenue $921  $922 
     
Operating Costs and Expenses    
Cost of services (excluding depreciation and amortization)  735   720 
Selling, general and administrative (excluding depreciation and amortization)  116   111 
Research and development (excluding depreciation and amortization)  2   2 
Depreciation and amortization  62   61 
Restructuring and related costs  9   29 
Interest expense  27   27 
(Gain) loss on divestitures and transaction costs, net  (161)  2 
Litigation settlements (recoveries), net  4   (21)
Loss on extinguishment of debt  2    
Other (income) expenses, net  (2)  (1)
Total Operating Costs and Expenses  794   930 
     
Income (Loss) Before Income Taxes  127   (8)
     
Income tax expense (benefit)  28   (2)
Net Income (Loss) $99  $(6)
     
Net Income (Loss) per Share:    
Basic $0.46  $(0.04)
Diluted $0.46  $(0.04)
         

CONDUENT INCORPORATED
CONDENSED CONSOLIDATED STATEMENTS OF COMPREHENSIVE INCOME (LOSS) (UNAUDITED)

  Three Months Ended March 31,
(in millions)  2024   2023 
Net Income (Loss) $99  $(6)
Other Comprehensive Income (Loss), Net (1)    
Currency translation adjustments, net  (11)  17 
Unrecognized gains (losses), net     1 
Other Comprehensive Income (Loss), Net  (11)  18 
     
Comprehensive Income (Loss), Net $88  $12 

__________

(1) All amounts are net of tax. Tax effects were immaterial.

CONDUENT INCORPORATED
CONDENSED CONSOLIDATED BALANCE SHEETS (UNAUDITED)

(in millions, except share data in thousands) March 31, 2024 December 31, 2023
Assets    
Cash and cash equivalents $415  $498 
Accounts receivable, net  600   559 
Assets held for sale  192   180 
Contract assets  166   178 
Other current assets  216   240 
Total current assets  1,589   1,655 
Land, buildings and equipment, net  186   197 
Operating lease right-of-use assets  188   191 
Intangible assets, net  31   32 
Goodwill  643   651 
Other long-term assets  421   436 
Total Assets $3,058  $3,162 
Liabilities and Equity    
Current portion of long-term debt $33  $34 
Accounts payable  167   174 
Accrued compensation and benefits costs  175   183 
Unearned income  94   91 
Liabilities held for sale  56   58 
Other current liabilities  324   328 
Total current liabilities  849   868 
Long-term debt  1,083   1,248 
Deferred taxes  43   30 
Operating lease liabilities  155   157 
Other long-term liabilities  81   84 
Total Liabilities  2,211   2,387 
     
Series A convertible preferred stock  142   142 
     
Common stock  2   2 
Treasury stock, at cost  (44)  (27)
Additional paid-in capital  3,941   3,938 
Retained earnings (deficit)  (2,752)  (2,849)
Accumulated other comprehensive loss  (446)  (435)
Total Conduent Inc. Equity  701   629 
Non-controlling Interest  4   4 
Total Equity  705   633 
Total Liabilities and Equity $3,058  $3,162 
     
Shares of common stock issued and outstanding  206,685   211,509 
Shares of series A convertible preferred stock issued and outstanding  120   120 
Shares of common stock held in treasury  13,665   8,841 
         

CONDUENT INCORPORATED
CONDENSED CONSOLIDATED STATEMENTS OF CASH FLOWS (UNAUDITED)

  Three Months Ended March 31,
(in millions)  2024   2023 
Cash Flows from Operating Activities:    
Net income (loss) $99  $(6)
Adjustments required to reconcile net income (loss) to cash flows from operating activities:    
Depreciation and amortization  62   61 
Contract inducement amortization  1   1 
Deferred income taxes  13   (8)
Amortization of debt financing costs  1   1 
Loss on extinguishment of debt  2    
(Gain) loss on divestitures and sales of fixed assets, net  (164)   
Stock-based compensation  3   2 
Changes in operating assets and liabilities  (54)  (63)
Net cash provided by (used in) operating activities  (37)  (12)
Cash Flows from Investing Activities:    
Cost of additions to land, buildings and equipment  (13)  (11)
Cost of additions to internal use software  (8)  (11)
Proceeds from divestitures  164    
Net cash provided by (used in) investing activities  143   (22)
Cash Flows from Financing Activities:    
Payments on debt  (175)  (10)
Treasury stock purchases  (17)   
Taxes paid for settlement of stock-based compensation  (5)  (7)
Dividends paid on preferred stock  (2)  (2)
Net cash provided by (used in) financing activities  (199)  (19)
Effect of exchange rate changes on cash, cash equivalents and restricted cash  (2)  2 
Increase (decrease) in cash, cash equivalents and restricted cash  (95)  (51)
Cash, Cash Equivalents and Restricted Cash at Beginning of Period  519   598 
Cash, Cash Equivalents and Restricted Cash at End of period (1) $424  $547 

___________

(1) Includes $9 million and $21 million restricted cash as of March 31, 2024 and 2023 , respectively, that were included in Other current assets on their respective Condensed Consolidated Balance Sheets.

Appendix

Definitions

Net ARR Activity Metric (TTM)

Projected Annual Recurring Revenue for contracts signed in the prior 12 months, less the annualized impact of any client losses, contractual volume and price changes, and other known impacts for which the company was notified in that same time period, which could positively or negatively impact results. The metric annualizes the net impact to revenue. Timing of revenue impact varies and may not be realized within the forward 12-month timeframe. The metric is for indicative purposes only. This metric excludes COVID-related volume impacts and non-recurring revenue signings. This metric is not indicative of any specific 12 month timeframe.

New Business Annual Contract Value (ACV): (New Business TCV / contract term) multiplied by 12.

New Business Total Contract Value (TCV): Estimated total future revenues from contracts signed during the period related to new logo, new service line or expansion with existing customers.

TTM: Trailing twelve months.

PBT: Profit before tax.

Non-GAAP Financial Measures

We have reported our financial results in accordance with accounting principles generally accepted in the U.S. (U.S. GAAP). In addition, we have discussed our financial results using non-GAAP measures.

We believe these non-GAAP measures allow investors to better understand the trends in our business and to better understand and compare our results. Accordingly, we believe it is necessary to adjust several reported amounts, determined in accordance with U.S. GAAP, to exclude the effects of certain items as well as their related tax effects. Management believes that these non-GAAP financial measures provide an additional means of analyzing the results of the current period against the corresponding prior period. However, these non-GAAP financial measures should be viewed in addition to, and not as a substitute for, the Company’s reported results prepared in accordance with U.S. GAAP. Our non-GAAP financial measures are not meant to be considered in isolation or as a substitute for comparable U.S. GAAP measures and should be read only in conjunction with our Consolidated Financial Statements prepared in accordance with U.S. GAAP. Our management regularly uses our non-GAAP financial measures internally to understand, manage and evaluate our business and make operating decisions, and providing such non-GAAP financial measures to investors allows for a further level of transparency as to how management reviews and evaluates our business results and trends. These non-GAAP measures are among the primary factors management uses in planning for and forecasting future periods. Compensation of our executives is based in part on the performance of our business based on certain of these non-GAAP measures.

A reconciliation of the following non-GAAP financial measures to the most directly comparable financial measures calculated and presented in accordance with U.S. GAAP are provided below.

These reconciliations also include the income tax effects for our non-GAAP performance measures in total, to the extent applicable. The income tax effects are calculated under the same accounting principles as applied to our reported pre-tax performance measures under Accounting Standards Codification 740, which employs an annual effective tax rate method. The noted income tax effect for our non-GAAP performance measures is effectively the difference in income taxes for reported and adjusted pre-tax income calculated under the annual effective tax rate method. The tax effect of the non-GAAP adjustments was calculated based upon evaluation of the statutory tax treatment and the applicable statutory tax rate in the jurisdictions in which such charges were incurred.

Adjusted Net Income (Loss), Adjusted Diluted Earnings per Share, Adjusted Weighted Average Common Shares Outstanding, and Adjusted Effective Tax Rate

We make adjustments to Net Income (Loss) before Income Taxes for the following items, as applicable, to the particular financial measure, for the purpose of calculating Adjusted Net Income (Loss), Adjusted Diluted Earnings per Share, Adjusted Weighted Average Common Shares Outstanding, and Adjusted Effective Tax Rate:

  • Amortization of acquired intangible assets. The amortization of acquired intangible assets is driven by acquisition activity, which can vary in size, nature and timing as compared to other companies within our industry and from period to period.
  • Restructuring and related costs. Restructuring and related costs include restructuring and asset impairment charges as well as costs associated with our strategic transformation program.
  • Goodwill impairment. This represents goodwill impairment charges related to entering the agreement to transfer the BenefitWallet portfolio.
  • (Gain) loss on divestitures and transaction costs, net. Represents (gain) loss on divested businesses and transaction costs.
  • Litigation settlements (recoveries), net represents settlements or recoveries for various matters subject to litigation.
  • Loss on extinguishment of debt. This represents write-off related debt issuance costs related to prepayments of debt.
  • Other charges (credits). This includes Other (income) expenses, net on the Consolidated Statements of Income (loss) and other insignificant (income) expenses and other adjustments.
  • Divestitures. Revenue and Adjusted EBITDA of divested businesses are excluded.

The Company provides adjusted net income and adjusted EPS financial measures to assist our investors in evaluating our ongoing operating performance for the current reporting period and, where provided, over different reporting periods, by adjusting for certain items which may be recurring or non-recurring and which in our view do not necessarily reflect ongoing performance. We also internally use these measures to assess our operating performance, both absolutely and in comparison to other companies, and in evaluating or making selected compensation decisions.

Management believes that the adjusted effective tax rate, provided as supplemental information, facilitates a comparison by investors of our actual effective tax rate with an adjusted effective tax rate which reflects the impact of the items which are excluded in providing adjusted net income and certain other identified items, and may provide added insight into our underlying business results and how effective tax rates impact our ongoing business.

Adjusted Operating Income and Adjusted Operating Margin

We make adjustments to Costs and Expenses and Operating Margin for the following items, as applicable, for the purpose of calculating Adjusted Operating Income and Adjusted Operating Margin:

  • Amortization of acquired intangible assets.
  • Restructuring and related costs.
  • Interest expense. Interest expense includes interest on long-term debt and amortization of debt issuance costs.
  • Goodwill impairment.
  • Loss on extinguishment of debt.
  • (Gain) loss on divestitures and transaction costs, net.
  • Litigation settlements (recoveries), net.
  • Other charges (credits).
  • Divestitures.

We provide our investors with adjusted operating income and adjusted operating margin information, as supplemental information, because we believe it offers added insight, by itself and for comparability between periods, by adjusting for certain non-cash items as well as certain other identified items which we do not believe are indicative of our ongoing business, and may also provide added insight on trends in our ongoing business.

Adjusted EBITDA and EBITDA Margin

We use Adjusted EBITDA and Adjusted EBITDA Margin as an additional way of assessing certain aspects of our operations that, when viewed with the U.S. GAAP results and the accompanying reconciliations to corresponding U.S. GAAP financial measures, provide a more complete understanding of our on-going business. Adjusted EBITDA represents income (loss) before interest, income taxes, depreciation and amortization and contract inducement amortization adjusted for the following items. Adjusted EBITDA Margin is Adjusted EBITDA divided by revenue.

  • Restructuring and related costs.
  • Goodwill impairment.
  • Loss on extinguishment of debt.
  • (Gain) loss on divestitures and transaction costs, net.
  • Litigation settlements (recoveries), net.
  • Other charges (credits).
  • Divestitures.

Adjusted EBITDA is not intended to represent cash flows from operations, operating income (loss) or net income (loss) as defined by U.S. GAAP as indicators of operating performance. Management cautions that amounts presented in accordance with Conduent’s definition of Adjusted EBITDA and Adjusted EBITDA Margin may not be comparable to similar measures disclosed by other companies because not all companies calculate Adjusted EBITDA and Adjusted EBITDA Margin in the same manner.

Free Cash Flow

Free Cash Flow is defined as cash flows from operating activities as reported on the consolidated statement of cash flows, less cost of additions to land, buildings and equipment, cost of additions to internal use software, and proceeds from sales of land, buildings and equipment. We use the non-GAAP measure of Free Cash Flow as a criterion of liquidity. We use Free Cash Flow as a measure of liquidity to determine amounts we can reinvest in our core businesses, such as amounts available to make acquisitions and invest in land, buildings and equipment and internal use software, after required payments on debt. In order to provide a meaningful basis for comparison, we are providing information with respect to our Free Cash Flow reconciled to cash flow provided by operating activities, which we believe to be the most directly comparable measure under U.S. GAAP.

Adjusted Free Cash Flow

Adjusted Free Cash Flow is defined as Free Cash Flow from above plus adjustments for litigation insurance recoveries, transaction costs, taxes paid on gains from divestitures and litigation recoveries, proceeds from failed sale-leaseback transactions and certain other identified adjustments. We use Adjusted Free Cash Flow, in addition to Free Cash Flow, to provide supplemental information to our investors concerning our ability to generate cash from our ongoing operating activities; by excluding these items, we believe we provide useful additional information to our investors to help them further understand our ability to generate cash period-over-period as well as added information on comparability to our competitors. Such as with Free Cash Flow information, as so adjusted, it is specifically not intended to provide amounts available for discretionary spending. We have added certain adjustments to account for items which we do not believe reflect our core business or operating performance, and we computed all periods with such adjusted costs.

Revenue at Constant Currency

To better understand trends in our business, we believe that it is helpful to adjust revenue to exclude the impact of changes in the translation of foreign currencies into U.S. Dollars. We refer to this adjusted revenue as “constant currency.” Currency impact is determined as the difference between actual growth rates and constant currency growth rates. This currency impact is calculated by translating the current period activity in local currency using the comparable prior-year period’s currency translation rate.

Non-GAAP Outlook

In providing the Full Year 2024 outlook for Adjusted EBITDA we exclude certain items which are otherwise included in determining the comparable U.S. GAAP financial measure. A description of the adjustments which historically have been applicable in determining Adjusted EBITDA is reflected in the table below. In addition, “Full Year 2024 Outlook”, is not adjusted for completed or anticipated divestiture activity or use of such proceeds. We are providing such outlook only on a non-GAAP basis because the Company is unable without unreasonable efforts to predict with reasonable certainty the totality or ultimate outcome or occurrence of these adjustments for the forward-looking period, which can be dependent on future events that may not be reliably predicted. Based on past reported results, where one or more of these items have been applicable, such excluded items could be material, individually or in the aggregate, to reported results. Full Year 2024 Outlook for Adjusted Free Cash Flow is provided as a factor of expected Adjusted EBITDA, and such outlook is only available on a non-GAAP basis for the reasons described above. For the same reason, we are unable to provide a GAAP expected adjusted tax rate, which adjusts for our non-GAAP adjustments.

Non-GAAP Reconciliations: Revenue at Constant Currency, Adjusted Net Income (Loss), Adjusted Effective Tax, Adjusted Operating Income (Loss) and Adjusted EBITDA were as follows:

  Three Months Ended March 31,
(in millions)  2024   2023 
REVENUE    
Revenue $921  $922 
Adjustment:    
Foreign currency impact  (2)  3 
Revenue at Constant Currency $919  $925 
     
ADJUSTED NET INCOME (LOSS)    
Net Income (Loss) $99  $(6)
Adjustments:    
Amortization of acquired intangible assets ( 1 )  1   2 
Restructuring and related costs  9   29 
Loss on extinguishment of debt  2    
(Gain) loss on divestitures and transaction costs, net  (161)  2 
Litigation settlements (recoveries), net  4   (21)
Other charges (credits)  (2)  (1)
Total Non-GAAP Adjustments  (147)  11 
Income tax adjustments ( 2 )  32   (3)
Adjusted Net Income (Loss) $(16) $2 
     
ADJUSTED EFFECTIVE TAX    
Income (Loss) Before Income Taxes $127  $(8)
Adjustments:    
Total Non-GAAP Adjustments  (147)  11 
Adjusted PBT $(20) $3 
     
Income tax expense (benefit) $28  $(2)
Income tax adjustments ( 2 )  (32)  3 
Adjusted Income Tax Expense (Benefit)  (4)  1 
Adjusted Net Income (Loss) $(16) $2 
         
CONTINUED Three Months Ended March 31,
(in millions)  2024   2023 
ADJUSTED OPERATING INCOME (LOSS)    
Income (Loss) Before Income Taxes $127  $(8)
Adjustments:    
Total non-GAAP adjustments  (147)  11 
Interest expense  27   27 
Adjusted Operating Income (Loss) $7  $30 
     
ADJUSTED EBITDA    
Net Income (Loss) $99  $(6)
Income tax expense (benefit)  28   (2)
Depreciation and amortization  62   61 
Contract inducement amortization  1   1 
Interest expense  27   27 
EBITDA  217   81 
Adjustments:    
Restructuring and related costs  9   29 
(Gain) loss on divestitures and transaction costs, net  (161)  2 
Litigation settlements (recoveries), net  4   (21)
Loss on extinguishment of debt  2    
Other charges (credits)  (2)  (1)
Adjusted EBITDA $69  $90 

___________

(1) Included in Depreciation and amortization on the Consolidated Statements of Income (Loss).

(2) The tax impact of Adjusted Pre-tax income (loss) from continuing operations was calculated under the same accounting principles applied to the ‘As Reported’ pre-tax income (loss), which employs an annual effective tax rate method to the results and without regard to the adjustments listed.

Non-GAAP Reconciliations: Adjusted Weighted Average Shares Outstanding, Adjusted Diluted EPS, Adjusted Effective Tax Rate, Adjusted Operating Margin and Adjusted EBITDA Margin were as follows:

  Three Months Ended March 31,
(Amounts are in whole dollars, shares are in thousands and margins and rates are in %)  2024   2023 
ADJUSTED DILUTED EPS (1)    
Weighted Average Common Shares Outstanding  209,160   218,410 
Adjustments:    
Restricted stock and performance units / shares      
Adjusted Weighted Average Common Shares Outstanding  209,160   218,410 
     
Diluted EPS from Continuing Operations $0.46  $(0.04)
Adjustments:    
Total non-GAAP adjustments  (0.70)  0.05 
Income tax adjustments (2)  0.15   (0.01)
Adjusted Diluted EPS $(0.09) $ 
     
ADJUSTED EFFECTIVE TAX RATE    
Effective tax rate  21.9%  20.8%
Adjustments:    
Total non-GAAP adjustments  0.3%  14.2%
Adjusted Effective Tax Rate (2)  22.2%  35.0%
     
ADJUSTED OPERATING MARGIN    
Income (Loss) Before Income Taxes Margin  13.8% (0.9)%
Adjustments:    
Total non-GAAP adjustments (15.9)%  1.3%
Interest expense  2.9%  2.9%
Margin for Adjusted Operating Income  0.8%  3.3%
         
ADJUSTED EBITDA MARGIN        
EBITDA Margin  23.6%  8.8%
Total non-GAAP adjustments  (16.1)%  1.0%
Adjusted EBITDA Margin  7.5%  9.8%
         

__________

(1) Average shares for the 2024 and 2023 calculation of adjusted EPS excludes 5.4 million shares associated with our Series A convertible preferred stock and includes the impact of preferred stock dividend of approximately $2 million and $2 million for the three months ended March 31, 2024 and 2023 , respectively.

(2) The tax impact of Adjusted Pre-tax income (loss) from continuing operations was calculated under the same accounting principles applied to the ‘As Reported’ pre-tax income (loss), which employs an annual effective tax rate method to the results and without regard to the Total Non-GAAP adjustments.

(3) Adjusted for the full impact from revenue and income/loss from divestitures for all periods presented.

Free Cash Flow and Adjusted Free Cash Flow Reconciliation:

  Three Months Ended March 31,
(in millions)  2024   2023 
Operating Cash Flow $(37) $(12)
Cost of additions to land, buildings and equipment  (13)  (11)
Cost of additions to internal use software  (8)  (11)
Free Cash Flow $(58) $(34)
Transaction costs  3   1 
Vendor finance lease payments  (5)  (4)
Adjusted Free Cash Flow $(60) $(37)

Media Contacts

SEAN COLLINS

Conduent

Sean.Collins2@conduent.com

+1-310-497-9205

GILES GOODBURN

Conduent

ir@conduent.com

+1-203-216-3546

Release – Enrollment Completed in Phase 2a Study with Cocrystal Pharma’s Oral Antiviral Candidate CC-42344 for Pandemic and Seasonal Influenza

MAY 01, 2024

BOTHELL, Wash., May 01, 2024 (GLOBE NEWSWIRE) — Cocrystal Pharma, Inc. (Nasdaq: COCP) (“Cocrystal” or the “Company”) announces completion of enrollment of 78 subjects who were infected with influenza A in a randomized, double-blind, placebo-controlled Phase 2a human challenge clinical study evaluating the safety, tolerability, antiviral and clinical measurements of its novel, broad-spectrum, oral PB2 inhibitor CC-42344. CC-42344 is a new class of antiviral treatment designed to effectively block an essential step in the viral replication and transcription of pandemic and seasonal influenza A, and was discovered using the Company’s proprietary structure-based drug discovery platform technology.

“There is an urgent need for new influenza antivirals targeting highly pathogenic avian pandemic and seasonal influenza strains. It’s gratifying to report the timely completion of enrollment in this important study, keeping us on track to announce topline results later this year. This human challenge study was conducted in the United Kingdom and was designed to evaluate a favorable safety profile, virological effects, and an improvement in clinical symptom for CC-42344 as a potential oral treatment for avian pandemic and seasonal influenza A,” said Sam Lee, Ph.D., Cocrystal’s President and co-CEO. “We are pleased to advance our robust pipeline with achievement of this important clinical development milestone as we continue to build our leadership in influenza therapeutics.”

In March 2024 Cocrystal announced receipt of positive Pre-Investigational New Drug (Pre-IND) feedback from the FDA providing guidance and clarification on critical steps including designing a proposed Phase 2b study protocol for CC-42344 as a potential oral treatment for pandemic and seasonal influenza A.

Cocrystal also plans to begin a Phase 1 study in Australia with an inhaled formulation of CC-42344 as a potential influenza A treatment and post-exposure prophylaxis. Recent preclinical data showed that inhaled CC-42344 exhibited highly effective delivery into the lung, superior lung exposure, efficacy in influenza-infected human lung epithelia and a favorable safety profile.

CC-42344 Influenza A PB2 Inhibitor

In December 2023, Cocrystal announced the achievement of first-patient-in for the Phase 2a human challenge clinical trial with CC-42344, an investigational new oral antiviral inhibitor for the treatment of pandemic and seasonal influenza A. The randomized, double-blind, placebo-controlled study was designed to evaluate the safety, tolerability, viral and clinical measurements of influenza A infection in subjects dosed with oral CC-42344 treatment. The study enrolled 78 healthy subjects.

In late 2022 Cocrystal reported favorable safety and tolerability results in the single-ascending and multiple-ascending dose portions of the healthy volunteer Phase 1 trial conducted in Australia. Preclinical data showed that CC-42344 is highly active against seasonal and pandemic influenza A strains.

About Seasonal Influenza

Each year there are approximately 1 billion cases of seasonal influenza worldwide, with 3-5 million severe illnesses and up to 650,000 deaths, according to the World Health Organization. On average about 8% of the U.S. population contracts influenza each season. In addition to the health risk, influenza is responsible for approximately $10.4 billion in direct costs for hospitalizations and outpatient visits for adults in the U.S. annually.

About Cocrystal Pharma, Inc.

Cocrystal Pharma, Inc. is a clinical-stage biotechnology company discovering and developing novel antiviral therapeutics that target the replication process of influenza viruses, coronaviruses (including SARS-CoV-2), noroviruses and hepatitis C viruses. Cocrystal employs unique structure-based technologies and Nobel Prize-winning expertise to create first- and best-in-class antiviral drugs. For further information about Cocrystal, please visit www.cocrystalpharma.com.

Cautionary Note Regarding Forward-Looking Statements

This press release contains forward-looking statements within the meaning of the Private Securities Litigation Reform Act of 1995, including statements regarding the expected timing and results of the Phase 2a trial for CC-42344 for the oral treatment of influenza A in 2024, an anticipated Phase 2b trial for oral treatment of influenza A following the Phase 2a trial, plans to begin a Phase 1 study in Australia for an inhaled formulation of CC-42344 as a potential influenza A treatment and prophylaxis, and the potential efficacy and clinical benefits of, and market for, such product candidates. The words “believe,” “may,” “estimate,” “continue,” “anticipate,” “intend,” “should,” “plan,” “could,” “target,” “potential,” “is likely,” “will,” “expect” and similar expressions, as they relate to us, are intended to identify forward-looking statements. We have based these forward-looking statements largely on our current expectations and projections about future events. Some or all of the events anticipated by these forward-looking statements may not occur. Important factors that could cause actual results to differ from those in the forward-looking statements include, but are not limited to, risks relating to our ability to proceed with the studies including recruiting volunteers and procuring materials for such studies by our clinical research organizations and vendors, the results of such studies and our ability to obtain FDA approval to initiate the Phase 2b study. Further information on our risk factors is contained in our filings with the SEC, including our Annual Report on Form 10-K for the year ended December 31, 2023. Any forward-looking statement made by us herein speaks only as of the date on which it is made. Factors or events that could cause our actual results to differ may emerge from time to time, and it is not possible for us to predict all of them. We undertake no obligation to publicly update any forward-looking statement, whether as a result of new information, future developments or otherwise, except as may be required by law.

Investor Contact:
LHA Investor Relations
Jody Cain
310-691-7100
jcain@lhai.com

Media Contact:
JQA Partners
Jules Abraham
917-885-7378
Jabraham@jqapartners.com

# # #

Primary Logo

Source: Cocrystal Pharma, Inc.

Released May 1, 2024

Release – Conduent Completes Sale of its Curbside Management and Public Safety Businesses to Modaxo

Research News and Market Data on CNDT

MAY 01, 2024

Sale demonstrates continued progress in Conduent’s strategy to streamline its portfolio to drive increased focus on its core capabilities and enable synergistic growth

FLORHAM PARK, N.J. — Conduent Incorporated (Nasdaq: CNDT), a global technology-led business solutions and services company, today announced it has successfully completed the sale of its Curbside Management Solutions and Public Safety Solutions businesses to Modaxo, a division of Constellation Software Inc. (TSX: CSU). The signing of the transaction was announced on December 28, 2023. The sale has a purchase price of $230 million.

“This divestiture marks another significant step in our efforts to concentrate on our core capabilities and foster growth that benefits both our shareholders and clients,” said Cliff Skelton, Conduent President and CEO. “With the completion of this sale, our focus remains on a smooth transition for our team members and clients as we continue to execute our growth strategy and advance toward our deployable capital goal.”

As outlined during Conduent’s 2023 investor briefing, the company set on a course to rationalize its business portfolio to increase focus on core capabilities, become more nimble, and enhance shareholder and client value.

Conduent will also continue to drive innovation in its Road Usage Charging Solutions and Transit Solutions businesses to enable streamlined, high-volume mobility services. The sale to Modaxo has no impact on these businesses.

Additional details of the transaction are outlined in Conduent’s 8-K filed with the U.S. Securities and Exchange Commission (SEC) today.

About Conduent

Conduent delivers digital business solutions and services spanning the commercial, government and transportation spectrum – creating valuable outcomes for its clients and the millions of people who count on them. The Company leverages cloud computing, artificial intelligence, machine learning, automation and advanced analytics to deliver mission-critical solutions. Through a dedicated global team of approximately 59,000 associates, process expertise and advanced technologies, Conduent’s solutions and services digitally transform its clients’ operations to enhance customer experiences, improve performance, increase efficiencies and reduce costs. Conduent adds momentum to its clients’ missions in many ways including disbursing approximately $100 billion in government payments annually, enabling 2.3 billion customer service interactions annually, empowering millions of employees through HR services every year and processing nearly 13 million tolling transactions every day. Learn more at www.conduent.com .

Note: To receive RSS news feeds, visit www.news.conduent.com. For open commentary, industry perspectives and views, visit http://twitter.com/Conduenthttp://www.linkedin.com/company/conduent or http://www.facebook.com/Conduent.

Trademarks

Conduent is a trademark of Conduent Incorporated in the United States and/or other countries. Other names may be trademarks of their respective owners.

Forward-Looking Statements

This press release may contain “forward-looking statements” as defined in the Private Securities Litigation Reform Act of 1995. The words “anticipate,” “believe,” “estimate,” “expect,” “plan,” “intend,” “will,” “aim,” “should,” “could,” “forecast,” “target,” “may,” “continue to,” “endeavor,” “if,” “growing,” “projected,” “potential,” “likely,” “see,” “ahead,” “further,” “going forward,” “on the horizon,” “enable,” “strategy,” and similar expressions (including the negative and plural forms of such words and phrases), as they relate to us, are intended to identify forward-looking statements, but the absence of these words does not mean that a statement is not forward-looking. All statements other than statements of historical fact included in this press release are forward-looking statements, including, but not limited to, statements regarding Conduent’s focus on continuing to provide a seamless transition for team members and clients as Conduent executes its growth strategy and advances towards its deployable capital goal, expectations that Conduent will continue to drive innovation in its Road Usage Charging Solutions and Transit Solutions businesses to enable streamlined, high-volume mobility services, and Conduent’s strategy to streamline its portfolio to drive increased focus on its core capabilities and enable synergistic growth, as well as to rationalize its business portfolio to increase focus on core capabilities, become more nimble, and enhance shareholder and client value. These statements reflect our current views with respect to future events and are subject to certain risks, uncertainties and assumptions, many of which are outside of our control, that could cause actual results to differ materially from those expected or implied by such forward-looking statements contained in this press release, any exhibits to this press release and other public statements we make. Important factors and uncertainties that could cause actual results to differ materially from those in our forward-looking statements include, but are not limited to: Conduent’s ability to realize the benefits anticipated from the sale of its curbside management and public safety businesses; unexpected costs, liabilities or delays in connection with the transaction; the significant transaction costs associated with the transaction; negative effects of the announcement, pendency or consummation of the transaction on the market price of our common stock or operating results, including as a result of changes in key customer, supplier, employee or other business relationships; the risk of litigation or regulatory actions; our inability to retain and hire key personnel; the risk that certain contractual restrictions contained in the definitive transaction agreement could adversely affect our ability to pursue business opportunities or strategic transactions; and other factors that are set forth in the “Risk Factors” and other sections of our Annual Report on Form 10-K, as well as in our Quarterly Reports on Form 10-Q and Current Reports on Form 8-K filed with or furnished to the Securities and Exchange Commission. Any forward-looking statements made by us in this press release speak only as of the date on which they are made. We are under no obligation to, and expressly disclaim any obligation to, update or alter our forward-looking statements, whether because of new information, subsequent events or otherwise, except as required by law.

Media Contacts

SEAN COLLINS

Conduent

Sean.Collins2@conduent.com

+1-310-497-9205

GILES GOODBURN

Conduent

ir@conduent.com

+1-203-216-3546

NEIL FRANZ

Conduent

neil.franz@conduent.com

+1-240-687-0127

Viking Cruises Makes a Splash with $1.5 Billion IPO

Viking Cruises, the leading provider of destination-focused river and ocean cruises, hit the open waters of the public markets today in a blockbuster $1.5 billion initial public offering on the New York Stock Exchange. The Los Angeles-based company and its shareholders offered a total of 64,041,668 ordinary shares at $24 apiece, with the potential for an additional $230 million in proceeds if underwriters exercise their over-allotment option in full.

The long-awaited IPO marks a major milestone for Viking, which was founded in 1997 by Norwegian entrepreneurs Torstein Hagen and his daughter Karine. From its humble beginnings operating modest river cruises along the Russian waterways, the company has grown into a heavyweight of the cruise industry known for its culturally immersive voyages that appeal to intellectually curious travelers.

“This is an incredibly exciting day for Viking as we embark on our next chapter as a public company,” said Torstein Hagen, Viking’s Chairman. “The proceeds from this offering will enable us to further our commitment to creating exceptional destination-focused experiences for our guests.”

While Viking raised $264 million from its portion of the IPO shares, the lion’s share came from long-time investors like private equity firms TPG, Genting Group, and AAMCF who cashed out $1.27 billion worth of their stakes. Viking did not receive any proceeds from shares sold by these selling shareholders.

The offering was hot with investors, getting upsized by 8 million shares due to high demand. Viking’s $6.0 billion market cap and profitable business model operating a fleet of 63 river vessels and 8 ocean ships made it an attractive catch amidst the choppy conditions facing many travel companies.

Now trading under the catchy “VIK” ticker, the IPO was led by heavyweight investment banks BofA Securities and J.P. Morgan acting as lead underwriters. They were joined by a syndicate including UBS, Wells Fargo, HSBC, Morgan Stanley and seven other co-managers.

Viking has ambitious plans for the growth capital. The company intends to use the $264 million net proceeds to fund additional cruise ships and travel experiences, invest in sales and marketing, and accelerate expansion into new markets. Up next are the launches of Viking’s highly-anticipated expedition cruises to the Arctic and Antarctic scheduled for 2025.

The IPO caps off a remarkable rise for the company from its modest beginnings over 25 years ago. Thanks to its unique vision of combining a curated curriculum of educational content with Scandinavian design and cuisine, Viking has cultivated a loyal community whom they fondly refer to as “The Thinking Person.”

With the winds of the public markets now at its back, Viking’s next voyage looks bound for its status as the world’s largest and leading small-ship cruise line. As Torstein Hagen says, “We will remain driven by our mandate of creating culturally enriching experiences that allow our guests to explore the world in comfort.”

Orion Group Holdings (ORN) – First Quarter Post Call Commentary


Wednesday, May 01, 2024

Joe Gomes, Managing Director, Equity Research Analyst, Generalist , Noble Capital Markets, Inc.

Joshua Zoepfel, Research Associate, Noble Capital Markets, Inc.

Refer to the full report for the price target, fundamental analysis, and rating.

Improved Margin. In spite of the revenue shortfall caused by unanticipated project delays, management’s focus on improved bidding and cost controls resulted in gross margin increasing to 9.7% in the quarter from 3.7% a year ago. We anticipate ongoing margin improvement.

Environment Ripe with Opportunity. As we have outlined in previous reports, the opportunity set continues to grow, now at $11 billion with solid growth potential in both the Marine and Concrete segments. Government funding, both federal and state, is pushing Marine growth while data center demand is fueling Concrete opportunities.


Get the Full Report

Equity Research is available at no cost to Registered users of Channelchek. Not a Member? Click ‘Join’ to join the Channelchek Community. There is no cost to register, and we never collect credit card information.

This Company Sponsored Research is provided by Noble Capital Markets, Inc., a FINRA and S.E.C. registered broker-dealer (B/D).

*Analyst certification and important disclosures included in the full report. NOTE: investment decisions should not be based upon the content of this research summary. Proper due diligence is required before making any investment decision. 

Maple Gold Mines (MGMLF) – Laying the Groundwork for the 2024 Drilling Program


Wednesday, May 01, 2024

Mark Reichman, Managing Director, Equity Research Analyst, Natural Resources, Noble Capital Markets, Inc.

Refer to the full report for the price target, fundamental analysis, and rating.

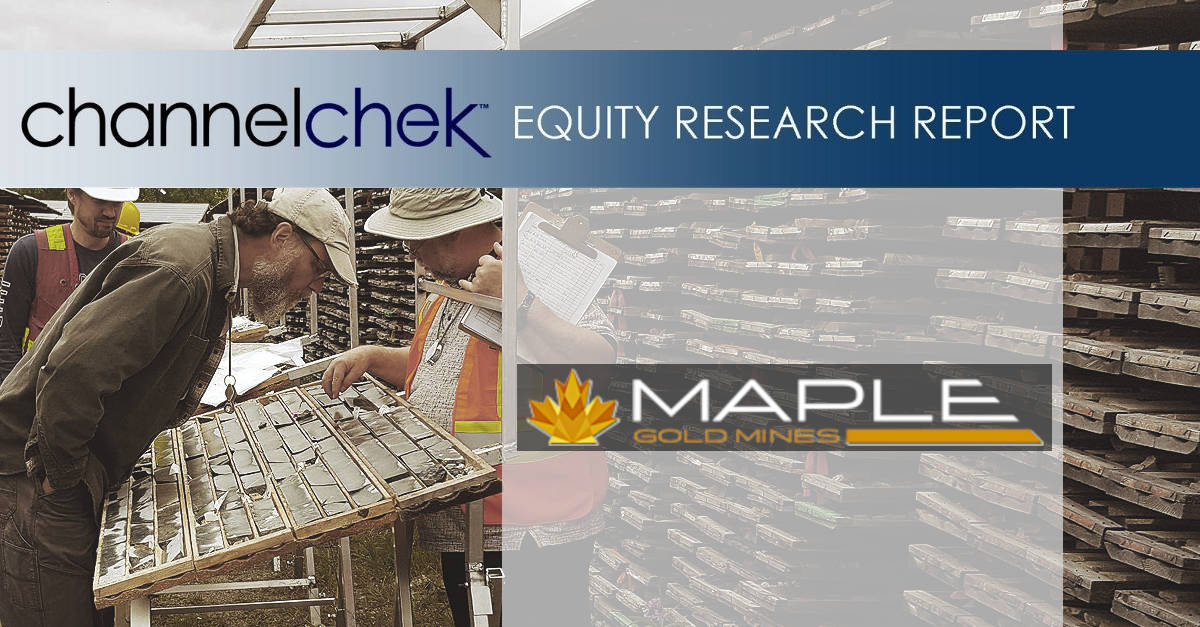
Comprehensive technical review. Since late 2023, Maple Gold has been undertaking a systematic compilation and review of its technical database associated with its 400 square kilometer property package. The company is integrating all geological, geophysical, geochemical, and drilling data to improve target generation and drive successful exploration outcomes.

New structural model to inform the drilling program. Maple Gold’s technical team is nearing completion of a new three-dimensional litho-structural model to support a focused ranking and prioritization of property-wide drill targets to be tested later this year. A high-resolution drone magnetic survey of select areas will be completed in the next few weeks.


Get the Full Report

Equity Research is available at no cost to Registered users of Channelchek. Not a Member? Click ‘Join’ to join the Channelchek Community. There is no cost to register, and we never collect credit card information.

This Company Sponsored Research is provided by Noble Capital Markets, Inc., a FINRA and S.E.C. registered broker-dealer (B/D).

*Analyst certification and important disclosures included in the full report. NOTE: investment decisions should not be based upon the content of this research summary. Proper due diligence is required before making any investment decision. 

Alliance Resource Partners (ARLP) – Strong Start to 2024; Outlook Remains Favorable


Wednesday, May 01, 2024

ARLP is a diversified natural resource company that generates operating and royalty income from coal produced by its mining complexes and royalty income from mineral interests it owns in strategic oil & gas producing regions in the United States, primarily the Permian, Anadarko and Williston basins. ARLP currently produces coal from seven mining complexes its subsidiaries operate in Illinois, Indiana, Kentucky, Maryland and West Virginia. ARLP also operates a coal loading terminal on the Ohio River at Mount Vernon, Indiana. ARLP markets its coal production to major domestic and international utilities and industrial users and is currently the second largest coal producer in the eastern United States. In addition, ARLP is positioning itself as an energy provider for the future by leveraging its core technology and operating competencies to make strategic investments in the fast growing energy and infrastructure transition.

Mark Reichman, Managing Director, Equity Research Analyst, Natural Resources, Noble Capital Markets, Inc.

Refer to the full report for the price target, fundamental analysis, and rating.

First quarter financial results. Alliance reported first quarter EBITDA and earnings per unit (EPU) of $235.0 million and $1.21, respectively, compared to $270.9 million and $1.45 during the prior year period. We had forecast EBITDA and EPU of $209.7 million and $0.97. Coal sales price realizations were above the high end of the partnership’s annual guidance range, while the oil & gas royalty segment experienced record volumes. Additionally, operating expenses were lower than expected and the company benefited from an $11.9 million mark-to-market change in the value of digital assets.

Updating estimates. We have increased our 2024 EBITDA and EPU estimates to $871.3 million and $4.14 from $841.1 million and $3.90, respectively. We think our forward estimates could be conservative based on the potential for higher average coal sales price realizations and stronger than expected performance from the partnership’s oil and gas royalty segment.


Get the Full Report

Equity Research is available at no cost to Registered users of Channelchek. Not a Member? Click ‘Join’ to join the Channelchek Community. There is no cost to register, and we never collect credit card information.

This Company Sponsored Research is provided by Noble Capital Markets, Inc., a FINRA and S.E.C. registered broker-dealer (B/D).

*Analyst certification and important disclosures included in the full report. NOTE: investment decisions should not be based upon the content of this research summary. Proper due diligence is required before making any investment decision. 

Google Joins the $2 Trillion Club as AI Ambitions Pay Off

In a landmark achievement, Alphabet Inc. (Google’s parent company) has officially become the 4th publicly traded company in history to cross the $2 trillion market capitalization threshold. After briefly touching this vaunted level in late 2021, Google has now comfortably sustained a $2 trillion-plus valuation for an entire trading day amid investor enthusiasm for its artificial intelligence initiatives.

Google now stands among an exclusive group of megacap tech titans alongside Apple ($2.6T), Microsoft ($3.0T), and chipmaker Nvidia ($2.2T). E-commerce behemoth Amazon is nipping at Google’s heels with a $1.8T market cap, while social media giant Meta lags at $1.1T after its controversial metaverse pivot.

The milestone cements Google’s status as a generational company and one of the most pivotal names reshaping the world through cutting-edge AI development. While Google built its fortune through pioneering internet search and digital advertising, investors are now betting billions that its bold AI plays will unlock massive new revenue streams for decades to come.

Alphabet’s surge past $2 trillion follows the company reporting blowout Q1 2024 earnings results that highlighted its AI progress. Revenue jumped 15% year-over-year to $80.5 billion, with profits increasing 14% to $23.7 billion. These robust gains came even as Google enacted cost-cutting layoffs and refocused spending toward generative AI like the company’s new Gemini chatbot.

On the earnings call, CEO Sundar Pichai expressed confidence Google was finding “small” ways to monetize AI already, such as improving ad targeting through its Performance Max platform. However, he signaled a go-slow approach to preserve the integrity of Google’s flagship search business. “We’re being measured in how we do this, focusing on areas where Gen AI can improve the search experience while also prioritizing traffic to websites and merchants,” Pichai stated.

Google’s strong performance across its legacy businesses gave it financial flexibility to make big AI investments. Search advertising was up 14%, YouTube ads grew 21%, and premium subscription revenues rose 18% on increasing YouTube Premium adoption. Even after over $700 million in severance costs from layoffs, Google’s operating margins remained at robust levels.

The solid Q1 results helped convince Wall Street that Google has the resources and focus to remain an AI leader. Unlike rival Meta’s stock sliding 10% recently when it warned of heavy AI investment before future payoffs, Alphabet shares surged over 5% as investors cheered its $70 billion share buyback authorization and first-ever $0.20 quarterly dividend initiation.

For investors, Google’s $2 trillion valuation reflects optimism in the company’s ability to commercialize emerging AI technologies across products like search, cloud computing, smart devices, and digital advertising. AI is expected to unlock multi-trillion dollar growth opportunities by enhancing products, streamlining operations, accelerating research, and spawning new business models.

However, realizing AI’s transformative power will require overcoming major hurdles like developing ethical guidelines, addressing data privacy, navigating a patchwork of regulations, and solving issues like bias and transparency. Failure to responsibly implement AI could open Google and peers to public backlash and legal consequences.

Yet the upsides transcend profits – the companies driving the AI revolution may gain outsized influence in shaping this disruptive technology’s societal impact for decades. For Google and its big tech brethren, striking the right balance between rapid AI development and responsibility will be as critical as the technology breakthroughs themselves.

With a $2 trillion stamp of approval, the AI era has officially arrived for Google. The search giant now faces heightened pressures to deliver on its vision of AI ushering in a new wave of groundbreaking innovations and economic prosperity. For a company born into humble startup origins, this lofty $2 trillion AI perch brings both unprecedented opportunities and unprecedented challenges.

Release – Great Lakes Dredge & Dock Corporation Schedules Announcement Of 2024 First Quarter Results

Research News and Market Data on GLDD

Apr 30, 2024

HOUSTON, April 30, 2024 (GLOBE NEWSWIRE) — Great Lakes Dredge & Dock Corporation (NASDAQ: GLDD) today announced that it will release the financial results for its three months ended March 31, 2024 on Tuesday, May 7, 2024 at 7:00 a.m. C.D.T. A conference call with the Company will be held the same day at 9:00 a.m. C.D.T.

Investors and analysts are encouraged to pre-register for the conference call by using the link below. Participants who pre-register will be given a unique PIN to gain immediate access to the call. Pre-registration may be completed at any time up to the call start time.

To pre-register, go to https://register.vevent.com/register/BId503a795e3a349eebb1ee1d193639e14

The live call and replay can also be heard at https://edge.media-server.com/mmc/p/wkfzmfb4 or on the Company’s website, www.gldd.com, under Events on the Investor Relations page. A copy of the press release will be available on the Company’s website.

The Company
Great Lakes Dredge & Dock Corporation (“Great Lakes” or the “Company”) is the largest provider of dredging services in the United States. In addition, Great Lakes is fully engaged in expanding its core business into the rapidly developing offshore wind energy industry. The Company has a long history of performing significant international projects. The Company employs experienced civil, ocean and mechanical engineering staff in its estimating, production and project management functions. In its over 134-year history, the Company has never failed to complete a marine project. Great Lakes owns and operates the largest and most diverse fleet in the U.S. dredging industry, comprised of approximately 200 specialized vessels. Great Lakes has a disciplined training program for engineers that ensures experienced-based performance as they advance through Company operations. The Company’s Incident-and Injury-Free® (IIF®) safety management program is integrated into all aspects of the Company’s culture. The Company’s commitment to the IIF® culture promotes a work environment where employee safety is paramount.

For further information contact:
Tina Baginskis
Director, Investor Relations
630-574-3024

Release – Travelzoo Announces Share Repurchase Program

Research News and Market Data on TZOO

Apr 30, 2024, 07:30 ET

NEW YORK, April 30, 2024 /PRNewswire/ — Travelzoo® (NASDAQ: TZOO), the club for travel enthusiasts, today announced that its board of directors has authorized the repurchase of up to 1,000,000 shares of the Company’s outstanding common stock.

Purchases may be made, from time to time, in the open market and will be funded from available cash. The number of shares to be purchased and the timing of purchases will be based on the level of Travelzoo’s cash balances, general business and market conditions, and other factors, including alternative investment opportunities.

About Travelzoo
We, Travelzoo®, are the club for travel enthusiasts. Our 30 million members receive exclusive offers and one-of-a-kind experiences personally reviewed by our deal experts around the globe. We have our finger on the pulse of outstanding travel, entertainment, and lifestyle experiences. We work in partnership with more than 5,000 top travel suppliers—our long-standing relationships give Travelzoo members access to irresistible deals.

Investor Relations:
ir@travelzoo.com 

SOURCE Travelzoo

Release – MAIA Biotechnology Announces Share Purchase By Director Adelina Louie In Private Placement

Research News and Market Data on MAIA

April 30, 2024 8:08am EDT

  • Original seed investor has remained top MAIA stockholder

CHICAGO–(BUSINESS WIRE)– MAIA Biotechnology, Inc., (NYSE American: MAIA) (“MAIA”, the “Company”), a clinical-stage biopharmaceutical company developing targeted immunotherapies for cancer, today announced that independent director Ms. Adelina Louie Ngar Yee made an individual purchase of 19,665 shares, and warrants for 19,665 shares, of MAIA’s common stock as part of the Company’s recent private placement of common stock and warrants to accredited investors and certain Company directors. The securities sold to the Company directors participating in the offering were issued pursuant to the Company’s 2021 Equity Incentive Plan.

Vlad Vitoc, M.D., MAIA’s Chairman and Chief Executive Officer, commented, “As a top investor in MAIA, we extend our deep appreciation to Adelina for both her longstanding support as director and for her participation in this offering alongside director Stan Smith and other long-term stockholders.”

In previous public remarks, Ms. Louie stated her belief that MAIA is at the critical point of bringing life-changing therapies to large populations of cancer sufferers.

Ms. Louie has 30 years of service with HSBC Group in a variety of functions, principally with businesses of Global Banking and Markets including investment and securities management, asset management, and global research. Most recently she was the Chief Operating Officer of Internal Audit at HSBC Group.

About MAIA Biotechnology, Inc.

MAIA is a targeted therapy, immuno-oncology company focused on the development and commercialization of potential first-in-class drugs with novel mechanisms of action that are intended to meaningfully improve and extend the lives of people with cancer. Our lead program is THIO, a potential first-in-class cancer telomere targeting agent in clinical development for the treatment of NSCLC patients with telomerase-positive cancer cells. For more information, please visit www.maiabiotech.com.

Forward Looking Statements

MAIA cautions that all statements, other than statements of historical facts contained in this press release, are forward-looking statements. Forward-looking statements are subject to known and unknown risks, uncertainties, and other factors that may cause our or our industry’s actual results, levels or activity, performance or achievements to be materially different from those anticipated by such statements. The use of words such as “may,” “might,” “will,” “should,” “could,” “expect,” “plan,” “anticipate,” “believe,” “estimate,” “project,” “intend,” “future,” “potential,” or “continue,” and other similar expressions are intended to identify forward looking statements. However, the absence of these words does not mean that statements are not forward-looking. For example, all statements we make regarding (i) the initiation, timing, cost, progress and results of our preclinical and clinical studies and our research and development programs, (ii) our ability to advance product candidates into, and successfully complete, clinical studies, (iii) the timing or likelihood of regulatory filings and approvals, (iv) our ability to develop, manufacture and commercialize our product candidates and to improve the manufacturing process, (v) the rate and degree of market acceptance of our product candidates, (vi) the size and growth potential of the markets for our product candidates and our ability to serve those markets, and (vii) our expectations regarding our ability to obtain and maintain intellectual property protection for our product candidates, are forward looking. All forward-looking statements are based on current estimates, assumptions and expectations by our management that, although we believe to be reasonable, are inherently uncertain. Any forward-looking statement expressing an expectation or belief as to future events is expressed in good faith and believed to be reasonable at the time such forward-looking statement is made. However, these statements are not guarantees of future events and are subject to risks and uncertainties and other factors beyond our control that may cause actual results to differ materially from those expressed in any forward-looking statement. Any forward-looking statement speaks only as of the date on which it was made. We undertake no obligation to publicly update or revise any forward-looking statement, whether as a result of new information, future events or otherwise, except as required by law. In this release, unless the context requires otherwise, “MAIA,” “Company,” “we,” “our,” and “us” refers to MAIA Biotechnology, Inc. and its subsidiaries.

View source version on businesswire.com: https://www.businesswire.com/news/home/20240430225198/en/

Investor Relations Contact
+1 (872) 270-3518
ir@maiabiotech.com

Source: MAIA Biotechnology, Inc.

Released April 30, 2024

Release – Maple Gold Provides Operational Update And Announces Annual Equity Incentive Plan Grants

Research News and Market Data on MGMLF

Vancouver, British Columbia–(Newsfile Corp. – April 30, 2024) – Maple Gold Mines Ltd. (TSXV: MGM) (OTCQB: MGMLF) (FSE: M3G) (“Maple Gold” or the “Company“) is pleased to provide an operational update related to the advancement of the Company’s gold projects located in Québec, Canada. Consistent with the Company’s value-oriented exploration strategy, the ongoing synthesis and reinterpretation of multiple exploration datasets by the Company’s revamped technical team is nearing completion, while management continues to significantly reduce costs and preserve capital as demonstrated in the Company’s audited financial results for the year ended December 31, 2023. The Company also announces that its Board of Directors has approved the issuance of annual equity incentive grants to certain employees, officers, directors and consultants.

Operational Update

Since late 2023, Maple Gold has been engaged in a systematic review and compilation of the extensive technical database on its entire ~400 km2 property package that straddles the fertile Casa Berardi Break and contains an established near-surface, multi-million ounce gold mineral resource as well as a past-producing high-grade gold mine complex. This critical re-evaluation is aimed at integrating all available geological, geophysical, geochemical and drilling data to improve target generation and drive exploration results. The Company’s technical team is nearing completion of a new 3D litho-structural model based on selective core relogging within mineralized zones, updated level plans, longitudinal and cross-sections, and detailed geophysical and geochemical data analysis that will support the focused ranking and prioritization of property-wide drill targets to be tested later this year. As part of this exercise, the Company has also initiated high-resolution drone magnetic surveys in selected areas, which will be completed in the next following weeks.

“With the support of our partner and key stakeholders, we have seized this golden opportunity to reposition the Company for future success by delivering a high-quality exploration model supported by a wealth of technical data while simultaneously right-sizing our business,” stated Kiran Patankar, President and CEO of Maple Gold. “We believe as strongly as ever in the compelling discovery potential offered by our strategically located district-scale gold projects. The culmination of these efforts is well-timed amid surging gold prices and increasing investment focus on organic growth through the drill bit.”

The Company has engaged with notable geological, geophysical and geochemical specialists to assist with the ongoing interpretation of the vast amount of exploration data that has been collected by Maple Gold and others over the past 50 years. This includes current members of the Company’s Technical Committee: Dr. Gérald Riverin, Mr. Maurice Tagami, P.Eng. and Mr. Paul Harbidge. The results of the geologic reinterpretation are being finalized and will be reported shortly. Drilling is expected to recommence later this year with full details to be provided in subsequent announcements.

Annual Equity Incentive Plan Grants

Pursuant to its Equity Incentive Plan (the “Plan”) dated December 17, 2020, as amended, and the policies of the TSX Venture Exchange, the Company’s Board of Directors granted stock options (“Options”), Restricted Share Units (“RSUs”) and Deferred Share Units (“DSUs”) to certain employees, officers, directors and consultants. The Company granted Options to purchase an aggregate of 4,000,000 common shares of the Company (each, a “Common Share”), with an exercise price of $0.08 per Common Share. Each Option grant vests in three equal tranches over a 24-month period. Once vested, each Option is exercisable into one Common Share for a period of five years from the date of the grant. The Company also granted a total of 3,250,000 RSUs and 725,000 DSUs. Each RSU grant vests in three equal tranches over a 24-month period. Once vested, each RSU and DSU entitles the holder thereof to receive either one Common Share, the cash equivalent of one Common Share or a combination of cash and Common Shares, as determined by the Company, net of applicable withholdings. DSUs may not be exercised until a director ceases to serve on the Company’s Board of Directors.

Further details regarding the Plan are set out in the Company’s Management Information Circular filed on May 15, 2023, which is available on SEDAR.

Qualified Person

The scientific and technical data contained in this press release was reviewed and prepared under the supervision of Jocelyn Pelletier, M.Sc., P.geo., Chief Geologist of Maple Gold. Mr. Pelletier has verified the data related to the exploration information disclosed in this press release through his direct participation in the work performed. Mr. Pelletier is a Qualified Person under National Instrument 43-101 Standards of Disclosure for Mineral Projects.

About Maple Gold

Maple Gold Mines Ltd. is a Canadian advanced exploration company in a 50/50 joint venture with Agnico Eagle Mines Limited to jointly advance the district-scale Douay and Joutel gold projects located in Québec’s prolific Abitibi Greenstone Gold Belt. The projects benefit from exceptional infrastructure access and boast ~400 km2 of highly prospective ground including an established gold resource at Douay (SLR 2022) that holds significant expansion potential as well as the past-producing Telbel and Eagle West mines at Joutel. In addition, the Company holds an exclusive option to acquire 100% of the Eagle Mine Property, a key part of the historical Joutel mining complex.

The district-scale property package also hosts a significant number of regional exploration targets along a 55-km strike length of the Casa Berardi Deformation Zone that have yet to be tested through drilling, making the project ripe for new gold and polymetallic discoveries. The Company is well capitalized and is currently focused on carrying out exploration and drill programs to grow resources and make new discoveries to establish an exciting new gold district in the heart of the Abitibi. For more information, please visit www.maplegoldmines.com.

ON BEHALF OF MAPLE GOLD MINES LTD.

“Kiran Patankar”

Kiran Patankar, President & CEO

For Further Information Please Contact:

Mr. Kiran Patankar
President & CEO
Tel: 604.639.2536
Email: kpatankar@maplegoldmines.com

NEITHER THE TSX VENTURE EXCHANGE NOR ITS REGULATION SERVICES PROVIDER (AS THAT TERM IS DEFINED IN THE POLICIES OF THE TSX VENTURE EXCHANGE) ACCEPTS RESPONSIBILITY FOR THE ADEQUACY OR ACCURACY OF THIS PRESS RELEASE.

Forward Looking Statements:

This press release contains “forward-looking information” and “forward-looking statements” (collectively referred to as “forward-looking statements”) within the meaning of applicable Canadian securities legislation in Canada, including statements about exploration work and results from current and future work programs. Forward-looking statements are based on assumptions, uncertainties and management’s best estimate of future events. Actual events or results could differ materially from the Company’s expectations and projections. Investors are cautioned that forward-looking statements involve risks and uncertainties. Accordingly, readers should not place undue reliance on forward-looking statements. For a more detailed discussion of such risks and other factors that could cause actual results to differ materially from those expressed or implied by such forward-looking statements, refer to Maple Gold Mines Ltd.’s filings with Canadian securities regulators available on www.sedarplus.ca or the Company’s website at www.maplegoldmines.comThe Company does not intend, and expressly disclaims any intention or obligation to, update or revise any forward-looking statements whether as a result of new information, future events or otherwise, except as required by law.

To view the source version of this press release, please visit https://www.newsfilecorp.com/release/207336

ZyVersa Therapeutics, Inc. (ZVSA) – Inflammation Study Links Alzheimer’s Disease With Chronic Heart Disease


Tuesday, April 30, 2024

Robert LeBoyer, Senior Vice President, Equity Research Analyst, Biotechnology, Noble Capital Markets, Inc.

Refer to the full report for the price target, fundamental analysis, and rating.

New Study On Inflammasomes Connects Alzheimer’s Disease With Cardiovascular Disease. Research published in a peer-reviewed journal has shown that Alzheimer’s disease produces inflammasome components that can lead a systemic response, including chronic heart disease and stroke. This study links inflammasomes in the brain to inflammation in distant organs, worsening cardiovascular and other chronic diseases.

Alzheimer’s Brains Produces Inflammasome Components That Travel Through the Circulation.  Using models of AD, the study found that parts of the brain had elevated levels of the inflammasome-signaling proteins. When heart ventricles were tested, they also showed significant elevations inflammasome components. Next, serum extracts were administered to cardiovascular cells in culture, resulting in inflammasome activation and significant increases of inflammatory mediators.


Get the Full Report

Equity Research is available at no cost to Registered users of Channelchek. Not a Member? Click ‘Join’ to join the Channelchek Community. There is no cost to register, and we never collect credit card information.

This Company Sponsored Research is provided by Noble Capital Markets, Inc., a FINRA and S.E.C. registered broker-dealer (B/D).

*Analyst certification and important disclosures included in the full report. NOTE: investment decisions should not be based upon the content of this research summary. Proper due diligence is required before making any investment decision.