Release – Vera Bradley Announces Second Quarter Fiscal Year 2024 Results

Research News and Market Data on VRA

Aug 30, 2023

Consolidated net revenues totaled $128.2 million

Net income totaled $9.3 million, or $0.30 per diluted share; non-GAAP net income totaled $10.2 million, or $0.33 per diluted share

Balance sheet strengthens, with cash and cash equivalents of $48.5 million, no debt, and year-over-year inventories down 22.4%

FORT WAYNE, Ind., Aug. 30, 2023 (GLOBE NEWSWIRE) — Vera Bradley, Inc. (Nasdaq: VRA) today announced its financial results for the second quarter and six months ended July 29, 2023.

In this release, Vera Bradley, Inc. or “the Company” refers to the entire enterprise and includes both the Vera Bradley and Pura Vida brands. Vera Bradley on a stand-alone basis refers to the Vera Bradley brand.

Second Quarter Comments

Jackie Ardrey, Chief Executive Officer of the Company, noted, “Our transformational efforts continue to bear fruit and are the result of the hard work of our associates across the country. We are very pleased with the meaningful year-over-year improvement in second quarter earnings, driven by significant gross margin expansion and successful expense reduction efforts. During the quarter, we carefully managed our debt-free balance sheet, adding to our cash position while continuing to strategically improve our inventory position.

“One of our key goals this year is to stabilize revenues. We continue to make progress on that front, with second quarter consolidated revenues of $128.2 million only modestly below last year.” 

“Total second quarter revenues for the Vera Bradley brand were down 1.2% from last year,” Ardrey commented. “Vera Bradley Direct revenue declines resulted from store closures over the last year, while we saw a small comparable store gain in our full line stores. The successful return of the Vera Bradley Annual Outlet Sale offset weakness we experienced in our factory outlet stores in addition to compensating for the elimination of one online outlet sale during the quarter. The remainder of our e-commerce sales continued to perform well. Lastly, Vera Bradley Indirect revenues were up slightly to last year.

“Pura Vida year-over-year sales declined 3.6%, primarily related to a shortfall in wholesale revenues, which we believe will improve in the second half of the year. Store sales remained strong, and we began to realize the benefits of changes in our performance-based marketing program. 

“In general, at both brands, customers have responded enthusiastically to our collaborations and to our product offerings when they are innovative and trend-right, even as they have been more selective in their discretionary spending in light of the current macro environment.”

Ardrey continued, “We are taking strategic actions to stabilize and steadily grow Pura Vida’s revenues and to reverse the trends in Vera Bradley’s factory outlet stores through a thorough, multi-pronged approach, including potential pricing adjustments and targeted marketing initiatives aimed to drive traffic and average order size. Our team is focused on generating long-term revenue increases, expanding gross margin, and ensuring strong financial discipline and cost control, which we expect will drive long-term profitable growth.”

Ardrey added, “We continue to make meaningful progress on Project Restoration, focusing on four key pillars of the business for each brand – Consumer, Brand, Product, and Channel. Through the first half of Fiscal 2024, we have progressed as expected. We anticipate execution of Project Restoration will drive this long-term profitable growth and deliver value to our shareholders.”

Summary of Financial Performance for the Second Quarter

Consolidated net revenues totaled $128.2 million compared to $130.4 million in the prior year second quarter ended July 30, 2022. 

For the current year second quarter, Vera Bradley, Inc.’s consolidated net income totaled $9.3 million, or $0.30 per diluted share. These results included $0.9 million of net after tax charges, comprised of $0.6 million for the amortization of definite-lived intangible assets, $0.2 million of consulting fees primarily associated with strategic initiatives, and $0.1 million of severance charges. On a non-GAAP basis, Vera Bradley, Inc.’s consolidated second quarter net income totaled $10.2 million, or $0.33 per diluted share. 

For the prior year second quarter, Vera Bradley, Inc.’s consolidated net loss totaled ($29.8) million, or ($0.95) per diluted share. These results included $32.2 million of net after tax charges, comprised of $18.2 million of Pura Vida goodwill and intangible asset impairment charges, $4.7 million of inventory adjustments associated with the exit of certain technology products and the write-off of excess mask inventory, $4.7 million of severance charges and other employee costs, $2.3 million of consulting fees associated with cost savings initiatives and CEO search, $0.9 million of purchase order cancellation fees for spring 2023 goods, $0.6 million of store impairment charges, $0.5 million of intangible asset amortization, and $0.3 million of goodMRKT exit costs. On a non-GAAP basis, Vera Bradley, Inc.’s prior year consolidated second quarter net income totaled $2.4 million, or $0.08 per diluted share. 

Summary of Financial Performance for the Six Months

Consolidated net revenues totaled $222.5 million for the current year six months ended July 29, 2023, compared to $228.8 million in the prior year six month period ended July 30, 2022.

For the current year six months, Vera Bradley, Inc.’s consolidated net income totaled $4.6 million, or $0.15 per diluted share. These results included $3.0 million of net after tax charges, comprised of $1.5 million of severance charges, $1.1 million for the amortization of definite-lived intangible assets, and $0.4 million of consulting and professional fees primarily associated with strategic initiatives. On a non-GAAP basis, Vera Bradley, Inc.’s consolidated net income for the six months totaled $7.6 million, or $0.24 per diluted share. 

For the prior year six months, Vera Bradley, Inc.’s consolidated net loss totaled ($36.7) million, or ($1.15) per diluted share. These results included $33.1 million of net after tax charges, comprised of $18.2 million of Pura Vida goodwill and intangible asset impairment charges, $4.7 million of inventory adjustments associated with the exit of certain technology products and the write-off of excess mask inventory, $4.7 million of severance charges and other employee costs, $2.4 million of consulting fees associated with cost savings initiatives and CEO search, $1.0 million of store and right-of-use asset impairment charges, $0.9 million of purchase order cancellation fees for spring 2023 goods, $0.9 million of intangible asset amortization, and $0.3 million of goodMRKT exit costs. On a non-GAAP basis, Vera Bradley, Inc.’s prior year consolidated net loss for the six months totaled ($3.6) million, or ($0.11) per diluted share. 

Non-GAAP Numbers

The current year non-GAAP second quarter and six-month income statement numbers referenced below exclude the previously outlined severance charges, intangible asset amortization, and consulting and professional fees. The prior year non-GAAP second quarter and six-month income statement numbers referenced below exclude the previously outlined goodwill and intangible asset impairment charges, inventory adjustments, severance charges and other employee costs, consulting fees, store and right-of-use asset impairment charges, purchase order cancellation fees, intangible asset amortization, and goodMRKT exit costs.

Second Quarter Details

Current year second quarter Vera Bradley Direct segment revenues totaled $85.7 million, a 1.5% decrease from $87.0 million in the prior year second quarter. Comparable sales declined 5.3% in the second quarter, primarily driven by weakness in the factory outlet channel. The Company permanently closed 19 full-line and two factory outlet stores and opened three factory outlet stores over the last twelve months. This year, the Direct segment revenues included sales from the Vera Bradley Annual Outlet sale, which was not held last year. 

Vera Bradley Indirect segment revenues totaled $17.4 million, a 0.2% increase over $17.3 million in the prior year second quarter. 

Pura Vida segment revenues totaled $25.1 million, a 3.6% decrease from $26.0 million in the prior year, reflecting a decline in sales to wholesale accounts and a modest decline in ecommerce sales, partially offset by new store growth resulting in non-comparable retail store sales.

Second quarter consolidated gross profit totaled $72.0 million, or 56.2% of net revenues, compared to $60.5 million, or 46.4% of net revenues, in the prior year. On a non-GAAP basis, prior year gross profit totaled $67.8 million, or 52.0% of net revenues. The current year gross profit rate compared to the prior year non-GAAP rate was favorably impacted by lower year-over-year inbound and outbound freight expense and the sell-through of previously-reserved inventory, partially offset by an increase in promotional activity. Prior year gross profit was materially impacted by high inbound and outbound freight expense and deleverage of overhead costs.

Second quarter consolidated SG&A expense totaled $59.4 million, or 46.3% of net revenues, compared to $74.0 million, or 56.8% of net revenues, in the prior year. On a non-GAAP basis, consolidated SG&A expense totaled $58.3 million, or 45.5% of net revenues, compared to $64.0 million, or 49.1% of net revenues, in the prior year. Vera Bradley’s current year non-GAAP SG&A expenses were lower than the prior year primarily due to Company-wide cost reduction initiatives across various areas of the enterprise. 

The Company’s second quarter consolidated operating income totaled $12.9 million, or 10.0% of net revenues, compared to an operating loss of ($42.8) million, or (32.8%) of net revenues, in the prior year second quarter. On a non-GAAP basis, the Company’s current year consolidated operating income totaled $14.0 million, or 10.9% of net revenues, compared to $3.9 million, or 3.0% of net revenues, in the prior year. 

By segment:

  • Vera Bradley Direct operating income was $20.6 million, or 24.1% of Direct net revenues, compared to $10.0 million, or 11.5% of Direct net revenues, in the prior year. On a non-GAAP basis, prior year Direct operating income totaled $16.2 million, or 18.6% of Direct revenues.
  • Vera Bradley Indirect operating income was $6.2 million, or 35.7% of Indirect net revenues, compared to $3.9 million, or 22.6% of Indirect net revenues, in the prior year. On a non-GAAP basis, prior year Indirect operating income totaled $4.9 million, or 28.4% of Indirect net revenues. 
  • Pura Vida’s operating income was $4.0 million, or 15.9% of Pura Vida net revenues, compared to an operating loss of ($28.5) million, or (109.6%) of Pura Vida net revenues, in the prior year. On a non-GAAP basis, Pura Vida’s operating income was $4.8 million, or 19.2% of Pura Vida net revenues, compared to $2.6 million, or 9.8% of Pura Vida net revenues, in the prior year.

Details for the Six Months

Vera Bradley Direct segment revenues for the current year six-month period totaled $144.6 million, a 2.7% decrease from $148.6 million in the prior year. Comparable sales declined 4.5% for the six months. This year, the Direct segment revenues included sales from the Vera Bradley Annual Outlet sale, which was not held last year.

Vera Bradley Indirect segment revenues for the six months totaled $32.7 million, a 4.6% decrease from $34.3 million last year. Prior year revenues reflected a large one-time key account order that was not repeated in the current year. 

Pura Vida segment revenues totaled $45.2 million, a 1.5% decrease from $45.9 million in the prior year, reflecting a decline in sales to wholesale accounts and a modest decline in ecommerce sales, partially offset by new store growth resulting in non-comparable retail store sales.

Consolidated gross profit for the six months totaled $123.8 million, or 55.6% of net revenues, compared to $113.0 million, or 49.4% of net revenues, in the prior year. On a non-GAAP basis, prior year gross profit totaled $120.3 million, or 52.6% of net revenues. The current year gross profit rate compared to the prior year non-GAAP rate was favorably impacted by lower year-over-year inbound and outbound freight expense and the sell-through of previously-reserved inventory, partially offset by an increase in promotional activity. 

For the six months, consolidated SG&A expense totaled $117.9 million, or 53.0% of net revenues, compared to $135.0 million, or 59.0% of net revenues, in the prior year. On a non-GAAP basis, current year consolidated SG&A expense totaled $113.9 million, or 51.2% of net revenues, compared to $123.4 million, or 53.9% of net revenues, in the prior year. Vera Bradley’s current year non-GAAP SG&A expenses were lower than the prior year primarily due Company-wide cost reduction initiatives across various areas of the enterprise.

For the six months, the Company’s consolidated operating income totaled $6.5 million, 2.9% of net revenues, compared to an operating loss of ($51.1) million, or (22.3%) of net revenues, in the prior year six-month period. On a non-GAAP basis, the Company’s current year consolidated operating income was $10.5 million, or 4.7% of net revenues, compared to an operating loss of ($2.9) million, or (1.2%) of net revenues, in the prior year.

By segment:

  • Vera Bradley Direct operating income was $28.0 million, or 19.3% million of Direct net revenues, compared to $15.5 million, or 10.5% of Direct net revenues, in the prior year. On a non-GAAP basis, current year Direct operating income was $28.3 million, or 19.6% of Direct net revenues, compared to $21.7 million, or 14.6% of Direct net revenues, in the prior year.
  • Vera Bradley Indirect operating income was $10.9 million, or 33.3% of Indirect net revenues, compared to $9.4 million, or 27.4% of Indirect net revenues, in the prior year. On a non-GAAP basis, prior year Indirect operating income totaled $10.4 million, or 30.3% of Indirect net revenues.
  • Pura Vida’s operating income was $5.6 million, or 12.3% of Pura Vida net revenues, compared to an operating loss of ($27.5) million, or (59.9%) of Pura Vida net revenues, in the prior year. On a non-GAAP basis, Pura Vida’s operating income was $7.1 million, or 15.7% of Pura Vida net revenues, compared to $4.4 million, or 9.5% of Pura Vida net revenues, in the prior year.

Balance Sheet

Net capital spending for the six months ended July 29, 2023 totaled $1.7 million compared to $4.4 million in the prior year.

Cash and cash equivalents as of July 29, 2023 totaled $48.5 million compared to $38.3 million at the end of last year’s second quarter. The Company had no borrowings on its $75 million asset-based lending (“ABL”) facility at quarter end.

Subsequent to quarter end, the Company completed renegotiation of its ABL agreement, and the modifications, among other things, convert the interest calculation from LIBOR (London Interbank Offer Rate) to SOFR (Secured Overnight Financing Rate) as well as enhance the Company’s future ability to expand the ABL if necessary. Management believes that its access to liquidity and capital is sufficient to address needs in the foreseeable future. 

Total quarter-end inventory was $139.3 million, compared to $179.6 million at the end of the second quarter last year.

During the second quarter, the Company repurchased approximately $683,000 of its common stock (120,220 shares at an average price of $5.68), bringing the total repurchased for the six months to approximately $1.4 million (248,320 shares at an average price of $5.70). The Company has $26.3 million remaining under its $50.0 million repurchase authorization that expires in December 2024.

Forward Outlook

Management is updating certain components of guidance for the fiscal year ending February 3, 2024 (“Fiscal 2024”) based on first half performance, Company initiatives underway, and current macroeconomic trends and expectations. The Company has narrowed the guidance range for diluted earnings per share.

Excluding net revenues, all forward-looking guidance numbers referenced below are non-GAAP. The prior year income statement numbers exclude the previously disclosed charges for goodwill and intangible asset impairment; net inventory and purchase order-related adjustments; severance, retention, and stock-based retirement compensation; consulting and professional fees primarily associated with cost savings initiatives, the CEO search, and strategic initiatives; amortization of definite-lived intangible assets; store and right-of-use asset impairment charges; new CEO sign-on bonus and relocation; and goodMRKT exit costs. Current year guidance excludes any similar charges.

For Fiscal 2024, the Company’s updated expectations are as follows:

  • Consolidated net revenues of $490 to $500 million. Net revenues totaled $500.0 million in Fiscal 2023.
  • A consolidated gross profit percentage of 53.0% to 53.8% compared to 51.4% in Fiscal 2023. The Fiscal 2024 gross profit rate is expected to be favorably impacted by lower year-over-year freight expense, cost reduction initiatives, and the sell-through of previously-reserved inventory, partially offset by an increase in promotional activity. 
  • Consolidated SG&A expense of $237 to $243 million compared to $245.3 million in Fiscal 2023. An expected decline in SG&A expense is being driven by Company-wide cost reduction initiatives, partially offset by restoring short-term and long-term incentive compensation to more normalized levels and incremental marketing investment intended to accelerate customer file growth.
  • Consolidated operating income of $24 to $28 million compared to $12.3 million in Fiscal 2023.
  • Free cash flow of between $40 and $45 million compared to a cash usage of $21.7 million in Fiscal 2023.
  • Consolidated diluted EPS of $0.57 to $0.65 based on diluted weighted-average shares outstanding of approximately 31.0 million and an effective tax rate of approximately 28%. Diluted EPS totaled $0.24 last year. 
  • Net capital spending of approximately $5 million compared to $8.2 million in the prior year, reflecting investments associated with new Vera Bradley factory outlet stores and technology and logistics enhancements. 

Disclosure Regarding Non-GAAP Measures

The Company’s management does not, nor does it suggest that investors should, consider the supplemental non-GAAP financial measures in isolation from, or as a substitute for, financial information prepared in accordance with accounting principles generally accepted in the United States (“GAAP”). Further, the non-GAAP measures utilized by the Company may be unique to the Company, as they may be different from non-GAAP measures used by other companies.

The Company believes that the non-GAAP measures presented in this earnings release, including free cash flow (cash usage); gross profit; selling, general, and administrative expenses; operating income (loss); net income (loss); net income (loss) attributable and available to Vera Bradley, Inc.; and diluted net income (loss) per share available to Vera Bradley, Inc. common shareholders, along with the associated percentages of net revenues, are helpful to investors because they allow for a more direct comparison of the Company’s year-over-year performance and are consistent with management’s evaluation of business performance. A reconciliation of the non-GAAP measures to the most directly comparable GAAP measures can be found in the Company’s supplemental schedules included in this earnings release.

Call Information

A conference call to discuss results for the second quarter is scheduled for today, Wednesday, August 30, 2023, at 9:30 a.m. Eastern Time. A broadcast of the call will be available via Vera Bradley’s Investor Relations section of its website, www.verabradley.com. Alternatively, interested parties may dial into the call at (888) 394-8218, and enter the access code 1990839. A replay will be available shortly after the conclusion of the call and remain available through September 13, 2023. To access the recording, listeners should dial (844) 512-2921, and enter the access code 1990839.

About Vera Bradley, Inc.

Vera Bradley, Inc. operates two unique lifestyle brands – Vera Bradley and Pura Vida. Vera Bradley and Pura Vida are complementary businesses, both with devoted, emotionally-connected, and multi-generational female customer bases; alignment as casual, comfortable, affordable, and fun brands; positioning as “gifting” and socially-connected brands; strong, entrepreneurial cultures; a keen focus on community, charity, and social consciousness; multi-channel distribution strategies; and talented leadership teams aligned and committed to the long-term success of their brands.

Vera Bradley, based in Fort Wayne, Indiana, is a leading designer of women’s handbags, luggage and other travel items, fashion and home accessories, and unique gifts. Founded in 1982 by friends Barbara Bradley Baekgaard and Patricia R. Miller, the brand is known for its innovative designs, iconic patterns, and brilliant colors that inspire and connect women unlike any other brand in the global marketplace.

In July 2019, Vera Bradley, Inc. acquired a 75% interest in Creative Genius, Inc., which also operates under the name Pura Vida Bracelets (“Pura Vida”). Pura Vida, based in La Jolla, California, is a digitally native, highly-engaging lifestyle brand founded in 2010 by friends Paul Goodman and Griffin Thall. Pura Vida has a differentiated and expanding offering of bracelets, jewelry, and other lifestyle accessories. The Company acquired the remaining 25% of Pura Vida in January 2023. 

The Company has three reportable segments: Vera Bradley Direct (“VB Direct”), Vera Bradley Indirect (“VB Indirect”), and Pura Vida. The VB Direct business consists of sales of Vera Bradley products through Vera Bradley Full-Line and Factory Outlet stores in the United States, www.verabradley.com, Vera Bradley’s online outlet site, and the Vera Bradley annual outlet sale in Fort Wayne, Indiana. The VB Indirect business consists of sales of Vera Bradley products to approximately 1,700 specialty retail locations throughout the United States, as well as select department stores, national accounts, third party e-commerce sites, and third-party inventory liquidators, and royalties recognized through licensing agreements related to the Vera Bradley brand. The Pura Vida segment consists of sales of Pura Vida products through the Pura Vida websites, www.puravidabracelets.comwww.puravidabracelets.ca, and www.puravidabracelets.eu; through the distribution of its products to wholesale retailers and department stores; and through its Pura Vida retail stores.

Website Information

We routinely post important information for investors on our website www.verabradley.com in the “Investor Relations” section. We intend to use this webpage as a means of disclosing material, non-public information and for complying with our disclosure obligations under Regulation FD. Accordingly, investors should monitor the Investor Relations section of our website, in addition to following our press releases, SEC filings, public conference calls, presentations and webcasts. The information contained on, or that may be accessed through, our webpage is not incorporated by reference into, and is not a part of, this document.

Investors and other interested parties may also access the Company’s most recent Corporate Responsibility and Sustainability Report outlining its ESG (Environmental, Social, and Governance) initiatives at https://verabradley.com/pages/corporate-responsibility.

Vera Bradley Safe Harbor Statement

Certain statements in this release are “forward-looking statements” made pursuant to the safe-harbor provisions of the Private Securities Litigation Reform Act of 1995. Such forward-looking statements reflect the Company’s current expectations or beliefs concerning future events and are subject to various risks and uncertainties that may cause actual results to differ materially from those that we expected, including: possible adverse changes in general economic conditions and their impact on consumer confidence and spending; possible inability to predict and respond in a timely manner to changes in consumer demand; possible loss of key management or design associates or inability to attract and retain the talent required for our business; possible inability to maintain and enhance our brands; possible inability to successfully implement the Company’s long-term strategic plans; possible inability to successfully open new stores, close targeted stores, and/or operate current stores as planned; incremental tariffs or adverse changes in the cost of raw materials and labor used to manufacture our products; possible adverse effects resulting from a significant disruption in our distribution facilities; or business disruption caused by pandemics. Risks, uncertainties, and assumptions also include the possibility that Pura Vida acquisition benefits may not materialize as expected and that Pura Vida’s business may not perform as expected. More information on potential factors that could affect the Company’s financial results is included from time to time in the “Risk Factors” and “Management’s Discussion and Analysis of Financial Condition and Results of Operations” sections of the Company’s public reports filed with the SEC, including the Company’s Form 10-K for the fiscal year ended January 28, 2023. We undertake no obligation to publicly update or revise any forward-looking statement. Financial schedules are attached to this release.

CONTACTS:
Investors:
Julia Bentley
jbentley@verabradley.com

Media:
mediacontact@verabradley.com
877-708-VERA (8372)

      
Vera Bradley, Inc.
Condensed Consolidated Balance Sheets
(in thousands)
(unaudited)
      
 July 29,
 2023
 January 28,
 2023
 July 30,
 2022
Assets     
Current assets:     
     Cash and cash equivalents$48,522  $46,595  $38,321 
     Accounts receivable, net 23,944   22,105   25,593 
     Inventories 139,301   142,275   179,557 
     Income taxes receivable 2,180   1,311   5,113 
     Prepaid expenses and other current assets 14,625   14,276   16,913 
                    Total current assets 228,572   226,562   265,497 
      
Operating right-of-use assets 69,932   77,954   85,793 
Property, plant, and equipment, net 56,127   58,674   60,305 
Intangible assets, net 14,460   15,918   32,769 
Goodwill       24,833 
Deferred income taxes 20,014   21,542   9,276 
Other assets 2,395   3,851   4,748 
                    Total assets$391,500  $404,501  $483,221 
      
Liabilities, Redeemable Noncontrolling Interest, and Shareholders’ Equity     
Current liabilities:     
     Accounts payable$21,605  $20,350  $43,722 
     Accrued employment costs 12,965   14,312   16,018 
     Short-term operating lease liabilities 19,587   19,714   19,768 
     Other accrued liabilities 13,496   12,723   21,526 
     Income taxes payable 528   558   374 
                    Total current liabilities 68,181   67,657   101,408 
      
Long-term operating lease liabilities 66,718   74,664   84,015 
Other long-term liabilities 82   90   157 
                    Total liabilities 134,981   142,411   185,580 
      
Redeemable noncontrolling interest    10,712   23,491 
Shareholders’ equity:     
     Additional paid-in-capital 111,663   109,718   107,941 
     Retained earnings 279,204   274,629   297,623 
     Accumulated other comprehensive loss (69)  (105)  (135)
     Treasury stock (134,279)  (132,864)  (131,279)
                    Total shareholders’ equity of Vera Bradley, Inc. 256,519   251,378   274,150 
                    Total liabilities, redeemable noncontrolling interest, and shareholders’ equity$391,500  $404,501  $483,221 
      
        
Vera Bradley, Inc.
Condensed Consolidated Statements of Operations
(in thousands, except per share amounts)
(unaudited)
        
        
 Thirteen Weeks Ended Twenty-Six Weeks Ended
 July 29,
 2023
 July 30,
 2022
 July 29,
 2023
 July 30,
 2022
        
Net revenues$128,172 $130,371  $222,534 $228,830 
Cost of sales 56,156  69,854   98,769  115,799 
     Gross profit 72,016  60,517   123,765  113,031 
Selling, general, and administrative expenses 59,405  74,042   117,911  134,956 
Impairment of goodwill and intangible assets   29,338     29,338 
Other income, net 260  42   631  209 
     Operating income (loss) 12,871  (42,821)  6,485  (51,054)
Interest expense, net 12  36   44  76 
   Income (loss) before income taxes 12,859  (42,857)  6,441  (51,130)
Income tax expense (benefit) 3,605  (5,956)  1,866  (7,519)
     Net income (loss) 9,254  (36,901)  4,575  (43,611)
Less: Net loss attributable to redeemable noncontrolling interest   (7,134)    (6,870)
Net income (loss) attributable to Vera Bradley, Inc.$9,254 $(29,767) $4,575 $(36,741)
        
Basic weighted-average shares outstanding 30,901  31,429   30,847  32,051 
Diluted weighted-average shares outstanding 31,139  31,429   31,208  32,051 
        
Basic net income (loss) per share available to Vera Bradley, Inc. common shareholders$0.30 $(0.95) $0.15 $(1.15)
Diluted net income (loss) per share available to Vera Bradley, Inc. common shareholders$0.30 $(0.95) $0.15 $(1.15)
    
Vera Bradley, Inc.
Condensed Consolidated Statements of Cash Flows
(in thousands)
(unaudited)
    
    
 Twenty-Six Weeks Ended
 July 29,
 2023
 July 30,
 2022
Cash flows from operating activities   
Net income (loss)$4,575  $(43,611)
Adjustments to reconcile net income (loss) to net cash provided by (used in) operating activities:   
     Depreciation of property, plant, and equipment 4,070   4,371 
     Amortization of operating right-of-use assets 10,501   10,621 
     Goodwill and intangible asset impairment    29,338 
     Other impairment charges    1,351 
     Amortization of intangible assets 1,458   1,537 
     Provision for doubtful accounts 17   (119)
     Stock-based compensation 1,601   1,444 
     Deferred income taxes 2,102   (5,419)
     Other non-cash loss, net 40    
     Changes in assets and liabilities:   
          Accounts receivable (1,856)  (4,793)
          Inventories 2,974   (34,676)
          Prepaid expenses and other assets 1,107   348 
          Accounts payable 1,403   12,759 
          Income taxes (899)  4,652 
          Operating lease liabilities, net (10,552)  (12,910)
          Accrued and other liabilities (566)  7,989 
Net cash provided by (used in) operating activities 15,975   (27,118)
    
Cash flows from investing activities    
     Purchases of property, plant, and equipment (1,727)  (4,391)
     Cash paid for business acquisition (10,000)   
Net cash used in investing activities (11,727)  (4,391)
    
Cash flows from financing activities    
     Tax withholdings for equity compensation (942)  (1,410)
     Repurchase of common stock (1,415)  (16,477)
     Distributions to redeemable noncontrolling interest    (613)
Net cash used in financing activities (2,357)  (18,500)
Effect of exchange rate changes on cash and cash equivalents 36   (106)
    
Net increase (decrease) in cash and cash equivalents$1,927  $(50,115)
Cash and cash equivalents, beginning of period 46,595   88,436 
Cash and cash equivalents, end of period$48,522  $38,321 
    
 
Vera Bradley, Inc.
Second Quarter Fiscal 2024
GAAP to Non-GAAP Reconciliation Thirteen Weeks Ended July 29, 2023
(in thousands, except per share amounts)
(unaudited)
 Thirteen Weeks Ended
 As Reported Other Items Non-GAAP
(Excluding Items)
Gross profit$72,016  $  $72,016 
Selling, general, and administrative expenses 59,405   1,101 1 58,304 
Operating income (loss) 12,871   (1,101)  13,972 
Income (loss) before income taxes 12,859   (1,101)  13,960 
Income tax expense (benefit) 3,605   (157)2 3,762 
Net income (loss) 9,254   (944)  10,198 
Less: Net loss attributable to redeemable noncontrolling interest        
Net income (loss) attributable to Vera Bradley, Inc. 9,254   (944)  10,198 
Diluted net income (loss) per share available to Vera Bradley, Inc. common shareholders$0.30  $(0.03) $0.33 
      
Vera Bradley Direct segment operating income$20,621  $  $20,621 
Vera Bradley Indirect segment operating income$6,204  $  $6,204 
Pura Vida segment operating income (loss)$4,000  $(808)3$4,808 
Unallocated corporate expenses$(17,954) $(293)4$(17,661)
      
1Items include $729 for the amortization of definite-lived intangible assets; $293 for certain professional fees and consulting fees associated with strategic initiatives; and $79 for severance charges
2Related to the tax impact of the items mentioned above
3Related to $729 for the amortization of definite-lived intangible assets and $79 for severance charges
4Related to certain professional fees and consulting fees for strategic initiatives
 
Vera Bradley, Inc.
Second Quarter Fiscal 2023
GAAP to Non-GAAP Reconciliation Thirteen Weeks Ended July 30, 2022
(in thousands, except per share amounts)
(unaudited)
 Thirteen Weeks Ended
 As Reported Other Items Non-GAAP
(Excluding Items)
Gross profit (loss)$60,517  $(7,276)1$67,793 
Selling, general, and administrative expenses 74,042   10,076 2 63,966 
Impairment of goodwill and intangible assets 29,338   29,338    
Operating (loss) income (42,821)  (46,690)  3,869 
(Loss) Income before income taxes (42,857)  (46,690)  3,833 
Income tax (benefit) expense (5,956)  (6,760)3 804 
Net (loss) income (36,901)  (39,930)  3,029 
Less: Net (loss) income attributable to redeemable noncontrolling interest (7,134)  (7,771)  637 
Net (loss) income attributable to Vera Bradley, Inc. (29,767)  (32,159)  2,392 
Diluted net (loss) income per share available to Vera Bradley, Inc. common shareholders$(0.95) $(1.02) $0.08 
      
Vera Bradley Direct segment operating income (loss)$10,044  $(6,173)4$16,217 
Vera Bradley Indirect segment operating income (loss)$3,918  $(994)5$4,912 
Pura Vida segment operating (loss) income$(28,534) $(31,085)6$2,551 
Unallocated corporate expenses$(28,249) $(8,438)7$(19,811)
      
1Items include $6,142 for inventory adjustments associated with the exit of certain technology products and the goodMRKT brand, as well as excess mask products and $1,134 for PO cancellation fees
2Items include $5,714 for severance charges; $2,755 for consulting fees associated with cost savings initiatives and CEO search; $768 for the amortization of definite-lived intangible assets; $759 for store impairment charges; and $80 for goodMRKT brand exit costs
3Related to the tax impact of the charges mentioned above, as well as goodwill and intangible asset impairment charges
4Related to $5,097 related to an allocation for certain inventory adjustments and PO cancellation fees; $759 for store impairment charges; $302 for goodMRKT brand exit costs; and $15 for severance charges
5Related to an allocation for certain inventory adjustments and PO cancellation fees
6Related to $29,338 of goodwill and intangible asset impairment charges; $963 for inventory adjustments associated with mask products; $768 for the amortization of definite-lived intangible assets;
and $16 for severance charges
7Related to $5,683 for severance charges and $2,755 for consulting fees associated with cost savings initiatives and CEO search
 
Vera Bradley, Inc.
GAAP to Non-GAAP Reconciliation Twenty-Six Weeks Ended July 29, 2023
(in thousands, except per share amounts)
(unaudited)
 Twenty-Six Weeks Ended
 As Reported Other Items Non-GAAP
(Excluding Items)
Gross profit$123,765  $  $123,765 
Selling, general, and administrative expenses 117,911   4,001 1 113,910 
Operating income (loss) 6,485   (4,001)  10,486 
Income (loss) before income taxes 6,441   (4,001)  10,442 
Income tax expense (benefit) 1,866   (1,013)2 2,879 
Net income (loss) 4,575   (2,988)  7,563 
Less: Net loss attributable to redeemable noncontrolling interest        
Net income (loss) attributable to Vera Bradley, Inc. 4,575   (2,988)  7,563 
Diluted net income (loss) per share available to Vera Bradley, Inc. common shareholders$0.15  $(0.10) $0.24 
      
Vera Bradley Direct segment operating income (loss)$27,961  $(342)3$28,303 
Vera Bradley Indirect segment operating income$10,910  $  $10,910 
Pura Vida segment operating income (loss)$5,562  $(1,537)4$7,099 
Unallocated corporate expenses$(37,948) $(2,122)5$(35,826)
      
1Items include $2,068 for severance charges; $1,458 for the amortization of definite-lived intangible assets; and $475 for certain professional fees and consulting fees associated with strategic initiatives
2Related to the tax impact of the items mentioned above
3Related to severance charges
4Related to $1,458 for the amortization of definite-lived intangible assets and $79 for severance charges
5Items include $1,647 for severance charges and $475 associated with certain professional fees and consulting fees for strategic initiatives
 
Vera Bradley, Inc.
GAAP to Non-GAAP Reconciliation Twenty-Six Weeks Ended July 30, 2022
(in thousands, except per share amounts)
(unaudited)
 Twenty-Six Weeks Ended
 As Reported Other Items Non-GAAP
(Excluding Items)
Gross profit (loss)$113,031  $(7,276)1$120,307 
Selling, general, and administrative expenses 134,956   11,587 2 123,369 
Impairment of goodwill and intangible assets 29,338   29,338    
Operating loss (51,054)  (48,201)  (2,853)
Loss before income taxes (51,130)  (48,201)  (2,929)
Income tax benefit (7,519)  (7,135)3 (384)
Net loss (43,611)  (41,066)  (2,545)
Less: Net (loss) income attributable to redeemable noncontrolling interest (6,870)  (7,963)  1,093 
Net loss attributable to Vera Bradley, Inc. (36,741)  (33,103)  (3,638)
Diluted net loss per share available to Vera Bradley, Inc. common shareholders$(1.15) $(1.03) $(0.11)
      
Vera Bradley Direct segment operating income (loss)$15,547  $(6,173)4$21,720 
Vera Bradley Indirect segment operating income (loss)$9,397  $(994)5$10,391 
Pura Vida segment operating (loss) income$(27,478) $(31,854)6$4,376 
Unallocated corporate expenses$(48,520) $(9,180)7$(39,340)
      
1Items include $6,142 for inventory adjustments associated with the exit of certain technology products and the goodMRKT brand, as well as excess mask products and $1,134 for PO cancellation fees
2Items include $5,714 for severance charges; $2,905 for consulting fees associated with cost savings initiatives and CEO search; $1,537 for the amortization of definite-lived intangible assets; $1,351 for store and right-of-use asset impairment charges; and $80 for goodMRKT brand exit costs
3Related to the tax impact of the charges mentioned above, as well as goodwill and intangible asset impairment charges
4Related to $5,097 related to an allocation for certain inventory adjustments and PO cancellation fees; $759 for store impairment charges; $302 for goodMRKT brand exit costs; and $15 for severance charges
5Related to an allocation for certain inventory adjustments and PO cancellation fees
6Related to $29,338 of goodwill and intangible asset impairment charges; $963 for inventory adjustments associated with mask products; $1,537 for the amortization of definite-lived intangible assets;
and $16 for severance charges
7Related to $5,683 for severance charges; $2,905 for consulting fees associated with cost savings initiatives and CEO search; and $592 for a right-of-use asset impairment charge

Largo Inc. (LGO) – Largo Initiates Strategic Review – What does that mean?


Wednesday, August 30, 2023

Largo has a long and successful history as one of the world’s preferred vanadium companies through the supply of its VPURE™ and VPURE+™ products, which are sourced from one of the world’s highest-grade vanadium deposits at the Company’s Maracás Menchen Mine in Brazil. Aiming to enhance value creation at Largo, the Company is in the process of implementing a titanium dioxide pigment plant using feedstock sourced from its existing operations in addition to advancing its U.S.-based clean energy division with its VCHARGE vanadium batteries. Largo’s VCHARGE vanadium batteries contain a variety of innovations, enabling an efficient, safe and ESG-aligned long duration solution that is fully recyclable at the end of its 25+ year lifespan. Producing some of the world’s highest quality vanadium, Largo’s strategic business plan is based on two pillars: 1.) leading vanadium supplier with an outlined growth plan and 2.) U.S.-based energy storage business support a low carbon future.

Michael Heim, Senior Vice President, Equity Research Analyst, Energy & Transportation, Noble Capital Markets, Inc.

Refer to the full report for the price target, fundamental analysis, and rating.

Largo announced that its Board has initiated a review and evaluation of strategic alternatives for Largo Clean Energy. LCE represents Largo’s interest in energy storage investments including the Vanadium Redox Flow Battery (VRFB). VRFBs have the potential to store energy at the utility grid level for longer periods that lithium batteries. LCE was formed in 2020 with the acquisition of assets and patents owned by VionX Energy for $3.862 million. The division has completed a 3 MWH test project in Massachusetts and is near completion of a 6.1 MWH battery for Enel Green Power in Spain. Strategic alternatives for LCE could include the sale, merger, or other financial arrangements with other parties interested in vanadium batteries.

Would Largo consider selling LCE outright? Largo has a unique corporate structure that includes mining (Largo Production), LCE, and its investment in publicly-traded vanadium units (Large Physical Vanadium). Through its involvement in all three units, it hopes to promote the development of VRFBs. Increased adoption of VRFBs would greatly enhance the demand for vanadium. We believe Largo remains committed to promoting VRFBs but would be willing to sell LCE, or a partial interest in LCE, if it were to find a partner sharing an equal commitment.


Get the Full Report

Equity Research is available at no cost to Registered users of Channelchek. Not a Member? Click ‘Join’ to join the Channelchek Community. There is no cost to register, and we never collect credit card information.

This Company Sponsored Research is provided by Noble Capital Markets, Inc., a FINRA and S.E.C. registered broker-dealer (B/D).

*Analyst certification and important disclosures included in the full report. NOTE: investment decisions should not be based upon the content of this research summary. Proper due diligence is required before making any investment decision. 

Heightened Anticipation in Cannabis Industry

U.S. Department of Health Recommends Marijuana Reclassification – Boosts Cannabis Stocks

A letter with far-reaching implications for the cannabis industry has prompted double-digit gains for companies in the marijuana industry, both large and small. Making further headway toward a less restrictive federal government, the U.S. Department of Health and Human Services (HHS) has taken another step in reshaping the legal landscape of cannabis in the United States. In the latest move, as reported by Bloomberg News, the HHS has urged for the relaxation of restrictions on marijuana, this marks a potential turning point for the developing cannabis industry.

A Letter with Far-Reaching Implications

The letter written by U.S. Assistant Secretary for Health, Rachel Levine, to Anne Milgram, the Administrator of the Drug Enforcement Administration (DEA), has heightened anticipation for meaningful changes in marijuana’s classification. Currently categorized as a Schedule I drug under the Controlled Substances Act, marijuana’s potential reclassification to Schedule III, as proposed by Levine, could have far-reaching implications.

Divergent State Laws and Federal Stance

The ongoing contradiction between federal and state marijuana laws has long posed challenges for both cannabis businesses and users. Although around 40 U.S. states have embraced various forms of marijuana legalization, the federal stance remains staunchly prohibitive, creating a perplexing legal labyrin

A Presidential Push for Review

The DEA’s confirmation of receiving the HHS letter aligns with President Joe Biden’s call for a comprehensive review of marijuana’s classification. The administration’s objective to base its decisions on evidence and expert evaluations underscores a commitment to an impartial and well-informed process.

White House spokesperson Karine Jean-Pierre emphasized, “The administration’s process is an independent process led by HHS, led by the Department of Justice and guided by evidence … we will let that process move forward.”

Market Reaction and Future Prospects

The market response to this potentially pivotal development is what one might expect. Medicine Man Technologies, operating under the name Schwazze (SHWZ) is a vertically integrated cannabis company with roots in Colorado. Schwazze stock price jumped 18% on the news. Jushi (JUSHF) is a premium brand provider of cannabis products operating in Florida, Ohio, and Colorado. Jushi Holdings Inc. rose 34% once word of the letter spread through the markets. Charlottes Web (CWBHF), another Colorado-based company involved in farming, manufacturing, marketing, and selling hemp-derived cannabidiol (CBD) wellness products, was lifted by more than 12%.

Take a moment to learn more about Schwazze, a leading vertically integrated cannabis holding company with a portfolio consisting of top-tier licensed brands spanning cultivation, extraction, infused-product manufacturing, dispensary operations, consulting, and a nutrient line.

Click here for company information, including equity research from Noble Capital Markets.

The sharp reaction reflects tangible market optimism regarding the potential reshaping of the legal framework surrounding cannabis.

DEA’s Next Steps

The DEA, wields the final authority to determine drug scheduling under the Controlled Substances Act, it is set to initiate a comprehensive review process. HHS’s scientific and medical evaluation will serve as a crucial input in this review, potentially leading to a revision in marijuana’s classification.

Awaiting Further Insights

As this significant reevaluation unfolds, industry stakeholders, advocates, and the general public await further insights into the potential impacts of any regulatory shift. The eventual outcome could mark a defining moment in the trajectory of cannabis legalization, and ability for companies in the industry to have all the advantages non-marijuana companies enjoy.  

The evolving dynamics in the cannabis sector warrant close observation by interested investors as the regulatory landscape continues to transform.

Paul Hoffman

Managing Editor, Channelchek

Source

https://www.reuters.com/business/healthcare-pharmaceuticals/hhs-official-calls-move-marijuana-lower-risk-drug-category-bloomberg-news-2023-08-30/

Investor Opportunity in Lithium Stocks Seems to Be Increasing

Why Small Lithium Developers and  Producers May Become Stars By Mid-Decade

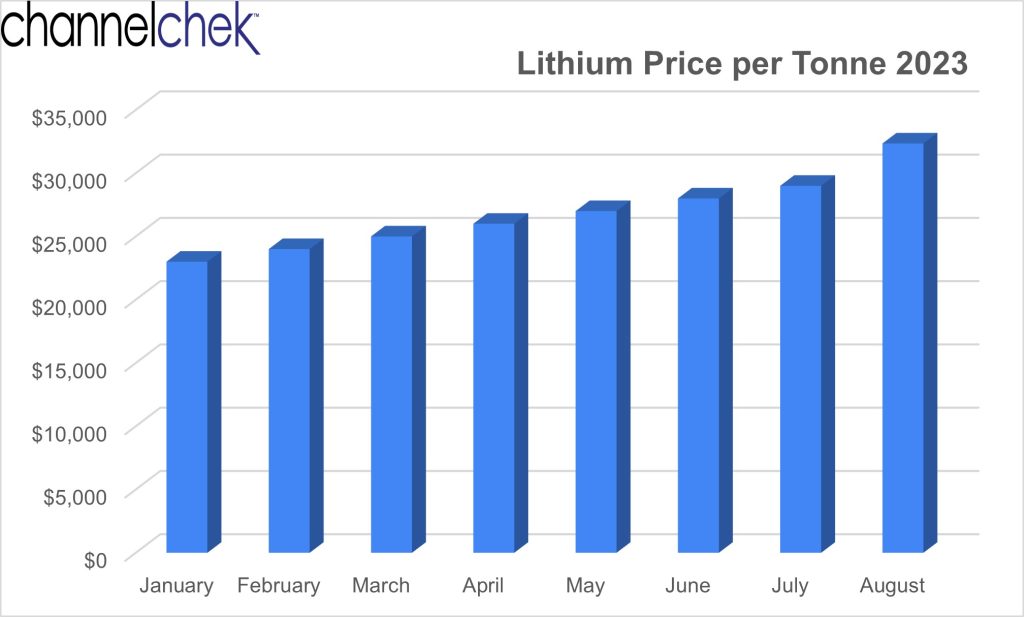
Lithium demand isn’t going away; in fact, it is likely to skyrocket. While most people link future EV sales forecasts with Lithium-ion battery growth, the increased use of li-ion batteries goes well beyond electric vehicle production. Some highly regarded analysts are now predicting a difficult lithium deficit as early as 2025. If demand outstrips supply that quickly, prices of the mineral will be under extreme upward pressure. If the accelerating demand unfolds as expected, investors looking to get ahead of the curve may want to increase their exposure to lithium investments soon. Below is a background on current forecasts and ideas to explore.

Background

The Fitch subsidiary, Business Monitor International (BMI), is a research unit of the parent company best known for its rating service. BMI has a team of over 300 analysts who specialize in a variety of industries, including energy, mining, and technology. The company’s research is used by businesses to make informed decisions about their operations. BMI now estimates that China’s lithium demand for EVs will grow by an average of 20.4% each year between 2023 and 2032. However, current estimates for the country’s lithium output are only expected to grow by 6% over the same period. This means that China will need to import massive amounts of lithium just to meet its growth in EV production.

At the same time, the global demand for lithium is also expected to grow significantly. Some informed projections are that global demand for lithium will reach over 3 million metric tons (tonne) by 2030. As a comparison, this is up from 540,000 metric tons in 2021.

There are currently just 101 lithium mines in the world, and many of these mining operations are nearing the end of their lifespan. In addition, the permitting process for new lithium mines can be lengthy and complex. This is slowing the development of new lithium production facilities. Consequently, the growing demand for lithium, which is already seen as straining global supply, may become substantially more challenging over the next 18 months.

More demand relative to supply is the most basic recipe for higher prices. As a result of the supply constraints, lithium prices are expected to remain high in the coming years. Lithium carbonate prices surged to a record of almost 600,000 yuan per tonne in November 2022.

Source: Google Finance

The EV industry is working to address the lithium supply deficit, but it is the producers that are working to be more efficient and productive. Some companies are developing new ways to extract lithium from brines, which are salty water bodies that contain lithium. Other companies are working to recycle lithium-ion batteries. However, lithium is a finite resource, and an approaching supply deficit shows no signs of being fixed soon. In the meantime the EV industry and others will compete for what is what is being produced, which could drive up prices.  

What This Means for Investors

Investors who are interested in the lithium market should take note of the projections for the growing supply/demand imbalance. Lithium mining companies, especially smaller pure-plays on the demand for lithium, may have the highest percentage benefit from higher prices. Three such companies are listed below with links to further information and data relevant to the company.

Century Lithium Corp. (LCE:CA) is a Canadian-based advanced-stage lithium Company, focused on developing its 100%-owned Clayton Valley Lithium Project in the U.S. (Nevada). Century Lithium is actively testing material from its lithium-bearing claystone deposit at its Lithium Extraction Facility while moving toward the completion of a Feasibility Study, with the goal to become a domestic producer of lithium for the growing electric vehicle and battery storage market.

Mark Reichamn, Noble Capital Markets senior research analyst for natural resources, published a research note explaining a collaboration between Century Lithium and Koch Technology Solutions (KTS) where lithium is being recovered from leach solution.

Noble rates the shares of Century Lithium Corp. as outperform.

LithiumBank Resources Corp. (LBNKF) is an exploration and development company focused on lithium-enriched brine projects in Western Canada where low-carbon-impact, rapid DLE technology is used. LithiumBank currently holds over 3.77 million acres of mineral titles, 3.44M acres in Alberta and 326K acres in Saskatchewan. LithiumBank is advancing and de-risking several projects in parallel of the Boardwalk Lithium Brine Project.

Mark Reichman, of Noble Capital Markets put out a research note this month explaining LithiumBank’s reasons for selling three of its projects.

Noble rates the shares of Century Lithium Corp. as outperform.

Piedmont Lithium Inc, (PLL) is a lithium-based company focused on the development of its Piedmont Lithium Project located within the Carolina TinSpodumene Belt (”TSB”) and along trend to the Hallman Beam and Kings Mountain mines.

Piedmont has been in the news recently for having received a partial prepayment of $31.6 million for the sale of 15,000 dry metric tonnes of lithium concentrate under its offtake deal with North American Lithium (NAL). According to news reported by Reuters, its CEO Keith Phillips expects sales from Piedmont shipments to help fund strategic initiatives while reducing the company’s need to raise capital in the equity markets. Piedmont said the prepayment increased its cash position to about $100 million.

A video discussion with Piedmont’s CEO Keith Phillips taken in March 2023 as part of Channelchek’s Takeaway Series is a great way to become familiar with the projects and strategies this “Made in the USA” lithium developer is involved with.  

Take Away

A lithium supply deficit is expected to emerge as early as 2025, according to analysts at BMI. The deficit is being driven by the growing demand for lithium-ion batteries for electric vehicles. Investors who are looking to understand the plans of small lithium developers and producers should visit the Company Data / Quotes tab on Channelchek and use the search bars to begin exploring.

Paul Hoffman

Managing Editor, Channelchek

Sources:

https://www.reuters.com/markets/commodities/piedmont-lithium-receives-first-payment-nal-shipment-2023-08-29/

https://www.cnbc.com/2023/08/29/a-worldwide-lithium-shortage-could-come-as-soon-as-2025.html

Release – Bowlero To Report Fourth Quarter and Full Year 2023 Financial Results On September 11, 2023

Research News and Market Data on BOWL

08/29/2023

RICHMOND, Va.–(BUSINESS WIRE)– Bowlero Corp. (NYSE: BOWL) (“Bowlero” or the “Company”), the global leader in bowling entertainment, will report financial results for the fourth quarter and full year 2023 on Monday, September 11, 2023 before the U.S. stock market opens. Management will discuss the results via webcast at 10:00 AM ET on the same day.

The live webcast, replay and results presentation will be available in the Events & Presentations section of the Bowlero Investor Relations website at https://ir.bowlerocorp.com/overview/default.aspx.

About Bowlero Corp.

Bowlero Corp. is the global leader in bowling entertainment, media, and events. With more than 325 bowling centers across North America, Bowlero Corp. serves more than 30 million guests each year through a family of brands that includes Bowlero and AMF. In 2019, Bowlero Corp. acquired the Professional Bowlers Association, the major league of bowling, which boasts thousands of members and millions of fans across the globe. For more information on Bowlero Corp., please visit BowleroCorp.com.

For Media:
PR@BowleroCorp.com

For Investors:
IRSupport@BowleroCorp.com

Source:

Release – GeoVax to Present at the Emerging Growth Conference on September 6, 2023

Research News and Market Data on GOVX


  • Last updated: 29 August 2023 13:11
  • Created: 29 August 2023 15:41
  • Hits: 15

Company to Provide Updates on Multiple Phase 2 Clinical Trials

for its Next-Generation COVID-19 Vaccine and Cancer Immunotherapy Programs

ATLANTA, GA, August 29, 2023 – GeoVax Labs, Inc. (Nasdaq: GOVX), a biotechnology company developing immunotherapies and vaccines against cancers and infectious diseases, is pleased to announce that it has been invited to present at the Emerging Growth Conference on September 6, 2023. This live, interactive online event will give existing shareholders and the investment community the opportunity to interact with the Company’s Chairman and CEO, David Dodd, in real time.

Presentation Details:

Presenter:                     David Dodd, Chairman & CEO

Date/Time:                   1:45pm ET, September 6, 2023

Registration Link:         https://goto.webcasts.com/starthere.jsp?ei=1603285&tp_key=ab3efc5870&sti=govx 

Please register here to ensure you are able to attend the conference and receive any updates that are released.

Following his presentation, Mr. Dodd will open the floor for questions. Please submit your questions in advance to Questions@EmergingGrowth.com or ask your questions during the event and Mr. Dodd will do his best to get through as many of them as possible.

About the Emerging Growth Conference

The Emerging Growth Conference is an effective way for public companies to present and communicate their new products, services and other major announcements to the investment community. The conference focus and coverage includes companies in a wide range of growth sectors, with strong management teams, innovative products & services, focused strategy, execution, and the overall potential for long term growth. Its audience includes potentially tens of thousands of individual and institutional investors, as well as investment advisors and analysts. All sessions are conducted through video webcasts and take place in the Eastern time zone.

About GeoVax

GeoVax Labs, Inc. is a clinical-stage biotechnology company developing novel therapies and vaccines for solid tumor cancers and many of the world’s most threatening infectious diseases. The company’s lead program in oncology is a novel oncolytic solid tumor gene-directed therapy, Gedeptin®, presently in a multicenter Phase 1/2 clinical trial for advanced head and neck cancers. GeoVax’s lead infectious disease candidate is GEO-CM04S1, a next-generation COVID-19 vaccine targeting high-risk immunocompromised patient populations. Currently in three Phase 2 clinical trials, GEO-CM04S1 is being evaluated as a primary vaccine for immunocompromised patients such as those suffering from hematologic cancers and other patient populations for whom the current authorized COVID-19 vaccines are insufficient, and as a booster vaccine in patients with chronic lymphocytic leukemia (CLL). In addition, GEO-CM04S1 is in a Phase 2 clinical trial evaluating the vaccine as a more robust, durable COVID-19 booster among healthy patients who previously received the mRNA vaccines. GeoVax has a leadership team who have driven significant value creation across multiple life science companies over the past several decades. For more information, visit our website: www.geovax.com.

Contact:

GeoVax Labs, Inc.

investor@geovax.com

678-384-7220

Release – Great American Cookies Makes a Dough-Lightful Return to Orlando

Research News and Market Data on FAT

AUGUST 29, 2023

 DOWNLOAD PDFPDF FORMAT (OPENS IN NEW WINDOW)

Original Cookie Cake Franchise Expands Florida Footprint

LOS ANGELES, Aug. 29, 2023 (GLOBE NEWSWIRE) — Great American Cookies, the Original Cookie Cake franchise, announces its return to the Orlando market with a new location. Situated in the Orlando International Premium Outlets, the latest store marks another successful Nestlé® Toll House® Café by Chip® conversion by FAT Brands, the parent company of Great American Cookies. The cookie chain has plans to continue its growth in Orlando with new locations set to open later this year.

“We are beyond excited for Great American Cookies to re-enter the Orlando market and offer our signature Cookie Cakes and Cookies to the community once again,” said Allison Lauenstein, President of the QSR Division at FAT Brands Inc. “Our brand has a rich history of creating memorable moments with our freshly baked CookieCakes, and we can’t wait to continue that tradition in Orlando.”

Since 1977, Great American Cookies has baked up a reputation for not only being the creator of the Original Cookie Cake, but also for its famous chocolate chip cookie recipe. Other craveable menu items include Brownies and Double Doozies, delectable icing sandwiched between two cookies.

The new Great American Cookies Orlando store is located at 4955 International Dr., Unit 1C 02, Orlando, FL. 32819, and is open Monday through Sunday, 11 a.m. to 8 p.m.

For more information on Great American Cookies, visit https://www.greatamericancookies.com/.

About FAT (Fresh. Authentic. Tasty.) Brands
FAT Brands (NASDAQ: FAT) is a leading global franchising company that strategically acquires, markets, and develops fast casual, quick-service, casual dining, and polished casual dining concepts around the world. The Company currently owns 17 restaurant brands: Round Table Pizza, Fatburger, Marble Slab Creamery, Johnny Rockets, Fazoli’s, Twin Peaks, Great American Cookies, Hot Dog on a Stick, Buffalo’s Cafe & Express, Hurricane Grill & Wings, Pretzelmaker, Elevation Burger, Native Grill & Wings, Yalla Mediterranean and Ponderosa and Bonanza Steakhouses, and franchises and owns over 2,300 units worldwide. For more information on FAT Brands, please visit www.fatbrands.com.

About Great American Cookies
Founded on a family chocolate chip cookie recipe in 1977, Great American Cookies believes that pure, simple delight is part of living a full life. Serving the Original Cookie Cake, fresh baked cookies in a variety of flavors, brownies, and Double Doozies, we promise to treat you to bites of bliss that prove how sweet life can be. With 400 bakeries across the country and internationally in Bahrain, Guam, Saudi Arabia, and treats available to ship right to your door, the sweet spot is always close to home. For more information, visit www.greatamericancookies.com.

MEDIA CONTACT:
Ali Lloyd, FAT Brands
alloyd@fatbrands.com
435-760-6168

Release – Direct Digital Holdings Announces Commencement of an Offer to Purchase and Consent Solicitation Relating to its Warrants

Research News and Market Data on DRCT

August 29, 2023 9:00am EDTDownload as PDF

HOUSTON, Aug. 29, 2023 /PRNewswire/ — Direct Digital Holdings, Inc. (Nasdaq: DRCT) (“Direct Digital Holdings” or the “Company”), a leading advertising and marketing technology platform operating through its companies Colossus Media, LLC (“Colossus SSP”), Huddled Masses LLC (“Huddled Masses”) and Orange142, LLC (“Orange142”), today announced that the Company has commenced an offer to purchase (the “Offer”) all of its outstanding publicly traded warrants (the “Warrants”) to purchase shares of its Class A common stock, par value $0.001 per share, at a purchase price of $1.20 in cash, without interest. The purpose of the Offer is to reduce the number of shares of Class A common stock that would become outstanding upon the exercise of Warrants, thus simplifying, and providing investors and potential investors with greater certainty as to, Direct Digital Holdings’ capital structure.  

Direct Digital Holdings is also soliciting consents (the “Consent Solicitation”) to amend the Warrant Agreement, dated as of February 15, 2022 (the “Warrant Agreement”), by and between Direct Digital Holdings and Equiniti Trust Company, LLC (formerly American Stock Transfer & Trust Company, LLC (the “Transfer Agent”), which governs all of the Warrants, to permit Direct Digital Holdings to redeem each outstanding Warrant for $0.35 in cash, without interest, which is approximately 71% less than the price applicable to the Offer (such amendment, the “Warrant Amendment”). Pursuant to the terms of the Warrant Agreement, the adoption of the Warrant Amendment will require the consent of holders of at least a majority of the outstanding Warrants. In order to tender the Warrants in the Offer and receive $1.20 in cash for each of their Warrants, holders of the Warrants are required to consent to the Warrant Amendment. The Offer will be open until one minute after 11:59 p.m., Eastern Time, on September 26, 2023, unless extended or earlier terminated by Direct Digital Holdings (the “Expiration Date”). Tendered Warrants may be withdrawn by holders at any time prior to the Expiration Date. The Company’s obligation to complete the Offer is conditioned on the tender of more than 50% of the outstanding Warrants.

The Offer and Consent Solicitation are being made pursuant to an Offer to Purchase dated August 29, 2023, and Schedule TO, dated August 29, 2023, each of which will be filed with the Securities and Exchange Commission (“SEC”) and more fully set forth the terms and conditions of the Offer and Consent Solicitation.

The Company’s Class A common stock and Warrants are listed on The Nasdaq Stock Market LLC under the symbols “DRCT” and “DRCTW,” respectively. As of August 29, 2023, a total of 3,217,800 Warrants were outstanding.

Stifel, Nicolaus & Company, Incorporated has been appointed as the Dealer Manager for the Offer and Consent Solicitation, D.F. King, Co., Inc. (“D.F. King”) has been appointed as the Information Agent for the Offer and Consent Solicitation, and Equiniti Trust Company, LLC has been appointed as the Depositary for the Offer and Consent Solicitation. All questions concerning tender procedures and requests for additional copies of the offer materials, including the letter of transmittal and consent should be directed to D.F. King.

Important Additional Information Has Been Filed with the SEC

Copies of the Schedule TO and Offer to Purchase will be available free of charge at the website of the SEC at www.sec.gov. Requests for documents may also be directed to D.F. King at (866) 796-1290 (toll-free) or drct@dfking.com.

This announcement is for informational purposes only and shall not constitute an offer to purchase or a solicitation of an offer to sell the Warrants. The Offer and Consent Solicitation are being made only through the Schedule TO and Offer to Purchase, and the complete terms and conditions of the Offer and Consent Solicitation are set forth in the Schedule TO and Offer to Purchase.

Holders of the Warrants are urged to read the Schedule TO and Offer to Purchase carefully before making any decision with respect to the Offer and Consent Solicitation because they contain important information, including the various terms of, and conditions to, the Offer and Consent Solicitation.

None of Direct Digital Holdings, any of its management or its board of directors, or the Dealer Manager or the Information Agent or Depositary or any other person makes any recommendation as to whether or not Warrant holders should tender Warrants for exchange in the Offer or consent to the Warrant Amendment in the Consent Solicitation. Warrant holders must make their own decision as to whether to tender their Warrants and, if so, how many Warrants to tender.

About Direct Digital Holdings

Direct Digital Holdings (Nasdaq: DRCT), owner of operating companies Colossus SSP, Huddled Masses, and Orange 142, brings state-of-the-art sell- and buy-side advertising platforms together under one umbrella company. Direct Digital Holdings’ sell-side platform, Colossus SSP, offers advertisers of all sizes extensive reach within general market and multicultural media properties. The Company’s subsidiaries Huddled Masses and Orange142 deliver significant ROI for middle market advertisers by providing data-optimized programmatic solutions at scale for businesses in sectors that range from energy to healthcare to travel to financial services. Direct Digital Holdings’ sell- and buy-side solutions manage on average over 136,000 clients monthly, generating approximately 250 billion impressions per month across display, CTV, in-app and other media channels. 

Forward Looking Statements

This press release may contain forward-looking statements within the meaning of federal securities laws, including the Private Securities Litigation Reform Act of 1995, Section 27A of the Securities Act of 1933, as amended, and Section 21E of the Securities Exchange Act of 1934, as amended, and which are subject to certain risks, trends and uncertainties.

As used below, “we,” “us,” and “our” refer to the Company. We use words such as “could,” “would,” “may,” “might,” “will,” “expect,” “likely,” “believe,” “continue,” “anticipate,” “estimate,” “intend,” “plan,” “project” and other similar expressions to identify forward-looking statements, but not all forward-looking statements include these words. All statements contained in this press release that do not relate to matters of historical fact should be considered forward-looking statements.

All of our forward-looking statements involve estimates and uncertainties that could cause actual results to differ materially from those expressed in or implied by the forward-looking statements. Our forward-looking statements are based on assumptions that we have made in light of our industry experience and our perceptions of historical trends, current conditions, expected future developments and other factors we believe are appropriate under the circumstances. Although we believe that these forward-looking statements are based on reasonable assumptions, many factors could affect our actual operating and financial performance and cause our performance to differ materially from the performance expressed in or implied by the forward-looking statements, including, but not limited to: our dependence on the overall demand for advertising, which could be influenced by economic downturns; any slow-down or unanticipated development in the market for programmatic advertising campaigns; the effects of health epidemics; operational and performance issues with our platform, whether real or perceived, including a failure to respond to technological changes or to upgrade our technology systems; any significant inadvertent disclosure or breach of confidential and/or personal information we hold, or of the security of our or our customers’, suppliers’ or other partners’ computer systems; any unavailability or non-performance of the non-proprietary technology, software, products and services that we use; unfavorable publicity and negative public perception about our industry, particularly concerns regarding data privacy and security relating to our industry’s technology and practices, and any perceived failure to comply with laws and industry self-regulation; restrictions on the use of third-party “cookies,” mobile device IDs or other tracking technologies, which could diminish our platform’s effectiveness; any inability to compete in our intensely competitive market; any significant fluctuations caused by our high customer concentration; our limited operating history, which could result in our past results not being indicative of future operating performance; any violation of legal and regulatory requirements or any misconduct by our employees, subcontractors, agents or business partners; any strain on our resources, diversion of our management’s attention or impact on our ability to attract and retain qualified board members as a result of being a public company; our dependence, as a holding company, on receiving distributions from Direct Digital Holdings, LLC to pay our taxes, expenses and dividends; the satisfaction of the conditions to the Offer, including the minimum tender condition; and other factors and assumptions discussed in the “Risk Factors,” “Management’s Discussion and Analysis of Financial Conditions and Results of Operations” and other sections of our filings with the Securities and Exchange Commission that we make from time to time. Should one or more of these risks or uncertainties materialize or should any of these assumptions prove to be incorrect, our actual operating and financial performance may vary in material respects from the performance projected in these forward-looking statements. Further, any forward-looking statement speaks only as of the date on which it is made, and except as required by law, we undertake no obligation to update any forward-looking statement contained in this press release to reflect events or circumstances after the date on which it is made or to reflect the occurrence of anticipated or unanticipated events or circumstances, and we claim the protection of the safe harbor for forward-looking statements contained in the Private Securities Litigation Reform Act of 1995.

Contacts:

Investors:
Brett Milotte, ICR
Brett.Milotte@icrinc.com  

 View original content to download multimedia:https://www.prnewswire.com/news-releases/direct-digital-holdings-announces-commencement-of-an-offer-to-purchase-and-consent-solicitation-relating-to-its-warrants-301912502.html

SOURCE Direct Digital Holdings

Released August 29, 2023

Release – Largo Initiates Review of Strategic Alternatives for Largo Clean Energy to Evaluate Opportunities to Maximize Value in the Clean Energy Transition

Research News and Market Data on LGO

Download(opens in new window)

TORONTO–(BUSINESS WIRE)– Largo Inc. (“Largo” or the “Company”) (TSX: LGO) (NASDAQ: LGO) today announces that its Board of Directors (the “Board”) has initiated a review and evaluation of strategic alternatives with the intent to unlock and fully maximize the value of Largo Clean Energy Corp. (“LCE”).

The comprehensive review and evaluation process will include consideration of a full range of strategic, business, and financial alternatives, including, but not limited to, evaluating and completing financing transactions at the LCE subsidiary level, mergers and acquisitions of LCE with other battery companies and partnership opportunities with well-established energy system producers who are interested in entering the vanadium battery sector with the unique elements that Largo offers to this industry.

Daniel Tellechea, Interim CEO and Director of Largo commented: “Largo is commencing a comprehensive and thorough review of strategic alternatives to accelerate and enhance the distinctive value proposition LCE presents for vanadium batteries and the long duration energy storage sector. We believe several strategic opportunities exist in the market today that would benefit from LCE’s unique characteristics, and a formal process for comparing these alternatives is expected to deliver maximum value for all shareholders in a timely manner. These characteristics include: i) LCE’s access to the innovative Largo Physical Vanadium Corp. (“LPV”) (TSXV:VAND, OTCQX:VANAF) structure, which is expected to significantly reduce vanadium battery costs for customers, ii) LCE’s U.S.-based manufacturing capabilities, which may be eligible for significant fiscal incentives, grants and benefits, and iii) LCE’s patented vanadium flow battery stack technology and electrolyte purification technology.”

He continued: “We believe the strategic review process announced today could also accelerate the prospects for deployment of vanadium units owned by LPV in batteries, which we consider provides a major improvement in the cost-competitiveness of LCE against other battery technologies and other vanadium flow battery competitors. With the start of this process underway, the Company also remains committed to delivering on its set targets for the year in a safe and responsible manner.”

There can be no assurance that this process will result in any specific strategic plan or financial transaction and the Company does not plan to provide updates on the status of the review unless there are material developments to report.

Gallatin Capital LLC (“Gallatin”) is advising on securities transactions and Castle Grove Capital, LLC (“Castle Grove Capital”) is providing consulting services in support of the strategic review and evaluation process. Inquiries regarding the process may be directed to Myron Manternach, a registered representative of Gallatin and the President of Castle Grove Capital.

About Largo

Largo has a long and successful history as one of the world’s preferred vanadium companies through the supply of its VPURE™ and VPURE+™ products, which are sourced from one of the world’s highest-grade vanadium deposits at the Company’s Maracás Menchen Mine in Brazil. Aiming to enhance value creation at Largo, the Company is in the process of implementing an ilmenite concentrate plant using feedstock sourced from its existing operations in addition to advancing its U.S.-based clean energy division with its VCHARGE vanadium batteries. Largo’s VCHARGE vanadium batteries contain a variety of innovations, enabling an efficient, safe and ESG-aligned long duration solution that is fully recyclable at the end of its 25+ year lifespan. Producing some of the world’s highest quality vanadium, Largo’s strategic business plan is based on two pillars: 1.) leading vanadium supplier with an outlined growth plan and 2.) U.S.-based energy storage business to support a low carbon future.

Largo’s common shares trade on the Nasdaq Stock Market and on the Toronto Stock Exchange under the symbol “LGO”. For more information on the Company, please visit www.largoinc.com.

Cautionary Statement on Forward-looking Information:

This press release contains forward-looking information under applicable securities legislation, (“forward-looking information”). Forward‐looking information in this press release includes, but is not limited to, statements with respect to LCE’s strategic review, the expectation that the strategic review will deliver maximum value for all shareholders, the timeliness of the strategic review, access to LPV’s structure, the ability to reduce vanadium battery costs for customers, eligibility for fiscal incentives, grants and benefits, the deployment of vanadium units and other benefits that may arise from the strategic review and/or LPV. Forward-looking information can be identified by the use of forward-looking terminology such as “plans”, “expects” or “does not expect”, “is expected”, “budget”, “scheduled”, “estimates”, “forecasts”, “intends”, “anticipates” or “does not anticipate”, or “believes”, or variations of such words and phrases or statements that certain actions, events or results “may”, “could”, “would”, “might” or “will be taken”, “occur” or “be achieved”. All information contained in this news release, other than statements of current and historical fact, is forward looking information.

Forward-looking information is subject to known and unknown risks, uncertainties and other factors that may cause the actual results, level of activity, performance or achievements to be materially different from those expressed or implied by such forward-looking information, including but not limited to those risks described in the annual information form of Largo and in its public documents filed on www.sedarplus.ca and www.sec.gov from time to time. Such risks and uncertainties include, without limitation: the ability to obtain, in a timely manner, all necessary regulatory, stock exchange, shareholder and other third-party approvals to consummate any transactions contemplated by the strategic review; the risk of any disruptions to the Company’s business and operations; competition; conflict in eastern Europe; changes in interest rates, inflation, foreign exchange rates, and the other risks involved in the mining and long-term battery storage industries and capital markets. Forward-looking information are based on the opinions and estimates of management as of the date such statements are made. Although management of Largo has attempted to identify important factors that could cause actual results to differ materially from those contained in forward-looking information, there may be other factors that cause results not to be as anticipated, estimated or intended. There can be no assurance that such statements will prove to be accurate, as actual results and future events could differ materially from those anticipated in such statements. Accordingly, readers should not place undue reliance on Forward-looking information. Largo does not undertake to update any forward-looking information, except in accordance with applicable securities laws. Readers should also review the risks and uncertainties sections of Largo’s annual and interim MD&A which also apply.

Trademarks are owned by Largo Inc.

For further information, please contact:

Investor Relations
Alex Guthrie

Senior Manager, External Relations
+1.416.861.9778
aguthrie@largoinc.com

Advisor
Myron Manternach

Registered Representative of Gallatin Capital LLC
mmanternach@castlegrovecapital.com

Source: Largo Inc.

Maple Gold Mines (MGMLF) – An Effective Board in Action


Tuesday, August 29, 2023

Mark Reichman, Managing Director, Equity Research Analyst, Natural Resources, Noble Capital Markets, Inc.

Refer to the full report for the price target, fundamental analysis, and rating.

Leadership transition. Maple Gold’s Board of Directors concluded that a leadership transition was in the best interest of the company’s stakeholders and appointed Mr. Kiran Patankar as Interim President and Chief Executive Officer. Mr. Patankar previously served as Chief Financial Officer and has been a key member of the leadership team since joining the company in 2021. We think his new role could be made permanent within a relatively short time frame at which time he could join the company’s board of directors. Mr. Michael Rukus, a Chartered Professional Accountant (CPA), has been appointed Chief Financial Officer and previously served as Maple Gold’s corporate controller.

Operational update. With the changes in leadership, management will conduct a thorough review of its operations and plans to enhance Maple Gold’s effectiveness, efficiency, and productivity. Drill targets for Douay and Telbel (Joutel), both within the company’s joint venture with Agnico Eagle Mines Limited, are being refined with the next phase of drilling expected to begin in the fourth quarter. Maple may also commence a follow-up drill program at its 100%-controlled Eagle mine project during the fourth quarter. During the third quarter, we expect the company to provide more details regarding its exploration budget and associated exploration and drilling plans.


Get the Full Report

Equity Research is available at no cost to Registered users of Channelchek. Not a Member? Click ‘Join’ to join the Channelchek Community. There is no cost to register, and we never collect credit card information.

This Company Sponsored Research is provided by Noble Capital Markets, Inc., a FINRA and S.E.C. registered broker-dealer (B/D).

*Analyst certification and important disclosures included in the full report. NOTE: investment decisions should not be based upon the content of this research summary. Proper due diligence is required before making any investment decision. 

Newer Traders Have A Lot Going For Them; That Could Be a Problem

Deciding if Buy and Hold or Trading is Best for You?

New investors today have powerful tools that may exceed what was available even at institutions just a decade ago. This provides a leg-up on those of us who had to cover high trading fees, buy and sell, before we made a dime. Then, there is today’s information availability. Stock prices were printed in the morning from the day before close; that is how investors were updated. Then there is all the other up-to-the-minute information from your broker and company data and research from platforms like Channelchek and others.  

This can be both helpful and overwhelming to a new investor deciding where to focus and what type of investment style suits them. 

The least expensive discount brokers, when I bought my very first hundred shares cost $100 in and $100 out ($200 round trip). So exceeding two dollars per share on each round lot (orders not in lots of 100 cost more) was necessary to break even. Between this and the non-current price information, a buy-and-hold position was the only position that made much sense.

Now, transacting is just point-and-shoot. Even bid versus ask spreads are minuscule. This makes it more practical for an investor to decide not to ride out a perceived slide even if they have confidence that it will reverse later. Instead, with the ability to unload before an expected trouble spot develops, an investor that waits instead, may become angry with themselves that they held and their account value has declined.  

Today’s set of circumstances has a lot more investors acting like traders and trying to time the market. The tolerance for seeing a holding is up, say 6% over a period of time, only to be down 2% over a longer period, then up 7% down the road is much more rare. Newer investors don’t have as much price swing tolerance, they want to take a profit before the market drops. Some then expect as much as a 20% dip that they can buy back into.

Of course, hitting the near tops and low points to maximize profit is unlikely. And trying to do it usually leads to frustration from missed opportunity when it doesn’t then move in the direction that would benefit the trader.

So is it prudent to try to time price moves up and down and trade the shares, to take advantage of so much information? Or, should they do research, find companies they expect will do well, and then look for a good entry point, not even thinking about an exit unless it begins to behave outside of expectations?

This is particularly relevant in a year where the market is up above average, which means if it gravitates back to its mean average annual return, the overall market will end the year lower than it is now.  

There is no one simple answer, but a practical approach is to have core holdings to take the long ride with, and then view other stocks separately that maybe move a little faster, up and down, that are for  timing moves. This leads to diversification in holding periods. But, in order to work, one has to not forget or give up on the individual strategies of the two investment styles that are to be thought of separately, perhaps even in two different accounts.

But when does one sell from the buy-and-hold portion, is there a trigger? And what is the trigger with the assets in the trading portion?

The same idea could apply to both sets of assets. Set the parameters for every trade and stick to them. Take a profit or a loss when the parameter is met, regardless of what you may feel at that time. Good decisions and “if-this, then-that” thinking is best when not in the heat of battle. Plan your trade and trade your plan regardless. In some cases it may have worked out better if you had acted differently than planned, but if it is based on realistic expectations or probabilities, then chances are, over the years it will reap greater rewards.

This ongoing reassessment, regardless of expected holding time,  has the investor set levels, both above and below a stock’s current price, that, when struck causes the investor to evaluate. That evaluation may simply be asking oneself has anything changed since I set this parameter? If not, act. It may also be asking oneself, is this the best use of my capital right now, or is there a better place that I believe has the potential to outperform the current holding?

Take Away

An investment portfolio plan with meaningful rules to follow helps reduce the anxiety of investing. Whether 90% is earmarked buy-and-hold, or 90% is to achieve short-term gains and avoid big drawdowns, the trades must be managed to a pre-thought-out sensible plan. The expectation then is that none of the positions will work out perfectly timed, but as a whole, over a long enough period, the investor will be better off than if they had no guidelines or fewer boundaries.

Paul Hoffman

Managing Editor, Channechek

Hurricane Damage at the Individual Stock and Industry Level

Image Credit: Darryl Kenyon (Flickr)

Avoiding a Hurricane May Mean Adjusting Your Portfolio

Like most people that live in Florida, I usually first learn of approaching hurricanes from concerned family members up North. My reaction is probably different than others. My first thoughts on rare news events is to ask myself, “is this bullish or bearish?” When it comes to hurricanes, there is an answer – like most events that impact stocks, the answer is, “it depends.” Getting out of the way of a hurricane could also mean a slight adjustment to holdings.

I will mention that the toll on life and property of natural disasters, or any travesty, is not lost on me. But as investors, we must control the risks that we can and look for the rainbow in situations we have no control over.

Economic Damage

Dubravko Lakos-Bujas, JP Morgan’s head of U.S. equity and quantitative strategy, shared insights on the economic impact of hurricanes a couple of years before hurricane Ian struck Naples Florida. But the value of the information has not changed. “Major U.S. hurricane landfalls have had less significant impact on aggregate market performance (~2% decline) given the subsequent pick-up in disaster-induced public and private spending,” Mr. Lakos-Bujas said. “The most significant impact on equity performance is seen at the stock and sub-industry level.”

Money May Grow on Trees

Does your portfolio contain Orange Growers? Gulf Coast REITS? Companies that operate in the affected area of the storm see a loss in production as they close up and, at the same time, a jump in costs as they make repairs. These stocks are most likely to underperform. For those companies in the repair business, for example, lumber and roofing supplies, they could generate business whether a storm actually makes landfall or not. The rebuilding effort will cost insurance companies with a concentration of insured properties in the path of a storm.

Lakos-Bujas warned, “The underperformance should be concentrated in insurance (i.e. property loss coverage), and companies with Hotels, Restaurants, Leisure, & Airlines (i.e. based on occupancy/traffic, rising commodity costs), Telecom and Cable (i.e. capital expenditure tied to repair and potentially lower revenue per unit), and Industrials (i.e. rising input costs, disruption in production and transportation) depending on geographic footprint.”

Solutions tend to gravitate toward problems, even if those problems include damage and destruction. This is a good thing, it is capitalism working in a way that helps others. This help is profitable and could make some sectors outperformers. “The largest outperformers include industries tied to replacing and/or repairing existing capital stock (i.e. Energy Equipment & Services, Communication Equipment, Autos), transportation and logistics (i.e. Distribution, Air Freight, Trading Companies), and construction (Basic Materials and Engineering),” Lakos-Bujas’ said.

The analysis of the JP Morgan equity strategist is based on a study of 31 hurricanes between 1965 and 2014, which had a combined cost of $520 billion. Two o the large storms, Irma and Harvey, represent a high percentage of the total cost.

“Based on current unofficial damage estimates for hurricanes Harvey and Irma, losses this year are expected to exceed 50% of combined costs over the last 50 years,” he said. “These outsized losses could currently drive more pronounced moves at the stock and sub-industry levels than historically.”

So, a person may live across the country or around the globe from the storm and still feel an impact. For historical context, the S&P 500 (^GSPC) has seen an average decline of 2% in the week following a hurricane’s passing.

Rebuilding Benefits Stockholdings Differently

Much of the backstop in the economy and the markets is based on the idea that rebuilding after a storm is stimulative. Households and businesses suddenly jam work that needed to be done into a short time span and spend much more on what could’ve been routine maintenance. Economists say that the near-term impact on GDP is a net positive once the hurricanes pass. A lasting positive impact occurs if a natural disaster brings about rebuilding that improves on the existing structures or facilities instead of just restoring them to their previous state.”

One caveat is that labor markets have been tight. Most other years, roofers and builders flocked to the highest bidders and the flow of money helped speed the rebuilding process. If there are currently not sufficient human resources, this will push costs up more than they otherwise would have. Unfortunately, there continue to be reports of labor shortages in many industries, including construction. Fox Business News reported on August 28, 2023, “America’s shortage of skilled workers is impacting the ability of businesses in the construction and manufacturing industries to staff their businesses and complete jobs on time.” This situation could certainly slow any needed rebuild.

As wildfires in Hawaii have shown us, funds for rebuilding efforts are further complicated by politics. Three of the Floridian candidates for president, including the governor, are from a party that is not in power

Take Away

Opportunity comes in all forms. This includes opportunity to avoid a dip in some of your holdings, and an opportunity to capitalize on increased company profits this includes disasters of all types. Weather events can impact stock performance of individual companies and industry subsets. At roughly a negative 2% average, the overall market could impact investors over the following 30 days at a rate that feels like normal monthly swings.

As a positive thought, after the storm clears, come join Channelchek, Noble Capital Markets and an expected 150 public companies companies all converging on South Florida in early December for NobleCon19, the investment conference where you’ll discover actionable investment ideas inspired directly from company management. Learn more here.

Paul Hoffman

Managing Editor, Channelchek

Sources

https://www.wtwco.com/en-us/insights/2023/08/how-is-labor-shortage-impacting-the-construction-industry

https://www.foxbusiness.com/economy/americas-skilled-worker-shortage-impacting-construction-manufacturing-industries

https://finance.yahoo.com/news/hurricane-irma-mean-stocks-105038376.html

Will Scientific Research and Technological Innovation Be Stifled By Expiring Agreement?

Image: President Jimmy Carter and Chinese Vice Premier Deng Xiaoping meet outside of the Oval Office on Jan. 30, 1979

The US and China May Be Ending an Agreement on Science and Technology Cooperation − A Policy Expert Explains What This Means for Research

A decades-old science and technology cooperative agreement between the United States and China expires this week. On the surface, an expiring diplomatic agreement may not seem significant. But unless it’s renewed, the quiet end to a cooperative era may have consequences for scientific research and technological innovation.

The possible lapse comes after U.S. Rep. Mike Gallagher, R-Wis., led a congressional group warning the U.S. State Department in July 2023 to beware of cooperation with China. This group recommended to let the agreement expire without renewal, claiming China has gained a military advantage through its scientific and technological ties with the U.S.

The State Department has dragged its feet on renewing the agreement, only requesting an extension at the last moment to “amend and strengthen” the agreement.

The U.S. is an active international research collaborator, and since 2011 China has been its top scientific partner, displacing the United Kingdom, which had been the U.S.‘s most frequent collaborator for decades. China’s domestic research and development spending is closing in on parity with that of the United States. Its scholastic output is growing in both number and quality. According to recent studies, China’s science is becoming increasingly creative, breaking new ground.

This article was republished with permission from The Conversation, a news site dedicated to sharing ideas from academic experts. It represents the research-based findings and thoughts of, Caroline Wagner, Professor of Public Affairs, The Ohio State University.

As a policy analyst and public affairs professor, I research international collaboration in science and technology and its implications for public policy. Relations between countries are often enhanced by negotiating and signing agreements, and this agreement is no different. The U.S.’s science and technology agreement with China successfully built joint research projects and shared research centers between the two nations.

U.S. scientists can typically work with foreign counterparts without a political agreement. Most aren’t even aware of diplomatic agreements, which are signed long after researchers have worked together. But this is not the case with China, where the 1979 agreement became a prerequisite for and the initiator of cooperation.

In 1987 former President Jimmy Carter visited Yangshuo, his wife Rosalyn and he insisted that went around Yangshuo countryside by bicycle.

A 40-Year Diplomatic Investment

The U.S.-China science and technology agreement was part of a historic opening of relations between the two countries, following decades of antagonism and estrangement. U.S. President Richard Nixon set in motion the process of normalizing relations with China in the early 1970s. President Jimmy Carter continued to seek an improved relationship with China.

China had announced reforms, modernizations and a global opening after an intense period of isolation from the time of the Cultural Revolution from the late 1950s until the early 1970s. Among its “four modernizations” was science and technology, in addition to agriculture, defense and industry.

While China is historically known for inventing gunpowder, paper and the compass, China was not a scientific power in the 1970s. American and Chinese diplomats viewed science as a low-conflict activity, comparable to cultural exchange. They figured starting with a nonthreatening scientific agreement could pave the way for later discussions on more politically sensitive issues.

On July 28, 1979, Carter and Chinese Premier Deng Xiaoping signed an “umbrella agreement” that contained a general statement of intent to cooperate in science and technology, with specifics to be worked out later.

In the years that followed, China’s economy flourished, as did its scientific output. As China’s economy expanded, so did its investment in domestic research and development. This all boosted China’s ability to collaborate in science – aiding their own economy.

Early collaboration under the 1979 umbrella agreement was mostly symbolic and based upon information exchange, but substantive collaborations grew over time.

A major early achievement came when the two countries published research showing mothers could ingest folic acid to prevent birth defects like spina bifida in developing embryos. Other successful partnerships developed renewable energy, rapid diagnostic tests for the SARS virus and a solar-driven method for producing hydrogen fuel.

Joint projects then began to emerge independent of government agreements or aid. Researchers linked up around common interests – this is how nation-to-nation scientific collaboration thrives.

Many of these projects were initiated by Chinese Americans or Chinese nationals working in the United States who cooperated with researchers back home. In the earliest days of the COVID-19 pandemic, these strong ties led to rapid, increased Chinese-U.S. cooperation in response to the crisis.

Time of Conflict

Throughout the 2000s and 2010s, scientific collaboration between the two countries increased dramatically – joint research projects expanded, visiting students in science and engineering skyrocketed in number and collaborative publications received more recognition.

As China’s economy and technological success grew, however, U.S. government agencies and Congress began to scrutinize the agreement and its output. Chinese know-how began to build military strength and, with China’s military and political influence growing, they worried about intellectual property theft, trade secret violations and national security vulnerabilities coming from connections with the U.S.

Recent U.S. legislation, such as the CHIPS and Science Act, is a direct response to China’s stunning expansion. Through the CHIPS and Science Act, the U.S. will boost its semiconductor industry, seen as the platform for building future industries, while seeking to limit China’s access to advances in AI and electronics.

A Victim of Success?

Some politicians believe this bilateral science and technology agreement, negotiated in the 1970s as the least contentious form of cooperation – and one renewed many times – may now threaten the United States’ dominance in science and technology. As political and military tensions grow, both countries are wary of renewal of the agreement, even as China has signed similar agreements with over 100 nations.

The United States is stuck in a world that no longer exists – one where it dominates science and technology. China now leads the world in research publications recognized as high quality work, and it produces many more engineers than the U.S. By all measures, China’s research spending is soaring.

Even if the recent extension results in a renegotiated agreement, the U.S. has signaled to China a reluctance to cooperate. Since 2018, joint publications have dropped in number. Chinese researchers are less willing to come to the U.S. Meanwhile, Chinese researchers who are in the U.S. are increasingly likely to return home taking valuable knowledge with them.

The U.S. risks being cut off from top know-how as China forges ahead. Perhaps looking at science as a globally shared resource could help both parties craft a truly “win-win” agreement.