The Warning Signs that the Mega-Cap Era Is Coming to an End are Growing
By Monday of next week, the Nasdaq 100 will be rebalanced to reduce the weighting of its top holdings and add weight to the smaller companies represented. This event can be grouped with the number of experts and outlets waving yellow and red flags warning U.S. stock market investors about the reliance on mega-caps for continued performance. The number of warnings has been increasing. The original purpose of any index is to measure overall market or sector performance. Currently reported performance in the most popular indexes is dependent on five to ten mega-cap names – this trend is not sustainable through time. JP Morgan (JPM) is the most recent firm to warn about an extreme concentration of a few stocks.
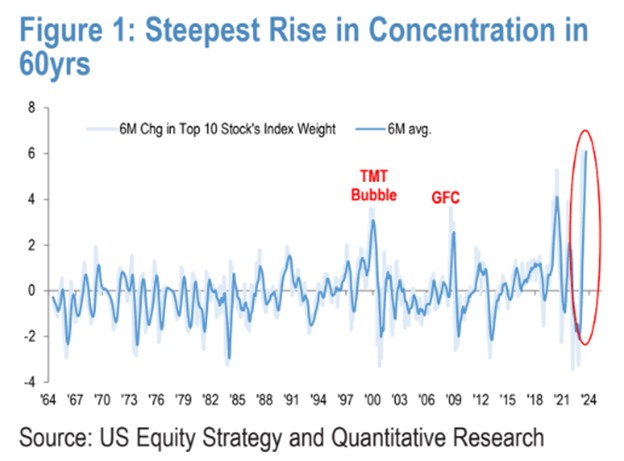
JPMorgan Chase & Co.’s equity analysts, led by Chief Global Markets Strategist Marko Kolanovic, warn that overweighting towards very few companies of extremely large-cap stocks could spell trouble ahead. In a research note published on July 24, the firm writes historically, such periods of extreme concentration have often led to negative outcomes. In fact, the current level of concentration is growing at the fastest pace since the 1960s, surpassing even the extremes seen during the infamous dot-com bubble in March 2000.
To illustrate the stark divergence between the largest U.S.-listed companies and the rest of the market, the JPM team compared the six-month change in the index weighting of the ten largest stocks in the S&P 500 with that of the next 40. This analysis revealed that over the past six months, the divergence has widened in favor of the biggest companies, reaching levels comparable to the “Nifty 50” era of the 1960s—a period when large-cap stocks were highly favored by investors.
JPM Chase, July 24, 2023
Crowding in growth stocks represented in the S&P 500 is currently at the 97th percentile historically. This is a level not seen since the dot-com bubble period. While the team provided extensive data and analysis to support their concerns about overconcentration, they were less definitive about the timing or specific implications for the market.
JPM Chase, July 24, 2023
A selloff is expected and appears likely according to JPM; predicting its timing is more challenging. The team pointed out several potential catalysts, such as a deep recession or a sudden resurgence of inflationary pressures, but it remains uncertain when the downturn may begin. Nonetheless, the JPM team believes that the peak in concentration will coincide with waning investor interest in the generative AI/large-language model theme, a trend that has contributed this year to the significant divergence in equity performance.
In light of Monday’s special rebalancing of the Nasdaq-100, the JPMorgan team suggested that this move could potentially mitigate concentration risk by easing the outperformance of mega-cap technology stocks, including Apple Inc., Microsoft Corp., Nvidia Corp., and Alphabet Inc., which have been major beneficiaries of the AI boom. If a larger percentage of dollars entering large-cap funds find their way to the ticker symbols below the giants at the top, the pace at which the markets have become unbalanced may slow or correct without a major problem.
The JPM team pointed out that if correct, speculators may capitalize on this by considering that the S&P 500 equal weight may be in a position to outperform the S&P 500 traditional weight methodology products over the next three to six months.
Interestingly, there are already signs that the overconcentration problem highlighted by JPMorgan are beginning to ease. Over the last month, the S&P 500 equal-weighted index has outperformed its market-cap-weighted counterpart by 2 percentage points, according to FactSet data.
Despite these concerns, the U.S. stock market closed higher on Monday, with the Dow Jones Industrial Average booking its 11th consecutive daily gain, marking its longest winning streak in nearly six years. The performance of the value-heavy Dow, which has been catching up, while the year-to-date rally of mega-cap tech stocks has stalled, highlights the ongoing dynamics in the market.
Take Away
While some market gurus like Michael Burry have been warning of a bubble brought about by index funds, since 2019, the weighting in indexes have only increased. By the last day in July, the Nasdaq 100 will have taken steps to relieve some of the pressure by shrinking the weighting of the top holdings. JP Morgan analysts are still concerned that the trend is strong and can end with a catalyst triggering an unwinding and move away from the larger high P/E names.
Berkshire Hathaway Finds ESG Concerns Are a Plus for Oil and Gas Investments
Warren Buffett’s Berkshire Hathaway is capitalizing on the current commodity price dip to expand its oil and gas sector stake. This year, Berkshire committed $3.3 billion to increase its ownership in a liquefied natural gas export terminal in Maryland. Additionally, it raised its stake in Occidental Petroleum Corp. by 15% and acquired more shares in five Japanese commodity traders. The company is also lobbying for increased financial support for natural gas power plants.
Warren Buffett, the Oracle of Omaha, demonstrated how he earned the “oracle” title during the most uncertain days of the pandemic, by investing heavily in oil and gas. The sector has had impressive returns as it posted record earnings in 2022. The 92-year-old Buffett is not booking the massive gains by selling; instead Buffett is selectively adding to positions.
Are Buffett’s investment moves classic bargain-hunting, with the energy sector possibly undervalued tied to environmental, social, and governance concerns, as well as an anticipation of declining demand for fossil fuels in the future? Based on standard metrics, the energy sector is undervalued. According to data from Bloomberg, energy now trades at the lowest price-to-earnings valuation among all sectors in the S&P 500 Index, at the same time it generates the most cash flow per share. And, as a help to the industry, Berkshire’s energy division is actively lobbying for a bill that would allocate at least $10 billion to natural gas-fired power plants in Texas to support the state’s grid.
His approach in the sector is obviously deliberate and narrowly targeted. Despite Buffett’s interest in energy, his fossil fuel investments aren’t without nuances. For example, Berkshire remains the third-largest shareholder in Chevron Corp., even after it reduced its stake by about 21% in the first quarter. Each investment in companies like Occidental and Cove Point LNG has unique aspects that position them as valuable assets in the global energy landscape, regardless of the path that any U.S. or global energy transition takes.
Buffett believes that shale, a substantial part of U.S. oil production, is different and even preferred over conventional sources of oil in the Middle East and Russia. One difference is taking shale from the ground and into production can be done more quickly and have a shorter production lifespan. This provides flexibility for operators to adapt to changes in oil demand and prices. At Berkshire’s annual meeting in May, Buffett emphasized making rational decisions about energy production and criticized both extremes in the climate debate.
One of Buffett’s nuanced and targeted energy investments is Cove Point LNG. It not only exports liquefied gas but also has the rare capability to import gas, making it more versatile than other facilities along the Gulf Coast. With rising global LNG demand driven by Europe’s shift away from Russian gas and Asia’s use of gas for power generation, Cove Point’s long-term contracts with buyers, including Tokyo Gas Co. and Sumitomo Corp., make it appealing. Berkshire is Sumitomo’s second-largest shareholder after the Japanese government’s pension fund.
Outside of its stock holdings, Berkshire Hathaway Energy, under the leadership of Buffett’s expected successor Greg Abel, has been performing well. Earnings for the division hit a record high of $3.9 billion in 2022, nearly doubling over five years.
Take Away
The world’s appetite for energy, whether from fossil fuels or renewables, seems insatiable; even amid a global penchant to reduce fossil fuel use, oil demand is expected to continue rising throughout the decade. While environmental concerns have caused some investors to shy away from the energy sector, Buffett’s investments demonstrate his belief that ESG considerations are keeping oil and gas stocks attractively priced. Market participants prioritizing ESG, therefore, presents an opportunity for Berkshire to profit further from its strategic investments in the oil and gas sector.
ATLANTA, July 24, 2023 (GLOBE NEWSWIRE) — DLH Holdings Corp. (NASDAQ: DLHC) (“DLH” or the “Company”), a leading healthcare and human services provider to the federal government, will release financial results for its fiscal third quarter ended June 30, 2023 on August 2, 2023 after the market closes. DLH will then host a conference call for the investment community at 10:00 a.m. Eastern Time the following day, August 3, 2023, during which members of senior management will make a brief presentation focused on the financial results and operating trends. A question-and-answer session will follow.
Interested parties may listen to the conference call by dialing 888-347-5290 or 412-317-5256. Presentation materials will also be posted on the Investor Relations section of the DLH website prior to the commencement of the conference call. A digital recording of the conference call will be available for replay two hours after the completion of the call and can be accessed on the DLH Investor Relations website or by dialing 877-344-7529 and entering the conference ID 5343381.
About DLH
DLH (NASDAQ:DLHC) delivers improved health and national security readiness solutions for federal programs through science research and development, systems engineering and integration, and digital transformation. The Company’s experts in public health, performance evaluation, and health operations solve the complex problems faced by civilian and military customers alike, leveraging digital transformation, artificial intelligence, advanced analytics, cloud-based applications, telehealth systems, and more. With over 3,200 employees dedicated to the idea that “Your Mission is Our Passion,” DLH brings a unique combination of government sector experience, proven methodology, and unwavering commitment to innovation to improve the lives of millions. For more information, visit www.DLHcorp.com.
INVESTOR RELATIONS Contact: Chris Witty Phone: 646-438-9385 Email: cwitty@darrowir.com
Atlanta, GA, July 24, 2023 – GeoVax Labs, Inc. (Nasdaq: GOVX), a biotechnology company developing immunotherapies and vaccines against cancers and infectious diseases, today announced that the U.S. Patent and Trademark Office has issued Patent No. 11,701,418 B2 to GeoVax, pursuant to the Company’s patent application No. 15/543,139 titled “Replication-Deficient Modified Vaccinia Ankara (MVA) and Matrix Protein (VP40).”
The claims granted by the patent generally cover GeoVax’s vector platform for expressing ebolavirus antigens in virus-like particles (VLPs) utilizing an MVA viral vector. The claims encompass multiple ebolavirus strains, including Sudan ebolavirus, Zaire ebolavirus, Taï Forest ebolavirus, and Reston ebolavirus.
GeoVax previously demonstrated that a single intramuscular (IM) dose of its vaccine candidate, GEO-EM01, provided 100% protection in rhesus macaques challenged with a lethal dose of Zaire ebolavirus (EBOV). GEO-EM01 is based on the Company’s novel MVA-VLP platform, which generates noninfectious VLPs in the individual being vaccinated. VLPs mimic a natural infection, triggering the body to produce a robust and durable immune response with both antibodies and T cells.
Additionally, in July 2021, the Company announced results of preclinical efficacy studies of its Sudan ebolavirus (SUDV) vaccine candidate, in which a single dose of the vaccine protected 100% of small animals challenged with a lethal dose of SUDV. Dr. Jason Comer of Sealy Institute for Vaccine Sciences, University of Texas Medical Branch (UTMB), recently discussed GeoVax’s Sudan virus vaccine efficacy. His presentation to the Global Health Preparedness Strategy and Priority Pathogens session at the 23rd Annual World Vaccine Congress demonstrated partial protection following lethal Sudan virus challenge in a rigorous cynomolgus macaque model. This research project has been funded in whole or in part with Federal funds under a Preclinical Services Contract from the National Institute of Allergy and Infectious Diseases, part of the National Institutes of Health.
David Dodd, GeoVax President and CEO, commented, “While our focus and development priorities continue to be our COVID-19 vaccine and cancer immunotherapy programs, developing vaccines against lethal hemorrhagic fever viruses, represents our commitment to addressing highly fatal endemic threats throughout the world, as well as our support of critically important biodefense initiatives. This patent allowance adds to our growing portfolio of wholly owned, co-owned, and in-licensed intellectual property, now standing at over 115 granted or pending patent applications spread over 24 patent families.”
About GeoVax
GeoVax Labs, Inc. is a clinical-stage biotechnology company developing novel therapies and vaccines for solid tumor cancers and many of the world’s most threatening infectious diseases. The company’s lead program in oncology is a novel oncolytic solid tumor gene-directed therapy, Gedeptin®, presently in a multicenter Phase 1/2 clinical trial for advanced head and neck cancers. GeoVax’s lead infectious disease candidate is GEO-CM04S1, a next-generation COVID-19 vaccine targeting high-risk immunocompromised patient populations. Currently in three Phase 2 clinical trials, GEO-CM04S1 is being evaluated as a primary vaccine for immunocompromised patients such as those suffering from hematologic cancers and other patient populations for whom the current authorized COVID-19 vaccines are insufficient, and as a booster vaccine in patients with chronic lymphocytic leukemia (CLL). In addition, GEO-CM04S1 is in a Phase 2 clinical trial evaluating the vaccine as a more robust, durable COVID-19 booster among healthy patients who previously received the mRNA vaccines. GeoVax has a leadership team who have driven significant value creation across multiple life science companies over the past several decades. For more information, visit our website: www.geovax.com.
Forward-Looking Statements
This release contains forward-looking statements regarding GeoVax’s business plans. The words “believe,” “look forward to,” “may,” “estimate,” “continue,” “anticipate,” “intend,” “should,” “plan,” “could,” “target,” “potential,” “is likely,” “will,” “expect” and similar expressions, as they relate to us, are intended to identify forward-looking statements. We have based these forward-looking statements largely on our current expectations and projections about future events and financial trends that we believe may affect our financial condition, results of operations, business strategy and financial needs. Actual results may differ materially from those included in these statements due to a variety of factors, including whether: GeoVax is able to obtain acceptable results from ongoing or future clinical trials of its investigational products, GeoVax’s immuno-oncology products and preventative vaccines can provoke the desired responses, and those products or vaccines can be used effectively, GeoVax’s viral vector technology adequately amplifies immune responses to cancer antigens, GeoVax can develop and manufacture its immuno-oncology products and preventative vaccines with the desired characteristics in a timely manner, GeoVax’s immuno-oncology products and preventative vaccines will be safe for human use, GeoVax’s vaccines will effectively prevent targeted infections in humans, GeoVax’s immuno-oncology products and preventative vaccines will receive regulatory approvals necessary to be licensed and marketed, GeoVax raises required capital to complete development, there is development of competitive products that may be more effective or easier to use than GeoVax’s products, GeoVax will be able to enter into favorable manufacturing and distribution agreements, and other factors, over which GeoVax has no control.
Further information on our risk factors is contained in our periodic reports on Form 10-Q and Form 10-K that we have filed and will file with the SEC. Any forward-looking statement made by us herein speaks only as of the date on which it is made. Factors or events that could cause our actual results to differ may emerge from time to time, and it is not possible for us to predict all of them. We undertake no obligation to publicly update any forward-looking statement, whether as a result of new information, future developments or otherwise, except as may be required by law.
The Company’s Start Proud!® Community Investment Program Empowers Students and Teachers to Start the New School Year Feeling Confident, Prepared and Proud
BOCA RATON, Fla.–(BUSINESS WIRE)–Jul. 24, 2023– The ODP Corporation (NASDAQ:ODP), a leading provider of products and services through an integrated business-to-business (B2B) distribution platform and omnichannel presence, today announced that over $2.5 million worth of educational supplies and equipment will be provided to students and teachers of Title I elementary schools across the country as a result of The ODP Corporation’s philanthropic program Start Proud!® and the generosity of our many vendor partners, including Boise Paper, Domtar and Crayola®.
Celebrating the sixth anniversary of the program, associate volunteers from The ODP Corporation—including Office Depot, ODP Business Solutions and VEYER—assembled 18,000 premium backpacks filled with over $2 million worth of school supplies—like notebooks, composition books, pencils, highlighters and more—to provide to students at nearly 30 Title I schools nationwide. Each backpack includes a box of Crayola® crayons as part of a donation valued at $50,000 from Crayola® to the Start Proud!® program.
The second portion of Start Proud!® kicks off in late September through October with a series of Title I teacher shopping sprees. With support from Domtar and Boise Paper, each school will also receive $20,000 in-store credit at Office Depot OfficeMax to benefit teachers by helping them with critical classroom essentials. This benefit helps alleviate the out-of-pocket purchases made by teachers, averaging $750–$1,000 each school year.1,2
“Caring for the communities in which we live and work is a huge component of our culture, which we’re demonstrating by supporting students, families and teachers each year,” said Gerry Smith, chief executive officer for The ODP Corporation. “As high inflation continues to impact families and teachers across the nation, our steadfast commitment to Start Proud!® enables students to start this school year confident, prepared and proud.”
The backpacks will be distributed at Start Proud!® signature on-campus school pep rallies throughout August and September, where school administrators, teachers and The ODP Corporation associates are teaming up to host the celebratory events, unveil the donations and welcome students back to school during their first week. Eighteen exemplary teachers will also be selected by their principals and surprised with an All-Star Teacher award in recognition of their dedication to education and extraordinary contributions to the students beyond the classroom. Each All-Star Teacher will be surprised with products including new technology, furniture and teaching supplies valued at over $2,000.
The continued commitment to leading philanthropic initiatives like Start Proud!® demonstrates The ODP Corporation’s dedication to supporting families and teachers nationwide.
1 Source: AdoptAClassroom.org, Teachers Spend $745 a Year on Supplies: The Cost of Distance Learning, June 15, 2020. 2 Source: NewsDirect, Teachers Spending More Out of Pocket on School Supplies Than Ever Before, August 18, 2021.
About The ODP Corporation The ODP Corporation (NASDAQ:ODP) is a leading provider of products and services through an integrated business-to-business (B2B) distribution platform and omnichannel presence, which includes world-class supply chain and distribution operations, dedicated sales professionals, a B2B digital procurement solution, online presence and a network of Office Depot and OfficeMax retail stores. Through its operating companies Office Depot, LLC; ODP Business Solutions, LLC; Veyer, LLC; and Varis, Inc., The ODP Corporation empowers every business, professional, and consumer to achieve more every day. For more information, visit theodpcorp.com.
ODP and ODP Business Solutions are trademarks of ODP Business Solutions, LLC. Office Depot is a trademark of The Office Club, LLC. OfficeMax is a trademark of OMX, Inc. Veyer is a trademark of Veyer, LLC. Varis is a trademark of Varis, Inc. Any other product or company names mentioned herein are the trademarks of their respective owners.
All-American Burger Chain Continues Amusement Park Growth with New San Antonio Location
LOS ANGELES, July 24, 2023 (GLOBE NEWSWIRE) — FAT (Fresh. Authentic. Tasty.) Brands Inc., parent company of Fatburger and 16 other restaurant concepts, announces the opening of Fatburger in San Antonio at Six Flags Fiesta Texas. This marks the sixth Fatburger in Texas to date with an additional 40-plus locations set to open in the state over the next 10 years.
“Last year, Fatburger opened its first Six Flags location at Six Flags Great Adventure in New Jersey,” said Jake Berchtold, COO of FAT Brands’ Fast Casual Division. “Since opening, the location has exceeded expectations, so we are thrilled to now be able to expand this partnership with a new restaurant at Six Flags Fiesta Texas. Parkgoers, locals and tourists alike, can now get a taste of Fatburger’s delicious, custom-built burgers in San Antonio!”
Ever since the first Fatburger opened in Los Angeles 70 years ago, the chain has been known for its delicious, grilled-to-perfection and cooked to order burgers. Founder Lovie Yancey believed that a big burger with everything on it is a meal in itself; at Fatburger “everything” is not just the usual roster of toppings. Burgers can be customized with everything from bacon and eggs to chili and onion rings. In addition to its famous burgers, the Fatburger menu also includes Fat and Skinny Fries, sweet potato fries, scratch-made onion rings, Impossible™ Burgers, turkeyburgers, hand-breaded crispy chicken sandwiches, and hand-scooped milkshakes made from 100% real ice cream.
The new Fatburger Six Flags Fiesta Texas restaurant is located at 17000 West Interstate 10, San Antonio, TX 78257.
For more information or to find a Fatburger near you, please visit www.fatburger.com.
About FAT (Fresh. Authentic. Tasty.) Brands FAT Brands (NASDAQ: FAT) is a leading global franchising company that strategically acquires, markets, and develops fast casual, quick-service, casual dining, and polished casual dining concepts around the world. The Company currently owns 17 restaurant brands: Round Table Pizza, Fatburger, Marble Slab Creamery, Johnny Rockets, Fazoli’s, Twin Peaks, Great American Cookies, Hot Dog on a Stick, Buffalo’s Cafe & Express, Hurricane Grill & Wings, Pretzelmaker, Elevation Burger, Native Grill & Wings, Yalla Mediterranean and Ponderosa and Bonanza Steakhouses, and franchises and owns over 2,300 units worldwide. For more information on FAT Brands, please visit www.fatbrands.com.
AboutFatburger An all-American, Hollywood favorite, Fatburger is a fast-casual restaurant serving big, juicy, tasty burgers, crafted specifically to each customer’s liking. With a legacy spanning 70 years, Fatburger’s extraordinary quality and taste inspire fierce loyalty amongst its fan base, which includes a number of A-list celebrities and athletes. Featuring a contemporary design and ambiance, Fatburger offers an unparalleled dining experience, demonstrating the same dedication to serving gourmet, homemade, custom-built burgers as it has since 1952 – The Last Great Hamburger Stand™. For more information, visit www.fatburger.com.
About Six Flags Entertainment Corporation Six Flags Entertainment Corporation is the world’s largest regional theme park company with 27 parks across the United States, Mexico and Canada. For nearly 62 years, Six Flags has entertained hundreds of millions of guests with world-class coasters, themed rides, thrilling water parks and unique attractions. Six Flags is committed to creating an inclusive environment that fully embraces the diversity of our team members and guests. For more information, visit www.sixflags.com.
Forward Looking Statements
This press release contains forward-looking statements within the meaning of the Private Securities Litigation Reform Act of 1995, including statements relating to the timing and performance of new store openings. Forward-looking statements reflect expectations of FAT Brands Inc. (“we”, “our” or the “Company”) concerning the future and are subject to significant business, economic and competitive risks, uncertainties and contingencies, including but not limited to uncertainties surrounding the severity, duration and effects of the COVID-19 pandemic. These factors are difficult to predict and beyond our control, and could cause our actual results to differ materially from those expressed or implied in such forward-looking statements. We refer you to the documents that we file from time to time with the Securities and Exchange Commission, such as our reports on Form 10-K, Form 10-Q and Form 8-K, for a discussion of these and other factors. We undertake no obligation to update any forward-looking statement to reflect events or circumstances occurring after the date of this press release.
A Broad-Based Recovery in Shares of Internet & Digital Media Stocks
Despite macroeconomic headwinds that include higher interest rates, a regional banking crisis, elevated inflation and a war in Europe, the S&P 500 powered higher for the third quarter in a row. The S&P 500 Index continued its streak of steady increases, with an 8% increase in the Index in 2Q 2023, which followed a 7% increase in 1Q 2023 and a 7% increase in 4Q 2022. The broad index is up a healthy 24% since the end of the third quarter of 2022. The S&P 500 bottomed on October 12, 2022, and is up 26% from that date through mid-July.
The S&P 500’s performance was driven primarily by its largest constituents. As a market weighted index, the largest stocks have an outsized impact on its performance, and that was certainly the case in 2Q. Eight of the largest stocks in the S&P 500 Index were up in 2Q 2023 by 2x-3x or more than the Index’s 8% gain. Stocks that powered the Index higher included Nvidia (NVDA, +52%), Meta Platforms (a.k.a Facebook, +META, +35%), Netflix (NFLX, +28%), Amazon (AMZN, +26%), Tesla (TSLA, +26%), Microsoft (MSFT, +18%), Apple (AAPL, +18%) and Google (GOOGL, +15%).
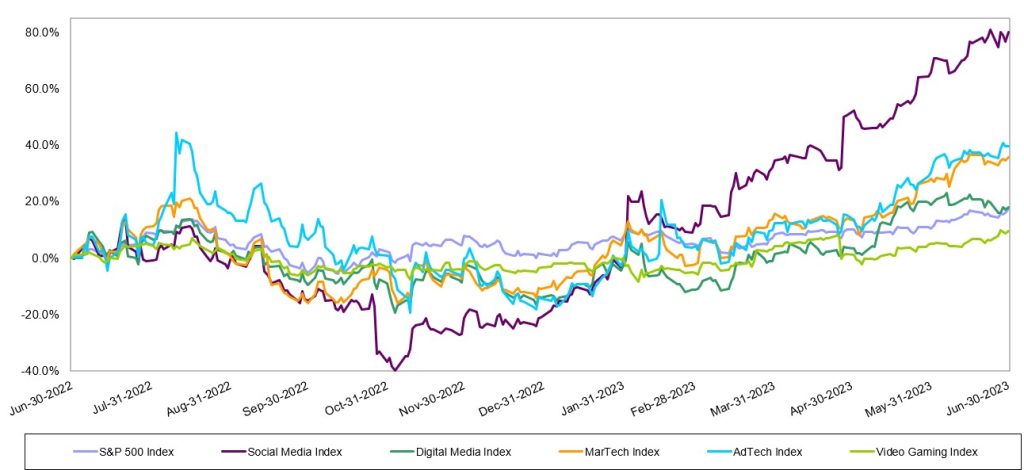
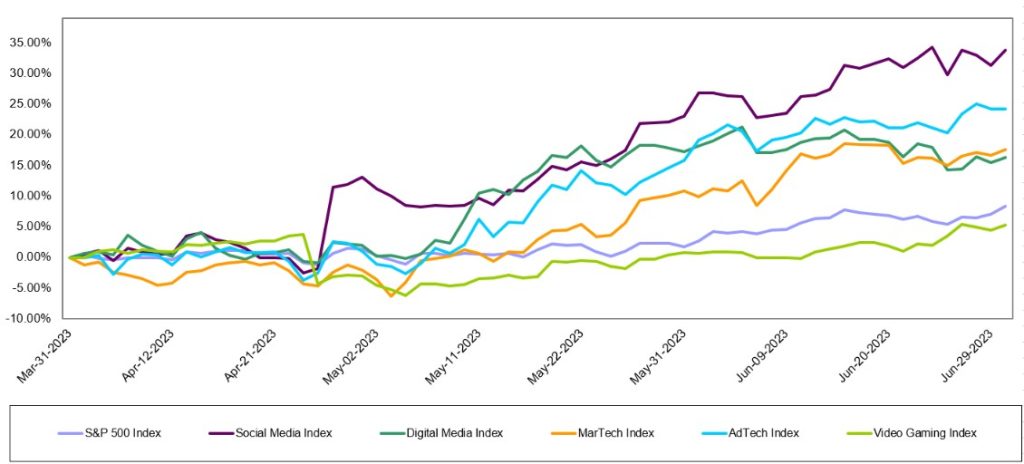
Noble’s Internet and Digital Media Indices, which are also market cap weighted, also powered higher thanks to the biggest constituents in their respective Indices. Each of these Indices posted double digital percent increases, with only the exception being Noble’s Video Gaming Index (+5%), which slightly underperformed the broader market/S&P Index. For the second quarter in a row, the best performing index was Noble’s Social Media Index, which increased by 34% in 2Q 2023, followed by Noble’s Ad Tech Index (+24%), MarTech Index (+18%), Digital Media Index (+16%), and Video Gaming Index (+5%).
STOCK MARKET PERFORMANCE: INTERNET AND DIGITAL MEDIA
Meta Powers the Social Media Index Higher
We attribute the strength of the Social Media Index to its largest constituent, Meta Platforms, whoseshares increased by 35% in the second quarter. We noted last quarter that Meta appeared to be returning to its roots and focusing on profitability, rather than its nascent and riskier web3 initiatives. That return to its core strengths has been greatly rewarded by investors. Shares of Meta were up 225% from its 52-week low of $88.09 per share in early November through the end of June. Shares are up another 8% since the start of the third quarter with the launch of Threads, Meta’s answer to Twitter. Over 100 million people signed up for Threads within the first five days of its rollout. Meta has not yet begun to monetize this opportunity, but it will clearly add to its growth in coming quarters.
Ad Tech Stocks Embark on a Broad-Based Recovery Following a Difficult 2022
Noble’s AdTech Index increased by 24% in 2Q 2023, and this performance was very broad based, with 15 of the 24 stocks in the sector up, and a dozen of the stocks up by double digits. Ad Tech stocks that performed best during the quarter include Applovin (APP, +63%), Magnite (MGNI, +47%), Tremor International (TRMR, +37%), Pubmatic (PUBM, +32%), Double Verify (DV, +29%), The Trade Desk (+27%), and Integral Ad Science (IAS, +26%). Ad Tech stocks were the worst performing sector in our universe in 2022, with the index down 63% for the year in 2022. The strong performance in 2Q 2023 in many respects reflects a bounce back off multi-year lows for several stocks. Year-to-date, one standout in particular is Integral Ad Science, whose shares were up 104% in the first half of 2023. The company continues to expand its product suite, scale its social media offerings (i.e., for TikTok) and is well positioned to continue to benefit from the shift from linear TV to connected TV (CTV). The company is benefiting from new partnerships with YouTube and Netflix and shares likely benefited during the quarter from anticipation of the company’s mid-June analyst day presentation.
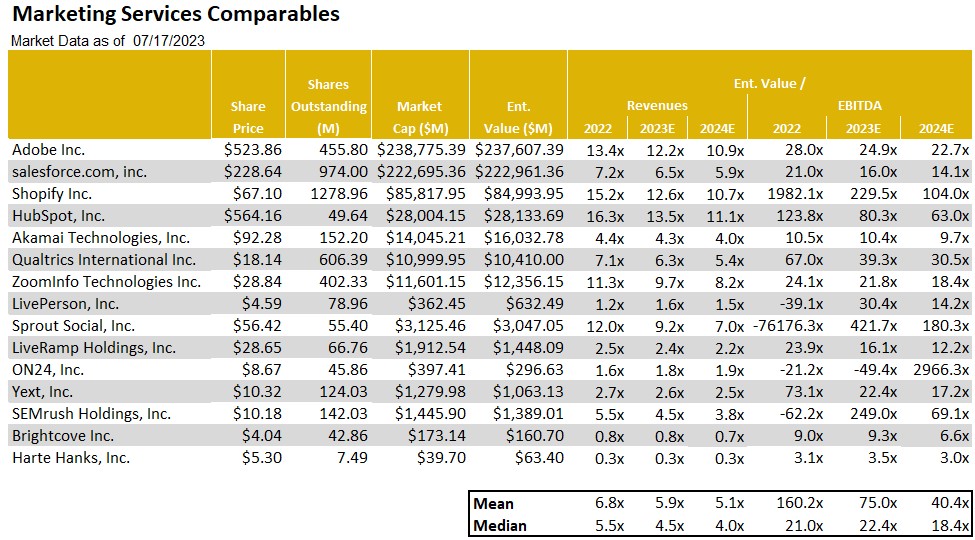
Noble’s MarTech Index was up 18%, with performance within the group also broad based. Thirteen of the 20 stocks in the Index were up in the quarter. MarTech stocks that performed best during the quarter include Cardlytics (CDLX, +86%), Shopify (SHOP, +35%), Live Ramp (RAMP, +30%), Adobe (ADBE, +27%), and Hubspot (NUBS, +24%). MarTech stocks were victims of their own success: the group traded at double digit revenue multiples in 2021, but the sector’s revenue multiples were more than halved in 2022. The group currently trades at 5.3x 2023E revenues, up from 4.1x 2023E revenues at the end of the first quarter, and 3.5x 2023E revenues at the start of the year.
Finally, the Digital Media Index was up 16% in 2Q 2023, and here again, the performance was broad based with 8 of the 12 stocks in the Index posting gains. Digital Media stocks that performed best during the quarter include Fubo TV (FUBO, +72%), Travelzoo (TZOO, +31%), Netflix (NFLX, +28%), Interactive Corp (IAC, +22%), and Spotify (SPOT, +20%). Year-to-date, the two best performing Digital Media stocks are Spotfiy (+103% YTD), which has shifted its priority to running a profitable company and took additional steps in 2Q to achieve it, for instance, by consolidating and streamlining several of its podcast company acquisitions from recent years. The second best performing Digital Media stock through the first half of the year was Travelzoo (TZOO), whose shares were up 77% in the first half of the year. The company continues to benefit from pent up demand that helped a surge in travel as the pandemic ebbed. Lodging and domestic travel demand rebounded first, but Travelzoo appears to be benefiting from cruises and international travel, where pent up demand took longer to recover.
2Q 2023 M&A – Global Deal Market Fell by 36% Year-Over-Year
According to Dealogic, global M&A fell by 36% to $733 billion in 1Q 2023 compared to $1.14 trillion in 2Q 2022, with high interest rates and a stand-off over the U.S. debt ceiling cited as reasons for caution in the M&A market. Uncertainty is the biggest issue impacting M&A. However, 2Q 2023 global M&A levels represent a 22% increase from 1Q 2023 global M&A of $601 billion in the first quarter of 2023.
In the U.S., M&A deal values decreased by 30% to $318 billion, while Europe and Asia Pacific volumes decreased by 49% and 24% respectively. Private equity buyouts have been particularly challenged with year-to-date values down 59% to $197 billion in the first half of the year, following a 56% decrease in 2Q 2023 vs. the year-ago period. It is difficult to tell how much the regional banking crisis in the U.S. played a role in these declines, but to the extent that regional banks play a role in middle market M&A, there is less credit available in the middle market, which has impacted valuations.
2Q 2023 Internet and Digital Media M&A – A Mixed Bag
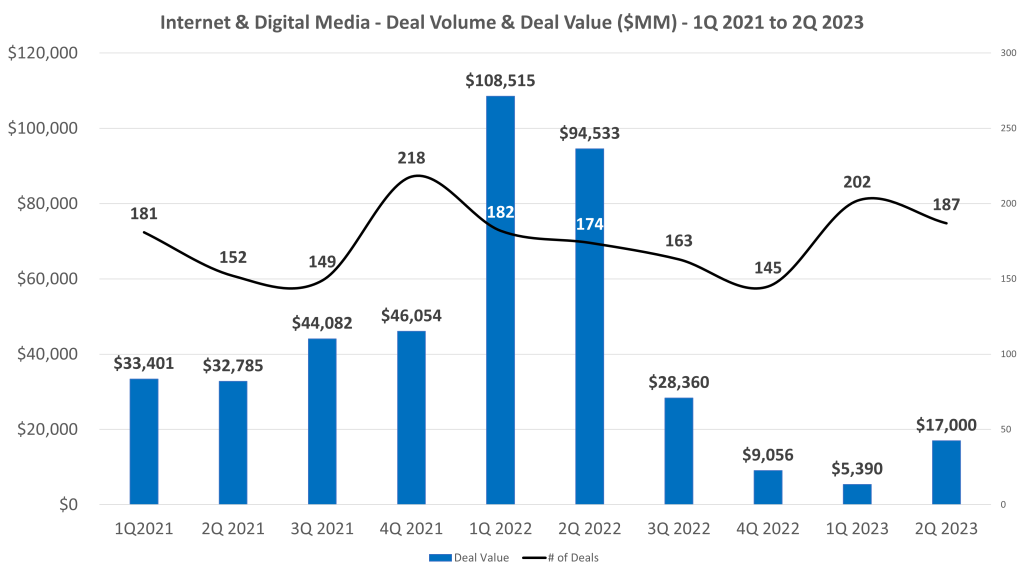
Based on Noble’s analysis, deal making in the second quarter of 2023 in the Internet and Digital Media sectors slowed, but was surprisingly weaker on a year-over-year basis than on a quarter-over-quarter basis. The total number of deals we tracked in the Internet and Digital Media space actually increased to by 3% to 187 deals in 2Q 2023 compared to 181 deals in 2Q 2022. On a sequential basis, the total number of deals decreased by 7% compared to 202 deals in the first quarter of 2023.
The biggest change was in the second quarter’s M&A deal value, where the total dollar value of deals fell by 82% to $17.0 billion of announced deals in 2Q 2023 compared to $95.5 billion in announced deals in 2Q 2022. While total deal value of announced deals decreased significantly year-over-year, on a sequential basis, deal value increased by 82% from $8.4 billion in deal value in 1Q 2023 to $17 billion in 2Q 2023.
From a deal volume perspective, the most active sectors we tracked were Digital Content (53 deals), MarTech (52 deals) and Agency & Analytics (40 deals). From a dollar value perspective, Digital Content led the way with $13.4 billion in transactions, followed by MarTech ($1.25 billion), Information Services ($1.23 billion) and eCommerce ($800 million). It was a very slow quarter for Ad Tech deals, where we tracked just 9 transactions for a total of $248 million.
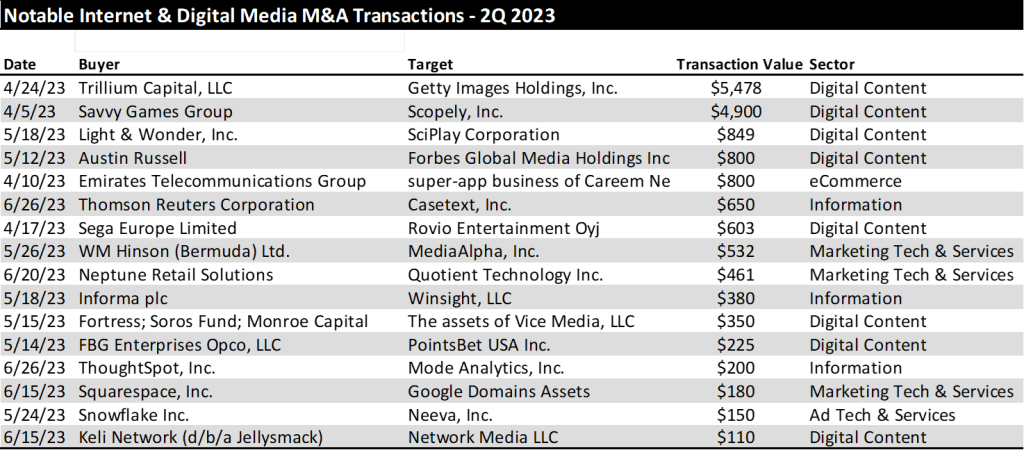
Video Gaming Deals Drive the Largest Transactions in 2Q 2023
It is notable that we tracked 16 transactions that were greater than $100 million in dollar value during the quarter and half of those transactions were in the Digital Content sector. In fact, the four largest transactions in the quarter were digital content transactions, with two of these deals being in the video gaming sector: Savvy Games Group’s $4.9 billion acquisition of Scopely, and Light & Wonder’s (previously known as Scientific Games Corp) $849 million announcement that it would acquire SciPlay Corporation. The largest deals in the quarter by dollar value are shown below.
TRADITIONAL MEDIA COMMENTARY
The following is an excerpt from a recent note by Noble’s Media Equity Research Analyst Michael Kupinski
The Recession Is Here
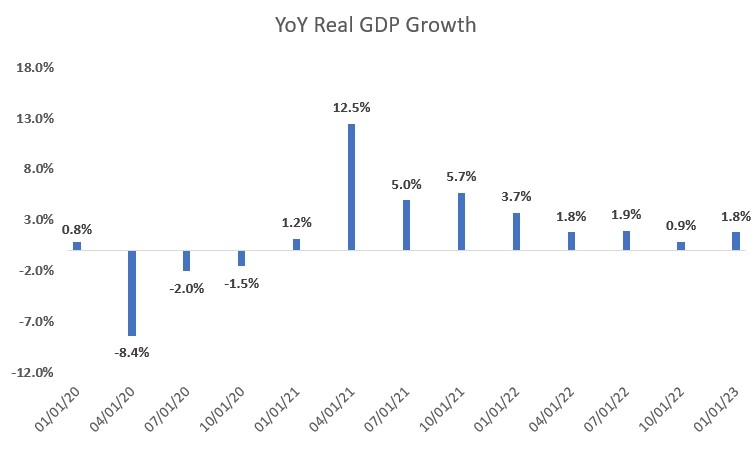
The economy grew post pandemic through the first quarter of 2023, reflecting a rebounding economy, fueled by government spending. But, economic activity is slowing, taking pressure off of inflation. Nonetheless, the Fed seems intent on pushing interest rates higher, likely through the balance of this year. Most economists anticipate that the Fed will raise interest rates by 25 basis points two times in the second half of this year. Not only will the interest rate increases be a headwind for the economy, but government spending, a key driver to the economy this year, is likely to wane. Recent economic forecasts anticipate GDP to contract over the next few quarters, a classic definition of an economic recession. The Conference Board of Economic Forecasts anticipates that the US economy will contract -1.2% in 3Q 2023, -1.9% in 4Q 2023, and -1.1% in 1Q 2024.
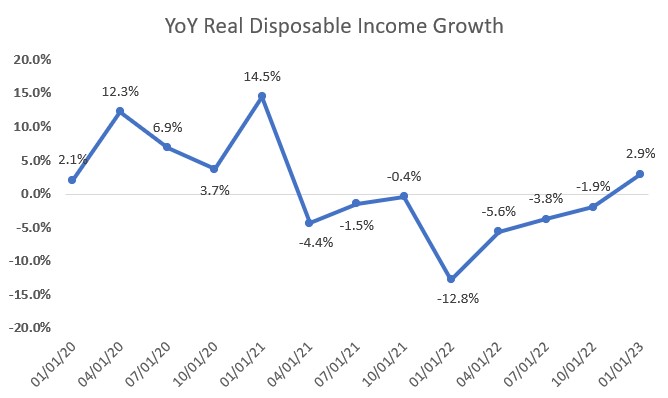
This does not paint a favorable picture for advertising in the very near term. Advertising is highly correlated to personal disposable income, particularly discretionary income. If consumers have discretionary income, companies advertise in anticipation of consumer spending. Disposable income has declined over the past 18 months. Not surprisingly, economically sensitive national advertising has been down nearly 4 quarters and at high double digit rates. Given the significant declines, as much as 25% in each quarter for the past year, national advertising trends should moderate, given that the comps get easier. Even with an economic downturn becoming more visible, it is possible that national advertising declines may moderate.
National advertisers tend to spend when there is light toward the end of an economic recession, when consumer personal disposable income shows signs that it will improve and consumers have the propensity to spend. In our view, that light at the end of the tunnel is still pretty dim given the economic forecast that anticipates a decline in GDP through 1Q 2024. While the visibility of an improvement in national advertising seems to have improved as we enter an economic downturn, especially given the easing comps and the benefit from political advertising (expected to begin in 3Q 2023), we think that it is too early to be optimistic. We believe that the length and severity of an economic downturn is not yet visible.
STOCK MARKET PERFORMANCE: TRADITIONAL MEDIA
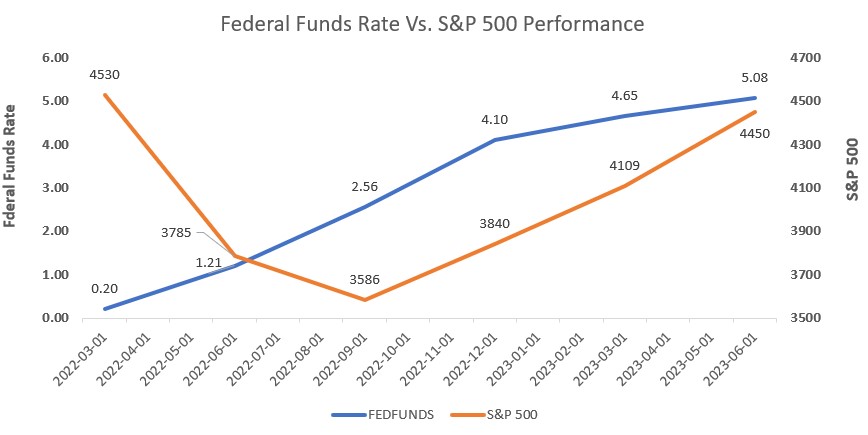
What does this mean for the stock market and for media stocks? The recent increases in Fed Funds rates had little effect on the general stock market as measured by the S&P 500 Index. Unfortunately, late cycle and economically sensitive media companies declined or under-performed the stock market. In spite of Fed Fund rate increases over the past year, the S&P 500 Index increased 18% in the last 12 months. The anticipation of an economic recession, however, weighed on media stocks.
The stock performance of the various media sectors generally under-performed the market. The exception to the poor performance were the Internet and Digital Media stocks, which had a broad-based recovery. Is it possible that early cycle media stocks will outperform the general market in the near term? In our view, yes, but, this may mean that the general market may decline as media stocks decline less. Historically, it has been the case to buy media stocks in the midst of a recession as media stocks strongly outperform the general market in an economic recovery. But given the likely disappointment in revenue in the coming quarters, it is likely that media stocks will be volatile as investors weigh the near-term revenue and earnings disappointments to the prospect of a revenue rebound in an improved economic scenario. This would suggest that if one were to try to time the stocks, investors may want to wait a quarter or two and buy on the improved momentum. This may mean that one might miss the large gains. For long-term investors, we believe that we are nearer to the bottom and that the downside appears relatively limited and valuations appear compelling. But, given the anticipated volatility in the near term, media investors should look for opportunistic purchases and accumulate positions in their favorite media names.
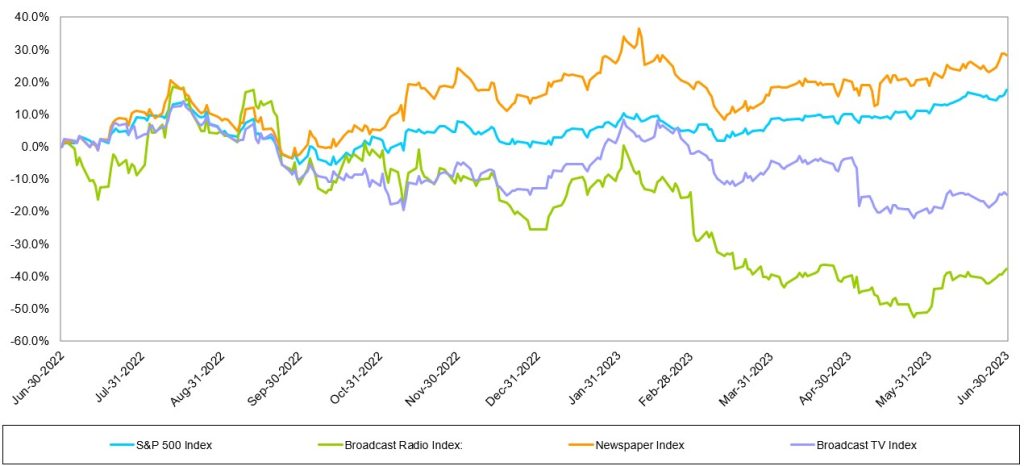
Traditional media stocks largely underperformed the general market over the LTM, the Radio sector was the hardest hit. The Noble Radio Index decreased 38% over the latest twelve months, compared with the general market increasing 18%, as measured by the S&P 500 over the same period. The Television Index was down 15% and the Publishing index outperformed the general market, increasing 28% over the last year. Notably, there were company stock performance disparities within each sector. Given the indices are market cap weighted, larger market capitalized companies skewed the indices’ performance.
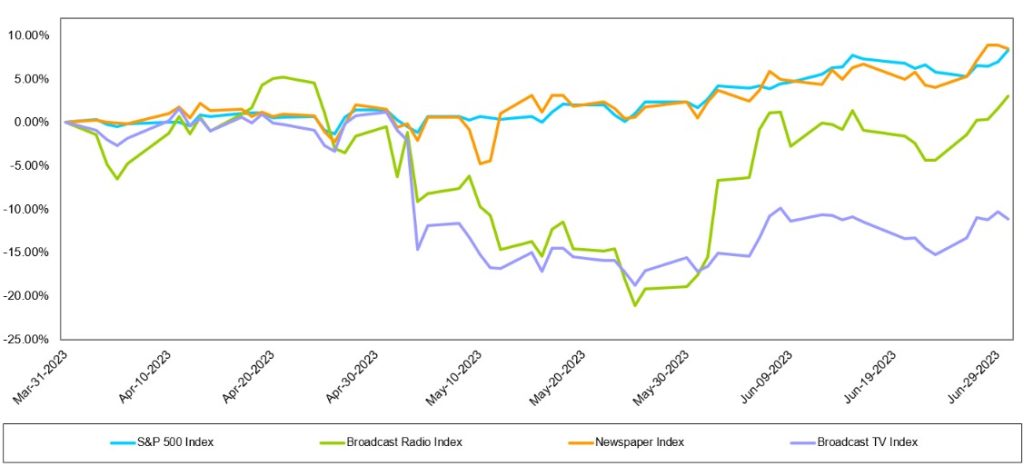
The traditional media industry is still finding its footing in the difficult economic environment, given the indices performance in Q2. While the Newspaper and Radio indices performed better in Q2 than Q1, the TV Index did not. The S&P 500, increased 8% over the last quarter and outperformed all but one traditional media sector. The Newspaper Index, which increased 9% over the same period narrowly outperformed the general market. The TV Index was the hardest hit traditional media sector and decreased -11%. While the Radio index underperformed the market in Q2, it improved upon a difficult Q1 and increased 3%.
Broadcast Television
Are ad trends really improving?
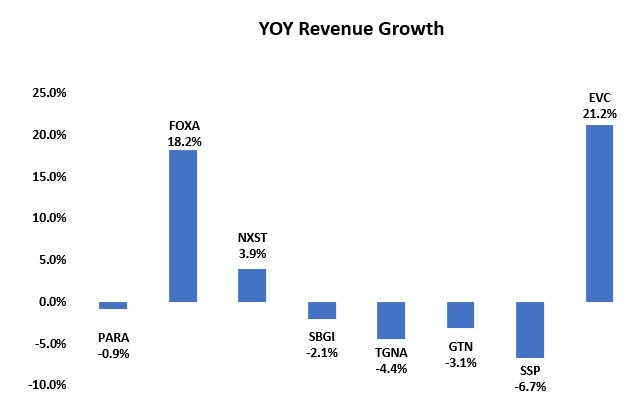
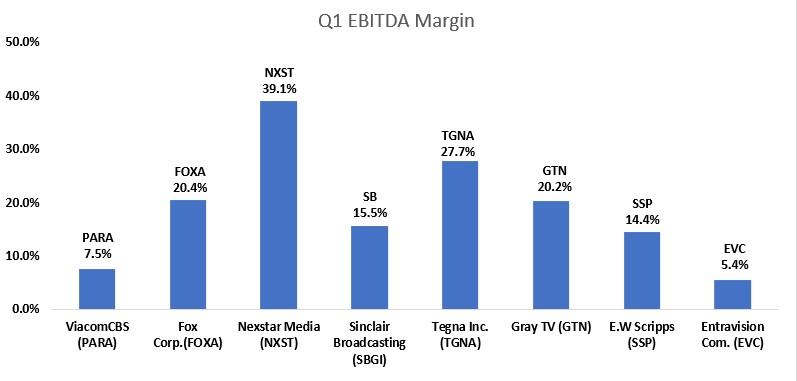
The TV Index underperformed the general market in the second quarter. While none of the stocks in the TV Index increased in the second quarter, many performed better than the market cap weighted return of -11%. Fox Corporation (FOXA; was flat at 0%), E.W Scripps (SSP; down 33%), Nexstar (NXST; down 4%) and Gray Television (GTN; down 10%) were among the best performing stocks in the hard-hit TV index. The stocks hit the hardest in Q2 were Sinclair Broadcast Group (SBGI; down 20%) and Entravision (EVC; down 27%). Given the recent turmoil in TV stock performances we view the depressed prices as a potential opportunity given the prospect of an advertising recovery over the next few quarters.
While there have been some recent reports indicating that television advertising is improving, possibly related to increased political advertising and auto advertising in the third quarter, we remain skeptical that the improvement is sustainable given the weakening economy. Nonetheless, the TV stocks appear cheap.
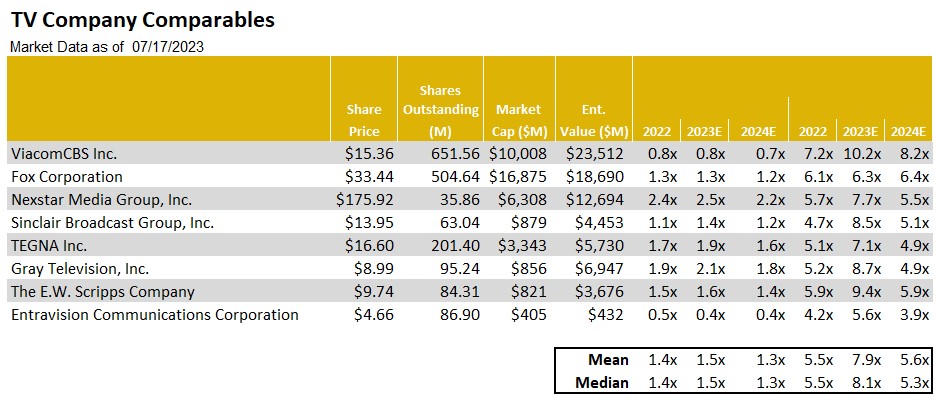
From a valuation perspective, Paramount (PARA) trades well above industry peers such as Entravision (EVC) and E.W Scripps (SSP), which trade at multiples well below the industry high. While E.W Scripps had modest year over year revenue decline, we believe it will benefit from favorable retransmission renewal revenue and improved margins on said revenue. Given the SSP shares low float, the shares tend to underperform when industry is out of favor and overperform when the industry is back in favor. As for Entravision, we view the company’s digital transformation positively, given the shares are trading at a modest 3.9 times Enterprise Value to our 2024 Adj. EBITDA estimate we believe there is limited downside risk. In our view, the EVC shares and SSP shares both offer a favorable risk reward relationship and are poised to benefit from an advertising recovery.
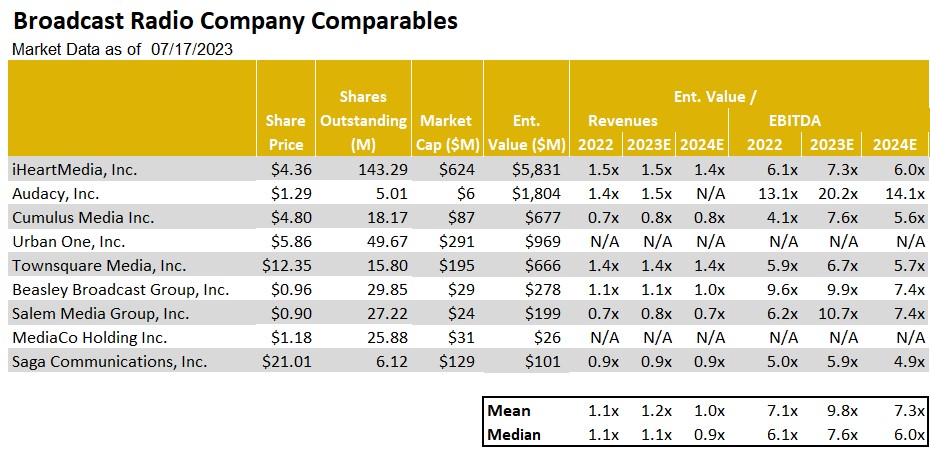
Broadcast Radio
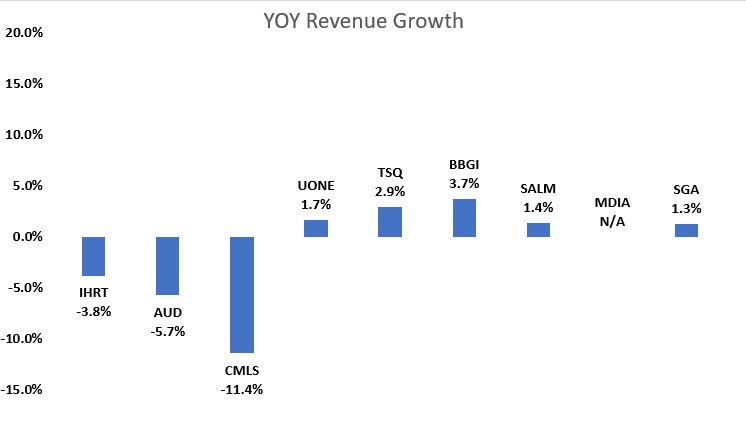
While the Radio Index underperformed the S&P 500 in Q2, it was an improvement from a difficult Q1. Notably, there were a few strong performances in the market cap weighted index. Beasley Broadcast Group (BBGI, up 24%) , Cumulus Media (CMLS, up 11%) and Townsquare (TSQ, up 49%) all strongly outperformed the S&P 500 in Q2. The largest stocks in the group did not perform well in the quarter skewing the index lower, Audacy (AUD, up 3%) and iHeart Media (IHRT; down 7%). The second quarter stock performances were a mixed bag and largely did not reflect the first quarter operating results. Most companies had modest revenue growth. The larger Radio companies that rely more on national advertising had the greatest declines of YoY revenue. With CMLS being the exception, the larger Radio companies underperformed relative to Radio companies with a stronger digital and highly localized presence.
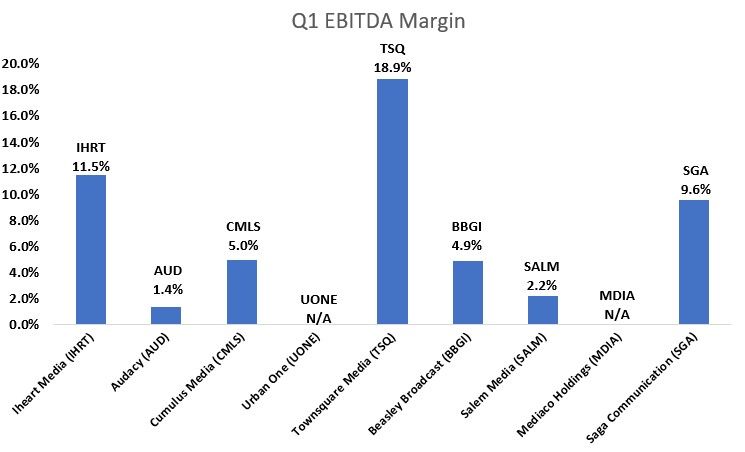
Some Radio companies have strong digital businesses and highly localized footprints, which provides some shelter from weakness in national advertising. Those companies include Townsquare, Beasley Broadcast Group, Salem Media (SALM; down 12%) and Saga Communications (SGA, down 4%). While the shares of Saga Communications (SGA) were down 4%, the performance did not reflect its favorable first quarter operating results. Importantly, Saga grew revenues a modest 1.3% and had an above average Q1 EBITDA margin of 9.6%. Saga has a highly localized footprint, as approximately 90% of revenues come from local sources. Furthermore, the company has been placing more importance on growing a profitable digital business in recent years. While Saga’s Digital business is early in its development, management is focused on growing digital revenues from 7.5% of total revenue in Q1 to 20% of total revenue over the next couple years. Additionally, the company is likely to maintain a strong cash position given the economic uncertainty.
Townsquare Media (TSQ), Salem Media (SALM), Beasley Broadcast (BBGI) and Saga Communications (SGA) have all diversified their revenue streams, and while not immune to the economic headwinds, their digital businesses and local footprints should offer some ballast to the more sensitive radio business.
We believe that radio advertising pacings likely will be problematic in the second half given the economic headwinds. Unlike Television, the industry does not benefit as much from political advertising. We expect that advertising pacings likely will be lower in Q3 than the Q2 results. It is likely that many radio companies, especially those with higher debt leverage, will implement cost cutting measures. With many of the radio companies already relatively lean from the Pandemic, it is likely that such measures will be difficult.
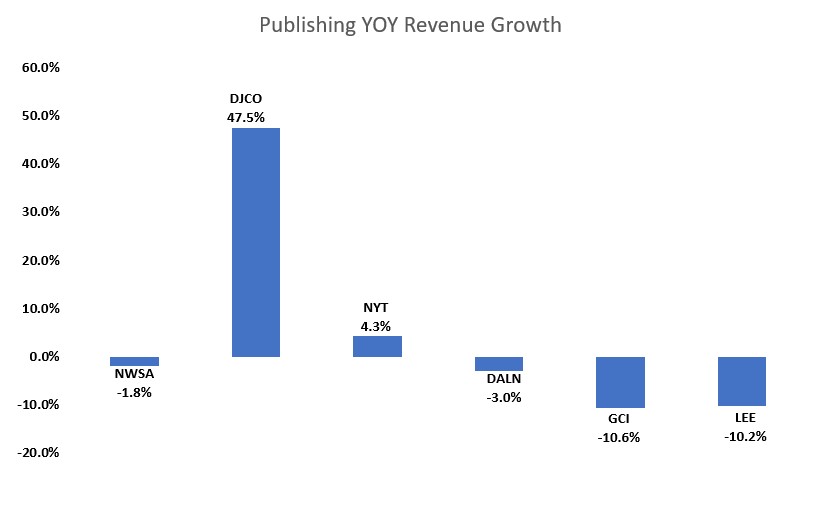
Publishing
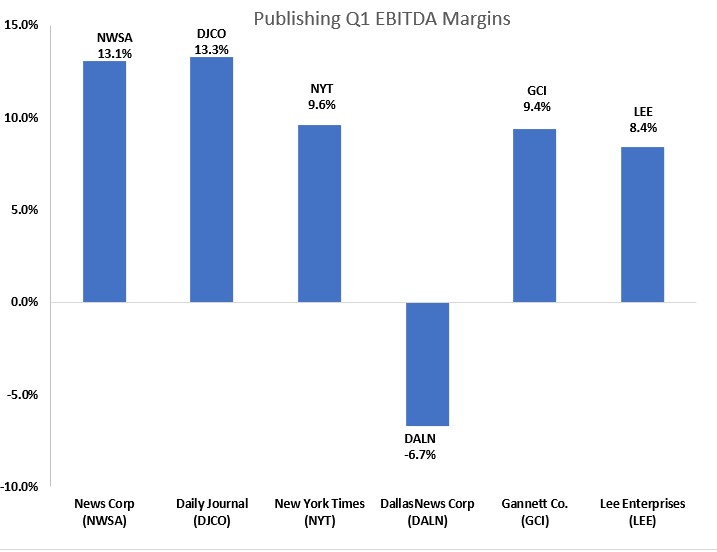
The Publishing industry is no exception to the advertising weakness that is impacting the broader media landscape. Revenues are likely to continue to decline, despite an already weak performance in the first quarter of the year. Revenue were predominantly negative in 1Q23. The advertising challenges are hitting the traditional print side of the publishing business hardest. For example, Lee Enterprises (LEE) reported a 10% decline in print advertising revenue in 1Q23, while digital advertising grew a modest 2%. The company’s adj. EBITDA generation fell 15% compared with a more moderate 2% drop in total company revenues.
Not surprisingly, the dampened industry revenue resulted in lower industry cash flow generation with EBITDA margins averaging in the 10% range. Yet despite the constraints on cash flow generation on Lee and the other Publishers, we believe the companies have the ability to cut costs to help offset the pressure on cash flow generation. In particular, companies could cut costs in their print manufacturing and distribution operations, reducing overhead in the same business segments where revenues are expected to lag. Publishing companies have a playbook on cutting legacy print costs and have the ability to maintain cash flow. However, cost cuts can take time to go into full effect, which could result in poor cash flow performance over the next quarter or so.
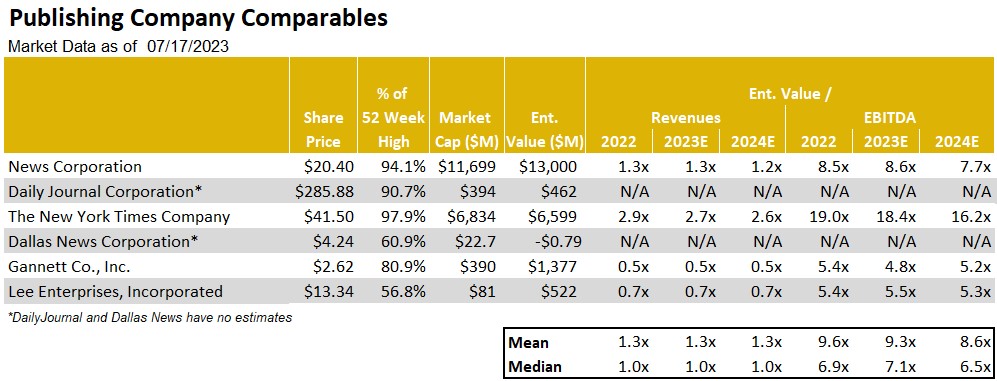
In spite of the nearer term economic headwinds impacting the operating performance of the industry, we believe that the industry is near an inflection point towards revenue growth. This dynamic is related to the degree of the recovery in its digital media businesses, a key driver to the industry’s overall revenue performance. While there are secular challenges to the industry’s print business, digital revenues account for an increasing portion of total revenues. For companies like Lee Enterprises, digital accounts for over 38% of total revenues in the most recent quarter. In our view, publishing companies will be a player in the advertising recovery as economic prospects improve.
Furthermore, we believe that stock valuations are compelling. The New York Times (NYT) trades well above the levels of the rest of its peers. In comparison, Lee and Gannett appear to be compelling. However, both Lee and Gannett are highly levered. Yet, in our view, Lee’s debt profile has several favorable characteristics, such as a fixed 9% annual rate, no fixed principal payments, no performance covenants and a 25-year maturity. LEE shares trade near 5.3 times enterprise value to our 2024 adj. EBITDA forecast, and with a favorable digital transformation of the business well underway, LEE shares could close the valuation gap with some of its higher trading peers.
This newsletter was prepared and provided by Noble Capital Markets, Inc. For any questions and/or requests regarding this news letter, please contact Chris Ensley
DISCLAIMER
All statements or opinions contained herein that include the words “ we”,“ or “ are solely the responsibility of NOBLE Capital Markets, Inc and do not necessarily reflect statements or opinions expressed by any person or party affiliated with companies mentioned in this report Any opinions expressed herein are subject to change without notice All information provided herein is based on public and non public information believed to be accurate and reliable, but is not necessarily complete and cannot be guaranteed No judgment is hereby expressed or should be implied as to the suitability of any security described herein for any specific investor or any specific investment portfolio The decision to undertake any investment regarding the security mentioned herein should be made by each reader of this publication based on their own appraisal of the implications and risks of such decision This publication is intended for information purposes only and shall not constitute an offer to buy/ sell or the solicitation of an offer to buy/sell any security mentioned in this report, nor shall there be any sale of the security herein in any state or domicile in which said offer, solicitation or sale would be unlawful prior to registration or qualification under the securities laws of any such state or domicile This publication and all information, comments, statements or opinions contained or expressed herein are applicable only as of the date of this publication and subject to change without prior notice Past performance is not indicative of future results.
Please refer to the above PDF for a complete list of disclaimers pertaining to this newsletter
Aurania Resources Ltd. (TSXV: ARU; OTCQB: AUIAF; Frankfurt: 20Q) (“Aurania” or the “Company”) is pleased to announce it has applied for an exploration license in the Brittany Peninsula of northwestern France through a wholly-owned French subsidiary. The concession area, which includes Hennebont in the Morbihan Department, has historically been the site of significant high-grade gold finds. Placer gold in streams is present in the vicinity of the area.
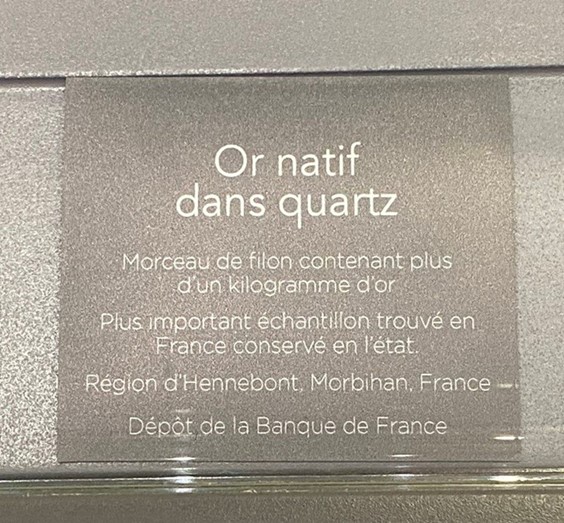
In December 2022, a very large and high-grade gold specimen was displayed at the Muséum National d’Histoire Naturelle (Natural History Museum) in Paris, France. Museum staff estimates this sample of 3.31 kilograms weight to contain one kilo of gold; it is considered the highest-grade gold sample currently known in France (Figure 1). It consists of vuggy coarse white quartz and native gold. Gold within the vugs is crystalline in nature (Figure 2). The sample is displayed next to a dendritic crystalline gold sample from the same locality (Figures 3 and 4).
Figure 1: High-grade gold specimen in the Natural History Museum, Paris, estimated to contain one kilogram of gold.
Figure 2: Vug in the quartz vein sample, approximately one centimetre across, containing drusy quartz and crystalline native gold.
Figure 3: Gold sample displayed next to a dendritic crystalline gold sample from the same locality.
Figure 4: Description of gold sample at the Natural History Museum in Paris. “Native gold in quartz vein, piece of vein containing more than 1 kilogram of gold, largest sample found in France kept as is, Bank of France deposit (loan)”.
Aurania’s team became aware of the sample last year and approached the museum staff as to its origins and provenance. We were told the samples were purchased by the Banque de France and were on loan to the Museum and that they supposedly came from an old collection. Museum staff supplied us with an article from the Journal du Morbihan, a newspaper dated August 13, 1875 and entitled “Le quartz aurifere dans le Morbihan”, and an extract from a book published by L’Abbe Henry Breuil, described in Wikipedia as a “French Catholic priest, archaeologist, anthropologist, ethnologist and geologist” and one of the principal early investigators of the cave paintings at Lascaux. Breuil examined a sample weighing 1,400 grams “with a little adhering quartz” that was found in 1875 and acquired by a jeweller. The son of the jeweller said his father had also purchased a nugget of 800 grams at the same time. The newspaper article said that two pieces of auriferous quartz were discovered by road builders 400 metres apart and that one was broken into a piece weighing 117 grams and a piece weighing about 900 grams. A third piece of 1,470 grams was found separately and purchased by the jeweller. The description continued, “These ores are gold-bearing quartz, very rich in gold, even excessively so. This gold is not compact, it is crystalline.”
Aurania’s President and CEO, Dr. Keith Barron met with a collector who wishes to remain anonymous, at the Sainte-Marie-aux-Mines mineral show in Alsace in June 2023, who allowed him to examine a one-kilogram specimen of quartz vein material with abundant gold that he claims comes from the same locality in France. The sample (see Figure 5) closely resembles the museum sample and given the estimated grade of 46% gold (460,000 g/t, or 13,416 oz/ton Au) it is almost certainly from the same locality.
Figure 5: Photo of a new gold-bearing quartz sample shown to Keith Barron by a collector and presumably coming from the same area.
A visit to the locality in December 2022 showed abundant quartz vein material on surface and evidence of past mining activity. Part of the site contains deep water filled pits and trenches that were presumably dug in the 19th century. Growth of moss on the quartz rocks is considered “luxuriant” and there is no evidence of modern prospecting or mining activity in the area. There has been no glaciation at the site and so the quartz vein material at surface is more or less “in situ”.
Update on Ecuador
On July 31st, Dr. Barron will meet with Mines Minister of Ecuador, Sr. Fernando Santos to discuss the potential “work around” mentioned in the Company’s press release dated June 19, 2023, to recover part or all of the former “Reserved Areas” that were initially applied for in 2016, and contain a large number of discrete magnetic, porphyry type targets.
At the same time, and in tandem with its exploration project and activities in Ecuador, the Company is excited to actively pursue this extraordinary new gold exploration opportunity in Brittany, France, mentioned above.
Qualified Person
The geological information contained in this news release has been verified and approved by Jean-Paul Pallier, MSc., Vice-President Exploration of the Company. Mr. Pallier is a designated EurGeol by the European Federation of Geologists and a Qualified Person as defined by National Instrument 43-101, Standards of Disclosure for Mineral Projects of the Canadian Securities Administrators.
About Aurania
Aurania is a mineral exploration company engaged in the identification, evaluation, acquisition and exploration of mineral property interests, with a focus on precious metals and copper in South America. Its flagship asset, The Lost Cities – Cutucú Project, is located in the Jurassic Metallogenic Belt in the eastern foothills of the Andes mountain range of southeastern Ecuador.
Click here to view the full press release dated July 24, 2023 on our website including contact details and forward-looking statements.
WESTON, Fla., July 24, 2023 (GLOBE NEWSWIRE) — ZyVersa Therapeutics, Inc. (Nasdaq: ZVSA, or “ZyVersa” or “the Company”), a clinical stage specialty biopharmaceutical company developing first-in-class drugs for treatment of inflammatory and renal diseases with high unmet needs, announced today the pricing of a “reasonable best efforts” public offering of 12,727,273 shares of common stock (or pre-funded warrants in lieu thereof) and common warrants to purchase up to 12,727,273 shares of common stock, at a combined public offering price of $0.165 per share (or pre-funded warrant in lieu thereof) and common warrant for aggregate gross proceeds of approximately $2.1 million, before deducting placement agent fees and other offering expenses. The warrants will have an exercise price of $0.165 per share, will be exercisable immediately, and will expire five years from the initial issuance date. The pre-funded warrants and accompanying common warrants are identical, except that each pre-funded warrant is immediately exercisable for one share of common stock at an exercise price of $0.0001, the purchase price for a pre-funded warrant and accompanying common warrants is the public offering price minus $0.0001 and the pre-funded warrants do not expire until exercised.
The closing of the offering is expected to occur on or about July 26, 2023, subject to the satisfaction of customary closing conditions. The Company intends to use the net proceeds of this offering for working capital and other general corporate purposes and may use a portion of the net proceeds to redeem the remaining outstanding shares of its Series A preferred stock.
A.G.P./Alliance Global Partners is acting as the sole placement agent for the offering.
The securities described above are being offered pursuant to a registration statement on Form S-1 (File No. 333-272657) previously filed with the Securities and Exchange Commission (SEC) which became effective on July 18, 2023. The offering is being made only by means of a prospectus forming part of the effective registration statement. A preliminary prospectus relating to the offering has been filed with the SEC. An electronic copy of the final prospectus will be filed with the SEC and may be obtained, when available, on the SEC’s website located at http://www.sec.gov and may also be obtained from A.G.P./Alliance Global Partners, 590 Madison Avenue, 28th Floor, New York, NY 10022, or by telephone at (212) 624-2060, or by email at prospectus@allianceg.com.
In connection with the offering, the Company agreed to amend, effective upon the closing of this offering, the terms of the April 2023 common stock purchase warrants held by a purchaser in the offering to reduce the exercise price thereof to the initial exercise price of the common warrants being sold in the offering and to extend the expiration date of such April 2023 warrants consistent with the expiration date of the common warrants. All of the other terms of the April 2023 warrants will remain unchanged.
This press release shall not constitute an offer to sell or the solicitation of an offer to buy any of the securities described herein, nor shall there be any sale of these securities in any state or other jurisdiction in which such offer, solicitation, or sale would be unlawful prior to the registration or qualification under the securities laws of any such state or other jurisdiction.
About ZyVersa Therapeutics
ZyVersa (Nasdaq: ZVSA) is a clinical stage specialty biopharmaceutical company leveraging advanced, proprietary technologies to develop first-in-class drugs for patients with renal and inflammatory diseases who have significant unmet medical needs. The Company is currently advancing a therapeutic development pipeline with multiple programs built around its two proprietary technologies – Cholesterol Efflux Mediator™ VAR 200 for treatment of kidney diseases, and Inflammasome ASC Inhibitor IC 100, targeting damaging inflammation associated with numerous CNS and other inflammatory diseases. For more information, please visit www.zyversa.com.
Certain statements contained in this press release regarding matters that are not historical facts, are forward-looking statements within the meaning of Section 21E of the Securities Exchange Act of 1934, as amended, and the Private Securities Litigation Reform Act of 1995. These include statements regarding management’s intentions, plans, beliefs, expectations, or forecasts for the future, and, therefore, you are cautioned not to place undue reliance on them. No forward-looking statement can be guaranteed, and actual results may differ materially from those projected. ZyVersa Therapeutics, Inc (“ZyVersa”) uses words such as “anticipates,” “believes,” “plans,” “expects,” “projects,” “future,” “intends,” “may,” “will,” “should,” “could,” “estimates,” “predicts,” “potential,” “continue,” “guidance,” and similar expressions to identify these forward-looking statements that are intended to be covered by the safe-harbor provisions. Such forward-looking statements are based on ZyVersa’s expectations and involve risks and uncertainties; consequently, actual results may differ materially from those expressed or implied in the statements due to a number of factors, including market and other conditions, ZyVersa’s ability to satisfy all conditions precedent to the closing of the offering; ZyVersa’s plans to develop and commercialize its product candidates, the timing of initiation of ZyVersa’s planned preclinical and clinical trials; the timing of the availability of data from ZyVersa’s preclinical and clinical trials; the timing of any planned investigational new drug application or new drug application; ZyVersa’s plans to research, develop, and commercialize its current and future product candidates; the clinical utility, potential benefits and market acceptance of ZyVersa’s product candidates; ZyVersa’s commercialization, marketing and manufacturing capabilities and strategy; ZyVersa’s ability to protect its intellectual property position; and ZyVersa’s estimates regarding future revenue, expenses, capital requirements and need for additional financing.
New factors emerge from time-to-time, and it is not possible for ZyVersa to predict all such factors, nor can ZyVersa assess the impact of each such factor on the business or the extent to which any factor, or combination of factors, may cause actual results to differ materially from those contained in any forward-looking statements. Forward-looking statements included in this press release are based on information available to ZyVersa as of the date of this press release. ZyVersa disclaims any obligation to update such forward-looking statements to reflect events or circumstances after the date of this press release, except as required by applicable law.
This press release does not constitute an offer to sell, or the solicitation of an offer to buy, any securities.
Corporate and IR Contact: Karen Cashmere Chief Commercial Officer kcashmere@zyversa.com 786-251-9641
Media Contacts Tiberend Strategic Advisors, Inc. Casey McDonald cmcdonald@tiberend.com 646-577-8520
Dave Schemelia dschemelia@tiberend.com 609-468-9325
New Findings Support Development of Racemic Tianeptine and (S)-Tianeptine (Estianeptine) as First-in-Class Oral Therapiesin Alzheimer’s Disease and Other Psychiatric and Neurodegenerative Conditions with Memory Deficits
(S)-Tianeptine Effects on Novel Object Recognition are Consistent with a Role for PPAR-β/δ Activation in Improving Memory and Cognition
Topline Results Expected First Quarter 2024 from the Currently Enrolling Potentially Pivotal Phase 2 UPLIFT Study of TNX-601 ER (Racemic Tianeptine) in Major Depressive Disorder
CHATHAM, N.J., July 24, 2023 (GLOBE NEWSWIRE) — Tonix Pharmaceuticals Holding Corp. (Nasdaq: TNXP) (Tonix or the Company), a biopharmaceutical company, today announced data supporting the memory- and cognition-enhancing effects of two Tonix drug candidates, TNX-601 ER (tianeptine hemioxalate extended release) and TNX-4300 (estianeptine), the single (S)-isomer of tianeptine. TNX-601 ER is being tested in the potentially pivotal Phase 2 UPLIFT1 trial for the treatment of major depressive disorder (MDD), with topline results expected in the first quarter of 2024. TNX-4300 is in preclinical development for mood disorders, Alzheimer’s disease and Parkinson’s disease.* The findings reported today show that tianeptine and estianeptine improve memory and cognition as measured in the rat Novel Object Recognition (NOR) test. The finding that estianeptine is responsible for improving memory and cognition suggests a role for PPAR-β/δ activation in memory.
Tianeptine is an antidepressant that has been marketed outside the U.S. for more than 30 years. Tianeptine is also a racemic drug composed of a 1:1 mixture of two mirror-image isomers. Tonix recently reported that the (S)-isomer (estianeptine) is responsible for its positive effects on neuroplasticity in cell culture, while the (R)-isomer is responsible for racemic tianeptine’s off-target activity on the µ-opioid receptor.2,3 Tonix also recently reported that estianeptine activates peroxisome proliferator-activated receptors PPAR-β/δ and PPAR-γ. These activities on molecular targets in neurons and glia in the brain are believed to relate to tianeptine’s ability to restore connectivity between neurons that atrophy in conditions of stress or depression in animal models.4 Tianeptine’s mechanism is distinct from traditional antidepressants that alter the level or activity of serotonin, norepinephrine, and dopamine neurotransmitters, which are believed to indirectly induce neurons to make new connections.5
“The memory- and cognition-enhancing effects of racemic tianeptine and estianeptine seen in the NOR test are consistent with human clinical studies in which racemic tianeptine treatment improved cognition and memory in patients with Alzheimer’s disease and depression6 and in patients with bipolar disorder,7” said Seth Lederman, M.D., Chief Executive Officer of Tonix Pharmaceuticals. “We recently reported that estianeptine induces neuroplasticity in cell culture.2 The new findings indicate that estianeptine also improves memory and cognition in the in vivo rat NOR test. We believe that together these findings support the development of tianeptine and estianeptine in psychiatric and neurodegenerative diseases. Tianeptine’s ability to restore atrophied neuronal connections in animals2 suggests the potential to achieve durable outcomes.”
“The rat NOR test is an experimental tool to assess drug effects on memory and evaluate their potential as treatments for neurodegenerative conditions like Alzheimer’s disease,” said Gregory Sullivan, M.D., Chief Medical Officer of Tonix Pharmaceuticals. “Since the main initial clinical feature in Alzheimer’s disease is impairment in newly learned facts or memories, improving learning and memory are important properties of potential new therapeutics. The specific type of learning and recognition memory measured by the NOR is believed to be relevant to the neurocircuitry impaired in Alzheimer’s disease.”
Dr. Sullivan continued, “Our ongoing clinical studies in major depression on TNX-601 ER, which contains racemic tianeptine, are expected to inform and potentially accelerate the development of TNX-4300 which contains the single isomer, estianeptine. We believe that estianeptine bypasses the synapse and activates intracellular PPAR-β/δ and PPAR-γ targets. The finding that estianeptine is responsible for tianeptine’s ability to improve memory and cognition in the NOR test implicates PPAR-β/δ activation specifically as a molecular target. This finding is consistent with the impaired memory of mice lacking the PPAR-β/δ gene.”8
In depression, estianeptine is believed to act on PPAR-β/δ and PPAR-γ targets in the nucleus to enhance genetic transactivation involved in restoring hippocampal neuroplasticity and neurogenesis. These findings also have applicability to neurodegenerative diseases in which neuronal connections are atrophied.2 The reported PPAR mechanism has potential relevance to why tianeptine is not associated with sexual dysfunction, weight gain or several other treatment-limiting toxicities associated with the antidepressants currently marketed in the U.S. for long-term use. However, tianeptine has other potential side effects that are described in its labeling outside the U.S. where it is marketed as a prescription drug.
Tonix owns worldwide rights to the novel salt, racemic tianeptine hemioxalate and to the proprietary extended-release formulation employed in TNX-601 ER that allows once daily dosing. TNX-601 ER is currently being studied in the Phase 2 UPLIFT trial, which is targeting enrollment of approximately 300 patients at about 30 U.S. clinical sites. Tonix has also filed patents claiming single (S)-isomer estianeptine, the active ingredient in TNX-4300, which is devoid of activity on the µ-opioid receptor. TNX-4300 is currently in preclinical development for depression, bipolar disorder, Alzheimer’s disease, and Parkinson’s disease.
Key experiments were performed by scientists at Tonix’s Research and Development Center (RDC) in Frederick, Maryland.
*TNX-601 ER and TNX-4300 are investigational new drugs and are not approved for any indication. TNX-601 ER is being developed under an IND. TNX-4300 is at the pre-IND stage of development.
About Tianeptine
Racemic tianeptine sodium (amorphous) immediate release (dosed 3 times daily) was first marketed for depression in France in 1989 and has been available for decades in Europe, Russia, Asia, and Latin America for the treatment of depression. Tianeptine sodium has an established tolerability profile from decades of use in these jurisdictions. Currently no tianeptine-containing product is approved in the U.S. and no extended-release once-daily tianeptine product is approved in any jurisdiction. In animal models, tianeptine restores dendritic arborization of pyramidal neurons in the CA3 region of hippocampus and in the dentate gyrus region promotes new neuron formation and integration into hippocampal networks.4 Tianeptine’s enhancement of neuroplasticity in animal models of stress is believed to be mediated by activation of PPAR isoforms PPAR-β/δ and PPAR-γ, which is mechanistically distinct from traditional monoaminergic antidepressants marketed in the U.S. and contributes to its potential for clinical indications beyond depression and stress disorders. Tianeptine and its MC5 metabolite are also weak µ-opioid receptor (MOR) agonists that present a potential abuse liability if illicitly misused in large quantities.3,9 In cases where tianeptine has been abused, the dose has been approximately 8-80 times the therapeutic dose in depression on a daily basis.9 In patients who were prescribed tianeptine for depression, the French Transparency Committee found an incidence of misuse of approximately 1 case per 1,000 patients treated9 suggesting low abuse liability when used at the antidepressant dose in patients prescribed tianeptine for depression. Clinical trials have shown that cessation of a therapeutic course of tianeptine does not appear to result in dependence or withdrawal symptoms following 6-weeks11-15, 3-months,16 or 12-months17 of treatment. Estianeptine is believed to mimic naturally occurring polyunsaturated fatty acid ligands in low affinity interactions with PPAR-β/δ and PPAR-γ. Estianeptine’s activation of nuclear PPAR-β/δ and PPAR-γ receptors appears to be a more direct mechanism to achieve the goal of restoring neuronal connectivity than the active ingredients of current pharmacologic therapies for depression. Tianeptine’s proposed mechanism as a plastogen is consistent with its clinical effects in promoting cognition in depressed patients with Alzheimer’s disease5 and in patients with bipolar disorder.6 The PPAR-β/δ target is validated by prior work on agonists treating animal models of neurodegenerative and autoimmune diseases of the central nervous system.18 Alzheimer’s disease has been proposed to be a form of diabetes that affects the CNS, sometimes termed “type-III diabetes.”19 The PPAR superfamily plays key roles in metabolic processes, and activation of PPAR-β/δ in brain by tianeptine shows promise to prevent the cognitive dysfunction associated with CNS insulin resistance. Tianeptine’s reported pro-cognitive and anxiolytic effects as well as its ability to attenuate the neuropathological effects of excessive stress responses suggest other potential uses including as a treatment for posttraumatic stress disorder (PTSD), as well as for preventing neurocognitive dysfunction associated with corticosteroid use.
About the Novel Object Recognition Test (NOR)
NOR is one of several cognitive tests that engage working memory and is considered a model for testing therapeutics or co-factors for Alzheimer’s disease.20 The NOR task depends on the accurate comparison of novel information with recently stored memories. Among animal behavioral models for assessing cognitive functioning, the NOR test measures a specific form of recognition memory without assumptions about drug mechanism. The NOR is based on the spontaneous behavior of rodents without the need for external motivation, reward, or punishment. Impairments of NOR are seen in many animal models, including mice that overexpress the amyloid protein associated with Alzheimer’s disease.21 The NOR tests on tianeptine and estianeptine were performed by a third-party contract research organization. In the NOR test, rats were assessed for cognitive ability in a test apparatus comprising an open-field arena and were scored by an observer blind to treatments. The positive control for a drug effect was the acetylcholinesterase inhibitor medication galantamine, which is the active ingredient of Razadyne®, approved by the U.S. Food and Drug administration as a treatment for Alzheimer’s disease. On Days 1 and 2, rats were allowed to freely explore the empty arena for a 10-minute habituation period. On Day 3, rats were administered saline, galantamine or test article (racemic tianeptine or estianeptine) and following the pretreatment time of 60 min, rats were then placed into the test arena in the presence of two identical objects. The time spent actively exploring the objects during a 3-minute training (T1) session was recorded. Each rat was returned to its home cage following training. After 48 hours, the rats were administered saline, galantamine or test article again, and, after 60 min, they were placed into the test arena in the presence of two objects: one familiar and one novel. The times spent exploring each object were recorded for 5 minutes in the testing session (T2). The outcome measure known as the Recognition Index was employed in these studies, defined as the ratio of the time spent exploring the novel object over the total time spent exploring both objects. These results are being prepared for presentation at a scientific meeting and for publication.
Kauer-Sant’Anna M, et al. J Psychopharmacol 2019, 33 (4), 502-510.
Barroso et al., Biochim Biophys Acta. 2013. 1832:1241–1248
Lauhan, R., et al. Psychosomatics 2018, 59 (6), 547–53.
Haute Authorite de Sante; Transparency Committee Opinion. Stablon 12.5 Mg, Coated Tablet, Re- Assessment of Actual Benefit at the Request of the Transparency Committee. December 5, 2012.
Emsley, R., et al. J. Clin. Psychiatry 2018, 79 (4)
Bonierbale M, et al. Curr Med Res Opin 2003, 19(2):114-124.
Guelfi, J. D., et al. Neuropsychobiology 1989, 22 (1), 41–48.
Invernizzi, G. et al., Neuropsychobiology 1994, 30 (2–3), 85–93.
Lepine, J. P., et al. Hum. Psychopharmacol. 2001, 16 (3), 219–227.
Guelfi, J. D. et al., Neuropsychobiology 1992, 25 (3), 140–148.
Lôo, H. et al., Br. J. Psychiatry. Suppl. 1992, 15, 61–65.
Kahremany S et al. Br J Pharmacol 2015, 172(3):754-70
Nguyen et al., Int J Mol Sci. 2010, 21(9):3165
Bengoetxea X, et al. Front Biosci (Schol Ed). 2015, 7(1):10-29.
Romberg C, et al., Brain. 2012, 135(Pt 7):2103-14.
Tonix Pharmaceuticals Holding Corp.*
Tonix is a biopharmaceutical company focused on commercializing, developing, discovering and licensing therapeutics to treat and prevent human disease and alleviate suffering. Tonix markets Zembrace® SymTouch® (sumatriptan injection) 3 mg and Tosymra® (sumatriptan nasal spray) 10 mg. Zembrace SymTouch and Tosymra are each indicated for the treatment of acute migraine with or without aura in adults. Tonix’s development portfolio is composed of central nervous system (CNS), rare disease, immunology and infectious disease product candidates. Tonix’s CNS development portfolio includes both small molecules and biologics to treat pain, neurologic, psychiatric and addiction conditions. Tonix’s lead CNS candidate, TNX-102 SL (cyclobenzaprine HCl sublingual tablet), is in mid-Phase 3 development for the management of fibromyalgia with topline data expected in the first quarter of 2024. TNX-102 SL is also being developed to treat Long COVID, a chronic post-acute COVID-19 condition. Enrollment in a Phase 2 study has been completed, and topline results are expected in the third quarter of 2023. TNX-601 ER (tianeptine hemioxalate extended-release tablets), a once-daily formulation being developed as a treatment for major depressive disorder (MDD), is also currently enrolling with topline results expected in the first quarter of 2024. TNX-4300 (estianeptine) is a small molecule oral therapeutic in preclinical development to treat MDD, Alzheimer’s disease and Parkinson’s disease. TNX-1900 (intranasal potentiated oxytocin), in development for chronic migraine, is currently enrolling with topline data expected in the fourth quarter of 2023. TNX-1300 (cocaine esterase) is a biologic designed to treat cocaine intoxication and has been granted Breakthrough Therapy designation by the FDA. A Phase 2 study of TNX-1300 is expected to be initiated in the third quarter of 2023. Tonix’s rare disease development portfolio includes TNX-2900 (intranasal potentiated oxytocin) for the treatment of Prader-Willi syndrome. TNX-2900 has been granted Orphan Drug designation by the FDA. Tonix’s immunology development portfolio includes biologics to address organ transplant rejection, autoimmunity and cancer, including TNX-1500, which is a humanized monoclonal antibody targeting CD40-ligand (CD40L or CD154) being developed for the prevention of allograft rejection and for the treatment of autoimmune diseases. A Phase 1 study of TNX-1500 is expected to be initiated in the third quarter of 2023. Tonix’s infectious disease pipeline includes TNX-801, a vaccine in development to prevent smallpox and mpox. TNX-801 also serves as the live virus vaccine platform or recombinant pox vaccine platform for other infectious diseases. The infectious disease development portfolio also includes TNX-3900 and TNX-4000, classes of broad-spectrum small molecule oral antivirals.
* Tonix’s product development candidates are investigational new drugs or biologics and have not been approved for any indication.
Zembrace SymTouch and Tosymra are registered trademarks of Tonix Medicines. Intravail is a registered trademark of Aegis Therapeutics, LLC, a wholly owned subsidiary of Neurelis, Inc. All other marks are the property of their respective owners.
This press release and further information about Tonix can be found at www.tonixpharma.com.
Forward Looking Statements
Certain statements in this press release are forward-looking within the meaning of the Private Securities Litigation Reform Act of 1995. These statements may be identified by the use of forward-looking words such as “anticipate,” “believe,” “forecast,” “estimate,” “expect,” and “intend,” among others. These forward-looking statements are based on Tonix’s current expectations and actual results could differ materially. There are a number of factors that could cause actual events to differ materially from those indicated by such forward-looking statements. These factors include, but are not limited to, risks related to the failure to obtain FDA clearances or approvals and noncompliance with FDA regulations; risks related to the failure to successfully market any of our products; risks related to the timing and progress of clinical development of our product candidates; our need for additional financing; uncertainties of patent protection and litigation; uncertainties of government or third party payor reimbursement; limited research and development efforts and dependence upon third parties; and substantial competition. As with any pharmaceutical under development, there are significant risks in the development, regulatory approval and commercialization of new products. Tonix does not undertake an obligation to update or revise any forward-looking statement. Investors should read the risk factors set forth in the Annual Report on Form 10-K for the year ended December 31, 2022, as filed with the Securities and Exchange Commission (the “SEC”) on March 13, 2023, and periodic reports filed with the SEC on or after the date thereof. All of Tonix’s forward-looking statements are expressly qualified by all such risk factors and other cautionary statements. The information set forth herein speaks only as of the date thereof.
Zembrace® SymTouch® (sumatriptan Injection): IMPORTANT SAFETY INFORMATION
Zembrace SymTouch (Zembrace) can cause serious side effects, including heart attack and other heart problems, which may lead to death. Stop use and get emergency help if you have any signs of a heart attack:
discomfort in the center of your chest that lasts for more than a few minutes or goes away and comes back
severe tightness, pain, pressure, or heaviness in your chest, throat, neck, or jaw
pain or discomfort in your arms, back, neck, jaw or stomach
shortness of breath with or without chest discomfort
breaking out in a cold sweat
nausea or vomiting
feeling lightheaded
Zembrace is not for people with risk factors for heart disease (high blood pressure or cholesterol, smoking, overweight, diabetes, family history of heart disease) unless a heart exam shows no problem.
Do not use Zembrace if you have:
history of heart problems
narrowing of blood vessels to your legs, arms, stomach, or kidney (peripheral vascular disease)
uncontrolled high blood pressure
hemiplegic or basilar migraines. If you are not sure if you have these, ask your provider.
had a stroke, transient ischemic attacks (TIAs), or problems with blood circulation
severe liver problems
taken any of the following medicines in the last 24 hours: almotriptan, eletriptan, frovatriptan, naratriptan, rizatriptan, ergotamines, dihydroergotamine.
are taking certain antidepressants, known as monoamine oxidase (MAO)-A inhibitors or it has been 2 weeks or less since you stopped taking a MAO-A inhibitor. Ask your provider for a list of these medicines if you are not sure.
an allergy to sumatriptan or any of the components of Zembrace
Tell your provider about all of your medical conditions and medicines you take, including vitamins and supplements.
Zembrace can cause dizziness, weakness, or drowsiness. If so, do not drive a car, use machinery, or do anything where you need to be alert.
Zembrace may cause serious side effects including:
changes in color or sensation in your fingers and toes
sudden or severe stomach pain, stomach pain after meals, weight loss, nausea or vomiting, constipation or diarrhea, bloody diarrhea, fever
cramping and pain in your legs or hips; feeling of heaviness or tightness in your leg muscles; burning or aching pain in your feet or toes while resting; numbness, tingling, or weakness in your legs; cold feeling or color changes in one or both legs or feet
increased blood pressure including a sudden severe increase even if you have no history of high blood pressure
medication overuse headaches from using migraine medicine for 10 or more days each month. If your headaches get worse, call your provider.
serotonin syndrome, a rare but serious problem that can happen in people using Zembrace, especially when used with anti-depressant medicines called SSRIs or SNRIs. Call your provider right away if you have: mental changes such as seeing things that are not there (hallucinations), agitation, or coma; fast heartbeat; changes in blood pressure; high body temperature; tight muscles; or trouble walking.
hives (itchy bumps); swelling of your tongue, mouth, or throat
seizures even in people who have never had seizures before
The most common side effects of Zembrace include: pain and redness at injection site; tingling or numbness in your fingers or toes; dizziness; warm, hot, burning feeling to your face (flushing); discomfort or stiffness in your neck; feeling weak, drowsy, or tired.
Tell your provider if you have any side effect that bothers you or does not go away. These are not all the possible side effects of Zembrace. For more information, ask your provider.
This is the most important information to know about Zembrace but is not comprehensive. For more information, talk to your provider and read the Patient Information and Instructions for Use. You can also visit www.upsher-smith.com or call 1-888-650-3789.
You are encouraged to report adverse effects of prescription drugs to the FDA. Visit www.fda.gov/medwatch, or call 1-800-FDA-1088.
INDICATION AND USAGE
Zembrace is a prescription medicine used to treat acute migraine headaches with or without aura in adults who have been diagnosed with migraine.
Zembrace is not used to prevent migraines. It is not known if it is safe and effective in children under 18 years of age.
Tosymra can cause serious side effects, including heart attack and other heart problems, which may lead to death. Stop Tosymra and get emergency medical help if you have any signs of heart attack:
discomfort in the center of your chest that lasts for more than a few minutes or goes away and comes back
severe tightness, pain, pressure, or heaviness in your chest, throat, neck, or jaw
pain or discomfort in your arms, back, neck, jaw, or stomach
shortness of breath with or without chest discomfort
breaking out in a cold sweat
nausea or vomiting
feeling lightheaded
Tosymra is not for people with risk factors for heart disease (high blood pressure or cholesterol, smoking, overweight, diabetes, family history of heart disease) unless a heart exam is done and shows no problem.
Do not use Tosymra if you have:
history of heart problems
narrowing of blood vessels to your legs, arms, stomach, or kidney (peripheral vascular disease)
uncontrolled high blood pressure
severe liver problems
hemiplegic or basilar migraines. If you are not sure if you have these, ask your healthcare provider.
had a stroke, transient ischemic attacks (TIAs), or problems with blood circulation
taken any of the following medicines in the last 24 hours: almotriptan, eletriptan, frovatriptan, naratriptan, rizatriptan, ergotamines, or dihydroergotamine. Ask your provider if you are not sure if your medicine is listed above.
are taking certain antidepressants, known as monoamine oxidase (MAO)-A inhibitors or it has been 2 weeks or less since you stopped taking a MAO-A inhibitor. Ask your provider for a list of these medicines if you are not sure.
an allergy to sumatriptan or any ingredient in Tosymra
Tell your provider about all of your medical conditions and medicines you take, including vitamins and supplements.
Tosymra can cause dizziness, weakness, or drowsiness. If so, do not drive a car, use machinery, or do anything where you need to be alert.
Tosymra may cause serious side effects including:
changes in color or sensation in your fingers and toes
sudden or severe stomach pain, stomach pain after meals, weight loss, nausea or vomiting, constipation or diarrhea, bloody diarrhea, fever
cramping and pain in your legs or hips, feeling of heaviness or tightness in your leg muscles, burning or aching pain in your feet or toes while resting, numbness, tingling, or weakness in your legs, cold feeling or color changes in one or both legs or feet
increased blood pressure including a sudden severe increase even if you have no history of high blood pressure
medication overuse headaches from using migraine medicine for 10 or more days each month. If your headaches get worse, call your provider.
serotonin syndrome, a rare but serious problem that can happen in people using Tosymra, especially when used with anti-depressant medicines called SSRIs or SNRIs. Call your provider right away if you have: mental changes such as seeing things that are not there (hallucinations), agitation, or coma; fast heartbeat; changes in blood pressure; high body temperature; tight muscles; or trouble walking.
hives (itchy bumps); swelling of your tongue, mouth, or throat
seizures even in people who have never had seizures before
The most common side effects of Tosymra include: tingling, dizziness, feeling warm or hot, burning feeling, feeling of heaviness, feeling of pressure, flushing, feeling of tightness, numbness, application site (nasal) reactions, abnormal taste, and throat irritation.
Tell your provider if you have any side effect that bothers you or does not go away. These are not all the possible side effects of Tosymra. For more information, ask your provider.
This is the most important information to know about Tosymra but is not comprehensive. For more information, talk to your provider and read the Patient Information and Instructions for Use. You can also visit www.upsher-smith.com or call 1-888-650-3789.
You are encouraged to report negative side effects of prescription drugs to the FDA. Visit www.fda.gov/medwatch, or call 1-800-FDA-1088.
INDICATION AND USAGE Tosymra is a prescription medicine used to treat acute migraine headaches with or without aura in adults.
Tosymra is not used to treat other types of headaches such as hemiplegic or basilar migraines or cluster headaches.
Tosymra is not used to prevent migraines. It is not known if Tosymra is safe and effective in children under 18 years of age.
GeoVax Labs, Inc., a clinical-stage biotechnology company, develops human vaccines for infectious diseases and cancer in the United States and internationally. The company through its patented Modified Vaccinia Ankara-Virus Like Particle vaccine platform develops various vaccines. It is developing various vaccines that are in human clinical trials, and preclinical research and development phases, including vaccines against human immunodeficiency virus (HIV); Zika virus; malaria; and hemorrhagic fever viruses, such as Ebola, Sudan, Marburg, and Lassa, as well as therapeutic vaccines for chronic Hepatitis B infections and cancers. The company has collaboration and partnership agreements with the National Institute of Allergy and Infectious Diseases of the National Institutes of Health; the HIV Vaccines Trial Network; Centers for Disease Control and Prevention; United States Army Research Institute of Infectious Disease; U.S. Naval Research Laboratory; Emory University; University of Pittsburgh; Georgia State University Research Foundation; Peking University; University of Texas Medical Branch; the Institute of Human Virology at the University of Maryland; the Scripps Research Institute; the Burnet Institute; American Gene Technologies, Inc.; Viamune, Inc.; Vaxeal Holding SA; CaroGen Corporation; Virometix AG; and Leidos, Inc. GeoVax Labs, Inc. was founded in 2001 and is based in Smyrna, Georgia.
Robert LeBoyer, Senior Vice President, Equity Research Analyst, Biotechnology, Noble Capital Markets, Inc.
Refer to the full report for the price target, fundamental analysis, and rating.
Patent Issuance Covers The GeoVax Ebolavirus. GeoVax announced the issuance of a US patent covering its ebolavirus vaccine made using its VLP (virus-like particle) technology. The vaccine uses an MVA viral vector to deliver genes to elicit an immune response against the virus. The patent claims cover multiple ebolavirus strains including Sudan ebolavirus, Zaire ebolavirus, Taï Forest ebolavirus, and Reston ebolavirus. We see this issuance as both a commercial and scientific milestone for GeoVax.
MVA-VLP Is A Novel Vaccine Technology Platform. The GeoVax MVA-VLP is a novel vaccine platform that delivers genes to produce VLPs within a person’s cells. After vaccination, the genes express the viral proteins which then assemble into VLPs. These VLPs are similar enough to the virus to be recognized and elicit immune protection but are not infectious or capable of replicating in the body. Preclinical studies have shown immune responses that are similar to live-attenuated virus vaccines, with both strong humoral and cellular immunity as well as greater safety from the MVA vector.
Equity Research is available at no cost to Registered users of Channelchek. Not a Member? Click ‘Join’ to join the Channelchek Community. There is no cost to register, and we never collect credit card information.
This Company Sponsored Research is provided by Noble Capital Markets, Inc., a FINRA and S.E.C. registered broker-dealer (B/D).
*Analyst certification and important disclosures included in the full report. NOTE: investment decisions should not be based upon the content of this research summary. Proper due diligence is required before making any investment decision.
Eagle Bulk Shipping Inc. (“Eagle”) is a US-based drybulk owner-operator focused on the Supramax/Ultramax mid-size asset class, which ranges from 50,000 and 65,000 deadweight tons in size; these vessels are equipped with onboard cranes allowing for the self-loading and unloading of cargoes, a feature which distinguishes them from the larger classes of drybulk vessels and provides for greatly enhanced flexibility and versatility- both with respect to cargo diversity and port accessibility. The Company transports a broad range of major and minor bulk cargoes around the world, including coal, grain, ore, pet coke, cement, and fertilizer. Eagle operates out of three offices, Stamford (headquarters), Singapore, and Hamburg, and performs all aspects of vessel management in-house including: commercial, operational, technical, and strategic.
Michael Heim, Senior Vice President, Equity Research Analyst, Energy & Transportation, Noble Capital Markets, Inc.
Refer to the full report for the price target, fundamental analysis, and rating.
Estimates adjusted downward to reflect shipping weakness. We are lowering our assumed shipping rates in response to shipping rate declines and company guidance. Although EGLE had locked in 65% of its available shipping days at a rate near $16,000/day, the rate it received for the other shipping days was closer to $10,000/day. As a result, the average TCE day rate for the fleet of 52.8 vessels was closer to $14,000/day.
Lower shipping rates and thus revenues are partially offset by lower vessel operating costs. Operating expense is running between $6,300-$6,600 per shipping day, a decline from the first quarter. The lower costs lessen the impact of lower revenues in our models.
Equity Research is available at no cost to Registered users of Channelchek. Not a Member? Click ‘Join’ to join the Channelchek Community. There is no cost to register, and we never collect credit card information.
This Research is provided by Noble Capital Markets, Inc., a FINRA and S.E.C. registered broker-dealer (B/D).
*Analyst certification and important disclosures included in the full report. NOTE: investment decisions should not be based upon the content of this research summary. Proper due diligence is required before making any investment decision.
Michael Kupinski, Director of Research, Noble Capital Markets, Inc.
Jacob Mutchler, Research Associate, Noble Capital Markets, Inc.
Refer to the bottom of the report for important disclosures
Overview: Is The Recession Here? Economic activity is slowing, taking pressure off of inflation. But, the Fed seems intent on pushing interest rates higher, likely through the balance of this year. As such, recent economic forecasts anticipate GDP to contract over the next few quarters. This does not paint a favorable picture for advertising in the very near term. But, given the increased likelihood of a recession, has timeliness in media stocks improved?
Digital Media & Technology:A broad based recovery? For the second quarter in a row, the best performing index was Noble’s Social Media Index, which increased by 34% in 2Q 2023, followed by Noble’s Ad Tech Index (+24%), MarTech Index (+18%), Digital Media Index (+16%), and Video Gaming Index (+5%). The largest stocks carried the performance in each of the indices. Can the stocks hold on to recent gains?
Broadcast Television: Are ad trends really improving? Recent reports indicate that television advertising is showing some improvement. While it is likely that Auto and Political advertising are bright spots, we remain skeptical that core advertising pacings are improving in the third quarter given the weak economic outlook. Nonetheless, the TV stocks appear to be cheap and we highlight a few of our key favorites.
Broadcast Radio:The pall over radio. Soft advertising trends heading into an economic downturn does not bode well for companies, like Audacy, that are in the midst of a financial restructuring. We believe that high debt leverage is the pall over the stocks. It is likely that many radio companies will go through a round of cost cutting to shore up cash flow in the midst of an economic downturn.
Publishing: Cash flow gurus. We do not believe that the Publishing industry will be spared from the weak advertising environment. The industry has a playbook for cutting costs, however, and has a history of maintaining cash flow through difficult times.
Overview
The Recession Is Here
Figure #1 YoY Real GDP Growth illustrates that the economy grew post pandemic through the first quarter 2023, reflecting a rebounding economy, fueled by government spending. But, economic activity is slowing, taking pressure off of inflation. Nonetheless, the Fed seems intent on pushing interest rates higher, likely through the balance of this year. Most economists anticipate that the Fed will raise interest rates by 25 basis points two times in the second half of this year. Not only will the interest rate increases be a headwind for the economy, but government spending, a key driver to the economy this year, is likely to wane. Recent economic forecasts anticipate GDP to contract over the next few quarters, a classic definition of an economic recession. The Conference Board of Economic Forecasts anticipate that the US economy will contract -1.2% in Q3 2023, -1.9% in Q4 2023, and -1.1% in Q1 2024.
This does not paint a favorable picture for advertising in the very near term. Advertising is highly correlated to personal disposable income, particularly discretionary income. If consumers have discretionary income, companies advertise for them to spend. As Figure #2 YoY Real Disposable Income Growth highlights, disposable income has declined over the past 18 months. Not surprisingly, economically sensitive National advertising has been down nearly 4 quarters and at high double digit rates. Given the significant declines, as much as 25% in each quarter for the past year, National advertising trends should moderate, given that the comps get easier. As such, even with an economic downturn becoming more visible, it is possible that National advertising declines may moderate.
National advertisers tend to spend when there is light toward the end of an economic recession, when consumer personal disposable income shows signs that it will improve and consumers have the propensity to spend. In our view, that light at the end of the tunnel is still pretty dim given the economic forecast that anticipates a decline in GDP through the Q1 2024. While the visibility of an improvement in National advertising seems to have improved as we enter an economic downturn, especially given the easing comps and the benefit from Political advertising (expected to begin in Q3 2023), we think that it is too early to be optimistic. The length and severity of an economic downturn is not yet visible.
What does this mean for the stock market and for media stocks? Figure #3 Federal Funds Rate Vs. S&P 500 performance illustrates the recent increases in Fed Funds rates had little effect on the general stock market as measured by the S&P 500 Index. Unfortunately, late cycle and economically sensitive media companies declined or under performed the stock market. In spite of Fed Fund rate increases over the past year, the S&P 500 Index increased 18% in the last 12 months. The anticipation of an economic recession, however, weighed on media stocks. The stock performance of the various media sectors that we follow are discussed in this report, but have generally under performed the market. The exception to the poor performance were the Internet and Digital Media stocks, which had a broad based recovery. Is it possible that early cycle media stocks will outperform the general market in the near term? In our view, yes. But, this may mean that the general market may decline as media stocks decline less. Historically, it has been the case to buy media stocks in the midst of a recession as media stocks strongly outperform the general market in a economic recovery. But given the likely disappointment in revenue in the coming quarters, it is likely that media stocks will be volatile as investors weigh the near term revenue and earnings disappointments to the prospect of a revenue rebound in an improved economic scenario. This would suggest that if one would try to time the stocks, investors may want to wait a quarter or two, buy on the improved momentum. This may mean that one might miss the large gains. As such, for long term investors, we believe that we are nearer to the bottom and that the downside appears relatively limited, valuations appear compelling. But, given the anticipate volatility in the near term, media investors should look for opportunistic purchases and accumulate positions in our favorite media names highlighted in this report.
Figure #1 YoY Real GDP Growth
Source: Federal Reserve Bank of St. Louis
Figure #2 YoY Real Disposable Income Growth
Source: Federal Reserve Bank of St. Louis
Figure #3 Federal Funds Rate Vs. S&P 500 performance
Source: Federal Reserve Bank of St. Louis & Yahoo Finance
Digital Media & Technology
A Broad-Based Recovery in Shares
The Internet and Digital Media sectors rebounded nicely over the last 12 months (LTM). As Figure #4 LTM Internet & Digital Technology Performance illustrates, the Video Gaming index was the only sector that underperformed the S&P 500 over the last year. The S&P 500 Index was up 17.6% over the LTM, outperforming the Video gaming index’s increase of 9.7% and in line with Noble’s Digital Media Index increase of 18%. The MarTech Index and AdTech Index both performed strongly, increasing 35.8% and 39.8%, respectively. The Social Media index had the strongest performance of the indices, increasing an impressive 80.2% over the LTM.
Figure #4 LTM Internet & Digital Technology Performance
Source: Capital IQ
Despite macroeconomic headwinds that include higher interest rates, a regional banking crisis, elevated inflation and a war in Europe, the S&P 500 powered higher for the third quarter in a row. The S&P 500 Index continued its streak of steady increases, with an 8% increase in the Index in 2Q 2023, which followed a 7% increase in 1Q 2023 and a 7% increase in 4Q 2022. The broad index is up a healthy 24% since the end of the third quarter of 2022. The S&P 500 bottomed on October 12, 2022, and is up 26% from that date through mid-July.
The S&P 500’s performance was driven primarily by its largest constituents. As a market weighted index, the largest stocks have an outsized impact on its performance, and that was certainly the case in 2Q. Eight of the largest stocks in the S&P 500 Index were up in 2Q 2023 by 2x-3x or more than the Index’s 8% gain. Stocks that powered the Index higher included Nvidia (NVDA, +52%), Meta Platforms (a.k.a Facebook, META, +35%), Netflix (NFLX, +28%), Amazon (AMZN, +26%), Tesla (TSLA, +26%), Microsoft (MSFT, +18%), Apple (AAPL, +18%) and Google (GOOGL, +15%).
Noble’s Internet and Digital Media Indices, which are also market cap weighted, also powered higher thanks to the biggest constituents in their respective Indices. Each of these Indices posted double digital percent increases, with only the exception being Noble’s Video Gaming Index (+5%), which slightly underperformed the broader market/S&P Index. For the second quarter in a row, the best performing index was Noble’s Social Media Index, which increased by 34% in 2Q 2023, followed by Noble’s Ad Tech Index (+24%), MarTech Index (+18%), Digital Media Index (+16%), and Video Gaming Index (+5%).
Meta Powers the Social Media Index Higher
We attribute the strength of the Social Media Index to its largest constituent, Meta Platforms, whose shares increased by 35% in the second quarter. We noted last quarter that Meta appeared to be returning to its roots and focusing on profitability, rather than its nascent and riskier web3 initiatives. That return to its core strengths has been greatly rewarded by investors. Shares of Meta were up 225% from its 52-week low of $88.09 per share in early November through the end of June. Shares are up another 8% since the start of the third quarter with the launch of Threads, Meta’s answer to Twitter. Over 100 million people signed up for Threads within the first five days of its rollout. Meta has not yet begun to monetize this opportunity, but it will clearly add to its growth in coming quarters.
Ad Tech Stocks Embark on a Broad-Based Recovery Following a Difficult 2022
Noble’s AdTech Index increased by 24% in 2Q 2023, and this performance was very broad based, with 15 of the 24 stocks in the sector up, and a dozen of the stocks up by double digits. Ad Tech stocks that performed best during the quarter include Applovin (APP, +63%), Magnite (MGNI, +47%), Tremor International (TRMR, +37%), Pubmatic (PUBM, +32%), Double Verify (DV, +29%), The Trade Desk (+27%), and Integral Ad Science (IAS, +26%). Ad Tech stocks were the worst performing sector in our universe in 2022, with the index down 63% for the year in 2022. The strong performance in 2Q 2023 in many respects reflects a bounce back off multi-year lows for several stocks. Year-to-date, one standout in particular is Integral Ad Science, whose shares were up 104% in the first half of 2023.The company continues to expand its product suite, scale its social media offerings (i.e., for TikTok) and is well positioned to continue to benefit from the shift from linear TV to connected TV (CTV). The company is benefiting from new partnerships with YouTube and Netflix and shares likely benefited during the quarter from anticipation of the company’s mid-June analyst day presentation.
Noble’s MarTech Index was up 18%, with performance within the group also broad based. The Digital Media & Technology indices market-cap weighted performances in 2Q are illustrated in Figure #5 2Q Internet & Digital Technology Performance. Thirteen of the 20 stocks in the Index were up in the quarter. MarTech stocks that performed best during the quarter include Cardlytics (CDLX, +86%), Shopify (SHOP, +35%), Live Ramp (RAMP, +30%), Adobe (ADBE, +27%), and Hubspot (NUBS, +24%). One of the poor performers in the group was one of our closely followed stocks, Harte Hanks, which declined 42% in the latest quarter. The stock gave back nearly all of its 54% gains in the prior year. The weakness was due to a disappointing quarterly revenue outlook as the company indicated that it is seeing economic headwinds and more difficult second half comparables. Notably, the company has significant levers to maintain much of its favorable cash flow outlook and is well positioned for growth as those headwinds diminish. We believe that downside risk in the HHS shares appear limited and view the shares as among our favorite rebound plays. Overall, MarTech stocks were victims of their own success: the group traded at double digit revenue multiples in 2021, but the sector’s revenue multiples were more than halved in 2022. The group currently trades at 5.9x 2023E revenues, up from 4.1x 2023E revenues at the end of the first quarter, and 3.5x 2023E revenues at the start of the year. Current trading multiples are illustrated in Figure #7 MarTech Comparables.
Finally, the Digital Media Index was up 16% in 2Q 2023, and here again, the performance was broad based with 8 of the 12 stocks in the Index posting gains. Digital Media stocks that performed best during the quarter include Fubo TV (FUBO, +72%), Travelzoo (TZOO, +31%), Netflix (NFLX, +28%), Interactive Corp (IAC, +22%), and Spotify (SPOT, +20%). Year-to-date, the two best performing Digital Media stocks are Spotfiy (+103% YTD), which has shifted its priority to running a profitable company and took additional steps in 2Q to achieve it, for instance, by consolidating and streamlining several of its podcast company acquisitions from recent years. The second best performing Digital Media stock through the first half of the year was Travelzoo (TZOO), whose shares were up 77% in the first half of the year. The company continues to benefit from pent up demand that helped a surge in travel as the pandemic ebbed. Lodging and domestic travel demand rebounded first, but Travelzoo appears to be benefiting from cruises and international travel, where pent up demand took longer to recover. Management indicated that travel related advertising may increase as economic headwinds adversely affect hotel and air travel occupancy, forcing these travel businesses to offer discounts. We rate the TZOO shares as Outperform.
Figure #5 2Q Internet & Digital Technology Performance
Source: Capital IQ
Figure #6 AdTech Comparables
Source: Company filings & Eikon
Figure #7 MarTech Comparables
Source: Noble estimates & Eikon
Traditional Media
Traditional media stocks largely underperformed the general market over the LTM, the Radio sector was the hardest hit. As Figure #8 LTM Traditional Media Performance illustrates, the Noble Radio Index decreased 37.7% over the LTM, compared with the general market increasing 17.6%, as measured by the S&P 500 over the same period. The Television Index was down 14.8% and the Publishing index outperformed the general market, increasing 28.4% over the LTM. Notably, there were company stock performance disparities within each sector, highlighted later in this report. Given the indices are market cap weighted, larger market capitalized companies skewed the indices’ performance.
The traditional media industry is still finding its footing in the difficult economic environment, given the indices performance in Q2. While the Newspaper and Radio indices performed better in Q2 than Q1, the TV Index did not. The general market, as measured by the S&P 500, increased 8.3% over the last quarter and outperformed all but one traditional media sector. The Newspaper Index, which increased 8.5% over the same period narrowly outperformed the general market. The TV Index was the hardest hit traditional media sector and decreased -11.1%. While the Radio index underperformed the market in Q2, it improved upon a difficult Q1 and increased 3.1%, as illustrated in Figure #9 Q2 Traditional media performance.
Figure #8 LTM Traditional Media Performance
Source: Capital IQ
Figure #9 Q2 Traditional Stock Performance
Source: Capital IQ
Broadcast Television
Are ad trends really improving?
The TV Index underperformed the general market in the second quarter. While none of the stocks in the TV Index increased in the second quarter, many performed better than the market cap weighted return of -11.1%. Fox Corporation (FOXA; down 0.1%), E.W Scripps (SSP; down 2.8%), Nexstar (NXST; down 3.5%) and Gray Television (GTN; down 9.6%) were among the best performing stocks in the hard-hit TV index. The stocks hit the hardest in Q2 were Sinclair Broadcast Group (SBGI; down 19.5%) and Entravision (EVC; down 27.4%). Given the recent turmoil in TV stock performances we view the depressed prices as a potential opportunity given the prospect of an advertising recovery over the next few quarters.
While there have been some recent reports indicating that television advertising is improving, possibly related to increased political advertising and Auto advertising in the third quarter, we remain skeptical that the improvement is sustainable given the prospect of a weakening economy. Nonetheless, the TV stocks appear cheap. One of our favorites in the index is Entravision (EVC) which is among the industry leaders in revenue growth as illustrated in Figure #10 TV Q1 YoY Revenue Growth. While the EVC shares had a poor performance in Q2, down 27.4%, the shares had increased 26% in Q1. Entravision’s revenue growth is the product of a robust digital business that comprises approximately 80% of total revenue. We believe that the recent under performance is related to Meta’s (Facebook’s) announcement that it plans to implement efficiencies, implying that it may take margin away from some of its advertising agencies, like Entravision, which represents Facebook in Latin America. In our view, Entravision is in a strong position to push back on that prospect given its favorable business relationship with the company. Given the influx of lower margin digital revenues, Entravision’s EBITDA margin is much lower than industry peers, illustrated in Figure #11 TV Industry Q1 EBITDA Margin. But, importantly, the company has one of the better revenue and cash flow growth profiles.
Figure #12 TV Company Comparablesillustrates the trading levels of the companies in the index. Some of our favorites Entravision (EVC) and E.W Scripps (SSP) trade at multiples well below the industry peer group highs. While E.W Scripps had modest year over year revenue decline, we believe it will benefit from favorable Retransmission revenue, strong Political advertising and improved margins in 2024. Given the SSP shares low float, the shares tend to underperform when industry is out of favor and outperform when the industry is back in favor. As for Entravision, we view the company’s digital transformation favorably and, notably, the shares are trading at a modest 3.9 times Enterprise Value to our 2024 Adj. EBITDA estimate. In our view, there appearas to be limited downside risk. The EVC shares and SSP shares, in our view, both offer a favorable risk reward relationship.
Figure #10 TV Q1 YoY Revenue Growth
Source: Company filings
Figure #11 TV Industry Q1 EBITDA Margin
Source: Company filings & Eikon
Figure #12 TV Company Comparables
Source: Noble Estimates & Eikon
Broadcast Radio
While the Radio Index underperformed the S&P 500 in Q2, it was an improvement from a difficult Q1. Notably, there were a few strong performances in the market cap weighted index. Beasley Broadcast Group (BBGI, up 24.4%) , Cumulus Media (CMLS, up 11.1%) and Townsquare (TSQ, up 48.9%) all strongly outperformed the S&P 500 in Q2. The largest stocks in the group did not perform well in the quarter skewing the index lower, Audacy (AUD, up 2.6%) and iHeart Media (IHRT, down 6.7%). The second quarter stock performances were a mixed bag and largely did not reflect the first quarter operating results. As Figure #13 Radio Q1 YoY Revenue Growth illustrates, most companies had modest revenue growth. The larger Radio companies that rely more on National advertising had the greatest declines of YoY revenue. With CMLS being the exception, the larger Radio companies underperformed relative to Radio companies with a stronger digital and highly localized presence. Figure #14 Radio Industry Q1 EBITDA Margin Margins illustrate that the margins for the industry remain relatively healthy.
Some of our favorite Radio stocks have strong digital businesses and highly localized footprints, which provides some shelter from weakness in national advertising. Those stocks included Townsquare, Beasley Broadcast Group, Salem Media (SALM; down 12.1%) and Saga Communications (SGA, down 3.9%). While the shares of Saga Communications (SGA) were down 3.9%, the performance did not reflect its favorable first quarter operating results. Importantly, Saga grew revenues a modest 1.3% and had an above average Q1 EBITDA margin of 9.6%. Saga has a highly localized footprint, as approximately 90% of revenues come from local sources. Furthermore, the company has been placing more importance on growing a profitable digital business in recent years. While Saga’s Digital business is early in its development, management is focused on growing digital revenues from 7.5% of total revenue in Q1 to 20% of total revenue over the next couple years. Additionally, we believe the company is likely to maintain a strong cash position given the economic uncertainty.
We view Townsquare Media (TSQ), Salem Media (SALM), Beasley Broadcast (BBGI) and Saga Communications (SGA) as among our favorites in the industry given the diverse revenue streams and localized footprints. While these companies are not immune to the economic headwinds, we believe that its Digital businesses and local footprints should offer some ballast to its more sensitive Radio business. Beasley’s recent digital revenue growth has been robust, digital revenue was 17% of total revenue in Q1 and is expected to reach 20% to 30% of total revenue for full year 2023. In the case of Salem, 30% of its revenues are from reliable block programming.
We believe that Radio advertising pacings likely will be problematic in the second half given the economic headwinds. Unlike Television, the industry does not benefit as much from Political advertising. As such, we expect that advertising pacings likely will be lower in Q3 than the Q2 results. It is likely that many radio companies, especially those with higher debt leverage, will implement cost cutting measures. With many of the radio companies already relatively lean from the Pandemic, it is likely that such measures will be difficult.
As Figure #15 Radio Company Comparables illustrates, the shares of Townsquare and Saga are among the cheapest in the industry, trading below peer group averages. Notably, Townsquare implemented a hefty dividend in Q1, providing the unique opportunity to get a return of capital while waiting for a turn toward more favorable fundamentals. As such, the shares of TSQ tops our list of favorites. We also view the shares of Saga as among our favorites. The company is early in its transition toward digital and has a lot of headroom for enhanced revenue growth.
Figure #13 Radio Q1 YoY Revenue Growth
Source: Company filings
Figure #14 Radio Industry Q1 EBITDA Margin
Source: Company filings & Eikon
Figure #15 Radio Company Comparables
Source: Noble estimates & Eikon
Publishing
The Publishing industry is no exception to the advertising weakness that is impacting the broader Media landscape. As such, revenues are likely to continue to decline, despite an already weak performance in the first quarter of the year. Figure #16 Publishing Q1 YoY Revenue Growth illustrates the predominantly negative trends in the industry in the most recently reported quarter. The advertising challenges are hitting the traditional Print side of the publishing business hardest. For example, Lee Enterprises (LEE), one of our favorites in the industry, reported a 10% Print advertising revenue decline for the quarter ended March 31st, while Digital advertising grew a modest 2%. The company’s adj. EBITDA generation fell 15% compared with a more moderate 2% drop in total company revenues.
Not surprisingly, the dampened industry revenue resulted in lower industry cash flow generation with EBITDA margins averaging in the 10% range, as illustrated in Figure #17 Publishing Industry Q1 EBITDA Margins. Yet despite the constraints on cash flow generation on Lee and the other Publishers, we believe the companies have the ability to cut costs to help offset the pressure on cash flow generation. In particular, companies could cut costs in their Print manufacturing and distribution operations, reducing overhead in the same business segments where revenues are expected to lag. Publishing companies have a playbook on cutting legacy print costs and have the ability to maintain cash flow. However, cost cuts can take time to go into full effect, which could result in poor cash flow performance over the next quarter or so.
In spite of the nearer term economic headwinds impacting the operating performance of the industry, we believe that the industry is near an inflection point towards revenue growth. This dynamic is related to the degree of the recovery in its digital media businesses, a key driver to the industry’s overall revenue performance. While there are secular challenges to the industry’s print business, digital revenues account for an increasing portion of total revenues. For companies like Lee Enterprises, digital accounts for over 38% of total revenues in the most recent quarter. In our view, publishing companies will be a player in the advertising recovery as economic prospects improve. Furthermore, we believe that stock valuations are compelling.
Figure #18 Publishing Company Comparables illustrates the Publishing companies trading levels. Notably, the New York Times (NYT) trades well above the levels of the rest of its peers. In comparison, Lee and Gannett appear to be compelling. However, both Lee and Gannett are highly levered. Yet, in our view, Lee’s debt profile has several favorable characteristics, such as a fixed 9% annual rate, no fixed principal payments, no performance covenants and a 25 year maturity. Given that the LEE shares trade near 5.3 times enterprise value to our 2024 adj. EBITDA forecast, we believe the shares offer limited downside risk. With a favorable Digital transformation of the business well underway, we believe the LEE shares could close the valuation gap with some of its higher trading peers. As such, the LEE shares represent one of our favorites in the industry, especially as the economic downturn bottoms out and the prospect for a recovery begins to come to the forefront. As such, the LEE shares are among our favorite recovery plays.
Figure #16 Publishing Q1 YoY Revenue Growth
Source: Company filings & Eikon
Figure #17 Publishing Industry Q1 EBITDA Margins
Source: Company filings & Eikon
Figure # 18 Publishing Company Comparables
Source: Noble estimates & Eikon
The following companies are highlighted in this report. Click on the links for additional information and disclosures.
All statements or opinions contained herein that include the words “we”, “us”, or “our” are solely the responsibility of Noble Capital Markets, Inc.(“Noble”) and do not necessarily reflect statements or opinions expressed by any person or party affiliated with the company mentioned in this report. Any opinions expressed herein are subject to change without notice. All information provided herein is based on public and non-public information believed to be accurate and reliable, but is not necessarily complete and cannot be guaranteed. No judgment is hereby expressed or should be implied as to the suitability of any security described herein for any specific investor or any specific investment portfolio. The decision to undertake any investment regarding the security mentioned herein should be made by each reader of this publication based on its own appraisal of the implications and risks of such decision.
This publication is intended for information purposes only and shall not constitute an offer to buy/sell or the solicitation of an offer to buy/sell any security mentioned in this report, nor shall there be any sale of the security herein in any state or domicile in which said offer, solicitation or sale would be unlawful prior to registration or qualification under the securities laws of any such state or domicile. This publication and all information, comments, statements or opinions contained or expressed herein are applicable only as of the date of this publication and subject to change without prior notice. Past performance is not indicative of future results. Noble accepts no liability for loss arising from the use of the material in this report, except that this exclusion of liability does not apply to the extent that such liability arises under specific statutes or regulations applicable to Noble. This report is not to be relied upon as a substitute for the exercising of independent judgement. Noble may have published, and may in the future publish, other research reports that are inconsistent with, and reach different conclusions from, the information provided in this report. Noble is under no obligation to bring to the attention of any recipient of this report, any past or future reports. Investors should only consider this report as single factor in making an investment decision.
IMPORTANT DISCLOSURES
This publication is confidential for the information of the addressee only and may not be reproduced in whole or in part, copies circulated, or discussed to another party, without the written consent of Noble Capital Markets, Inc. (“Noble”). Noble seeks to update its research as appropriate, but may be unable to do so based upon various regulatory constraints. Research reports are not published at regular intervals; publication times and dates are based upon the analyst’s judgement. Noble professionals including traders, salespeople and investment bankers may provide written or oral market commentary, or discuss trading strategies to Noble clients and the Noble proprietary trading desk that reflect opinions that are contrary to the opinions expressed in this research report. The majority of companies that Noble follows are emerging growth companies. Securities in these companies involve a higher degree of risk and more volatility than the securities of more established companies. The securities discussed in Noble research reports may not be suitable for some investors and as such, investors must take extra care and make their own determination of the appropriateness of an investment based upon risk tolerance, investment objectives and financial status.
Company Specific Disclosures
The following disclosures relate to relationships between Noble and the company (the “Company”) covered by the Noble Research Division and referred to in this research report. Noble is not a market maker in any of the companies mentioned in this report. Noble intends to seek compensation for investment banking services and non-investment banking services (securities and non-securities related) with any or all of the companies mentioned in this report within the next 3 months
ANALYST CREDENTIALS, PROFESSIONAL DESIGNATIONS, AND EXPERIENCE
Senior Equity Analyst focusing on Basic Materials & Mining. 20 years of experience in equity research. BA in Business Administration from Westminster College. MBA with a Finance concentration from the University of Missouri. MA in International Affairs from Washington University in St. Louis. Named WSJ ‘Best on the Street’ Analyst and Forbes/StarMine’s “Best Brokerage Analyst.” FINRA licenses 7, 24, 63, 87
WARNING
This report is intended to provide general securities advice, and does not purport to make any recommendation that any securities transaction is appropriate for any recipient particular investment objectives, financial situation or particular needs. Prior to making any investment decision, recipients should assess, or seek advice from their advisors, on whether any relevant part of this report is appropriate to their individual circumstances. If a recipient was referred to Noble Capital Markets, Inc. by an investment advisor, that advisor may receive a benefit in respect of transactions effected on the recipients behalf, details of which will be available on request in regard to a transaction that involves a personalized securities recommendation. Additional risks associated with the security mentioned in this report that might impede achievement of the target can be found in its initial report issued by Noble Capital Markets, Inc.. This report may not be reproduced, distributed or published for any purpose unless authorized by Noble Capital Markets, Inc..
RESEARCH ANALYST CERTIFICATION
Independence Of View All views expressed in this report accurately reflect my personal views about the subject securities or issuers.
Receipt of Compensation No part of my compensation was, is, or will be directly or indirectly related to any specific recommendations or views expressed in the public appearance and/or research report.
Ownership and Material Conflicts of Interest Neither I nor anybody in my household has a financial interest in the securities of the subject company or any other company mentioned in this report.