Townsquare is a community-focused digital media and digital marketing solutions company with market leading local radio stations, principally focused outside the top 50 markets in the U.S. Our assets include a subscription digital marketing services business, Townsquare Interactive, providing website design, creation and hosting, search engine optimization, social media and online reputation management as well as other digital monthly services for approximately 26,800 SMBs; a robust digital advertising division, Townsquare IGNITE, a powerful combination of a) an owned and operated portfolio of more than 330 local news and entertainment websites and mobile apps along with a network of leading national music and entertainment brands, collecting valuable first party data, and b) a proprietary digital programmatic advertising technology stack with an in-house demand and data management platform; and a portfolio of 321 local terrestrial radio stations in 67 U.S. markets strategically situated outside the Top 50 markets in the United States. Our portfolio includes local media brands such as WYRK.com, WJON.com, and NJ101.5.com and premier national music brands such as XXLmag.com, TasteofCountry.com, UltimateClassicRock.com and Loudwire.com.
Michael Kupinski, Director of Research, Equity Research Analyst, Digital, Media & Technology , Noble Capital Markets, Inc.
Jacob Mutchler, Research Associate, Noble Capital Markets, Inc.
Refer to the full report for the price target, fundamental analysis, and rating.
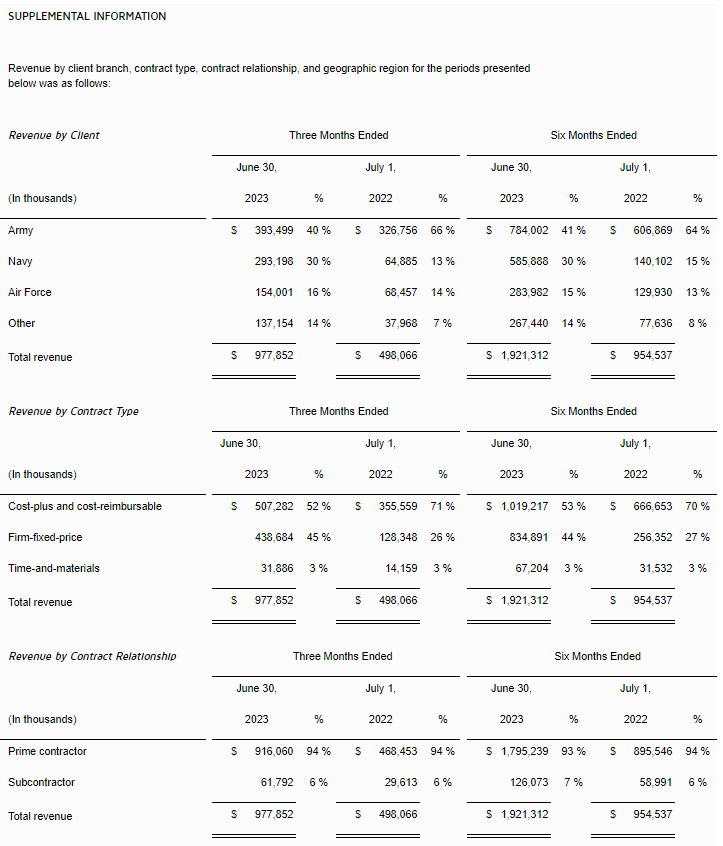
In-line Q2 results. The company reported quarterly revenue of $121.2 million and adj. EBITDA of $28.6 million, both of which were in line with our estimates. The company’s revenue performance, which was roughly flat yoy, was among the best in the industry, on average down 4%.
Favorable digital outlook. Q2digital revenue grew 4% from the prior year period and comprised 52% of total company revenue, more than two times the industry average. Notably, Ignite grew revenue by 11% and its operating profit margin were an impressive 35%.Importantly, we view 2023 as a year of investment for Townsquare Interactive, with revenue and margin growth expected in 2024.
Equity Research is available at no cost to Registered users of Channelchek. Not a Member? Click ‘Join’ to join the Channelchek Community. There is no cost to register, and we never collect credit card information.
This Company Sponsored Research is provided by Noble Capital Markets, Inc., a FINRA and S.E.C. registered broker-dealer (B/D).
*Analyst certification and important disclosures included in the full report. NOTE: investment decisions should not be based upon the content of this research summary. Proper due diligence is required before making any investment decision.
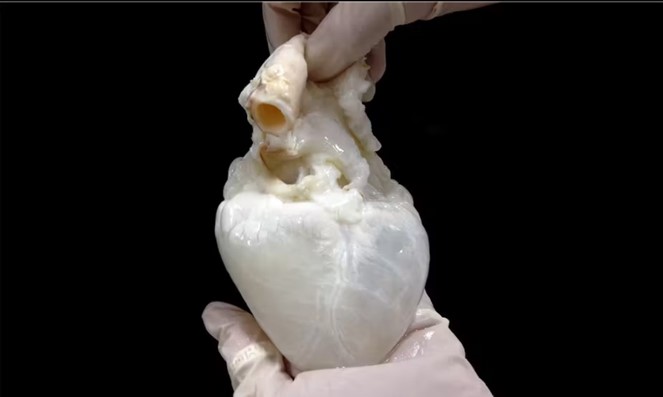
A ‘ghost heart’ is a pig’s heart prepared so that it can be transplanted into people. Provided by Doris Taylor
Combining a Cleaned-Out Pig Heart with a Patient’s Own Stem Cells
Heart disease is the leading cause of death worldwide. The World Health Organization estimates that 17.9 million people lose their lives to it each year, accounting for 32% of global deaths.
Doris Taylor is a scientist working in regenerative medicine and tissue engineering. Her work has focused on creating personalized functioning human hearts in a lab that could rule out the need for donors. Taylor has dubbed these hearts “ghost hearts.” This article was republished with permission from The Conversation, a news site dedicated to sharing ideas from academic experts like Doris Taylor, Regenerative Medicine Lecturer at the University of New Hampshire.
What are the biggest challenges facing organ donations today?
Currently, patients in need of a heart transplant need to join a waitlist, and hearts become available when someone else has died. Because there are not enough hearts to go around, only the very sick are put on the waitlist. The U.S. transplants about 11 hearts a day, and on a given day there are more than 3,000 people waiting for a heart.
Even when organs are successfully transplanted, it isn’t a Hollywood fairy-tale ending. A person receiving an organ transplant essentially trades one disease for other medical complications and diseases. Toxic drugs necessary to prevent rejection can cause high blood pressure diabetes, cancer and kidney failure. These are serious medical issues that also affect people emotionally, financially and physically.
About 18% of people die in the first year after a transplant.
What is the so-called “ghost heart”? How does it work?
The ghost heart is a heart whose cells have been removed. All that remains is the heart framework, or scaffolding. It’s called a ghost heart because removing the cells causes the heart to turn from red to white. A human heart wouldn’t work as a scaffold because so few are available to work with.
So my team and I went with the next best thing: a pig heart. Pig hearts are similar to human hearts in terms of their size and structure. Both have four chambers – two atria and two ventricles – responsible for pumping blood. And structures from pig hearts such as valves have been used in humans safely.
To remove the cells, the pig heart is gently washed through its blood vessels with a mild detergent to remove the cells. This process is called perfusion decellurization. The cell-free heart can then be seeded with new cells – in this case, a patient’s cells – thus forming a personalized heart.
Doris Taylor speaks at the 2023 Imagine Solutions Conference.
What role do stem cells play in creating a heart?
If you lined up the cells needed for an average-size 350-gram human heart, they would stretch for 41,000 miles. Stacked on top of one another, they would amount to 2 billion lines of cells, or enough to fill seven movie screens. But heart cells don’t divide. If they did, hearts could likely repair themselves.
Stem cells, on the other hand, do divide. They can also form into specialized cells – in this case, heart cells. Nobel Prize laureate Dr. Shinya Yamanaka discovered a method to make stem cells out of blood or skin cells from an adult. My team and I employed this method to obtain stem cells, then grew those cells into billions. After that, the team used chemicals to “differentiate” them into heart cells. We employed this method to obtain billions and billions of heart cells.
The first time I saw heart cells beating in a dish it was life-changing. But while the cells are alive and beat, they are not a heart. To be a heart, these cells need to be placed into a form that lets them become a unified organ, to mature and to be able to pump blood. In a human body, this happens during development; we had to reproduce that capacity in the lab.
In 2022, a pig heart that had been genetically engineered to reduce rejection and improve acceptance was transplanted into a human. Why is it better to build a heart from scratch using pig scaffolding instead?
Let me be clear: Any heart is better than no heart. And xenotransplantation – the process by which nonhuman animal organs are transplanted into humans – opened doors for all scientists in this field.
The patient received a pig heart that had been gene-edited. Human genes were added, and some pig genes were removed, but the heart still essentially comprised pig cells within a pig scaffold. As a result, the individual had to take anti-rejection drugs that suppressed the immune system. And, unbeknownst to doctors, the heart was carrying a pig virus that ultimately killed the patient two months following the transplant.
I believe these sorts of problems are avoided with the ghost heart. My team removes the pig cellular material from the scaffold, leaving only the protein structure and blood vessel channels behind. The proteins are so similar to human scaffold proteins they don’t appear to cause rejection.
It Seems Likely that Grandma and Grandpa are Getting a Much Smaller Raise Next Year
In 2023, Social Security recipients received the highest COLA in more than 40 years, 8.7%. At the same time, the entire U.S., including those retired, was impacted by the highest annual inflation in over 40 years. The result is the increased pay impacted recipients differently. Those with a higher percentage of variable costs or expenses, especially where inflation was worst, such as rent, travel, or fuel did not benefit as much, if at all. Those with a greater percentage of fixed costs may have found themselves with more money at the end of each month.
Consumers in the U.S., including Social Security recipients, have not had their purchasing power eroded as much during the first seven months of 2023, as they experienced in 2022. Social Security cost of living adjustments (COLA) are based on a formula that will cause the increase paid next year to rise almost by a third of what it rose at the beginning of 2023.
While not yet official, the new forecast comes after the release of July’s Consumer Price Index (CPI), and is largely based on little change over the next 45 days.
How is a COLA Calculated?
Ignore for a moment the inflation rate percentages you see in the news headlines. The 12-month CPI is calculated by using the set cost of a basket of goods during the month, divided into the cost of the same basket a year earlier. SSA COLA is calculated by the average price of the basket July, August, and September, and dividing it by the average of these months a year earlier. The CPI used in this case is not the CPI-U (all urban consumers) typically reported in the news, but instead, CPI-W (Urban Wage Earners and Clerical Workers). CPI-W is calculated on a monthly basis by the Bureau of Labor Statistics. The most recent release was August 10, 2023.
COLA increases are rounded to the nearest tenth. The adjusted benefit payments are effective as of the first month of the new year.
What to Expect
Social Security recipients could see a 3% bump up next year, based on July’s CPI data, and the current stagnation in the level of inflation. A 3% COLA would raise an average monthly benefit of $1,789 by $53.70 and the maximum benefit by $136.65 per month.
Retired Americans who find Social Security a nice addition to 401(k) or 403(B) investment returns or ample pensions may find themselves with a few extra dollars to take road trips or treat themselves to dining out, or gifts for grandchildren. But investors looking for industries that may benefit from the fatter checks older Americans will receive may find that there is little difference in spending for the majority.
In its recent survey of retirees, the Senior Citizens League found that more than 66% of those that completed its survey have postponed dental care, including major services such as bridges, dentures, and implants. Another 43% said they have delayed optical exams or getting prescription eyeglasses. Almost one-third of survey participants said they have postponed getting medical care or filling prescriptions due to deductibles, out-of-pocket costs, and unexpected bills.
Persistent high prices aren’t the only challenge. Findings from the survey suggest more than one in five Social Security beneficiaries (23%) report they paid tax on a portion of their benefits for the first time this past tax season.
Take Away
When economic numbers are released, they are of interest to a expansive variety of economic stakeholders. This includes investors determining how new statistics will impact corporate earnings, economists deciding how it could impact the Fed’s next move, equity analysts reviewing their industry and companies in the sector, the young couple looking to furnish a new home, and those past their working years that are in general more vulnerable.
The CPI number from July and those that will be reported for August and September will have a noticeable impact on the high percentage of elderly in the U.S. come January 2024.
Q2 Revenue of $42.4 Million; Income from Operations of $5.0 Million; Adjusted EBITDA of $13.8 Million or 33% of revenue
Generated $2.7 Million of Operating Cash Flow
DENVER, Colo., Aug. 9, 2023 /CNW/ – Medicine Man Technologies, Inc., operating as Schwazze, (OTCQX: SHWZ) (NEO: SHWZ) (“Schwazze” or the “Company”), today announced financial and operational results for the second quarter ended June 30, 2023.
Second Quarter 2023 Summary
For the Three Months Ended
$ in Thousands USD
June 30, 2023
March 31, 2023
June 30, 2022
Revenue
$42,375
$40,001
$44,263
Gross Profit
$24,519
$23,033
$25,156
Income from Operations
$4,957
$5,650
$9,036
Adjusted EBITDA1
$13,814
$14,525
$15,021
Operating Cash Flow
$2,683
$(880)
$(13,486)
______________________________
1 Adjusted EBITDA represents earnings before interest, taxes, depreciation, and amortization, adjusted for other income, non-cash share-based compensation, one-time transaction related expenses, or other non-operating costs. The Company uses adjusted EBITDA as it believes it better explains the results of its core business.
Management Commentary
“We continued to execute on our ‘go deep’ retail strategy in the second quarter, demonstrated by our acquisitions of Everest Apothecary in New Mexico in June, as well as Standing Akimbo and Smokey’s in Colorado,” said Nirup Krishnamurthy, CEO of Schwazze. “Although it is early in the integration process and these stores have yet to ramp, in July we began to recognize synergies from bulk purchasing, introducing new product assortment, and leveraging best cultivation practices to improve yields, among other improvements. We expect to realize additional benefits as we further integrate our assets in the months ahead.
“The cannabis market environment in Colorado and New Mexico remains a challenge due to pricing pressure and license proliferation in key markets. However, we are beginning to see early signs of wholesale pricing stabilization in Colorado and are hyper-focused on customer acquisition and experience, while maintaining our brand standards and margin through targeted promotions for customers. Through these efforts, we increased market share in both Colorado and New Mexico, demonstrating the effectiveness of our operating playbook and acquisition strategy, as well as our ability to execute in a competitive environment.
“Looking ahead, we will continue to run a lean operation while implementing the Schwazze retail playbook across our markets to expand our customer base, increase labor and price optimization, and improve customer loyalty and brand penetration. We are well positioned to continue driving strong adjusted EBITDA margins and consistent cash flow generation in 2023.”
Recent Highlights
Completed the acquisition of Everest Apothecary in June, increasing the Company’s New Mexico operations to 32 dispensaries, four cultivation facilities, two manufacturing facilities and over 400 employees statewide.
Appointed Nirup Krishnamurthy as Chief Executive Officer.
Acquired two Colorado retail dispensaries from Smokey’s Cannabis Company.
Acquired Standing Akimbo, the largest medical cannabis dispensary in Colorado, and opened the Company’s first medical dispensary in Colorado Springs under the Standing Akimbo banner.
Ecommerce penetration in New Mexico and Colorado grew approximately 45% and 15%, respectively, compared to the first quarter of 2023 when the program was first launched.
Experienced 17% sequential growth of new customer loyalty members in the second quarter of 2023.
Second Quarter 2023 Financial Results
Total revenue in the second quarter of 2023 was $42.4 million compared to $44.3 million for the same quarter last year. The decrease was primarily due to lower wholesale revenue resulting from a 25% year-over-year decline in wholesale pricing and the proliferation of new licenses in key New Mexico markets, partially offset by growth from new stores compared to the prior year period.
Gross profit for the second quarter of 2023 was $24.5 million or 57.9% of total revenue, compared to $25.2 million or 56.8% of total revenue for the same quarter last year. The increase in gross margin was primarily driven by efficiency gains across retail, cultivation, and production, partially offset by the aforementioned wholesale pricing pressure.
Operating expenses for the second quarter of 2023 were $19.6 million compared to $16.1 million for the same quarter last year. The increase was primarily due to the four-wall SG&A increases associated with 27 additional stores in Colorado and New Mexico that are still ramping, as well as an increase in stock-based compensation. This was partially offset by efficiencies implemented throughout the Company’s operations.
Income from operations for the second quarter of 2023 was $5.0 million compared to $9.0 million in the same quarter last year. Net loss was $6.6 million compared to net income of $33.8 million for the second quarter of 2022, primarily driven by a $35.2 million change in the non-cash accounting revaluation of the derivative liability related to the Company’s convertible note.
Adjusted EBITDA for the second quarter of 2023 was $13.8 million or 32.6% of revenue, compared to $15.0 million or 33.9% of revenue for the same quarter last year. The decrease in adjusted EBITDA margin was primarily driven by lower revenue and higher SG&A associated with new stores that are still ramping, partially offset by improved gross margin.
As of June 30, 2023, cash and cash equivalents were $19.9 million compared to $38.9 million on December 31, 2022, while operating working capital increased by $5.8 million to $10.0 million during this period. Total debt as of June 30, 2023, was $155.4 million compared to $127.8 million on December 31, 2022.
Schwazze CFO Forrest Hoffmaster added, “In addition to our focus on top line growth, supply chain efficiencies and cash generation, we are capitalizing on our hyper-regional retail strategy with a series of cost optimization programs that are improving our cash position and margins. We have begun to see the benefit of these initiatives and expect to drive further improvements in the months ahead.”
Conference Call
The Company will conduct a conference call today, August 9, 2023, at 5:00 p.m. Eastern time to discuss its results for the second quarter ended June 30, 2023.
Schwazze management will host the conference call, followed by a question-and-answer period. Interested parties may submit questions to the Company prior to the call by emailing ir@schwazze.com.
Date: Wednesday, August 9, 2023 Time: 5:00 p.m. Eastern time Toll-free dial-in number: (888) 664-6383 International dial-in number: (416) 764-8650 Conference ID: 70252888 Webcast: SHWZ Q2 2023 Earnings Call
The conference call will also be broadcast live and available for replay on the investor relations section of the Company’s website at https://ir.schwazze.com.
If you have any difficulty registering or connecting with the conference call, please contact Elevate IR at (720) 330-2829.
About Schwazze
Schwazze (OTCQX: SHWZ) (NEO: SHWZ) is building a premier vertically integrated regional cannabis company with assets in Colorado and New Mexico and will continue to take its operating system to other states where it can develop a differentiated regional leadership position. Schwazze is the parent company of a portfolio of leading cannabis businesses and brands spanning seed to sale.
Schwazze is anchored by a high-performance culture that combines customer-centric thinking and data science to test, measure, and drive decisions and outcomes. The Company’s leadership team has deep expertise in retailing, wholesaling, and building consumer brands at Fortune 500 companies as well as in the cannabis sector.
Medicine Man Technologies, Inc. was Schwazze’s former operating trade name. The corporate entity continues to be named Medicine Man Technologies, Inc. Schwazze derives its name from the pruning technique of a cannabis plant to enhance plant structure and promote healthy growth. To learn more about Schwazze, visit www.schwazze.com.
Forward-Looking Statements This press release contains “forward-looking statements.” Such statements may be preceded by the words “may,” “will,” “could,” “would,” “should,” “expect,” “intends,” “plans,” “strategy,” “prospects,” “anticipate,” “believe,” “approximately,” “estimate,” “predict,” “project,” “potential,” “continue,” “ongoing,” or the negative of these terms or other words of similar meaning in connection with a discussion of future events or future operating or financial performance, although the absence of these words does not necessarily mean that a statement is not forward-looking. Forward-looking statements are not guarantees of future events or performance, are based on certain assumptions, and are subject to various known and unknown risks and uncertainties, many of which are beyond the Company’s control and cannot be predicted or quantified. Consequently, actual events and results may differ materially from those expressed or implied by such forward-looking statements. Such risks and uncertainties include, without limitation, risks and uncertainties associated with (i) regulatory limitations on our products and services and the uncertainty in the application of federal, state, and local laws to our business, and any changes in such laws; (ii) our ability to manufacture our products and product candidates on a commercial scale on our own or in collaboration with third parties; (iii) our ability to identify, consummate, and integrate anticipated acquisitions; (iv) general industry and economic conditions; (v) our ability to access adequate capital upon terms and conditions that are acceptable to us; (vi) our ability to pay interest and principal on outstanding debt when due; (vii) volatility in credit and market conditions; (viii) the loss of one or more key executives or other key employees; and (ix) other risks and uncertainties related to the cannabis market and our business strategy. More detailed information about the Company and the risk factors that may affect the realization of forward-looking statements is set forth in the Company’s filings with the Securities and Exchange Commission (SEC), including the Company’s Annual Report on Form 10-K and its Quarterly Reports on Form 10-Q. Investors and security holders are urged to read these documents free of charge on the SEC’s website at http://www.sec.gov. The Company assumes no obligation to publicly update or revise its forward-looking statements as a result of new information, future events or otherwise except as required by law.
MEDICINE MAN TECHNOLOGIES, INC. CONDENSED CONSOLIDATED BALANCE SHEETS For the Periods Ended June 30, 2023 and December 31, 2022 Expressed in U.S. Dollars
June 30,
December 31,
2023
2022
(Unaudited)
(Audited)
ASSETS
Current Assets
Cash & Cash Equivalents
$
19,872,099
$
38,949,253
Accounts Receivable, net of Allowance for Doubtful Accounts
6,179,662
4,471,978
Inventory
33,821,282
22,554,182
Notes Receivable – Current, net
–
11,944
Marketable Securities, net of Unrealized Loss of $1,816 and Loss of $39,270, respectively
456,099
454,283
Prepaid Expenses & Other Current Assets
6,203,056
5,293,393
Total Current Assets
66,532,198
71,735,033
Non-Current Assets
Fixed Assets, net Accumulated Depreciation of $7,007,889 and $4,899,977, respectively
31,128,357
27,089,026
Investments
2,000,000
2,000,000
Goodwill
75,968,130
94,605,301
Intangible Assets, net Accumulated Amortization of $24,981,817 and $16,290,862, respectively
168,892,605
107,726,718
Note Receivable – Non-Current, net
1,313
–
Other Non-Current Assets
1,222,805
1,527,256
Operating Lease Right of Use Assets
23,213,504
18,199,399
Total Non-Current Assets
302,426,714
251,147,700
Total Assets
$
368,958,912
$
322,882,733
LIABILITIES & STOCKHOLDERS’ EQUITY
Current Liabilities
Accounts Payable
$
12,105,250
$
10,701,281
Accounts Payable – Related Party
6,073
22,380
Accrued Expenses
6,398,115
7,462,290
Derivative Liabilities
6,538,485
16,508,253
Lease Liabilities – Current
4,026,595
3,139,289
Current Portion of Long Term Debt
6,583,334
2,250,000
Income Taxes Payable
14,113,477
7,297,815
Total Current Liabilities
49,771,329
47,381,308
Non-Current Liabilities
Long Term Debt, net of Debt Discount & Issuance Costs
148,861,810
125,521,520
Lease Liabilities – Non-Current
22,096,232
17,314,464
Deferred Income Taxes, net
178,031
502,070
Total Non-Current Liabilities
171,136,073
143,338,054
Total Liabilities
$
220,907,402
$
190,719,362
Stockholders’ Equity
Preferred Stock, $0.001 Par Value. 10,000,000 Shares Authorized; 86,994 Shares Issued and
86,994 Shares Outstanding as of June 30, 2023 and 86,994 Shares Issued and 86,994 Shares
Outstanding as of December 31, 2022.
87
87
Common Stock, $0.001 Par Value. 250,000,000 Shares Authorized; 71,730,449 Shares Issued
and 70,590,451 Shares Outstanding as of June 30, 2023 and 56,352,545 Shares Issued and
55,212,547 Shares Outstanding as of December 31, 2022.
71,730
56,353
Additional Paid-In Capital
201,116,605
180,381,641
Accumulated Deficit
(51,103,785)
(46,241,583)
Common Stock Held in Treasury, at Cost, 920,150 Shares Held as of June 30, 2023 and 920,150
Shares Held as of December 31, 2022.
(2,033,127)
(2,033,127)
Total Stockholders’ Equity
148,051,510
132,163,371
Total Liabilities & Stockholders’ Equity
$
368,958,912
$
322,882,733
MEDICINE MAN TECHNOLOGIES, INC. CONDENSED CONSOLIDATED STATEMENTS OF COMPREHENSIVE INCOME AND (LOSS) For the Three and Six Months Ended June 30, 2023 and 2022 Expressed in U.S. Dollars
For the Three Months Ended
For the Six Months Ended
June 30,
June 30,
2023
2022
2023
2022
(Unaudited)
(Unaudited)
(Unaudited)
(Unaudited)
Operating Revenues
Retail
$
38,098,957
$
38,138,799
$
73,919,068
$
64,664,515
Wholesale
4,274,483
6,080,843
8,333,408
11,288,231
Other
1,660
43,750
123,560
88,200
Total Revenue
42,375,100
44,263,392
82,376,036
76,040,946
Total Cost of Goods & Services
17,856,050
19,106,944
34,824,320
39,946,995
Gross Profit
24,519,050
25,156,448
47,551,716
36,093,951
Operating Expenses
Selling, General and Administrative Expenses
8,838,936
6,666,044
19,054,847
13,521,755
Professional Services
487,860
1,516,544
1,675,224
4,101,016
Salaries
7,389,172
7,240,368
13,154,165
12,537,145
Stock Based Compensation
2,845,691
697,842
3,060,235
1,688,925
Total Operating Expenses
19,561,659
16,120,798
36,944,471
31,848,841
Income from Operations
4,957,391
9,035,650
10,607,245
4,245,110
Other Income (Expense)
Interest Expense, net
(7,890,439)
(7,489,205)
(15,636,294)
(14,791,459)
Unrealized Gain (Loss) on Derivative Liabilities
1,468,083
36,705,764
9,969,768
23,288,292
Other Loss
–
–
–
7
Unrealized Gain (Loss) on Investments
–
(5,264)
1,816
(13,813)
Total Other Income (Expense)
(6,422,356)
29,211,295
(5,664,710)
8,483,027
Pre-Tax Net Income (Loss)
(1,464,965)
38,246,945
4,942,535
12,728,137
Provision for Income Taxes
5,142,559
4,405,962
9,804,737
5,665,856
Net Income (Loss)
$
(6,607,524)
$
33,840,983
$
(4,862,202)
$
7,062,281
Less: Accumulated Preferred Stock Dividends for the Period
(2,353,883)
(1,766,575)
(4,383,277)
(3,510,019)
Net Income (Loss) Attributable to Common Stockholders
$
(8,961,407)
$
32,074,408
$
(9,245,479)
$
3,552,262
Earnings (Loss) per Share Attributable to Common Stockholders
Basic Earnings (Loss) per Share
$
(0.15)
$
0.65
$
(0.16)
$
0.07
Diluted Earnings (Loss) per Share
$
(0.15)
$
0.24
$
(0.16)
$
0.03
Weighted Average Number of Shares Outstanding – Basic
60,538,317
49,178,494
57,999,461
49,178,494
Weighted Average Number of Shares Outstanding – Diluted
60,538,317
133,481,667
57,999,461
133,481,667
Comprehensive Income (Loss)
$
(6,607,524)
$
33,840,983
$
(4,862,202)
$
7,062,281
MEDICINE MAN TECHNOLOGIES, INC. CONDENSED CONSOLIDATED STATEMENTS OF CASH FLOWS For the Six Months Ended June 30, 2023 and 2022 Expressed in U.S. Dollars
For the Six Months Ended
June 30,
2023
2022
(Unaudited)
(Unaudited)
Cash Flows from Operating Activities:
Net Income (Loss) for the Period
$
(4,862,202)
$
7,062,281
Adjustments to Reconcile Net Income (Loss) to Cash for Operating Activities
Depreciation & Amortization
10,826,289
1,553,817
Non-Cash Interest Expense
1,992,280
2,165,366
Non-Cash Lease Expense
3,316,171
4,705,059
Deferred Taxes
(324,039)
–
Change in Derivative Liabilities
(9,969,768)
(23,288,292)
Amortization of Debt Issuance Costs
843,025
843,025
Amortization of Debt Discount
4,088,319
3,590,017
(Gain) Loss on Investments, net
(1,816)
13,813
Stock Based Compensation
3,060,235
776,917
Changes in Operating Assets & Liabilities (net of Acquired Amounts):
Accounts Receivable
(923,614)
(1,689,914)
Inventory
(5,937,100)
3,924,172
Prepaid Expenses & Other Current Assets
(909,663)
(5,219,898)
Other Assets
304,451
(185,589)
Change in Operating Lease Liabilities
(2,661,202)
(8,873,051)
Accounts Payable & Other Liabilities
(3,853,458)
5,922,458
Income Taxes Payable
6,815,662
(1,163,770)
Net Cash Provided by (Used in) Operating Activities
1,803,570
(9,863,589)
Cash Flows from Investing Activities:
Collection of Notes Receivable
10,631
–
Cash Consideration for Acquisition of Business, net of Cash Acquired
(15,834,378)
(56,875,923)
Purchase of Fixed Assets
(4,704,093)
(7,076,116)
Purchase of Intangible Assets
–
(2,825)
Net Cash Provided by (Used in) Investing Activities
(20,527,840)
(63,954,864)
Cash Flows from Financing Activities:
Payment on Notes Payable
(750,000)
–
Proceeds from Issuance of Common Stock, net of Issuance Costs
397,116
1,280,660
Net Cash Provided by (Used in) Financing Activities
(352,884)
1,280,660
Net (Decrease) in Cash & Cash Equivalents
(19,077,154)
(72,537,793)
Cash & Cash Equivalents at Beginning of Period
38,949,253
106,400,216
Cash & Cash Equivalents at End of Period
$
19,872,099
$
33,862,423
Supplemental Disclosure of Cash Flow Information:
Cash Paid for Interest
$
10,931,090
$
9,004,575
MEDICINE MAN TECHNOLOGIES, INC. ADJUSTED EBITDA RECONCILIATION (NON-GAAP) For the Three and Six Months Ended June 30, 2023 and 2022 Expressed in U.S. Dollars
For the Three Months Ended
For the Six Months Ended
June 30,
June 30,
2023
2022
2023
2022
Net Income (Loss)
$
(6,607,524)
$
33,840,983
$
(4,862,202)
$
7,062,281
Interest Expense, net
7,890,439
7,489,205
15,636,294
14,791,459
Provision for Income Taxes
5,142,559
4,405,962
9,804,737
5,665,856
Other (Income) Expense, net of Interest Expense
(1,468,083)
(36,700,500)
(9,971,584)
(23,274,486)
Depreciation & Amortization
3,865,190
2,960,603
10,478,004
5,506,627
Earnings Before Interest, Taxes, Depreciation and
Amortization (EBITDA) (non-GAAP)
$
8,822,581
$
11,996,253
$
21,085,249
$
9,751,737
Non-Cash Stock Compensation
2,845,691
697,842
3,060,235
1,688,925
Deal Related Expenses
733,718
1,656,529
1,929,520
3,913,463
Capital Raise Related Expenses
–
41,312
35,068
605,632
Inventory Adjustment to Fair Market Value for
Purchase Accounting
–
246,613
–
6,507,047
Severance
185,681
44,537
304,117
49,102
Retention Program Expenses
115,000
–
395,632
–
Employee Relocation Expenses
26,468
332
52,175
19,110
Other Non-Recurring Items
1,085,005
338,050
1,477,028
334,632
Adjusted EBITDA (non-GAAP)
$
13,814,144
$
15,021,468
$
28,339,024
$
22,869,648
Revenue
42,375,100
44,263,392
82,376,036
76,040,946
Adjusted EBITDA Percent
32.6 %
33.9 %
34.4 %
30.1 %
MEDICINE MAN TECHNOLOGIES, INC. OPERATING WORKING CAPITAL RECONCILIATION (NON-GAAP) For the Periods Ended June 30, 2023 and December 31, 2022 Expressed in U.S. Dollars
Progress and Promising Outlook for Gedeptin® and GEO-CM04S1
Phase 2 GEO-CM04S1 Clinical Trial Initiated for Patients with Chronic Lymphocytic Leukemia
Company to Host Conference Call and Webcast Today at 4:30 p.m. ET
Atlanta, GA, August 9, 2023 – GeoVax Labs, Inc. (Nasdaq: GOVX), a biotechnology company developing vaccines and immunotherapies against infectious diseases and cancers, today announced its financial results for the quarter ended June 30, 2023, and recent corporate highlights.
David Dodd, GeoVax’s Chairman and CEO, commented, “The first half of 2023 has been highly productive for GeoVax, with continued enrollment in, and positive interim clinical data presented for, both of our lead programs, Gedeptin® and GEO-CM04S1. We are also excited to have recently announced the start of an important third Phase 2 clinical study for GEO-CM04S1, in patients with chronic lymphocytic leukemia. Our next-generation COVID-19 vaccine, which utilizes an MVA-vector containing the two antigens, S and N, induces broad and durable antibody and cellular immune responses that we believe has the potential to offer a more robust, durable degree of protection than the current authorized COVID-19 vaccines, particularly in highly vulnerable immunocompromised patients.”
Mr. Dodd continued, “In addition to clinical progress, there are other notable achievements that set the stage for our future success. We have made significant progress in developing a high-yield, high-capacity, continuous avian cell line system for manufacturing our MVA-based vaccines and immunotherapies, and we recently partnered with Advanced Bioscience Laboratories, Inc. to support current Good Manufacturing Practices production of our MVA-based products through late-stage development and eventual commercialization. Additionally, the recent expansion of our GEO-CM04S1 rights to include development for Mpox and smallpox adds to other rights we previously secured from the NIH covering preclinical, clinical, and commercial uses of the NIH-MVA. This provides a compelling opportunity to leverage our MVA-based vaccine expertise and help expand the global public health supply options available for the worldwide public health threats posed by SARS-CoV-2, Mpox and smallpox. We expect significant clinical developments and other important events during the remainder of 2023, and we look forward to continuing to share news of our progress.”
Recent Business Highlights:
New Clinical Trial Initiated for GEO-CM04S1. In July, GeoVax announced the start of a Phase 2 COVID-19 vaccine booster investigator-initiated clinical trial (ClinicalTrials.gov Identifier: NCT05672355) in patients with chronic lymphocytic leukemia (CLL), a recognized high-risk group for whom current mRNA vaccines and monoclonal antibody (MAb) therapies appear inadequate relative to providing protective immunity. As a result of their medical status, CLL patients are largely unable to mount a sufficient antibody response to the mRNA vaccines. The trial is expected to enroll approximately 80 patients, comparing GEO-CM04S1 vs the Pfizer/BioNTech Bivalent vaccine. Completion of patient enrollment is expected within approximately six months. This investigator-initiated trial is being primarily funded by a private family foundation with GeoVax supporting the analysis of samples, so it is expected to have minimal impact on the Company’s balance sheet.
Gedeptin® Clinical Trial Data. Interim data from the Phase 1/2 clinical trial of Gedeptin® was presented at the American Association for Cancer Research (AACR) and the American Head and Neck Society (AHNS) joint Head and Neck Cancer Conference in July. The ongoing Phase 1/2 trial (ClinicalTrials.gov Identifier: NCT03754933) is evaluating the safety and efficacy of repeat cycles of Gedeptin therapy in patients with recurrent head and neck cancers whose tumor(s) are accessible for injection, and who have no curable treatment options. The poster presentation, which can be viewed here, highlighted data from 8 patients enrolled in the study to date, noting no dose-limiting toxicities or serious adverse events definitively attributable to treatment, with impairment of tumor growth in targeted lesions observed in 5 of 7 patients (one patient remaining under study).
The study is being funded in part by the U.S. Food and Drug Administration (FDA) pursuant to its Orphan Products Clinical Trials Grants Program. The FDA has also granted Gedeptin orphan drug status for the intra-tumoral treatment of anatomically accessible oral and pharyngeal cancers, including cancers of the lip, tongue, gum, floor of the mouth, salivary gland, and other oral cavities. GeoVax expects to complete the current trial by year-end 2023, after which expanded development of Gedeptin is anticipated, both as monotherapy and combination therapy in conjunction with other therapies to potentially include immune checkpoint inhibitors, angiogenesis inhibitors, radiation, chemotherapy, etc.
GEO-CM04S1 Clinical Trial Data. In April, unpublished data from the open-label portion of the Phase 2 trial of GEO-CM04S1 in patients with hematologic cancers receiving cell transplants or CAR-T therapy (gov Identifier: NCT04977024) was presented during the 23rd Annual World Vaccine Congress. This trial is investigating GEO-CM04S1 in a profoundly immunosuppressed patient population due to their pre-transplant induction regimens. The preliminary analysis indicates GEO-CM04S1 is highly immunogenic in these patients, inducing both neutralizing antibodies and T cell responses, which the Company believes are important to confer protection against severe COVID-19. These data support the planned progression of the Phase 2 clinical study, which will include a direct comparison to currently approved mRNA vaccines and is anticipated to include multiple sites both within and outside the U.S.
Further underscoring the need for next-generation COVID-19 vaccines such as GEO-CM04S1, GeoVax scientists co-authored an article titled, “MVA-Vectored Universal Beta-Coronavirus Vaccine Design & Development”, published in the June 2023 issue of the online journal Vaccine Insights. The article, accessible here, provides expert insight into the emergence of SARS-CoV-2 (COVID-19), the risk of new “spillover events” from animal hosts, and how this risk can be addressed proactively. Regarding COVID-19 and its continually evolving variants, the authors describe the limitations of first-generation vaccines and the potential for MVA-vectored vaccines such as GEO-CM04S1 to overcome these limitations.
Mpox Vaccine Rights Added to GEO-CM04S1. In April, GeoVax expanded its rights under its license agreement with City of Hope (COH) for GEO-CM04S1, which now grants GeoVax development and commercialization rights against orthopoxviruses in addition to SARS-CoV-2. Orthopoxviruses include Mpox, smallpox, and other viruses that cause disease in humans. GEO-CM04S1, which can induce strong antibody and T cell responses against the SARS-CoV-2 virus variants, also offers the possibility of protection against Mpox and smallpox diseases, further differentiating GEO-CM04S1 as compared to current mRNA-based COVID-19 vaccines. Such attributes may be especially important in vulnerable patient populations, such as the immune-compromised, and in geographic areas where both diseases are endemic. Such a vaccine may offer a simplified vaccine regimen for protection against diseases associated with SARS-CoV-2 and orthopoxviruses.
GEO-MVA (Mpox and smallpox vaccine). Following the recent announcement of GeoVax acquiring the rights from NIH to develop, manufacture and commercialize MVA as a vaccine against Mpox and smallpox, the Company has advanced to active regulatory discussions related to an expedited regulatory path for registration. GeoVax is focused on being the first U.S. supplier of the vaccine, providing expanded supply options for public health worldwide.
Manufacturing Development Progress. In May, GeoVax announced it had entered into an agreement with Advanced Bioscience Laboratories, Inc. (ABL) to support current Good Manufacturing Practices (cGMP) production of the company’s vaccine candidates, including GEO-CM04S1. ABL, a subsidiary of Institut Mérieux, is a pure-play contract development and manufacturing organization (CDMO) specialized in the development and manufacturing of gene therapies, oncolytic viruses, and vaccine candidates. With cGMP facilities in the U.S. and Europe, ABL is well-positioned to support GeoVax’s global development programs through late-stage development and eventual commercialization.
Earlier in 2023, GeoVax announced significant progress in developing a high-yield, high-capacity, continuous avian cell line system for manufacturing its MVA-based vaccines and immunotherapies. The Company is accelerating activities towards fully implementing a proprietary, continuous cell line manufacturing system that will provide lower-cost, scalable versatility for broad MVA vaccine and immunotherapy applications. GeoVax is on course to expand MVA applications from stockpile-based solutions for niche medical markets to have the capability to respond to large-scale worldwide requirements on a timely basis.
Preclinical Programs. Data from recent nonhuman primate studies of GEO-MM01 against Marburg virus were presented during the 23rd Annual World Vaccine Congress. Of particular interest, immunization with GEO-MM01 conferred 80% survival in cynomolgus macaques following a lethal dose of Marburg virus. Vaccination protected nonhuman primates from viremia, weight loss, and death following challenge with a lethal Marburg virus dose. Evaluation of immune responses following vaccination demonstrated the presence of both neutralizing antibodies and functional T cells, indicating a breadth of response capable of offering significant protection.
Patent Portfolio Development. In July, GeoVax announced that the U.S. Patent and Trademark Office issued Patent No. 11,701,418 B2 to GeoVax, pursuant to the Company’s patent application No. 15/543,139 titled “Replication-Deficient Modified Vaccinia Ankara (MVA) and Matrix Protein (VP40).” The claims granted by the patent generally cover GeoVax’s vector platform for expressing ebolavirus antigens in virus-like particles (VLPs) utilizing an MVA viral vector. The claims encompass multiple ebolavirus strains, including Sudan ebolavirus, Zaire ebolavirus, Taï Forest ebolavirus, and Reston ebolavirus. GeoVax previously demonstrated that a single intramuscular (IM) dose of its vaccine candidate, GEO-EM01, provided 100% protection in rhesus macaques challenged with a lethal dose of Zaire ebolavirus (EBOV). Additionally, the Company’s preclinical efficacy studies of its Sudan ebolavirus (SUDV) vaccine candidate demonstrated that a single dose of the vaccine protected 100% of small animals challenged with a lethal dose of SUDV.
Earlier in 2023, GeoVax announced that the U.S. Patent and Trademark Office issued a Notice of Allowance for Patent Application No. 17/000,768 titled, “Method for Generating a ZIKV Immune Response Utilizing a Recombinant Modified Vaccinia Ankara Vector Encoding the NS1 Protein.” Preclinical studies demonstrated that a single dose of GEO-ZM02 provided 100% protection against a lethal dose of the Zika virus.
These patents add to the Company’s growing portfolio of wholly owned, co-owned, and in-licensed intellectual property, now standing at over 115 granted or pending patent applications spread over 24 patent families.
Financial Results
Net Loss: Net loss for the three months ended June 30, 2023, was $5,927,620, or $0.22 per share, as compared to $2,241,699, or $0.18 per share, for the comparable period in 2022. For the six months ended June 30, 2023, the Company’s net loss was $9,965,536 ($0.38 per share) as compared to a net loss of $4,669,214 ($0.47 per share) in 2022.
R&D Expenses: Research and development expenses were $4,719,728 and $7,538,917 for the three-month and six-month periods ended June 30, 2023, compared to $1,307,177 and $2,637,721 for the comparable periods in 2022, with the increases primarily due to the cost of conducting clinical trials for GEO-CM04S1 and Gedeptin, costs of manufacturing materials for use in our clinical trials, additional personnel costs, technology license fees, costs of preclinical research activities and a generally higher level of activity.
G&A Expenses: General and administrative expenses were $1,459,093 and $2,910,518 for the three-month and six-month periods ended June 30, 2023, compared to $935,311 and $2,114,335 for the comparable periods in 2022, with the increases primarily due to higher personnel costs, investor relations consulting costs, patent costs and other expenses supportive of a higher level of activity.
Cash Position: GeoVax reported cash balances of $17,788,911 at June 30, 2023, as compared to $27,612,732 at December 31, 2022.
Summarized financial information is included. Further information is included in the Company’s Quarterly Report on Form 10-Q filed with the Securities and Exchange Commission.
Conference Call Details
Management will host a conference call scheduled to begin at 4:30 p.m. ET today, August 9, 2023, to review financial results and provide an update on corporate developments. A question-and-answer session will follow management’s formal remarks.
A webcast replay of the call will be available for three months via the same link as the live webcast approximately two hours after the end of the call.
About GeoVax
GeoVax Labs, Inc. is a clinical-stage biotechnology company developing novel therapies and vaccines for solid tumor cancers and many of the world’s most threatening infectious diseases. The company’s lead program in oncology is a novel oncolytic solid tumor gene-directed therapy, Gedeptin®, presently in a multicenter Phase 1/2 clinical trial for advanced head and neck cancers. GeoVax’s lead infectious disease candidate is GEO-CM04S1, a next-generation COVID-19 vaccine targeting high-risk immunocompromised patient populations. Currently in three Phase 2 clinical trials, GEO-CM04S1 is being evaluated as a primary vaccine for immunocompromised patients such as those suffering from hematologic cancers and other patient populations for whom the current authorized COVID-19 vaccines are insufficient, and as a booster vaccine in patients with chronic lymphocytic leukemia (CLL). In addition, GEO-CM04S1 is in a Phase 2 clinical trial evaluating the vaccine as a more robust, durable COVID-19 booster among healthy patients who previously received the mRNA vaccines. GeoVax has a leadership team who have driven significant value creation across multiple life science companies over the past several decades. For more information, visit our website: www.geovax.com.
Forward-Looking Statements
This release contains forward-looking statements regarding GeoVax’s business plans. The words “believe,” “look forward to,” “may,” “estimate,” “continue,” “anticipate,” “intend,” “should,” “plan,” “could,” “target,” “potential,” “is likely,” “will,” “expect” and similar expressions, as they relate to us, are intended to identify forward-looking statements. We have based these forward-looking statements largely on our current expectations and projections about future events and financial trends that we believe may affect our financial condition, results of operations, business strategy and financial needs. Actual results may differ materially from those included in these statements due to a variety of factors, including whether: GeoVax is able to obtain acceptable results from ongoing or future clinical trials of its investigational products, GeoVax’s immuno-oncology products and preventative vaccines can provoke the desired responses, and those products or vaccines can be used effectively, GeoVax’s viral vector technology adequately amplifies immune responses to cancer antigens, GeoVax can develop and manufacture its immuno-oncology products and preventative vaccines with the desired characteristics in a timely manner, GeoVax’s immuno-oncology products and preventative vaccines will be safe for human use, GeoVax’s vaccines will effectively prevent targeted infections in humans, GeoVax’s immuno-oncology products and preventative vaccines will receive regulatory approvals necessary to be licensed and marketed, GeoVax raises required capital to complete development, there is development of competitive products that may be more effective or easier to use than GeoVax’s products, GeoVax will be able to enter into favorable manufacturing and distribution agreements, and other factors, over which GeoVax has no control.
Further information on our risk factors is contained in our periodic reports on Form 10-Q and Form 10-K that we have filed and will file with the SEC. Any forward-looking statement made by us herein speaks only as of the date on which it is made. Factors or events that could cause our actual results to differ may emerge from time to time, and it is not possible for us to predict all of them. We undertake no obligation to publicly update any forward-looking statement, whether as a result of new information, future developments or otherwise, except as may be required by law.
FORT WAYNE, Ind., Aug. 09, 2023 (GLOBE NEWSWIRE) — Vera Bradley, Inc. (Nasdaq: VRA) (the “Company”) today announced that it plans to report results for the second quarter ended July 29, 2023 at 8:00 a.m. Eastern Time on Wednesday, August 30, 2023.
The Company will host a conference call to discuss its financial results at 9:30 a.m. Eastern Time that same day. A live webcast of the conference call will be available on the Investor Relations section of the Company’s website, www.verabradley.com. Alternatively, interested parties may dial into the call at (888) 394-8218, and enter the access code 1990839. A replay will be available shortly after the conclusion of the call and remain available through September 13, 2023. To access the recording, listeners should dial (844) 512-2921, and enter the access code 1990839.
ABOUT VERA BRADLEY, INC.
Vera Bradley, Inc. operates two unique lifestyle brands – Vera Bradley and Pura Vida. Vera Bradley and Pura Vida are complementary businesses, both with devoted, emotionally connected, and multi-generational female customer bases; alignment as causal, comfortable, affordable, and fun brands; positioning as “gifting” and socially-connected brands; strong, entrepreneurial cultures; a keen focus on community, charity, and social consciousness; multi-channel distribution strategies; and talented leadership teams aligned and committed to the long-term success of their brands.
Vera Bradley, based in Fort Wayne, Indiana, is a leading designer of women’s handbags, luggage and other travel items, fashion and home accessories, and unique gifts. Founded in 1982 by friends Barbara Bradley Baekgaard and Patricia R. Miller, the brand is known for its innovative designs, iconic patterns, and brilliant colors that inspire and connect women unlike any other brand in the global marketplace.
In July 2019, Vera Bradley, Inc. acquired a 75% interest in Creative Genius, Inc., which also operates under the name Pura Vida Bracelets (“Pura Vida”). Pura Vida, based in La Jolla, California, is a digitally native, highly engaging lifestyle brand founded in 2010 by friends Paul Goodman and Griffin Thall. Pura Vida has a differentiated and expanding offering of bracelets, jewelry, and other lifestyle accessories. The Company acquired the remaining 25% of Pura Vida in January 2023.
August 9, 2023 – Vancouver, Canada – Century Lithium Corp. (TSXV:LCE) (OTCQX: CYDVF) (Frankfurt: C1Z) (Century Lithium or the Company) is pleased to report successful progress in its collaboration with Koch Technology Solutions (KTS), a Koch Engineered Solutions (KES) company. As reported previously (see April 17, 2023, news release) Century Lithium and KTS are working together on the application of KTS’s Li-ProTM system at Century’s Lithium Extraction Facility (Pilot Plant) in Amargosa Valley, Nevada, USA.
“Century Lithium is delighted to see the progress made in our collaboration with Koch Technology Solutions” stated Bill Willoughby, President, and CEO of Century Lithium. “Our team, with KTS’s input has successfully incorporated and operated the equipment at our Pilot Plant with significantly improved results.”
Since October 2021, Century Lithium has been continuously testing the extraction of lithium from the claystone found at its 100%-owned Clayton Valley Lithium Project (Project) in Nevada utilizing a chloride-based leaching process. Testing of the Li-ProTM system was conducted to evaluate potential improvements in the direct lithium extraction (DLE) area of the Pilot Plant.
Adam Sackett, President of Koch Technology Solutions, added, “The steady state results generated onsite with the Koch Technology Solutions Li-Pro™ Direct Lithium Extraction process has hit all our key milestones for the Century pilot program. We are excited to move towards engineering and executing a Li-Pro™ installation with commercial process guarantees.”
With the integration of KTS’s DLE process, the grades of the intermediate lithium solution produced at the Pilot Plant have increased to the highest levels to date, with an average grade of 7.5 grams/liter (g/l) (7,500 parts per million) lithium. These lithium concentrations are four times higher than previously generated, with sodium concentrations almost an order of magnitude lower.
Highlights To Date
Successful installation and operation of Koch’s Li-ProTM DLE process
Li-ProTM plant achieved steady state using Century Lithium’s chloride leaching process
Manufacture intermediate solutions with lithium grades of 7 to 8 g/l concentrations with average lithium to sodium ratios of 0.9 to 1.1
No observed degradation of media or accumulation of deleterious elements
Operational Results
Since the installation of KTS’s DLE equipment, Century Lithium has focused on improvements related to the operational aspects of the Pilot Plant and adjustments to the final flowsheet. These improvements were well supported through the development and incorporation of KTS’s DLE equipment at the Pilot Plant.
Century Lithium, with the support of KTS, has identified techniques to improve lithium recovery within the DLE area while minimizing deleterious elements in the final solutions. Collaboration between Century Lithium and Koch staff is very productive, generating ideas and changes that have resulted in the complete removal of calcium and magnesium, and marked reduction of sodium and potassium in the product solutions.
Qualified Person
Todd Fayram, MMSA-QP is the qualified person as defined by National Instrument 43-101 and has approved the technical information in this release.
About Century Lithium Corp.
Century Lithium Corp. (formerly Cypress Development Corp.) is an advanced stage lithium company, focused on developing its 100%-owned Clayton Valley Lithium Project in west-central Nevada, USA. Century Lithium is currently in the pilot stage of testing on material from its lithium-bearing claystone deposit at its Lithium Extraction Facility in Amargosa Valley, Nevada and progressing towards completing a Feasibility Study and permitting, with the goal of becoming a domestic producer of lithium for the growing electric vehicle and battery storage market.
ON BEHALF OF CENTURY LITHIUM CORP. WILLIAM WILLOUGHBY, PhD., PE President & Chief Executive Officer
NEITHER THE TSX VENTURE EXCHANGE NOR ITS REGULATION SERVICES PROVIDER ACCEPTS RESPONSIBILITY FOR THE ADEQUACY OR ACCURACY OF THE CONTENT OF THIS NEWS RELEASE.
This release includes certain statements that may be deemed to be “forward-looking statements”. Forward-looking statements are subject to risks, uncertainties and assumptions and are identified by words such as “expects,” “estimates,” “projects,” “anticipates,” “believes,” “could,” “scheduled,” and other similar words. All statements in this release, other than statements of historical facts, that address events or developments that management of the Company expects, are forward-looking statements. Although management believes the expectations expressed in such forward-looking statements are based on reasonable assumptions, such statements are not guarantees of future performance, and actual results or developments may differ materially from those in the forward-looking statements. The Company undertakes no obligation to update these forward-looking statements if management’s beliefs, estimates or opinions, or other factors, should change. Factors that could cause actual results to differ materially from those in forward-looking statements, include market prices, exploration, and development successes, continued availability of capital and financing, and general economic, market or business conditions. Please see the public filings of the Company at www.sedar.com for further information.
TORONTO, Aug. 09, 2023 (GLOBE NEWSWIRE) — Labrador Gold Corp. (TSX.V:LAB | OTCQX:NKOSF | FNR: 2N6) (“LabGold” or the “Company”) is pleased to announce results from recent drilling targeting the highly prospective Appleton Fault Zone. The drilling is part of the Company’s ongoing 100,000 metre diamond drilling program at its 100% owned Kingsway Project.
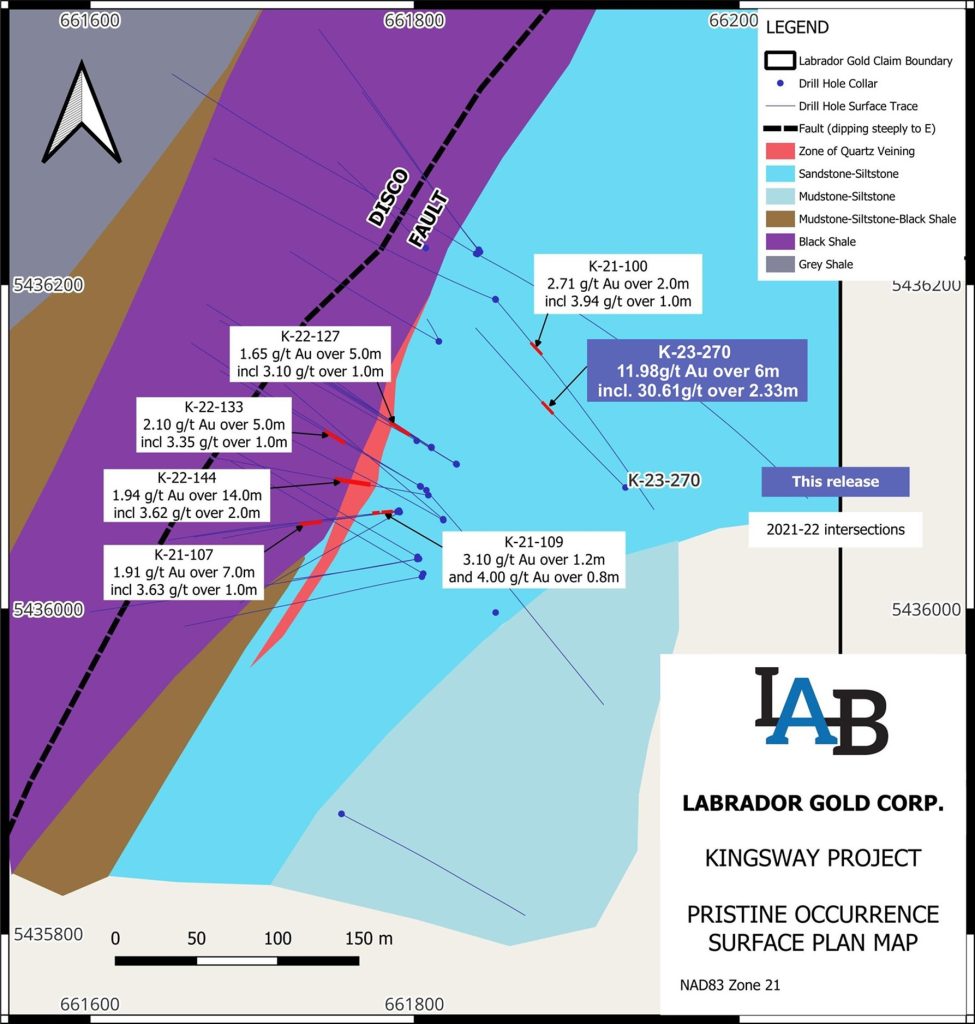
Highlights of follow up drilling at Pristine include an intersection of 11.98g/t Au over 6 metres from 91 metres (64 metres vertical) including 30.61g/t over 2.33 metres and 82.2g/t over 0.75 metres that contained 77 grains of visible gold in Hole K-22-270. All mineralization drilled to date at Pristine occurs above 86 metres vertical depth and extends over a strike length of approximately 160 metres.
Further results from first stage drilling at DropKick include 1.15g/t Au over 12.4 metres from 190.25 metres including 7.74g/t Au over 0.3 metres in hole K-23-231 and 1.46g/t Au over 6.75 metres from 162.25 metres including 3.72g/t Au over 2.15 metres in Hole K-23-251.
Ongoing drilling at Big Vein returned 1.10g/t Au over 9.3 metres from 195 metres, including 1.49g/t over 5.3 metres in Hole K-23-246 and 1.47g/t Au over 6.55 metres from 107.88 metres in hole K-23-237.
“Today’s result of high-grade, near surface gold mineralization at Pristine validates our belief that there is more to be found at Pristine. It is also the third discovery along the Appleton Fault Zone, after Big Vein and Dropkick, to produce such high grades associated with visible gold. Following our initial discovery of near surface visible gold at Pristine announced in May 2022, we did not intersect similar high-grades to those seen at Big Vein. As a result, we returned our focus to expanding Big Vein along strike and at depth and have successfully defined mineralization there over a 720-metre strike length.” said Roger Moss, President and CEO of Labrador Gold Corp. “With near surface mineralization at Pristine now drilled over an approximate 160 metre strike length and the potential for high grades demonstrated, we are looking forward to receiving the permit to drill The Gap between Pristine and Big Vein, a distance of approximately 700 metres, as we continue to focus our drilling along the very prospective Appleton Fault Zone.”
Hole ID
From (m)
To (m)
Interval (m)
Au (g/t)
Zone
K-23-270
91.00
97.00
6.00
11.98
Pristine
including
92.97
95.30
2.33
30.61
including
94.00
94.75
0.75
82.20
K-23-251
162.25
169.00
6.75
1.46
DropKick
including
166.45
168.60
2.15
3.72
including
167.00
168.60
1.60
4.48
K-23-250
152.40
152.80
0.40
6.87
Big Vein
K-23-246
195.00
204.30
9.30
1.10
Big Vein
including
199.00
204.30
5.30
1.49
K-23-240
75.22
75.63
0.41
1.82
DropKick
86.00
90.72
4.72
1.16
including
86.00
88.68
2.68
1.51
K-23-237
93.00
120.00
27.00
0.63
Big Vein
including
107.88
114.43
6.55
1.47
K-23-234
100.55
101.90
1.35
1.02
DropKick
116.00
117.00
1.00
1.26
K-23-231
190.25
202.65
12.40
1.15
Dropkick
including
197.45
201.60
4.15
1.78
including
201.30
201.60
0.30
7.74
K-23-230
16.00
19.30
3.30
0.41
Big Vein
K-23-229
nsv
Big Vein SW
K-23-228
91.55
91.85
0.30
1.18
DropKick
122.35
123.15
0.80
2.63
K-23-226
nsv
Big Vein SW
Table 1. Summary of assay results. All intersections are downhole length as there is insufficient Information to calculate true width.
Figure 1. Plan map of Pristine showing significant intersections.
Figure 2. Visible gold in drill core from Hole K-23-270. A total of 77 gold grains were observed.
Figure 3. Interval of visible gold mineralization in Hole K-23-270
Almost 83,000 metres have been drilled to date out of the planned 100,000 metre program. Assays are pending for samples from approximately 8,877 metres of core.
The Company has approximately $12 million in cash and is well funded to carry out the remaining 17,000 metres of the planned drill program as well as further exploration to add to the current pipeline of drill targets on the property.
Hole ID
Easting
Northing
Elevation
Azimuth
Inclination
Total Depth
K-23-270
661930
5436075
52.0
315
45
187
K-23-251
663167
5438130
58.2
140
65
229
K-23-250
661554
5435471
53.0
125
70
320
K-23-246
661272
5435093
62.4
145
45
250
K-23-240
663365
5438261
60.2
140
45
128
K-23-237
661352
5435080
45.8
145
45
280
K-23-234
663304
5438259
55.9
140
45
266
K-23-231
663303
5438259
56.3
140
65
260
K-23-230
661737
5435329
44.7
20
45
208
K-23-229
661133
5434768
42.9
140
45
173
K-23-228
663348
5438353
54.7
140
65
126.2
K-23-226
661176
5434794
42.3
140
45
528
Table 2. Drill hole collar details
QA/QC
True widths of the reported intersections have yet to be calculated. Assays are uncut. Samples of HQ split core are securely stored prior to shipping to Eastern Analytical Laboratory in Springdale, Newfoundland for assay. Eastern Analytical is an ISO/IEC17025 accredited laboratory. Samples are routinely analyzed for gold by standard 30g fire assay with atomic absorption finish as well as by ICP-OES for an additional 34 elements. Samples containing visible gold are assayed by metallic screen/fire assay, as are any samples with fire assay results greater than 1g/t Au. The company submits blanks and certified reference standards at a rate of approximately 5% of the total samples in each batch. Approximately 5% of sample pulps are submitted to Bureau Veritas, an ISO 17025 accredited Laboratory in Vancouver, BC for check assays..
Qualified Person
Roger Moss, PhD., P.Geo., President and CEO of LabGold, a Qualified Person in accordance with Canadian regulatory requirements as set out in NI 43-101, has read and approved the scientific and technical information that forms the basis for the disclosure contained in this release.
The Company gratefully acknowledges the Newfoundland and Labrador Ministry of Natural Resources’ Junior Exploration Assistance (JEA) Program for its financial support for exploration of the Kingsway property.
About Labrador Gold Labrador Gold is a Canadian based mineral exploration company focused on the acquisition and exploration of prospective gold projects in Eastern Canada.
Labrador Gold’s flagship property is the 100% owned Kingsway project in the Gander area of Newfoundland. The three licenses comprising the Kingsway project cover approximately 12km of the Appleton Fault Zone which is associated with numerous gold occurrences in the region. Infrastructure in the area is excellent located just 18km from the town of Gander with road access to the project, nearby electricity and abundant local water. LabGold is drilling a projected 100,000 metres targeting high-grade epizonal gold mineralization along the Appleton Fault Zone with encouraging results. The Company has approximately $12 million in working capital and is well funded to carry out the planned program.
The Hopedale property covers much of the Florence Lake greenstone belt that stretches over 60 km. The belt is typical of greenstone belts around the world but has been underexplored by comparison. Work to date by Labrador Gold show gold anomalies in rocks, soils and lake sediments over a 3 kilometre section of the northern portion of the Florence Lake greenstone belt in the vicinity of the known Thurber Dog gold showing where grab samples assayed up to 7.8g/t gold. In addition, anomalous gold in soil and lake sediment samples occur over approximately 40 km along the southern section of the greenstone belt (see news release dated January 25 th 2018 for more details). Labrador Gold now controls approximately 40km strike length of the Florence Lake Greenstone Belt.
The Company has 170,009,979 common shares issued and outstanding and trades on the TSX Venture Exchange under the symbol LAB.
Neither TSX Venture Exchange nor its Regulation Services Provider (as that term is defined in policies of the TSX Venture Exchange) accepts responsibility for the adequacy or accuracy of this release .
Forward-Looking Statements: This news release contains forward-looking statements that involve risks and uncertainties, which may cause actual results to differ materially from the statements made. When used in this document, the words “may”, “would”, “could”, “will”, “intend”, “plan”, “anticipate”, “believe”, “estimate”, “expect” and similar expressions are intended to identify forward-looking statements. Such statements reflect our current views with respect to future events and are subject to risks and uncertainties. Many factors could cause our actual results to differ materially from the statements made, including those factors discussed in filings made by us with the Canadian securities regulatory authorities. Should one or more of these risks and uncertainties, such as actual results of current exploration programs, the general risks associated with the mining industry, the price of gold and other metals, currency and interest rate fluctuations, increased competition and general economic and market factors, occur or should assumptions underlying the forward looking statements prove incorrect, actual results may vary materially from those described herein as intended, planned, anticipated, or expected. We do not intend and do not assume any obligation to update these forward-looking statements, except as required by law. Shareholders are cautioned not to put undue reliance on such forward-looking statements.
Operational Excellence and Disciplined Capital Allocation Drive Solid Operating Performance and Strong EPS Growth
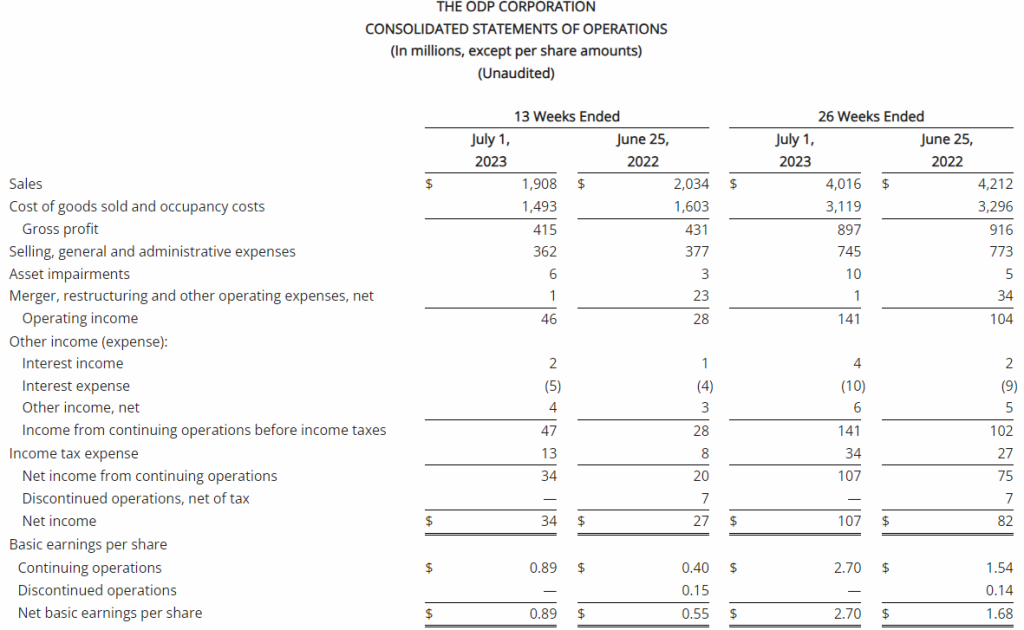
Second Quarter Revenue of $1.9 Billion with GAAP EPS of $0.87; Adjusted EPS of $0.99
GAAP Operating Income of $46 Million; GAAP Net Income of $34 Million; Adjusted EBITDA of $86 Million
Repurchased $31 Million of Shares in the Second Quarter of 2023
Updates Full-Year 2023 Guidance
BOCA RATON, Fla.–(BUSINESS WIRE)–Aug. 9, 2023– The ODP Corporation (“ODP,” or the “Company”) (NASDAQ:ODP), a leading provider of products, services, and technology solutions to businesses and consumers, today announced results for the second quarter ended July 1, 2023.
Consolidated (in millions, except per share amounts)
2Q23
2Q22
YTD23
YTD22
Selected GAAP and Non-GAAP measures:
Sales
$1,908
$2,034
$4,016
$4,212
Sales change from prior year period
(6)%
(5)%
Operating income
$46
$28
$141
$104
Adjusted operating income (1)
$53
$54
$152
$143
Net income from continuing operations
$34
$20
$107
$75
Diluted earnings per share from continuing operations
$0.87
$0.39
$2.61
$1.49
Adjusted net income from continuing operations (1)
$39
$39
$114
$104
Adjusted earnings per share from continuing operations (fully diluted)(1)
$0.99
$0.79
$2.80
$2.06
Adjusted EBITDA (1)
$86
$91
$217
$216
Operating Cash Flow from continuing operations
$(8)
$(114)
$149
$(84)
Free Cash Flow(2)
$(31)
$(135)
$97
$(127)
Adjusted Free Cash Flow (3)
$(30)
$(121)
$103
$(106)
Second Quarter 2023 Summary(1)(2)(3)
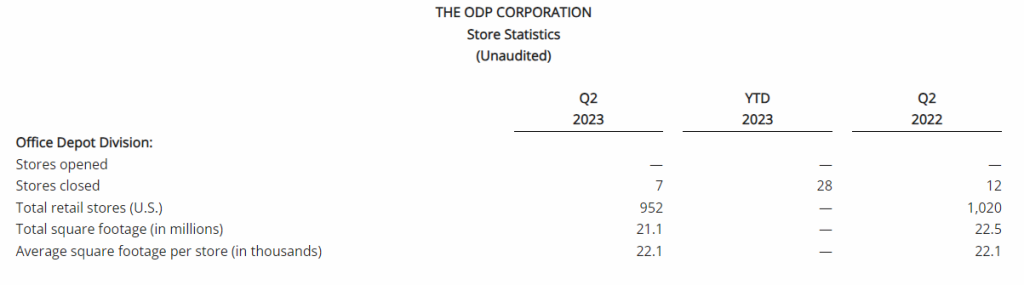
Total reported sales of $1.9 billion, down 6% versus the prior year, primarily due to lower sales in its Office Depot consumer division, largely driven by 68 fewer retail locations in service compared to the prior year, as well as lower retail and online consumer traffic and transactions
GAAP operating income of $46 million and net income from continuing operations of $34 million, or $0.87 per diluted share, versus $28 million and $20 million, or $0.39 per diluted share, respectively in the prior year
Adjusted operating income of $53 million, compared to $54 million in the second quarter of 2022; adjusted EBITDA of $86 million, compared to $91 million in the second quarter of 2022
Adjusted net income from continuing operations of $39 million, or adjusted diluted earnings per share from continuing operations of $0.99, versus $39 million or $0.79, respectively in the prior year
Operating cash flow from continuing operations of ($8 million) and adjusted free cash flow of ($30 million), versus $(114 million) and $(121 million), respectively in the prior year
Repurchased 724 thousand shares for $31 million in the second quarter of 2023
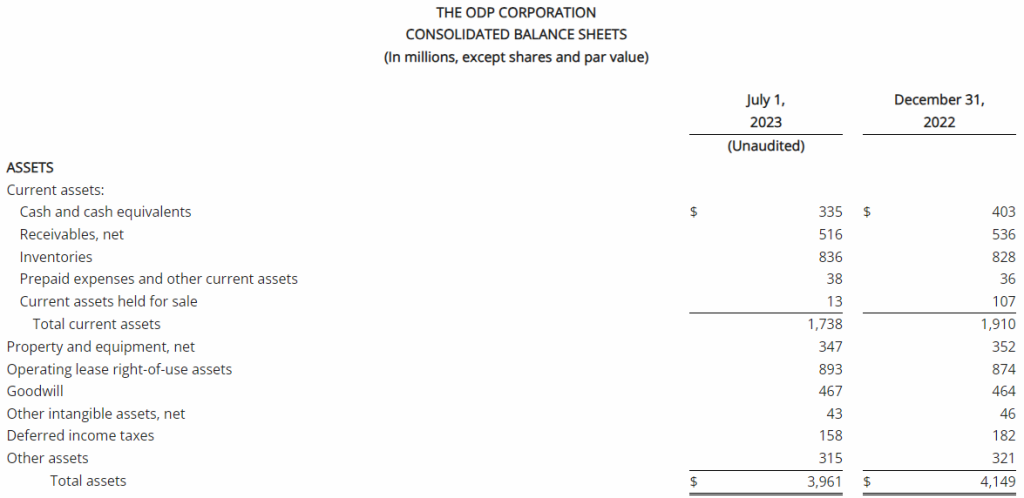
$1.1 billion of total available liquidity including $335 million in cash and cash equivalents at quarter end
“Our continued focus on operational excellence and disciplined capital allocation drove solid operating results and a strong increase in earnings per share,” said Gerry Smith, chief executive officer of The ODP Corporation. “ODP Business Solutions led the way, expanding its margin profile and driving an impressive year-over-year increase in operating income. Veyer added new third-party business, remaining on-track to more than double external EBITDA in 2023, and Varis continues to onboard customers and incorporate feedback and new features onto its platform. While the weaker macroeconomic environment and somewhat sluggish consumer activity created top-line headwinds in our consumer business during the quarter, Office Depot continued to provide a superior customer experience and we are encouraged by our expanded assortment, which positions us well for the upcoming back-to-school selling season.”
“Combining our solid operating performance with our continued disciplined capital allocation, which included repurchasing about $31 million of our shares in the quarter, we drove an impressive 25% year-over-year increase in adjusted earnings per share in the second quarter,” Smith continued.
“Our low-cost business model, multiple routes to market, and strong balance sheet have us well positioned to continue navigating the ongoing challenging macroeconomic conditions. Moving ahead, we will continue to drive operational excellence across our four business units and prioritize capital allocation, remaining squarely focused on driving value for our shareholders,” Smith concluded.
Consolidated Results
Reported (GAAP) Results
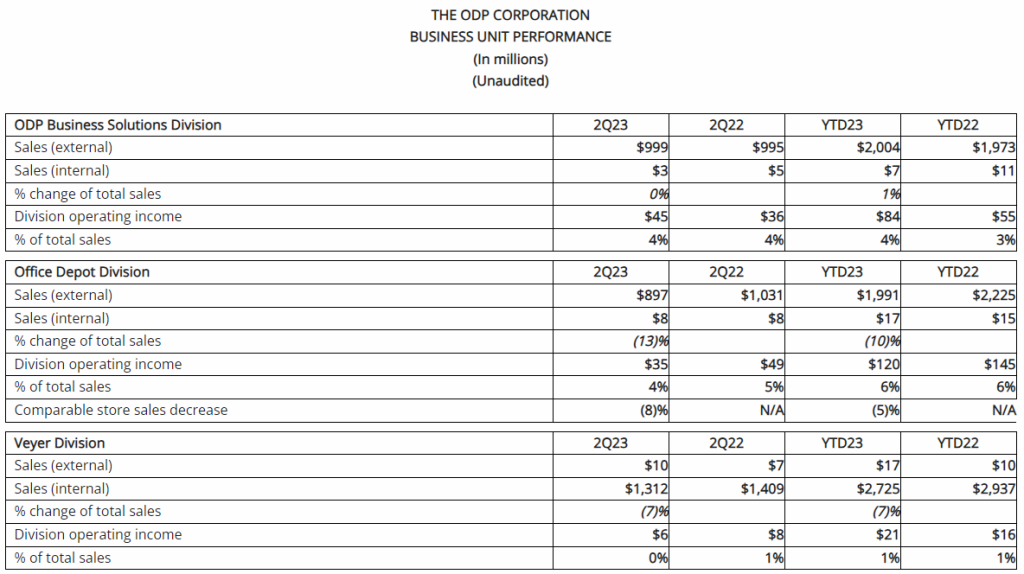
Total reported sales for the second quarter of 2023 were $1.9 billion, a decrease of 6% compared with the same period last year. This was driven primarily by lower sales in its consumer division, Office Depot, primarily due to 68 fewer stores in service compared to last year related to planned store closures, as well as lower retail and online consumer traffic. Sales at ODP Business Solutions Division were flat year over year, as increases in sales for paper and certain adjacency categories, and flexible pricing strategies, were largely offset by lower sales in product categories including ink, toner, office supplies and personal protective equipment. Additionally, Veyer provided strong logistics support for the ODP Business Solutions and Office Depot Divisions, and began to capture additional demand for its supply chain and procurement solutions among other third-party customers.
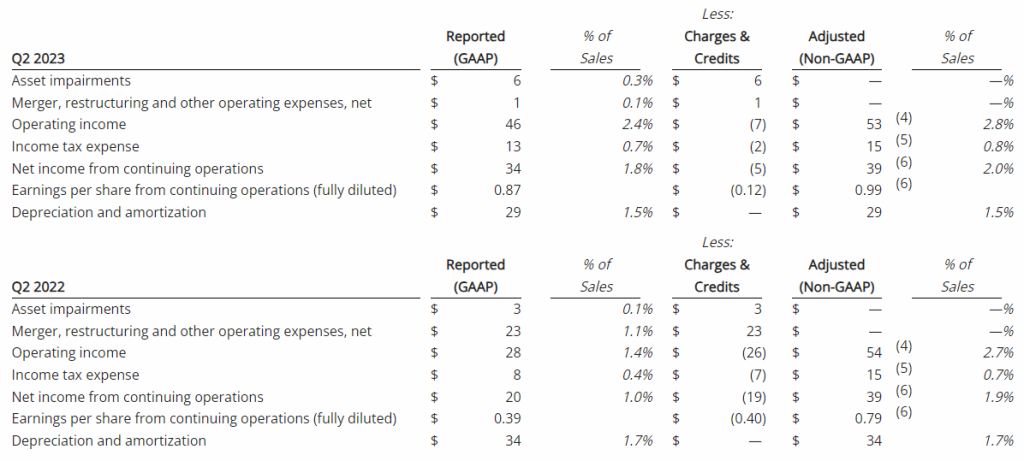
The Company reported operating income of $46 million in the second quarter of 2023, up 64% compared to operating income of $28 million in the prior year period. Operating results in the second quarter of 2023 included $7 million of charges. These charges consisted primarily of $6 million associated with non-cash asset impairments largely related to the operating lease right-of-use (ROU) assets associated with the Company’s retail store locations. Net income from continuing operations was $34 million, or $0.87 per diluted share in the second quarter of 2023, up from $20 million, or $0.39 per diluted share in the second quarter of 2022.
Adjusted (non-GAAP) Results(1)
Adjusted results for the second quarter of 2023 exclude charges and credits totaling $7 million as described above and the associated tax impacts.
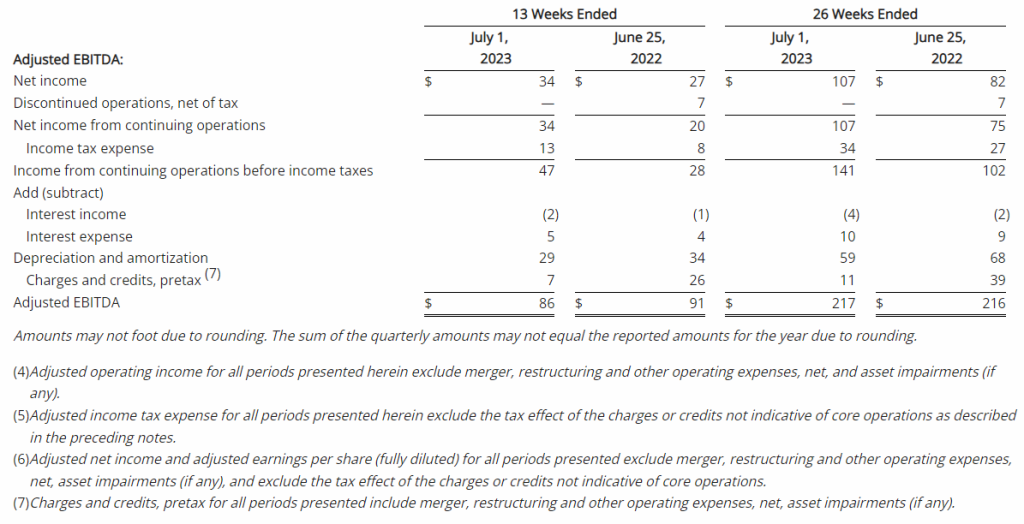
Second quarter of 2023 adjusted EBITDA was $86 million compared to $91 million in the prior year period. This included depreciation and amortization of $29 million and $34 million in the second quarters of 2023 and 2022, respectively
Second quarter of 2023 adjusted operating income was $53 million compared to $54 million in the second quarter of 2022
Second quarter of 2023 adjusted net income from continuing operations was $39 million, or $0.99 per diluted share, compared to $39 million, or $0.79 per diluted share, in the second quarter of 2022, an increase of 25% on a per share basis
Division Results
ODP Business Solutions Division
Leading B2B distribution solutions provider serving small, medium and enterprise level companies with an annual trailing-twelve-month revenue in excess of $4 billion
Reported sales were $1.0 billion in the second quarter of 2023, flat compared to the same period last year, as return to the office trends and flexible pricing strategies were offset by higher levels of unemployment and other macroeconomic factors
Drove strong sales in paper and adjacency categories, including furniture, cleaning and breakroom supplies, and copy and print services
Total adjacency category sales, including cleaning and breakroom, furniture, technology, and copy and print, were 44% of total ODP Business Solutions’ sales
Continued strong pipeline and signed renewed business in excess of $100 million in customer agreements
Operating income was $45 million in the second quarter of 2023, up 25% over the same period last year, related primarily to higher gross margins. As a percentage of sales, operating income margin was 4.5%, up 100 basis points compared to the same period last year
Office Depot Division
Leading provider of retail consumer and small business products and services distributed via Office Depot and OfficeMax retail locations and an award-winning eCommerce presence
Reported sales were $0.9 billion in the second quarter of 2023, down 13% compared to the prior year period partially due to 68 fewer retail outlets in service associated with planned store closures, as well as lower demand relative to last year in certain product categories and lower online sales. The Company closed 7 retail stores in the quarter and had 952 stores at quarter end. Sales were down approximately 8% on a comparable store basis
Store traffic and demand relative to last year was negatively impacted by the recovery from the pandemic as a greater percentage of customers returned to the office, as well as weaker macroeconomic activity and higher unemployment
Operating income was $35 million in the second quarter of 2023, compared to operating income of $49 million during the same period last year. As a percentage of sales, operating income was 4%, or down approximately 90 basis points compared to the same period last year. This result was primarily driven by the flow through impact from lower sales and impacts related to inflation
Veyer Division
Veyer is a supply chain, distribution, procurement and global sourcing operation, supporting Office Depot and ODP Business Solutions, as well as other third-party customers. Assets and capabilities of Veyer include approximately 9 million square feet of infrastructure; ~100 facilities (distribution centers, cross-docks, and direct import centers); a large private fleet of vehicles; and next-day delivery to 98.5% of US population
In the second quarter of 2023, Veyer provided strong support for its internal customers, ODP Business Solutions and Office Depot, as well as for its third-party customers, generating sales of $1.3 billion
Operating income was $6 million in the second quarter of 2023, down from $8 million in the prior year period related to lower sales in Office Depot
In the quarter relative to last year, sales and EBITDA generated from third party customers was up nearly 62% and over 141%, respectively, resulting in sales of approximately $10 million and EBITDA of $3 million in the quarter
Varis Division
Varis is a tech-enabled B2B indirect procurement marketplace launched in the fourth quarter of 2022, which provides buyers and suppliers a seamless way to transact through the platform’s consumer-like buying experience and advanced spend management tools
Successfully launched the platform in the fourth quarter of 2022; onboarding new customers, incorporating feedback, and adding new features to the platform
Varis generated revenues in the quarter of $2 million, an increase of $1 million compared to the second quarter of 2022
Operating loss was $14 million, compared to an operating loss of $16 million in the second quarter of 2022, primarily driven by lower employee related costs and as the division continued to invest in its business and worked to onboard customers
Share Repurchases
The Company continued to execute under its previously announced $1 billion share repurchase authorization, available through year-end 2025. During the second quarter of 2023, the Company repurchased 724 thousand shares for $31 million. Since the inception of the authorization beginning in November 2022, the Company has repurchased approximately 8.3 million shares for $387 million.
The number of shares to be repurchased in the future and the timing of such transactions will depend on a variety of factors, including market conditions, regulatory requirements, and other corporate considerations. The current authorization could be suspended or discontinued at any time as determined by the Board of Directors.
Balance Sheet and Cash Flow
As of July 1, 2023, ODP had total available liquidity of approximately $1.1 billion, consisting of $335 million in cash and cash equivalents and $811 million of available credit under the Third Amended Credit Agreement. Total debt was $181 million.
For the second quarter of 2023, cash used by operating activities of continuing operations was $8 million, which included $1 million in restructuring and other spend, compared to cash used by operating activities of continuing operations of $114 million in the second quarter of the prior year, which included $14 million in restructuring and other spend. The year-over-year improvement in operating cash flow largely related to stronger operating results, prudent inventory management, and timing of certain working capital items.
Capital expenditures in the second quarter of 2023 were $23 million versus $21 million in the prior year period, reflecting continuing growth investments in the Company’s digital transformation, distribution network, and eCommerce capabilities. Adjusted Free Cash outflow(3) was $30 million in the second quarter of 2023, a significant improvement compared to $121 million outflow in the prior year period.
“I would like to thank our entire team for their continued efforts on carefully managing inventory and other working capital items, which resulted in significantly stronger year-over-year cash flow in the quarter,” said Anthony Scaglione, executive vice president and chief financial officer of The ODP Corporation. “As we move into the second half of the year, we will maintain our disciplined approach and focus on managing operating costs, maximizing cash flow in our business, and optimizing our capital allocation plan,” Scaglione added.
Updated 2023 Expectations
“We remain cautiously optimistic about the second half of the year and are excited about the opportunity to continue driving operational excellence and delivering strong value for our shareholders,” said Smith. “While we recognize that the challenging macroeconomic environment is causing somewhat sluggish consumer activity and market disruptions, we’re enthusiastic about our strong position and are focused on driving the assets we control to deliver long-term profitable growth. Through executing along our three horizons strategy, driving our four business unit model, and remaining focused on prudently deploying capital to maximize shareholder value, we’re on a path to unlocking ODP’s potential, creating a compelling value proposition for all of our stakeholders.”
The Company’s full year guidance for 2023 included in this release includes non-GAAP measures, such as adjusted EBITDA, Adjusted Operating Income, Adjusted Earnings per Share and Adjusted Free Cash Flow. These measures exclude charges or credits not indicative of core operations, which may include but not be limited to merger integration expenses, restructuring charges, acquisition-related costs, executive transition costs, asset impairments and other significant items that currently cannot be predicted without unreasonable efforts. The exact amount of these charges or credits are not currently determinable but may be significant. Accordingly, the Company is unable to provide equivalent GAAP measures or reconciliations from GAAP to non-GAAP for these financial measures without unreasonable effort.
The Company is updating its full year guidance for 2023 as follows:
Previous 2023 Guidance
Updated 2023 Guidance
Sales
$8.0 – $8.4 billion
Revised to approximately $8 billion
Adjusted EBITDA
$400 – $430 million
Affirmed
Adjusted Operating Income
$270 – $300 million
Affirmed
Adjusted Earnings per Share(*)
$4.50 – $5.10 per share
Revised to $5.00 – $5.30 per share
Adjusted Free Cash Flow(**)
$200 – $230 million
Affirmed
Capital Expenditures
$100 – $120 million
Affirmed
*Adjusted Earnings per Share (EPS) guidance for 2023 excludes potential discrete (tax) items that may affect quarter to quarter fluctuations and includes expected impact from share repurchases
**Adjusted Free Cash Flow is defined as cash flows from operating activities less capital expenditures excluding cash charges associated with the Company’s Maximize B2B Restructuring and expenses incurred in connection with our previously planned separation of the consumer business and re-alignment
“We delivered solid performance in the first half of the year and remain in a strong capital position with our low-cost business model mindset,” said Scaglione. “While we’re cautious on the state of the consumer and general macroeconomic conditions, our continued focus on operational excellence has us well positioned to continue driving solid results for the balance of the year. Our updated guidance assumes stabilization in overall economic trends in the second half of 2023 and reflects our expectations for revenue trends given first half performance, confirming the low end of our previous full-year revenue guidance range, while reaffirming all other operating metrics and increasing our earnings per share guidance given our strong performance to date, lower than expected interest and tax expense, and continued share buyback activity,” Scaglione added.
The ODP Corporation will webcast a call with financial analysts and investors on August 9, 2023, at 9:00 am Eastern Time, which will be accessible to the media and the general public. To listen to the conference call via webcast, please visit The ODP Corporation’s Investor Relations website at investor.theodpcorp.com. A replay of the webcast will be available approximately two hours following the event.
(1)
As presented throughout this release, adjusted results represent non-GAAP financial measures and exclude charges or credits not indicative of core operations and the tax effect of these items, which may include but not be limited to merger integration, restructuring, acquisition costs, and asset impairments. Reconciliations from GAAP to non-GAAP financial measures can be found in this release as well as on the Company’s Investor Relations website at investor.theodpcorp.com.
(2)
As used in this release, Free Cash Flow is defined as cash flows from operating activities less capital expenditures. Free Cash Flow is a non-GAAP financial measure and reconciliations from GAAP financial measures can be found in this release as well as on the Company’s Investor Relations website at investor.theodpcorp.com.
(3)
As used in this release, Adjusted Free Cash Flow is defined as Free Cash Flow excluding cash charges associated with the Company’s Maximize B2B Restructuring, and expenses incurred in connection with our previously planned separation of the consumer business and re-alignment. Adjusted Free Cash Flow is a non-GAAP financial measure and reconciliations from GAAP financial measures can be found in this release as well as on the Company’s Investor Relations website at investor.theodpcorp.com.
About The ODP Corporation
The ODP Corporation (NASDAQ:ODP) is a leading provider of products, services, and technology solutions through an integrated business-to-business (B2B) distribution platform and omni-channel presence, which includes world-class supply chain and distribution operations, dedicated sales professionals, a B2B digital procurement solution, online presence, and a network of Office Depot and OfficeMax retail stores. Through its operating companies Office Depot, LLC; ODP Business Solutions, LLC; Veyer, LLC; and Varis, Inc, The ODP Corporation empowers every business, professional, and consumer to achieve more every day. For more information, visit theodpcorp.com.
This communication may contain forward-looking statements within the meaning of the Private Securities Litigation Reform Act of 1995. These statements or disclosures may discuss goals, intentions and expectations as to future trends, plans, events, results of operations, cash flow or financial condition, the potential impacts on our business due to the unknown severity and duration of the COVID-19 pandemic, or state other information relating to, among other things, the Company, based on current beliefs and assumptions made by, and information currently available to, management. Forward-looking statements generally will be accompanied by words such as “anticipate,” “believe,” “plan,” “could,” “estimate,” “expect,” “forecast,” “guidance,” “expectations”, “outlook,” “intend,” “may,” “possible,” “potential,” “predict,” “project,” “propose” or other similar words, phrases or expressions, or other variations of such words. These forward-looking statements are subject to various risks and uncertainties, many of which are outside of the Company’s control. There can be no assurances that the Company will realize these expectations or that these beliefs will prove correct, and therefore investors and stakeholders should not place undue reliance on such statements.
Factors that could cause actual results to differ materially from those in the forward-looking statements include, among other things, highly competitive office products market and failure to differentiate the Company from other office supply resellers or respond to decline in general office supplies sales or to shifting consumer demands; competitive pressures on the Company’s sales and pricing; the risk that the Company is unable to transform the business into a service-driven, B2B platform that such a strategy will not result in the benefits anticipated; the risk that the Company will not be able to achieve the expected benefits of its strategic plans, including its strategic shift to maintain all of its businesses under common ownership; the risk that the Company may not be able to realize the anticipated benefits of acquisitions due to unforeseen liabilities, future capital expenditures, expenses, indebtedness and the unanticipated loss of key customers or the inability to achieve expected revenues, synergies, cost savings or financial performance; the risk that the Company is unable to successfully maintain a relevant omni-channel experience for its customers; the risk that the Company is unable to execute the Maximize B2B Restructuring Plan successfully or that such plan will not result in the benefits anticipated; failure to effectively manage the Company’s real estate portfolio; loss of business with government entities, purchasing consortiums, and sole- or limited- source distribution arrangements; failure to attract and retain qualified personnel, including employees in stores, service centers, distribution centers, field and corporate offices and executive management, and the inability to keep supply of skills and resources in balance with customer demand; failure to execute effective advertising efforts and maintain the Company’s reputation and brand at a high level; disruptions in computer systems, including delivery of technology services; breach of information technology systems affecting reputation, business partner and customer relationships and operations and resulting in high costs and lost revenue; unanticipated downturns in business relationships with customers or terms with the suppliers, third-party vendors and business partners; disruption of global sourcing activities, evolving foreign trade policy (including tariffs imposed on certain foreign made goods); exclusive Office Depot branded products are subject to additional product, supply chain and legal risks; product safety and quality concerns of manufacturers’ branded products and services and Office Depot private branded products; covenants in the credit facility; general disruption in the credit markets; incurrence of significant impairment charges; retained responsibility for liabilities of acquired companies; fluctuation in quarterly operating results due to seasonality of the Company’s business; changes in tax laws in jurisdictions where the Company operates; increases in wage and benefit costs and changes in labor regulations; changes in the regulatory environment, legal compliance risks and violations of the U.S. Foreign Corrupt Practices Act and other worldwide anti-bribery laws; volatility in the Company’s common stock price; changes in or the elimination of the payment of cash dividends on Company common stock; macroeconomic conditions such as higher interest rates and future declines in business or consumer spending; increases in fuel and other commodity prices and the cost of material, energy and other production costs, or unexpected costs that cannot be recouped in product pricing; unexpected claims, charges, litigation, dispute resolutions or settlement expenses; catastrophic events, including the impact of weather events on the Company’s business; the discouragement of lawsuits by shareholders against the Company and its directors and officers as a result of the exclusive forum selection of the Court of Chancery, the federal district court for the District of Delaware or other Delaware state courts by the Company as the sole and exclusive forum for such lawsuits; and the impact of the COVID-19 pandemic on the Company’s business. The foregoing list of factors is not exhaustive. Investors and shareholders should carefully consider the foregoing factors and the other risks and uncertainties described in the Company’s Annual Reports on Form 10-K, Quarterly Reports on Form 10-Q, and Current Reports on Form 8-K filed with the U.S. Securities and Exchange Commission. The Company does not assume any obligation to update or revise any forward-looking statements.
THE ODP CORPORATION GAAP to Non-GAAP Reconciliations (Unaudited)
We report our results in accordance with accounting principles generally accepted in the United States (“GAAP”). We also review certain financial measures excluding impacts of transactions that are not related to our core operations (“non-GAAP”). Management believes that the presentation of these non-GAAP financial measures enhances the ability of its investors to analyze trends in its business and provides a means to compare periods that may be affected by various items that might obscure trends or developments in its business. Management uses both GAAP and non-GAAP measures to assist in making business decisions and assessing overall performance. Non-GAAP measures help to evaluate programs and activities that are intended to attract and satisfy customers, separate from expenses and credits directly associated with Merger, restructuring, and certain similar items. Certain non-GAAP measures are also used for short and long-term incentive programs.
Our measurement of these non-GAAP financial measures may be different from similarly titled financial measures used by others and therefore may not be comparable. These non-GAAP financial measures should not be considered superior to the GAAP measures, but only to clarify some information and assist the reader. We have included reconciliations of this information to the most comparable GAAP measures in the tables included within this material.
Free cash flow is a non-GAAP measure, which we define as cash flows from operating activities less capital expenditures. We believe that free cash flow is an important indicator that provides additional perspective on our ability to generate cash to fund our strategy and expand our distribution network. Adjusted free cash flow is also a non-GAAP measure, which we define as free cash flow excluding cash charges associated with the Company’s Maximize B2B Restructuring, and the previously planned separation of the consumer business and re-alignment.
DENVER, Aug. 8, 2023 /CNW/ – Schwazze, (OTCQX: SHWZ) (NEO: SHWZ) (“Schwazze” or the “Company”), a multi-state operating cannabis company with assets in Colorado and New Mexico, announces the grand opening of its medical and recreational dispensary, R.Greenleaf Hobbs, which opened on Saturday, August 5, 2023. The new store is located at 1901 Joe Harvey Blvd #130 in Hobbs, NM 88240. Store operating hours are 8a to 11p Monday through Saturday; 8a to 8p on Sunday.
The R.Greenleaf Hobbs store opening continues the Company’s expansion throughout New Mexico and comes on the heels of eight additional R.Greenleaf store openings since Schwazze’s acquisition of the retail banner in February 2022. This opening along with the recent acquisition of Everest brings Schwazze’s total number of New Mexico retail dispensaries to 33. All locations serve the needs of medical patients as well as recreational adult-use consumers.
“We are excited to be a part of the growing cannabis community in New Mexico and to open an additional R.Greenleaf dispensary in the state. The team has been hard at work preparing to serve our customers in and around the city of Hobbs offering a wide variety of quality products serviced by dedicated, knowledgeable staff,” said Ken Bair, Senior Vice President of New Mexico Retail.
Since April 2020, Schwazze has acquired, opened, or announced the planned acquisition of 62 cannabis retail dispensaries (bannered as Star Buds, Emerald Fields, R. Greenleaf, Standing Akimbo, and Everest) as well as eight cultivation facilities and three manufacturing plants across Colorado and New Mexico. In May 2021, Schwazze launched its Biosciences division, and in August 2021 it commenced home delivery services in Colorado.
About Schwazze
Schwazze (OTCQX: SHWZ NEO: SHWZ) is building a premier vertically integrated regional cannabis company with assets in Colorado and New Mexico and will continue to take its operating system to other states where it can develop a differentiated regional leadership position. Schwazze is the parent company of a portfolio of leading cannabis businesses and brands spanning seed to sale. The Company is committed to unlocking the full potential of the cannabis plant to improve the human condition. Schwazze is anchored by a high-performance culture that combines customer-centric thinking and data science to test, measure, and drive decisions and outcomes. The Company’s leadership team has deep expertise in retailing, wholesaling, and building consumer brands at Fortune 500 companies as well as in the cannabis sector. Schwazze is passionate about making a difference in our communities, promoting diversity and inclusion, and doing our part to incorporate climate-conscious best practices.
Medicine Man Technologies, Inc. was Schwazze’s former operating trade name. The corporate entity continues to be named Medicine Man Technologies, Inc. Schwazze derives its name from the pruning technique of a cannabis plant to enhance plant structure and promote healthy growth.
Forward-Looking Statements
This press release contains “forward-looking statements.” Such statements may be preceded by the words “plan,” “will,” “may,” “continue,” “predicts,” or similar words. Forward-looking statements are not guarantees of future events or performance, are based on certain assumptions, and are subject to various known and unknown risks and uncertainties, many of which are beyond the Company’s control and cannot be predicted or quantified. Consequently, actual events and results may differ materially from those expressed or implied by such forward-looking statements. Such risks and uncertainties include, without limitation, risks and uncertainties associated with (i) our inability to manufacture our products and product candidates on a commercial scale on our own or in collaboration with third parties; (ii) difficulties in obtaining financing on commercially reasonable terms; (iii) changes in the size and nature of our competition; (iv) loss of one or more key executives or scientists; (v) difficulties in securing regulatory approval to market our products and product candidates; (vi) our ability to successfully execute our growth strategy in Colorado and outside the state, (vii) our ability to consummate the acquisition described in this press release or to identify and consummate future acquisitions that meet our criteria, (viii) our ability to successfully integrate acquired businesses, including the acquisition described in this press release, and realize synergies therefrom, (ix) the ongoing COVID-19 pandemic, * the timing and extent of governmental stimulus programs, and (xi) the uncertainty in the application of federal, state and local laws to our business, and any changes in such laws. More detailed information about the Company and the risk factors that may affect the realization of forward-looking statements is set forth in the Company’s filings with the Securities and Exchange Commission (SEC), including the Company’s Annual Report on Form 10-K and its Quarterly Reports on Form 10-Q. Investors and security holders are urged to read these documents free of charge on the SEC’s website at http://www.sec.gov. The Company assumes no obligation to publicly update or revise its forward-looking statements as a result of new information, future events or otherwise except as required by law.
Revenue of $977.9 million, up 10.2% y/y on a pro forma basis
Awarded significant bookings of $2.1 billion, driving backlog +10% sequentially to $13.0 billion
Reported operating income of $34.3 million; adjusted operating income1 of $70.5 million
Adjusted EBITDA1 of $76.4 million with a margin1 of 7.8%
Diluted EPS of $0.06; adjusted diluted EPS1 of $1.01
Improved net debt to EBITDA1 leverage ratio ~0.4x to 3.48x
2023 Guidance:
Increasing mid-point of 2023 revenue, adjusted EBITDA1, and adjusted diluted EPS1 guidance
MCLEAN, Va., Aug. 8, 2023 /PRNewswire/ — V2X, Inc. (NYSE:VVX) announced second quarter 2023 financial results.
“V2X reported strong results in the second quarter with revenue increasing 10.2% year-over-year, on a pro forma basis,” said Chuck Prow, President and Chief Executive Officer of V2X. “Adjusted EBITDA1 for the quarter was $76.4 million and 7.8% margin resulting from solid revenue volume and benefits from program performance. Bookings activity in the quarter was strong at $2.1 billion in awards to V2X. This yielded total backlog of $13.0 billion, representing 10% growth sequentially. Our new business and recompete wins in addition to scope expansion on existing programs bolster our backlog position and set us up for positive momentum leading into 2024. Furthermore, with over $5 billion in bids under evaluation and a 12-month pipeline of ~$19 billion, the outlook for V2X remains robust.”
“Revenue growth in the quarter was generated by continued expansion on existing programs, contribution from new awards, as well as success in securing recompete wins late last year and in early 2023,” said Mr. Prow. “Our teams continued to further drive momentum by successfully expanding work scope on our core programs. Several notable wins late last year and in the first half of 2023 have also helped to push revenue growth. We continue to experience growth in the Pacific or INDOPACOM, and see significant long-term opportunity to further support increasing mission requirements in the region.”
Mr. Prow continued, “We were successful in capturing several key new business pursuits during the quarter. First, we were awarded a $100 million five-year task order with the Department of State to provide logistics support internationally. This represents our most substantive and strategic win with the Department of State and is the culmination of a multi-year client engagement and targeted growth campaign. Our agility and high level of readiness to support mission requirements was a key strategic differentiator for V2X in this award. Looking ahead, we see significant opportunity to leverage our comprehensive capabilities and footprint to further support the global missions of this important client. I am also pleased to announce that we are seeing results executing our sell through business model, which is leveraging our highly technical, development, integration, production, and modernization capabilities. During the quarter, V2X finalized three separate efforts with new clients that utilize our engineering, integration and manufacturing capabilities. We were also awarded an engineering development and prototyping effort with a new client that we believe will lead to new proprietary products with enduring follow-on business.”
“In addition to new awards, during the second quarter, we were awarded over $520 million in recompetes,” said Mr. Prow. “This includes an eight-year, $328 million contract with Naval Facilities Systems Command (NAVFAC) Southeast in support of the Naval Station at Guantanamo Bay. This contract includes all aspects of infrastructure sustainment, including the application of our unique converged solutions. We also secured a five-year recompete contract valued at over $122 million with NAVAIR Fleet Readiness Center Southwest for depot level maintenance support services. Transition to the new contract started in early July. These two recompete wins, along with our first quarter win of Naval Test Wing Pacific reflect the realization of our deliberate growth-oriented client campaign. These efforts are yielding growth, which further diversify our client portfolio. We are thrilled to have been selected for these important programs and remain focused on helping the Navy succeed with the missions that they serve.”
Mr. Prow concluded, “We are harnessing the combined solutions of V2X and are seeing momentum that we believe will drive growth and create value. For example, V2X’s robust modernization and sustainment capabilities are a significant differentiator and we are making excellent progress leveraging our engineering and manufacturing center of excellence. This includes opportunities such as modernizing and improving the effectiveness of the F-16 Fighting Falcon and further expanding our proprietary Gateway Mission Router 1000 across various platforms to provide cutting edge situational awareness in support of the DoD’s Joint All Domain Command and Control (JADC2) effort.”
Second Quarter 2023 Results
On July 5, 2022 (“Closing Date”), Vectrus, Inc. (“Vectrus”) completed its merger (the “Merger”) with Vertex Aerospace Services Holding Corp. (“Vertex”), thereby forming V2X, Inc. Second quarter 2022 “reported results” reflect the contributions of Vectrus from April 1, 2022, through June 30, 2022, unless otherwise noted. Comparisons to historical periods are relative to legacy Vectrus results, unless otherwise noted.
Revenue of $977.9 million, up 10.2% y/y on a pro forma basis
Operating income of $34.3 million, including merger and integration related costs of $13.6 million, and amortization of acquired intangible assets of $22.6 million
Adjusted operating income1 of $70.5 million
Adjusted EBITDA1 of $76.4 million with a 7.8% adjusted EBITDA margin1
Diluted EPS of $0.06
Adjusted diluted EPS1 of $1.01
Net debt as of June 30, 2023 of $1,176.6 million
Total backlog as of June 30, 2023 of $13.0 billion
“Our financial results for the second quarter were impressive across the board,” said Susan Lynch, Senior Vice President and Chief Financial Officer. “Pro forma revenue increased 10.2% year-over-year to $977.9 million. Revenue growth was achieved via expansion on existing programs, the contribution from new business wins awarded in late 2022 and securing key recompete programs in the first half of 2023. Advancing and protecting our core in addition to growth through new pursuit wins is fundamental to V2X delivering on its commitments. To date in 2023, we have witnessed an acceleration of deliverables that were originally contemplated to be recognized in the second half of the year. The results this quarter represent achievement of expanding in our core markets and capturing new business with approximately $900 million in new contract awards in the first half of 2023.”
For the quarter, the Company reported operating income of $34.3 million and adjusted operating income1 of $70.5 million. Adjusted EBITDA1 was $76.4 million with a margin of 7.8%. First quarter diluted EPS was $0.06, due primarily to merger and integration related costs, amortization of acquired intangible assets, and interest expense. Adjusted diluted EPS1 for the quarter was $1.01.
Ms. Lynch continued, “At the end of the quarter, net debt for V2X was $1,176.6 million, a $112 million reduction from the prior quarter. Net consolidated indebtedness to EBITDA1 (net leverage ratio) was 3.48x, representing a ~0.4x improvement over the prior quarter. We remain focused on reducing debt and expect that our leverage ratio will continue to improve in the second half of 2023.”
“Net cash provided by operating activities for the quarter was $116.6 million. Adjusted net cash provided by operating activities1 was $10.9 million, adding back $7.3 million of M&A and integration costs, and removing the contribution of the master accounts receivable purchase or “MARPA” facility of $113 million,” said Ms. Lynch.
Total backlog as of June 30, 2023, was $13.0 billion, increasing approximately $1.2 billion over last quarter reflecting successful expansion on existing programs along with significant new contract and recompete awards. Funded backlog was $3.1 billion. The trailing twelve-month book-to-bill was 1.3x.
2023 Guidance
Ms. Lynch concluded, “I am pleased with our results this quarter and for the first half of the year. Our teams continue to work together seamlessly, making notable progress on integration milestones while driving results across the board. As such, the Company is raising the mid-point of its 2023 revenue, adjusted EBITDA1, and adjusted diluted EPS1 guidance.” Guidance for 2023 is as follows:
$ millions, except for per share amounts
2023 Guidance (Updated)
2023 Mid-Point (Updated)
Revenue
$3,850
$3,950
$3,900
Adjusted EBITDA1
$295
$310
$303
Adjusted Diluted Earnings Per Share1
$3.85
$4.30
$4.08
Adjusted Net Cash Provided by Operating Activities 1
$115
$135
$125
Forward-looking statements are based upon current expectations and are subject to factors that could cause actual results to differ materially from those suggested here, including those factors set forth in the Safe Harbor Statement below.
Second Quarter 2023 Conference Call
Management will conduct a conference call with analysts and investors at 4:30 p.m. ET on Tuesday, August 8, 2023. U.S.-based participants may dial in to the conference call at 877-506-6380, while international participants may dial 412-542-4198. A live webcast of the conference call as well as an accompanying slide presentation will be available here: https://app.webinar.net/lZEXpEOLx9J
A replay of the conference call will be posted on the V2X website shortly after completion of the call and will be available for one year. A telephonic replay will also be available through August 22, 2023, at 844-512-2921 (domestic) or 412-317-6671 (international) with passcode 10179631.
Presentation slides that will be used in conjunction with the conference call will also be made available online in advance on the “investors” section of the company’s website at https://gov2x.com. V2X recognizes its website as a key channel of distribution to reach public investors and as a means of disclosing material non-public information to comply with its obligations under the U.S. Securities and Exchange Commission (“SEC”) Regulation FD.
Footnotes: 1 See “Key Performance Indicators and Non-GAAP Financial Measures” for descriptions and reconciliations.
About V2X
V2X builds smart solutions designed to integrate physical and digital infrastructure – from base to battlefield – by aligning people, actions, and outputs. Formed by the merger of Vectrus and Vertex, we bring a combined 120 years of successful mission support. Our lifecycle solutions improve security, streamline logistics, and enhance readiness.
The Company delivers a comprehensive suite of integrated solutions across the operations and logistics, aerospace, training, and technology markets to national security, defense, civilian and international clients. Our global team of approximately 15,000 employees brings innovation to every point in the mission lifecycle, from preparation to operations, to sustainment, as it tackles the most complex challenges with agility, grit, and dedication.
Safe Harbor Statement
Safe Harbor Statement under the Private Securities Litigation Reform Act of 1995 (the “Act”): Certain material presented herein includes forward-looking statements intended to qualify for the safe harbor from liability established by the Act. These forward-looking statements include, but are not limited to, all the statements and items listed under “2023 Guidance” above and other assumptions contained therein for purposes of such guidance, other statements about our 2023 performance outlook, revenue, contract opportunities, and any discussion of future operating or financial performance.
Forward-looking statements generally can be identified by the use of forward-looking terminology such as “may,” “will,” “expect,” “intend,” “estimate,” “anticipate,” “believe,” “could,” “potential,” “continue” or similar terminology. These statements are based on the beliefs and assumptions of the management of the Company based on information currently available to management.
These forward-looking statements are not guarantees of future performance, conditions, or results, and involve a number of known and unknown risks, uncertainties, assumptions, and other important factors, many of which are outside our management’s control, that could cause actual results to differ materially from the results discussed in the forward-looking statements. In addition, forward-looking statements are subject to certain risks and uncertainties that could cause actual results to differ materially from the Company’s historical experience and our present expectations or projections. For a discussion of some of the risks and uncertainties that could cause actual results to differ from such forward-looking statements, see the risks and other factors detailed from time to time our Annual Report on Form 10-K, Quarterly Reports on Form 10-Q, and other filings with the SEC.
We undertake no obligation to update any forward-looking statements, whether as a result of new information, future events or otherwise, except as required by law.
Key Performance Indicators and Non-GAAP Measures
The primary financial performance measures we use to manage our business and monitor results of operations are revenue trends and operating income trends. Management believes that these financial performance measures are the primary drivers for our earnings and net cash from operating activities. Management evaluates its contracts and business performance by focusing on revenue, operating income, and operating margin. Operating income represents revenue less both cost of revenue and selling, general and administrative (SG&A) expenses. Cost of revenue consists of labor, subcontracting costs, materials, and an allocation of indirect costs, which includes service center transaction costs. SG&A expenses consist of indirect labor costs (including wages and salaries for executives and administrative personnel), bid and proposal expenses and other general and administrative expenses not allocated to cost of revenue. We define operating margin as operating income divided by revenue.
We manage the nature and amount of costs at the program level, which forms the basis for estimating our total costs and profitability. This is consistent with our approach for managing our business, which begins with management’s assessing the bidding opportunity for each contract and then managing contract profitability throughout the performance period.
In addition to the key performance measures discussed above, we consider adjusted net income, adjusted diluted earnings per share, adjusted operating income, adjusted EBITDA, adjusted EBITDA margin, adjusted operating cash flow, and pro forma revenue to be useful to management and investors in evaluating our operating performance, and to provide a tool for evaluating our ongoing operations. This information can assist investors in assessing our financial performance and measures our ability to generate capital for deployment among competing strategic alternatives and initiatives. We provide this information to our investors in our earnings releases, presentations, and other disclosures.
Adjusted net income, adjusted diluted earnings per share, adjusted operating income, adjusted EBITDA, adjusted EBITDA margin, adjusted operating cash flow, and pro forma revenue, however, are not measures of financial performance under GAAP and should not be considered a substitute for financial measures determined in accordance with GAAP. Definitions and reconciliations of these items are provided below.
Pro forma revenue is defined as the combined results of our operations for the three months ended June 30, 2023 and July 1, 2022 as if the Merger had occurred on January 1, 2021.
Adjusted operating income is defined as operating income, adjusted to exclude items that may include, but are not limited to, significant charges or credits, and unusual and infrequent non-operating items that impact current results but are not related to our ongoing operations, such as M&A, integration, and related costs.
Adjusted EBITDA is defined as operating income, adjusted to exclude depreciation and amortization of intangible assets, and items that may include, but are not limited to, significant charges or credits, and unusual and infrequent non-operating items that impact current results but are not related to our ongoing operations, such as M&A, integration, and related costs.
Adjusted EBITDA margin is defined as adjusted EBITDA divided by revenue.
Adjusted net income is defined as net income, adjusted to exclude items that may include, but are not limited to, significant charges or credits, and unusual and infrequent non-operating items that impact current results but are not related to our ongoing operations, such as M&A, integration and related costs, amortization of acquired intangible assets, amortization of debt issuance costs, and loss on extinguishment of debt.
Adjusted diluted earnings per share is defined as adjusted net income divided by the weighted average diluted common shares outstanding.
Cash interest, net is defined as interest expense, net adjusted to exclude amortization of debt issuance costs.
Adjusted operating cash flow is defined as net cash provided by (or used in) operating activities adjusted to exclude infrequent non-operating items, such as M&A payments and related costs.
In this document, the Company presents certain forward-looking non-GAAP metrics. The Company does not provide outlook on a GAAP basis because the items that the Company excludes from GAAP to calculate the comparable non-GAAP measure can be dependent on future events that are less capable of being controlled or reliably predicted by management and are not part of the Company’s routine operating activities. Additionally, management does not forecast many of the excluded items for internal use and therefore cannot create or rely on outlook done on a GAAP basis. The occurrence, timing, and amount of any of the items excluded from GAAP to calculate non-GAAP measures could significantly impact the Company’s fiscal 2023 GAAP results.
CONTACT:
V2X, Inc. Mike Smith, CFA 719-637-5773 ir@gov2x.com
President and Chief Operating Officer Thomas Tedford Appointed Chief Executive Officer Effective October 1, 2023; Boris Elisman to Continue as Executive Chairman Before Retiring in the first half of 2024
LAKE ZURICH, Ill,–(BUSINESS WIRE)– ACCO Brands Corporation (NYSE: ACCO) (the “Company” or “ACCO Brands”), one of the world’s largest suppliers of select categories of branded academic, consumer and business products, today announced its Board of Directors has appointed the Company’s President and Chief Operating Officer, Thomas Tedford, as CEO effective October 1, 2023. Mr. Tedford has also been elected a member of the board effective that date. Mr. Tedford will succeed ACCO Brands current CEO, Boris Elisman, who will continue as Executive Chairman until his retirement in the first half of 2024. He has notified the Board that he will not stand for reelection at the 2024 stockholders’ meeting.
“The appointment of Tom as ACCO Brands next CEO is part of a succession plan that Boris and the Board have been preparing over the past few years,” stated Lead Independent Director, Thomas Kroeger. “We have worked closely with Tom and have full confidence in his commitment to creating value for our shareholders. He brings deep knowledge of our industry, our customers, the overall Company, and its operating segments to his new role. Tom has worked closely with Boris and the Board in developing and executing on the Company’s strategic transformation and will continue to do so, assuring a smooth and seamless transition of leadership and positioning us for profitable growth.”
“On behalf of everyone at ACCO Brands, we would like to thank Boris for his exemplary leadership and dedicated service as CEO. Boris’s innumerable contributions during his 18-year tenure, the last 10 leading the Company as CEO, have successfully expanded the growth opportunities for the Company,” Mr. Kroger concluded.
Mr. Elisman said, “During my tenure at ACCO Brands, the Company and the industry have undergone significant changes and I am proud of our teams’ accomplishments during this period. Having worked closely with Tom for many years, I know the company is in great hands to continue to progress and accelerate profitable growth. It has been my privilege to lead this great company, and I look forward to continuing to serve as Executive Chairman to ensure a smooth transition.”
Mr. Tedford commented, “It is an honor to have the opportunity to lead ACCO Brands and our talented team of dedicated employees as we build upon the current momentum in our business. Boris has been a great mentor and a tremendous leader. I have worked with him for more than a decade and appreciate his leadership and bold actions to transform ACCO Brands. I look forward to continuing to work closely with Boris to complete this leadership transition.”
“I am grateful for the support of our Board of Directors and am excited to work with them and our executive leadership team. I believe there are immense opportunities to enhance our leadership position in key categories, grow through share gains and new innovative product solutions, optimize our supply chain, and improve our margin profile as we remain focused on delivering shareholder value and customer satisfaction. Near-term we are committed to prioritizing our free cash flow towards supporting our dividend and debt reduction,” added Mr. Tedford.
Thomas Tedford Bio
Mr. Tedford joined ACCO Brands in 2010 and was named President and Chief Operating Officer in 2021. From 2011 to 2021, Mr. Tedford served first as Executive Vice President and President of ACCO Brands Americas ultimately becoming Executive Vice President and President, ACCO Brands, North America. During his tenure, he successfully led the operational, cultural and leadership integrations of key strategic acquisitions, the introduction of new products and the development of new markets. Prior to joining ACCO Brands, Mr. Tedford had 15 years of progressive sales, sales leadership, marketing, operational and executive management experience, operating in highly competitive and demanding industries. Mr. Tedford has expertise addressing complex challenges, optimizing performance, developing growth strategies, innovating product solutions, and building high-performing teams.
About ACCO Brands Corporation
ACCO Brands, the Home of Great Brands Built by Great People, designs, manufactures and markets consumer and end-user products that help people work, learn, play, and thrive. Our widely recognized brands include AT-A-GLANCE®, Five Star®, Kensington®, Leitz®, Mead®, PowerA®, Swingline®, Tilibra® and many others. More information about ACCO Brands Corporation (NYSE: ACCO) can be found at www.accobrands.com.
IRVING, Texas–(BUSINESS WIRE)– Salem Media Group, Inc. (the “company”) (Nasdaq: SALM) released its results for the three and six months ended June 30, 2023.
Second Quarter 2023 Results
For the three months ended June 30, 2023 compared to the three months ended June 30, 2022:
Consolidated
Total revenue decreased 4.2% to $65.8 million from $68.7 million;
Total operating expenses increased 13.9% to $69.9 million from $61.4 million;
Operating expenses, excluding stock-based compensation expense, debt modification costs, gains and losses on the sale or disposition of assets, impairments, depreciation expense and amortization expense (1) increased 5.2% to $63.1 million from $60.0 million;
The company had an operating loss of $4.1 million as compared to operating income of $7.3 million;
The company had a net loss of $7.1 million, or $0.26 net loss per share, compared to net income of $9.1 million, or $0.33 net income per diluted share;
EBITDA (1) decreased to $(0.6) million from $14.5 million; and
Adjusted EBITDA (1) decreased 77.2% to $2.7 million from $11.7 million.
Broadcast
Net broadcast revenue decreased 5.3% to $49.7 million from $52.5 million;
Station Operating Income (“SOI”) (1) decreased 43.5% to $6.2 million from $10.9 million;
Same Station (1) net broadcast revenue decreased 5.8% to $49.4 million from $52.4 million; and
Same Station SOI (1) decreased 37.7% to $6.8 million from $10.9 million.
Digital Media
Digital media revenue increased 0.5% to $10.9 million from $10.8 million; and
Digital Media Operating Income (1) decreased 27.5% to $1.8 million from $2.5 million.
Publishing
Publishing revenue decreased 3.5% to $5.2 million from $5.4 million; and
Publishing Operating Loss (1) increased to $0.8 million from $6,000.
Included in the results for the three months ended June 30, 2023 are:
A $1.8 million ($1.4 million, net of tax, or $0.05 per share) impairment charge to the value of goodwill in Townhall;
A $1.1 million ($0.8 million, net of tax, or $0.03 per share) impairment charge to the value of broadcast licenses in Portland and San Francisco;
A $0.1 million ($0.1 million, net of tax) net loss on the disposition of assets; and
A $0.1 million non-cash compensation charge ($0.1 million, net of tax) related to the expense of stock options.
Included in the results for the three months ended June 30, 2022 are:
A $6.9 million ($5.1 million, net of tax, or $0.19 per diluted share) net gain on the disposition of assets reflects a $6.5 million pre-tax gain on the sale of land used in the company’s Denver, Colorado broadcast operations and a $0.5 million pre-tax gain on the sale of the company’s radio stations in Louisville, Kentucky that was offset by losses from various fixed asset disposals;
A $3.9 million ($2.9 million, net of tax, or $0.11 per share) impairment charge to the value of broadcast licenses in Columbus, Dallas, Greenville, Honolulu, Orlando, Portland, and Sacramento;
A $0.1 million ($0.1 million, net of tax) goodwill impairment charge; and
A $0.1 million ($0.1 million, net of tax) non-cash compensation charge related to the expense of stock options.
Per share numbers are calculated based on 27,216,787 diluted weighted average shares for the three months ended June 30, 2023, and 27,570,881 diluted weighted average shares for the three months ended June 30, 2022.
Year to Date 2023 Results
For the six months ended June 30, 2023 compared to the six months ended June 30, 2022:
Consolidated
Total revenue decreased 1.5% to $129.3 million from $131.3 million;
Total operating expenses increased 15.6% to $137.5 million from $119.0 million;
Operating expenses, excluding gains or losses on the disposition of assets, stock-based compensation expense, debt modification costs, changes in the estimated fair value of contingent earn-out consideration, impairments, depreciation expense and amortization expense (1) increased 8.2% to $125.2 million from $115.7 million;
The company had an operating loss of $8.3 million as compared to operating income of $12.3 million;
The company recognized $3.9 million in film distribution income from an unconsolidated equity investment in the six months ended June 30, 2022;
The company had a net loss of $12.2 million, or $0.45 net loss per share, compared to net income of $10.9 million, or $0.39 net income per diluted share;
EBITDA (1) decreased to $(1.2) million from $22.7 million; and
Adjusted EBITDA (1) decreased 78.1% to $4.1 million from $18.5 million.
Broadcast
Net broadcast revenue decreased 2.8% to $98.0 million from $100.9 million;
SOI (1) decreased 44.9% to $11.7 million from $21.2 million;
Same station (1) net broadcast revenue decreased 3.2% to $97.5 million from $100.8 million; and
Same station SOI (1) decreased 39.6% to $12.8 million from $21.2 million.
Digital media
Digital media revenue increased 1.3% to $21.4 million from $21.1 million; and
Digital media operating income (1) decreased 23.1% to $3.4 million from $4.4 million.
Publishing
Publishing revenue increased 6.1% to $9.9 million from $9.3 million; and
Publishing Operating Loss (1) increased 156.5% to $1.5 million from $0.6 million.
Included in the results for the six months ended June 30, 2023 are:
A $3.2 million ($2.4 million, net of tax, or $0.09 per share) impairment charge to the value of broadcast licenses in Miami, Portland and San Francisco;
A $1.8 million ($1.4 million, net of tax, or $0.05 per share) impairment charge to the value of goodwill in Townhall;
A $0.1 million loss on the early retirement of long-term debt associated with the 2024 Notes; and
A $0.2 million ($0.1 million, net of tax, or $0.01 per share) non-cash compensation charge related to the expense of stock options.
Included in the results for the six months ended June 30, 2022 are:
A $8.6 million ($6.4 million, net of tax, or $0.23 per diluted share) net gain on the disposition of assets relates primarily to the $6.5 million pre-tax gain on the sale of land used in the company’s Denver, Colorado broadcast operations, the $1.8 million pre-tax gain on sale of land used in the company’s Phoenix, Arizona broadcast operations, and $0.5 million pre-tax gain on the sale of the company’s radio stations in Louisville, Kentucky offset by various fixed asset disposals;
A $3.9 million ($2.9 million, net of tax, or $0.11 per share) impairment charge to the value of broadcast licenses in Columbus, Dallas, Greenville, Honolulu, Orlando, Portland, and Sacramento;
A $0.1 million ($0.1 million, net of tax) goodwill impairment charge;
A $0.2 million ($0.2 million, net of tax, or $0.01 per share) charge for debt modification costs; and
A $0.2 million ($0.1 million, net of tax) non-cash compensation charge related to the expense of stock options.
Per share numbers are calculated based on 27,216,787 diluted weighted average shares for the six months ended June 30, 2023, and 27,590,644 diluted weighted average shares for the six months ended June 30, 2022.
Balance Sheet
As of June 30, 2023, the company had $159.4 million outstanding on the 7.125% senior secured notes due 2028 (“2028 Notes”) and $22.6 million outstanding on the ABL facility.
Effective June 30, 2023, the company was not in compliance with its fixed charge coverage ratio. On August 7, 2023 the company signed a forbearance whereby the bank agreed not to exercise remedies on the default during the month of August. Additionally, the notional amount of the revolver was reduced from $30.0 million to $25.0 million with a minimum availability of $1.0 million. Finally, the interest rate associated with the revolver increased by two percentage points effective July 1, 2023 through the date of the forbearance amendment.
Acquisitions and Divestitures
The following transactions were completed since April 1, 2023:
On July 21, 2023 the company closed the sale of radio station KNTS-AM in Seattle, Washington for $0.2 million.
On July 13, 2023 the company closed the sale of radio station KLFE-AM in Seattle, Washington for $0.5 million. Radio station KLFE-AM was being programmed under a Time Brokerage Agreement (“TBA”) as of August 1, 2022.
On May 25, 2023, the company entered into a rental income purchase agreement with a related party to sell the assignment of the rents from its Greenville, South Carolina radio transmitter site for $3.5 million commencing on June 1, 2023 resulting in a pre-tax gain of $3.3 million.
Pending transactions:
On June 29, 2023 the company entered into an agreement to sell radio station KSAC-FM in Sacramento, California for $1.0 million subject to approval of the Federal Communications Commission (“FCC”). Radio station KSAC-FM will begin being programmed under a TBA on August 1, 2023. Based on its plan to sell the station, the company recorded an estimated pre-tax loss on the sale of assets of $3.3 million at June 30, 2023, reflecting the sales price as compared to the carrying value of the assets and the estimated cost to sell. The company expects to close the sale in the fourth quarter of this year.
Conference Call Information
The company will host a teleconference to discuss its results on August 8, 2023 at 4:00 p.m. Central Time. To access the teleconference, please dial (888) 770-7291, and then ask to be joined into the Salem Media Group Second Quarter 2023 call or listen via the investor relations portion of the company’s website, located at investor.salemmedia.com. A replay of the teleconference will be available through August 22, 2023 and can be heard by dialing (800) 770-2030, passcode 2413416 or on the investor relations portion of the company’s website, located at investor.salemmedia.com.
Follow us on Twitter @SalemMediaGrp.
Third Quarter 2023 Outlook
For the third quarter of 2023, the company is projecting total revenue to decline between 3% and 5% from the third quarter 2022 total revenue of $66.9 million. Excluding the impact of the 2022 political revenue, the company would project total revenue to decline between 1% and 3%. The company is also projecting operating expenses before gains or losses on the sale or disposal of assets, stock-based compensation expense, legal settlement, changes in the estimated fair value of contingent earn-out consideration, impairments, depreciation expense and amortization expense (“Recurring Operating Expenses”) to be between a decrease of 1% and increase of 2% compared to the third quarter of 2022 Recurring Operating Expenses of $60.8 million.
A reconciliation of Recurring Operating Expenses (a non-GAAP measure) to the most directly comparable GAAP measure is not available without unreasonable efforts on a forward-looking basis due to the potential high variability, complexity and low visibility with respect to the charges excluded from this non-GAAP financial measure, in particular, the change in the estimated fair value of earn-out consideration, impairments and gains or losses from the disposition of fixed assets. The company expects the variability of the above charges may have a significant, and potentially unpredictable, impact on its future GAAP financial results.
About Salem Media Group, Inc.
Salem Media Group is America’s leading multimedia company specializing in Christian and conservative content, with media properties comprising radio, digital media and book and newsletter publishing. Each day Salem serves a loyal and dedicated audience of listeners and readers numbering in the millions nationally. With its unique programming focus, Salem provides compelling content, fresh commentary and relevant information from some of the most respected figures across the Christian and conservative media landscape. Learn more about Salem Media Group, Inc. at www.salemmedia.com, Facebook and Twitter.
Forward-Looking Statements
Statements used in this press release that relate to future plans, events, financial results, prospects or performance are forward-looking statements as defined under the Private Securities Litigation Reform Act of 1995. Actual results may differ materially from those anticipated as a result of certain risks and uncertainties, including but not limited to the ability of the company to close and integrate announced transactions, market acceptance of the company’s radio station formats, competition from new technologies, inflation and other adverse economic conditions, and other risks and uncertainties detailed from time to time in the company’s reports on Forms 10-K, 10-Q, 8-K and other filings filed with or furnished to the Securities and Exchange Commission. Readers are cautioned not to place undue reliance on these forward-looking statements, which speak only as of the date hereof. The company undertakes no obligation to update or revise any forward-looking statements to reflect new information, changed circumstances or unanticipated events.
(1)
Regulation G
Management uses certain non-GAAP financial measures defined below in communications with investors, analysts, rating agencies, banks and others to assist such parties in understanding the impact of various items on its financial statements. The company uses these non-GAAP financial measures to evaluate financial results, develop budgets, manage expenditures and as a measure of performance under compensation programs.
The company’s presentation of these non-GAAP financial measures should not be considered as a substitute for or superior to the most directly comparable financial measures as reported in accordance with GAAP.
Regulation G defines and prescribes the conditions under which certain non-GAAP financial information may be presented in this earnings release. The company closely monitors EBITDA, Adjusted EBITDA, Station Operating Income (“SOI”), Same Station net broadcast revenue, Same Station broadcast operating expenses, Same Station Operating Income, Digital Media Operating Income, Publishing Operating Loss, and operating expenses excluding gains or losses on the disposition of assets, stock-based compensation, changes in the estimated fair value of contingent earn-out consideration, impairments, depreciation and amortization, all of which are non-GAAP financial measures. The company believes that these non-GAAP financial measures provide useful information about its core operating results, and thus, are appropriate to enhance the overall understanding of its financial performance. These non-GAAP financial measures are intended to provide management and investors a more complete understanding of its underlying operational results, trends and performance.
The company defines Station Operating Income (“SOI”) as net broadcast revenue minus broadcast operating expenses. The company defines Digital Media Operating Income as net Digital Media Revenue minus Digital Media Operating Expenses. The company defines Publishing Operating Loss as net Publishing Revenue minus Publishing Operating Expenses. The company defines EBITDA as net income before interest, taxes, depreciation, and amortization. The company defines Adjusted EBITDA as EBITDA before gains or losses on the disposition of assets, before debt modification costs, before changes in the estimated fair value of contingent earn-out consideration, before impairments, before net miscellaneous income and expenses, before (gain) loss on early retirement of long-term debt and before non-cash compensation expense. SOI, Digital Media Operating Income, Publishing Operating Loss, EBITDA and Adjusted EBITDA are commonly used by the broadcast and media industry as important measures of performance and are used by investors and analysts who report on the industry to provide meaningful comparisons between broadcasters. SOI, Digital Media Operating Income, Publishing Operating Loss, EBITDA and Adjusted EBITDA are not measures of liquidity or of performance in accordance with GAAP and should be viewed as a supplement to and not a substitute for or superior to its results of operations and financial condition presented in accordance with GAAP. The company’s definitions of SOI, Digital Media Operating Income, Publishing Operating Loss, EBITDA and Adjusted EBITDA are not necessarily comparable to similarly titled measures reported by other companies.
The company defines Same Station net broadcast revenue as broadcast revenue from its radio stations and networks that the company owns or operates in the same format on the first and last day of each quarter, as well as the corresponding quarter of the prior year. The company defines Same Station broadcast operating expenses as broadcast operating expenses from its radio stations and networks that the company owns or operates in the same format on the first and last day of each quarter, as well as the corresponding quarter of the prior year. The company defines Same Station SOI as Same Station net broadcast revenue less Same Station broadcast operating expenses. Same Station operating results include those stations that the company owns or operates in the same format on the first and last day of each quarter, as well as the corresponding quarter of the prior year. Same Station operating results for a full calendar year are calculated as the sum of the Same Station operating results for each of the four quarters of that year. The company uses Same Station operating results, a non-GAAP financial measure, both in presenting its results to stockholders and the investment community, and in its internal evaluations and management of the business. The company believes that Same Station operating results provide a meaningful comparison of period over period performance of its core broadcast operations as this measure excludes the impact of new stations, the impact of stations the company no longer owns or operates, and the impact of stations operating under a new programming format. The company’s presentation of Same Station operating results is not intended to be considered in isolation or as a substitute for the financial information prepared and presented in accordance with GAAP. The company’s definition of Same Station operating results is not necessarily comparable to similarly titled measures reported by other companies.
For all non-GAAP financial measures, investors should consider the limitations associated with these metrics, including the potential lack of comparability of these measures from one company to another.
The Supplemental Information tables that follow the condensed consolidated financial statements provide reconciliations of the non-GAAP financial measures that the company uses in this earnings release to the most directly comparable measures calculated in accordance with GAAP. The company uses non-GAAP financial measures to evaluate financial performance, develop budgets, manage expenditures, and determine employee compensation. The company’s presentation of this additional information is not to be considered as a substitute for or superior to the directly comparable measures as reported in accordance with GAAP.
The company defines EBITDA (1) as net income before interest, taxes, depreciation, and amortization. The table below presents a reconciliation of EBITDA (1) to Net Income (Loss), the most directly comparable GAAP measure. EBITDA (1) is a non-GAAP financial performance measure that is not to be considered a substitute for or superior to the directly comparable measures reported in accordance with GAAP. The company defines Adjusted EBITDA (1) as EBITDA (1) before gains or losses on the disposition of assets,before debt modification costs, before changes in the estimated fair value of contingent earn-out consideration, before impairments, before net miscellaneous income and expenses, before (gain) loss on early retirement of long-term debt, and before non-cash compensation expense. The table below presents a reconciliation of Adjusted EBITDA (1) to Net Income (Loss), the most directly comparable GAAP measure. Adjusted EBITDA (1) is a non-GAAP financial performance measure that is not to be considered a substitute for or superior to the directly comparable measures reported in accordance with GAAP.