Salem Media Group is America’s leading multimedia company specializing in Christian and conservative content, with media properties comprising radio, digital media and book and newsletter publishing. Each day Salem serves a loyal and dedicated audience of listeners and readers numbering in the millions nationally. With its unique programming focus, Salem provides compelling content, fresh commentary and relevant information from some of the most respected figures across the Christian and conservative media landscape.
Michael Kupinski, Director of Research, Noble Capital Markets, Inc.
Patrick McCann, Research Associate, Noble Capital Markets, Inc.
Refer to the full report for the price target, fundamental analysis, and rating.
Q4 beats expectations. The company reported revenue of $68.8 million, beating our estimate of $66.6 million by 3.3%. Adj. EBITDA of $7.3 million exceeded our estimate of $6 million by 21.3%. The favorable surprise in operating results was attributed to stronger than expected, high margin, political revenue of $2.1 million.
Favorable refinancing. The company is issuing $44.7 million new 7.125% notes that mature in 2028 to replace its 6.75% notes due in 2024. The agreement would allow the company to access $4 million to pay down its revolver. The agreement is expected to close by the end of the month.
Equity Research is available at no cost to Registered users of Channelchek. Not a Member? Click ‘Join’ to join the Channelchek Community. There is no cost to register, and we never collect credit card information.
This Company Sponsored Research is provided by Noble Capital Markets, Inc., a FINRA and S.E.C. registered broker-dealer (B/D).
*Analyst certification and important disclosures included in the full report. NOTE: investment decisions should not be based upon the content of this research summary. Proper due diligence is required before making any investment decision.
Energy Fuels is a leading U.S.-based uranium mining company, supplying U3O8 to major nuclear utilities. Energy Fuels also produces vanadium from certain of its projects, as market conditions warrant, and is ramping up commercial-scale production of REE carbonate. Its corporate offices are in Lakewood, Colorado, near Denver, and all its assets and employees are in the United States. Energy Fuels holds three of America’s key uranium production centers: the White Mesa Mill in Utah, the Nichols Ranch in-situ recovery (“ISR”) Project in Wyoming, and the Alta Mesa ISR Project in Texas. The White Mesa Mill is the only conventional uranium mill operating in the U.S. today, has a licensed capacity of over 8 million pounds of U3O8 per year, has the ability to produce vanadium when market conditions warrant, as well as REE carbonate from various uranium-bearing ores. The Nichols Ranch ISR Project is on standby and has a licensed capacity of 2 million pounds of U3O8 per year. The Alta Mesa ISR Project is also on standby and has a licensed capacity of 1.5 million pounds of U3O8 per year. In addition to the above production facilities, Energy Fuels also has one of the largest NI 43-101 compliant uranium resource portfolios in the U.S. and several uranium and uranium/vanadium mining projects on standby and in various stages of permitting and development. The primary trading market for Energy Fuels’ common shares is the NYSE American under the trading symbol “UUUU,” and the Company’s common shares are also listed on the Toronto Stock Exchange under the trading symbol “EFR.” Energy Fuels’ website is www.energyfuels.com.
Michael Heim, CFA, Senior Research Analyst, Noble Capital Markets, Inc.
Refer to the full report for the price target, fundamental analysis, and rating.
Report full of future promise. UUUU’s press release was full of previously announced news items: Rare Earth Element (REE) progress, signed uranium sales contracts, vanadium inventory sales, Alta Mesa sale, etc. At the same time, production levels have been lagging behind expectations for a variety of reasons including economic conditions, supply issues, etc. Management is clearly focused on developing REE separation operations which it sees as a late 2023/early 2024 event. It is also prepping uranium mines for eventual production.
Production not there yet. The company has yet to resume mining uranium. It signed sales contracts to deliver uranium but is meeting those obligations with inventory or uranium purchases. We initially had hoped uranium operations would have resumed by 2023. REE Carbonate sales to the NEO plant in Estonia are being completed but at levels below initial expectations due to limited Monzanite supply issues. We had also hoped to see vanadium production resume by the end of the year.
Equity Research is available at no cost to Registered users of Channelchek. Not a Member? Click ‘Join’ to join the Channelchek Community. There is no cost to register, and we never collect credit card information.
This Company Sponsored Research is provided by Noble Capital Markets, Inc., a FINRA and S.E.C. registered broker-dealer (B/D).
*Analyst certification and important disclosures included in the full report. NOTE: investment decisions should not be based upon the content of this research summary. Proper due diligence is required before making any investment decision.
Without the Fed’s easy money, demand for housing would collapse, according to Ryan McMaken. McMaken, who authored the below article, is a former housing economist for the State of Colorado. He believes once the Fed pivots back to forcing down interest rates and again buying mortgage-backed securities (MBS), housing prices that have recently dipped, will again continue their march upward. He makes the case here that the housing market, without Fed support, faces difficult headwinds. – Paul Hoffman, Managing Editor, Channelchek
Last Friday, residential real estate brokerage firm Redfin released new data on home prices, showing that prices fell 0.6 percent in February, year over year. According to Redfin’s numbers, this was the first time that home prices actually fell since 2012. The year-over-year drop was pulled down by especially large declines in five markets: Austin (-11%), San Jose, California (-10.9%), Oakland (-10.4%), Sacramento (-7.7%), and Phoenix (-7.3%). According to Redfin, the typical monthly mortgage payment is now at a record high of $2,520.
The Redfin numbers come a few days before new numbers from the Case-Shiller home price index showing further slowing in home prices growth since late last year. The market’s expectation for December’s 20-city index had been -0.5 percent, month over month, and 5.8 percent, year over year. But the numbers came in worse (from the seller’s perspective) than was hoped. For December—the most recent monthly data available—the index ended up showing a month-over-month drop of -1.5 percent (seasonally adjusted), and a year-over-year gain of 4.6 percent (not seasonally adjusted).
By most accounts, the rapidly-slowing market faces headwinds thanks to rising interest rates, including the standard 30-year fixed mortgage, which is now back up over 6 percent. This puts homeownership out of reach for many first-time buyers and is also a big disincentive for current owners to “move-up” into higher-priced houses since any new home would come with a much higher mortgage rate than was available a year ago.
Not surprisingly, demand for new mortgages has plummeted. CNBC reported last week:
“Mortgage applications to purchase a home dropped 6% last week compared with the previous week, according to the Mortgage Bankers Association’s seasonally adjusted index. Volume was 44% lower than the same week one year ago and is now sitting at a 28-year low.”
So, sales have fallen and, at least according to Redfin, prices are falling too. This is what we should expect to see in any environment where the real estate market is not being incessantly fueled by easy money from the central bank. After all, easy money for real estate markets had been the main story since 2009. In recent months, however, the Fed has allowed interest rates to rise while pausing efforts to add more mortgage-backed securities (MBS) to the Fed’s portfolio. Without those key supports from policymakers, the real estate market simply lacks the market demand that is necessary to sustain rapid growth. Contrary to what countless mortgage brokers and real estate agents tell themselves and each other, there is precious little capitalism in real estate markets. It is a market that is thoroughly addicted to, and dependent on, continued stimulus and subsidization from the central bank.
Without the central bank propping up MBS demand in the secondary market, primary-market mortgage lenders have fewer dollars to throw around. That means higher interest rates and fewer eligible buyers. Similarly, by setting a higher target rate for the federal funds rate that banks must pay to manage liquidity, markets face less monetary growth in general. That comes with a lessening overall demand that—in the short term, at least—drives up incomes for both current and potential homebuyers.
Even worse, continued nominal income growth that does exist is not keeping up with price inflation. The result has been 22 months in a row of negative real wage growth, and that will translate to falling demand.
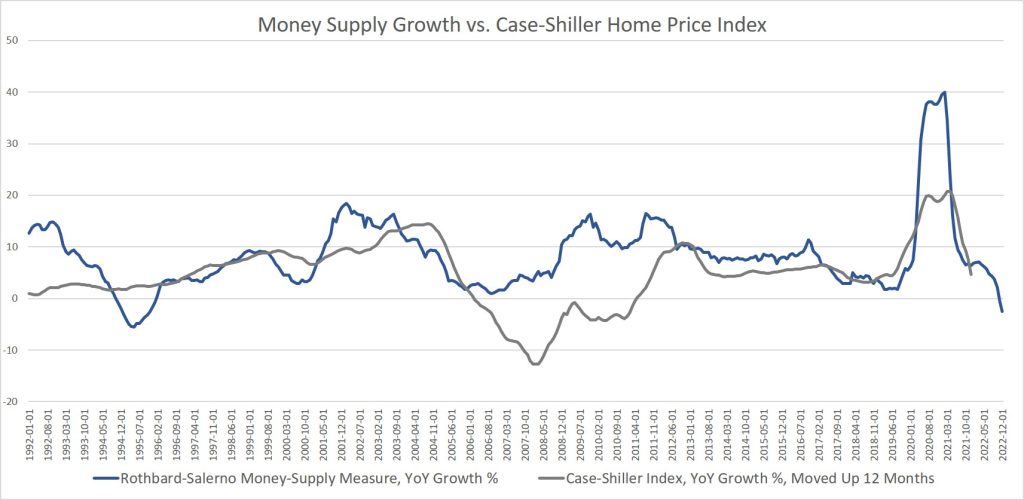
This close connection between easy money and demand for homes can be seen when we compare growth in the Case-Shiller index to growth in the money supply. This has been especially the case since 2009. As the graph shows, once money-supply growth begins to slow, a similar change occurs in home prices one year later.
As money-supply growth rapidly slowed after January 2021, we then saw a similar trend in home prices 12 months later, with a rapid deceleration in the Case-Shiller index. Remarkably, in November of last year, money-supply growth turned negative for the first time since 1994. That points toward continued drops in home prices throughout this year. If Redfin’s February numbers are any indicator, we should expect price growth to turn negative in the Case-Shiller numbers this spring.
Now just imagine how much more lackluster real estate markets would be without the Fed buying up all those trillions in MBS over the past decade. It’s now been more than a decade since we had any idea what real estate prices actually would be without enormous amounts of stimulus from the Fed. The money-printing-for-mortgages scheme entered its first phase throughout 2009 and 2010, and then was almost non-stop from 2013 to 2022, topping out around $1.7 trillion in 2018. The Fed had begun to pull back on its MBS assets in 2018 and 2019, but of course reversed course in 2020 and engaged in a frenzy of new MBS buying. In that period the Fed purchased an additional $1.4 trillion in MBS. That finally ended (for now) in the fall of 2022. The Fed still holds over $2.6 trillion in MBS assets.
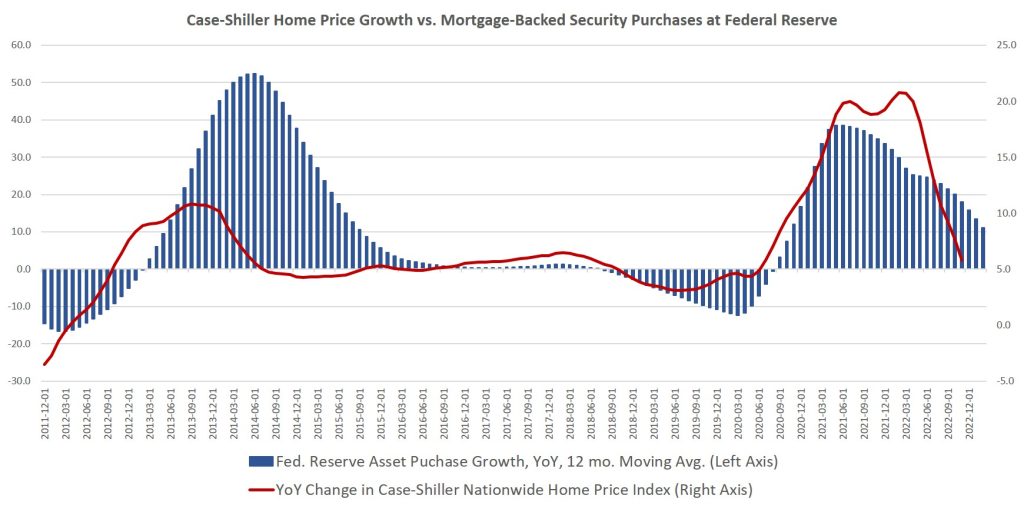
If we look at year-over-year changes in these MBS purchases along side Case-Shiller home prices, we again see a clear correlation:
It’s clear that once markets think the Fed may again increase its MBS purchases, home prices again surge. This close relationship should not surprise us since the volume of MBS purchases is a sizable portion of the overall market. Since 2020, the Fed’s MBS stockpile has equaled at least 20 percent of all the household mortgage debt in the United States. In early 2022, Fed-held MBS assets peaked at 24 percent of all US mortgage debt, but they still made up over 20 percent of the market as of late 2022.
Lest we think that real estate markets seem to be weathering the storm fairly well, let’s keep in mind this is all happening during a period when the unemployment rate is very low. Yes, the federal government has greatly exaggerated the amount of job growth that has occurred in the economy over the past 18 months. However, it’s also fairly clear that real estate markets are not yet seeing large numbers of unemployed workers who can’t pay their mortgages. When that does occur, we can expect an acceleration in falling home prices. For now, most mortgages are being paid, and even as real wages fall, most homeowners are cutting in places other than their mortgage payments. Once job losses do set in, all bets are off, and a wave of foreclosures will be likely. Many jobless workers won’t be able to sell quickly to avoid foreclosure either. With so few borrowers who can afford rising mortgage rates, there will be relatively few buyers. That’s when prices will really start to come down—when there is a mixture of motivated sellers and rising interest rates.
For now, though, the investor class remains relatively optimistic. Marcus Millichap CEO Hessam Nadji was on Fox Business last week flogging the now well-worn narrative that we should expect a “small recession,” but Nadji did not even entertain the idea that there might be sizable layoffs. Instead, he suggested that there is now a mere temporary softening of demand, and that will reverse itself once the Fed reverses course and embraces easy money again. In other words, the Fed will time everything perfectly, and it will be a “soft landing.”
This well captures the attitude of the “capitalists” heading the real estate industry right now. It’s all about the Fed. Without the Fed’s easy money, demand is down. Once the Fed pivots back to forcing down interest rates and buying up more MBS, well then happy times are here again. Gone is any discussion of worker productivity, savings, or other fundamentals that would drive demand in a areal capitalist market. All that matters now is a return to easy money. The real estate industry will get increasingly desperate for it. In 2023, it’s become the very foundation of their “market.”
About the Author
Ryan McMaken has a bachelors degree in economics and a master’s degree in public policy and international relations from the University of Colorado. He is the author of Breaking Away: The Case of Secession, Radical Decentralization, and Smaller Polities and Commie Cowboys: The Bourgeoisie and the Nation-State in the Western Genre. He was a housing economist for the State of Colorado. Ryan is a cohost of the Radio Rothbard podcast, has appeared on Fox News and Fox Business, and has been featured in a number of national print publications including Politico, The Hill, Bloomberg, and The Washington Post.
Image: Director of the Office of Management and Budget Shalanda Young besides President Biden (Credit: The White House, March 2022)
Investor Buy/Sell Patterns Could Change Under Biden Budget Proposals
The White House’s annual budget request to Congress has the power to move market sectors, as it’s a preliminary look at spending priorities and possible revenue sources. This year, alongside the pressure of Congress wrestling with raising the debt limit, the House Ways and Means Committee hearings related to the President’s budget could have a more significant impact than before. Treasury Secretary Janet Yellen will address the House committee on Friday, March 10th, and respond to questions. Taxation and spending priorities of the White House will be further revealed during this exchange.
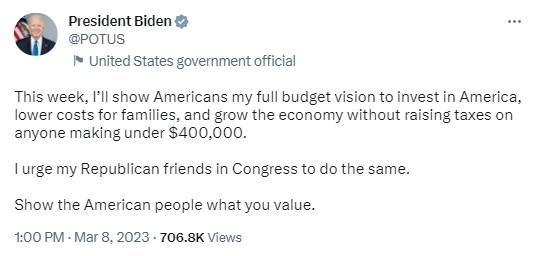
The President’s proposed budget for the 2024 fiscal year proposes cutting the U.S. deficit “by nearly $3 trillion over the next decade,” according to White House Press Secretary Karine Jean-Pierre, this is a much larger number than the $2 trillion mentioned as a goal during the State of the Union address last month. Jean-Pierre explained to reporters that the proposed spending reduction is “something that shows the American people that we take this very seriously,” and it answers, “how do we move forward, not just for Americans today but for … other generations that are going to be coming behind us.”
Source: Twitter
Biden’s requested budget includes a proposal that could impact healthcare as it would grow Medicare financing by raising the Medicare tax rate on earned and investment income to 5% from the current 3.8% for people making more than $400,000 a year.
Railroad safety measures are also included in Biden’s proposal, it asks for millions of additional funding for railroad safety measures spurred by recent derailments. The President also proposes a 5.2% pay raise for federal employees.
The budget deficit would be expected to shrink over ten years in part by raising taxes. One proposal investors should look out for is what has been called the Billionaire Minimum Income Tax. According to a White House brief, it “will ensure that the wealthiest Americans pay a tax rate of at least 20 percent on their full income, including unrealized appreciation. This minimum tax would make sure that the wealthiest Americans no longer pay a tax rate lower than teachers and firefighters.” The tax will apply only to the top 0.01% of American households (those worth over $100 million).
At present, the tax system discourages taking taxable gains on investments to postpone taxes. If adopted by Congress, a 20% tax on the unrealized appreciation of investments could have the effect of altering buying and selling patterns of securities, as well as real estate and other investments.
Jean-Pierre did say that the budget would propose “tax reforms to ensure the wealthy and large corporations pay their fair share while cutting wasteful spending on special interests like big oil and big pharma.” One reform, the White House has been outspoken about is corporate buybacks. He proposes, quadrupling the tax on corporate stock buybacks.
Take Away
The market will get insight beginning the second week of March 2023 into the financial priorities of the White House and thoughts on members of the House Ways and Means Committee. While nothing is set in stone, the White House and Congress would both seem to be on the same side of more fiscal restraint.
And although nothing is close to complete, the discussions and news of debate can have a dramatic impact on markets. For example, investors may be treated to more buybacks if it appears the tax on buybacks will increase in 2024. Another example would be a tax on the appreciated investments of wealthy individuals. It could follow that accounts of these individuals would have an increased incentive to transact than under a system where capital gains are only recognized by the IRS after taken.
IRVING, Texas–(BUSINESS WIRE)– Salem Media Group, Inc. (Nasdaq: SALM) released its results for the three and twelve months ended December 31, 2022.
Fourth Quarter 2022 Results
For the quarter ended December 31, 2022 compared to the quarter ended December 31, 2021:
Consolidated
Total revenue decreased 0.5% to $68.8 million from $69.1 million;
Total operating expenses increased 38.0% to $67.2 million from $48.7 million;
Operating expenses, excluding stock-based compensation expense, debt modification costs, gains and losses on the sale or disposition of assets, legal settlement, impairments, depreciation expense and amortization expense (1) increased 5.7% to $61.6 million from $58.3 million;
Operating income decreased 92.0% to $1.6 million from $20.5 million;
The company had a net loss of $2.2 million, or $0.08 net loss per share compared to net income of $16.8 million, or $0.61 net income per diluted share;
EBITDA (1) decreased 78.5% to $4.9 million from $22.7 million; and
Adjusted EBITDA (1) decreased 33.0% to $7.3 million from $10.8 million.
Broadcast
Net broadcast revenue increased 4.5% to $53.3 million from $51.0 million;
Station Operating Income (“SOI”) (1) decreased 17.4% to $10.1 million from $12.3 million;
Same Station (1) net broadcast revenue increased 4.5% to $53.3 million from $51.0 million; and
Same Station SOI (1) decreased 15.7% to $10.3 million from $12.2 million.
Digital Media
Digital media revenue decreased 10.3% to $10.4 million from $11.6 million; and
Digital Media Operating Income (1) decreased 44.3% to $1.7 million from $3.0 million.
Publishing
Publishing revenue decreased 21.3% to $5.2 million from $6.5 million; and
Publishing Operating Loss (1) was $0.6 million as compared to publishing operating income of $0.2 million.
Included in the results for the quarter ended December 31, 2022 are:
A $2.3 million ($1.7 million, net of tax, or $0.06 per share) impairment charge to the value of broadcast licenses in Columbus, Portland, and San Francisco;
A $0.1 million ($0.1 million, net of tax) loss on the disposal of assets;
A $0.1 million gain on the early retirement of long-term debt associated with the 2024 Notes; and
A $0.1 million non-cash compensation charge related to the expensing of stock options.
Included in the results for the quarter ended December 31, 2021 are:
A $13.0 million ($9.6 million, net of tax, or $0.35 per diluted share) net gain on the disposition of assets relates to a $12.9 million pre-tax gain on the sale of land in Tampa, Florida as well as various other fixed asset disposals;
The company repurchased an additional $38.6 million of the 6.75% senior secured notes due 2024 (“2024 Notes”) for $39.3 million in cash, recognizing a net loss of $1.0 million ($0.7 million, net of tax or $0.03 per share); and
A $0.1 million non-cash compensation charge ($0.1 million, net of tax) related to the expensing of stock options.
Per share numbers are calculated based on 27,216,787 diluted weighted average shares for the quarter ended December 31, 2022, and 27,534,329 diluted weighted average shares for the quarter ended December 31, 2021.
Year to Date 2022 Results
For the twelve months ended December 31, 2022 compared to the twelve months ended December 31, 2021:
Consolidated
Total revenue increased 3.4% to $267.0 million from $258.2 million;
Total operating expenses increased 23.5% to $261.8 million from $212.0 million;
Operating expenses, excluding stock-based compensation expense, debt modification costs, gains and losses on the sale or disposition of assets, legal settlement, impairments, depreciation expense and amortization expense (1) increased 8.3% to $238.2 million from $219.9 million;
The company’s operating income decreased 88.9% to $5.2 million from $46.2 million;
The company recognized $4.1 million in film distribution income from an unconsolidated equity investment;
The company had a net loss of $3.2 million, or $0.12 net loss per share compared to net income of $41.5 million, or $1.52 net income per diluted share;
EBITDA (1) decreased 68.5% to $21.9 million from $69.4 million; and
Adjusted EBITDA (1) decreased 26.7% to $28.1 million from $38.3 million.
Broadcast
Net broadcast revenue increased 7.2% to $205.3 million from $191.4 million;
SOI (1) decreased 9.6% to $41.3 million from $45.7 million;
Same station (1) net broadcast revenue increased 7.2% to $204.9 million from $191.2 million; and
Same station SOI (1) decreased 9.1% to $41.7 million from $45.8 million.
Digital media
Digital media revenue decreased 1.2% to $41.7 million from $42.2 million; and
Digital media operating income (1) decreased 5.4% to $7.9 million from $8.4 million.
Publishing
Publishing revenue decreased 18.9% to $20.0 million from $24.6 million; and
Publishing Operating Loss (1) was $2.2 million compared to publishing operating income of $1.4 million.
Included in the results for the twelve months ended December 31, 2022 are:
A $14.0 million ($10.3 million, net of tax, or $0.38 per share) impairment charge to the value of broadcast licenses in Boston, Chicago, Columbus, Dallas, Greenville, Honolulu, Little Rock, Orlando, Philadelphia, Portland, Sacramento and San Francisco;
A $8.4 million ($6.2 million, net of tax, or $0.23 per diluted share) net gain on the disposition of assets relates primarily to the $6.5 million pre-tax gain on the sale of land used in the company’s Denver, Colorado broadcast operations, the $1.8 million pre-tax gain on sale of land used in the company’s Phoenix, Arizona broadcast operations, and $0.5 million pre-tax gain on the sale of the company’s radio stations in Louisville, Kentucky offset by various fixed asset disposals;
A $48,000 gain on the early retirement of long-term debt associated with the 2024 Notes;
A $4.8 million ($3.5 million, net of tax, or $0.13 per share) legal settlement expense;
A $0.1 million ($0.1 million, net of tax) goodwill impairment charge;
A $0.3 million ($0.2 million, net of tax, or $0.01 per share) charge for debt modification costs; and
A $0.3 million non-cash compensation charge ($0.2 million, net of tax, or $0.01 per share) related to the expensing of stock options.
Included in the results for the twelve months ended December 31, 2021 are:
A $2.5 million ($1.9 million, net of tax, or $0.07 per share) charge for debt modification costs. On September 10, 2021, the company refinanced $112.8 million of the 2024 Notes by exchanging into $114.7 million (reflecting a call premium of 1.688%) of 7.125% Senior Secured Notes due 2028 (“2028 Notes”). The transaction was assessed on a lender-specific level and was accounted for as a debt modification in accordance with ASC 470 with $2.5 million of fees paid to third parties included in operating expenses for the period;
A $23.6 million ($17.4 million, net of tax, or $0.64 per diluted share) net gain on the disposition of assets relates to $12.9 million pre-tax gain on the sale of land in Tampa, Florida, a $10.5 million pre-tax gain on the sale of land in Lewisville, Texas, a $0.5 million pre-tax gain on the sale of Singing News Magazine and Singing News Radio and a $0.1 million pre-tax gain on the sale of the Hilary Kramer Financial Newsletter and related assets that was offset by a $0.4 million of additional costs recorded upon closing on the radio station WKAT-AM and an FM translator in Miami, Florida as well as various other fixed asset disposals;
The company repurchased an additional $43.3 million of the 2024 Notes for $44.0 million in cash, recognizing a net loss of $1.0 million ($0.8 million, net of tax or $0.03 per share); and
A $0.3 million non-cash compensation charge ($0.2 million, net of tax or $0.01 per share) related to the expensing of stock options.
Per share numbers are calculated based on 27,206,434 diluted weighted average shares for the twelve months ended December 31, 2022, and 27,296,618 diluted weighted average shares for the twelve months ended December 31, 2021.
Balance Sheet
As of December 31, 2022, the company had $114.7 million outstanding on the 7.125% senior secured notes due 2028 (“2028 Notes”), $39.0 million outstanding on 6.75% senior secured notes due 2024 (“2024 Notes”) and $9.0 million outstanding balance on the ABL facility.
Acquisitions and Divestitures
The following transactions were completed since October 1, 2022:
On February 1, 2023, the company acquired the George Gilder Report and other digital newsletters and related website assets. The company assumed the deferred subscription liabilities paying no cash at the time of closing. The purchase price is 25% of net revenue generated from sales of most Eagle Financial products during the next year to people who are on George Gilder subscriber lists that are not already on Eagle Financial lists.
On January 10, 2023 the company closed on the acquisition of radio stations WWFE-AM, WRHC-AM and two FM translators in Miami, Florida for $3.0 million. The Asset Purchase Agreement (“APA”) was amended for Salem to acquire only the radio stations and translators for $3.0 million, a related party to acquire the land directly from the seller for $2.0 million, and Salem to have an option to purchase the land from the related party pursuant to an option to purchase real estate agreement. Salem’s executive officers, who have no relationship with the related party, began negotiations for the related party lease agreements and option agreements, subject to final approval by Salem’s Audit Committee pursuant to its related party transaction policy. The option to purchase real estate agreement was approved by Salem’s Audit Committee on March 1, 2023.
On January 6, 2023 the company closed on the acquisition of radio station WMYM-AM and an FM translator in Miami, Florida for $3.2 million. The company began operating the radio station under a Time Brokerage Agreement beginning on November 16, 2022. The APA was amended for Salem to acquire only the radio station and translator for $3.2 million, a related party to acquire the land directly from the seller for $1.8 million, and Salem to have an option to purchase the land from the related party pursuant to an option to purchase real estate agreement. Salem’s executive officers, who have no relationship with the related party, began negotiations for the related party lease agreements and option agreements, subject to final approval by Salem’s Audit Committee pursuant to its related party transaction policy. The option to purchase real estate agreement was approved by Salem’s Audit Committee on March 1, 2023
On December 30, 2022, the company acquired the book inventory and publishing rights of ISI Publishing for $0.4 million of cash.
On December 1, 2022, the company acquired radio station KKOL-AM in Seattle, Washington for $0.5 million. The company paid $0.4 million of cash at closing and $0.1 million of cash into an escrow account and began operating the station under a Local Marketing Agreement on June 7, 2021.
On October 1, 2022, the company acquired websites and the related assets of DayTradeSPY, a financial publication, for $0.6 million in cash. As part of the purchase agreement, the company may pay up to an additional $1.0 million of cash in contingent earn-out consideration within one-year of the closing date based on the achievement of certain revenue benchmarks.
Conference Call Information
Salem will host a teleconference to discuss its results on March 8, 2023 at 4:00 p.m. Central Time. To access the teleconference, please dial (888) 770-7291, and then ask to be joined into the Salem Media Group Fourth Quarter 2022 call or listen via the investor relations portion of the company’s website, located at investor.salemmedia.com. A replay of the teleconference will be available through March 22, 2023 and can be heard by dialing (800) 770-2030, passcode 2413416 or on the investor relations portion of the company’s website, located at investor.salemmedia.com.
Follow us on Twitter @SalemMediaGrp.
First Quarter 2023 Outlook
For the first quarter of 2023, the company is projecting total revenue to be between flat and a decline of 2% from the first quarter 2022 total revenue of $62.6 million. The company is also projecting operating expenses before gains or losses on the sale or disposal of assets, stock-based compensation expense, legal settlement, changes in the estimated fair value of contingent earn-out consideration, impairments, depreciation expense and amortization expense (“Recurring Operating Expenses”) to increase between 7% and 10% compared to the first quarter of 2022 Recurring Operating Expenses of $55.8 million.
A reconciliation of Recurring Operating Expenses to the most directly comparable GAAP measure is not available without unreasonable efforts on a forward-looking basis due to the potential high variability, complexity and low visibility with respect to the charges excluded from this non-GAAP financial measure, in particular, the change in the estimated fair value of earn-out consideration, impairments and gains or losses from the disposition of fixed assets. The company expects the variability of the above charges may have a significant, and potentially unpredictable, impact on its future GAAP financial results.
About Salem Media Group, Inc.
Salem Media Group is America’s leading multimedia company specializing in Christian and conservative content, with media properties comprising radio, digital media and book and newsletter publishing. Each day Salem serves a loyal and dedicated audience of listeners and readers numbering in the millions nationally. With its unique programming focus, Salem provides compelling content, fresh commentary and relevant information from some of the most respected figures across the Christian and conservative media landscape. Learn more about Salem Media Group, Inc. at www.salemmedia.com, Facebook and Twitter.
Forward-Looking Statements
Statements used in this press release that relate to future plans, events, financial results, prospects or performance are forward-looking statements as defined under the Private Securities Litigation Reform Act of 1995. Actual results may differ materially from those anticipated as a result of certain risks and uncertainties, including but not limited to the ability of Salem to close and integrate announced transactions, market acceptance of Salem’s radio station formats, competition from new technologies, inflation and other adverse economic conditions, and other risks and uncertainties detailed from time to time in Salem’s reports on Forms 10-K, 10-Q, 8-K and other filings filed with or furnished to the Securities and Exchange Commission. Readers are cautioned not to place undue reliance on these forward-looking statements, which speak only as of the date hereof. Salem undertakes no obligation to update or revise any forward-looking statements to reflect new information, changed circumstances or unanticipated events.
(1) Regulation G
Management uses certain non-GAAP financial measures defined below in communications with investors, analysts, rating agencies, banks and others to assist such parties in understanding the impact of various items on its financial statements. The company uses these non-GAAP financial measures to evaluate financial results, develop budgets, manage expenditures and as a measure of performance under compensation programs.
The company’s presentation of these non-GAAP financial measures should not be considered as a substitute for or superior to the most directly comparable financial measures as reported in accordance with GAAP.
Regulation G defines and prescribes the conditions under which certain non-GAAP financial information may be presented in this earnings release. The company closely monitors EBITDA, Adjusted EBITDA, Station Operating Income (“SOI”), Same Station net broadcast revenue, Same Station broadcast operating expenses, Same Station Operating Income, Digital Media Operating Income, Publishing Operating Income (Loss), and operating expenses excluding gains or losses on the disposition of assets, stock-based compensation, changes in the estimated fair value of contingent earn-out consideration, impairments, depreciation and amortization, all of which are non-GAAP financial measures. The company believes that these non-GAAP financial measures provide useful information about its core operating results, and thus, are appropriate to enhance the overall understanding of its financial performance. These non-GAAP financial measures are intended to provide management and investors a more complete understanding of its underlying operational results, trends and performance.
The company defines Station Operating Income (“SOI”) as net broadcast revenue minus broadcast operating expenses. The company defines Digital Media Operating Income as net Digital Media Revenue minus Digital Media Operating Expenses. The company defines Publishing Operating Income (Loss) as net Publishing Revenue minus Publishing Operating Expenses. The company defines EBITDA as net income before interest, taxes, depreciation, and amortization. The company defines Adjusted EBITDA as EBITDA before gains or losses on the disposition of assets, before debt modification costs, before changes in the estimated fair value of contingent earn-out consideration, before impairments, before net miscellaneous income and expenses, before (gain) loss on early retirement of long-term debt and before non-cash compensation expense. SOI, Digital Media Operating Income, Publishing Operating Income (Loss), EBITDA and Adjusted EBITDA are commonly used by the broadcast and media industry as important measures of performance and are used by investors and analysts who report on the industry to provide meaningful comparisons between broadcasters. SOI, Digital Media Operating Income, Publishing Operating Income (Loss), EBITDA and Adjusted EBITDA are not measures of liquidity or of performance in accordance with GAAP and should be viewed as a supplement to and not a substitute for or superior to its results of operations and financial condition presented in accordance with GAAP. The company’s definitions of SOI, Digital Media Operating Income, Publishing Operating Income (Loss), EBITDA and Adjusted EBITDA are not necessarily comparable to similarly titled measures reported by other companies.
The company defines Same Station net broadcast revenue as broadcast revenue from its radio stations and networks that the company owns or operates in the same format on the first and last day of each quarter, as well as the corresponding quarter of the prior year. The company defines Same Station broadcast operating expenses as broadcast operating expenses from its radio stations and networks that the company owns or operates in the same format on the first and last day of each quarter, as well as the corresponding quarter of the prior year. The company defines Same Station SOI as Same Station net broadcast revenue less Same Station broadcast operating expenses. Same Station operating results include those stations that the company owns or operates in the same format on the first and last day of each quarter, as well as the corresponding quarter of the prior year. Same Station operating results for a full calendar year are calculated as the sum of the Same Station-results for each of the four quarters of that year. The company uses Same Station operating results, a non-GAAP financial measure, both in presenting its results to stockholders and the investment community, and in its internal evaluations and management of the business. The company believes that Same Station operating results provide a meaningful comparison of period over period performance of its core broadcast operations as this measure excludes the impact of new stations, the impact of stations the company no longer owns or operates, and the impact of stations operating under a new programming format. The company’s presentation of Same Station operating results are not intended to be considered in isolation or as a substitute for the financial information prepared and presented in accordance with GAAP. The company’s definition of Same Station operating results is not necessarily comparable to similarly titled measures reported by other companies.
For all non-GAAP financial measures, investors should consider the limitations associated with these metrics, including the potential lack of comparability of these measures from one company to another.
The Supplemental Information tables that follow the condensed consolidated financial statements provide reconciliations of the non-GAAP financial measures that the company uses in this earnings release to the most directly comparable measures calculated in accordance with GAAP. The company uses non-GAAP financial measures to evaluate financial performance, develop budgets, manage expenditures, and determine employee compensation. The company’s presentation of this additional information is not to be considered as a substitute for or superior to the directly comparable measures as reported in accordance with GAAP.
Net revenues totaled $500.0 million for the fiscal year
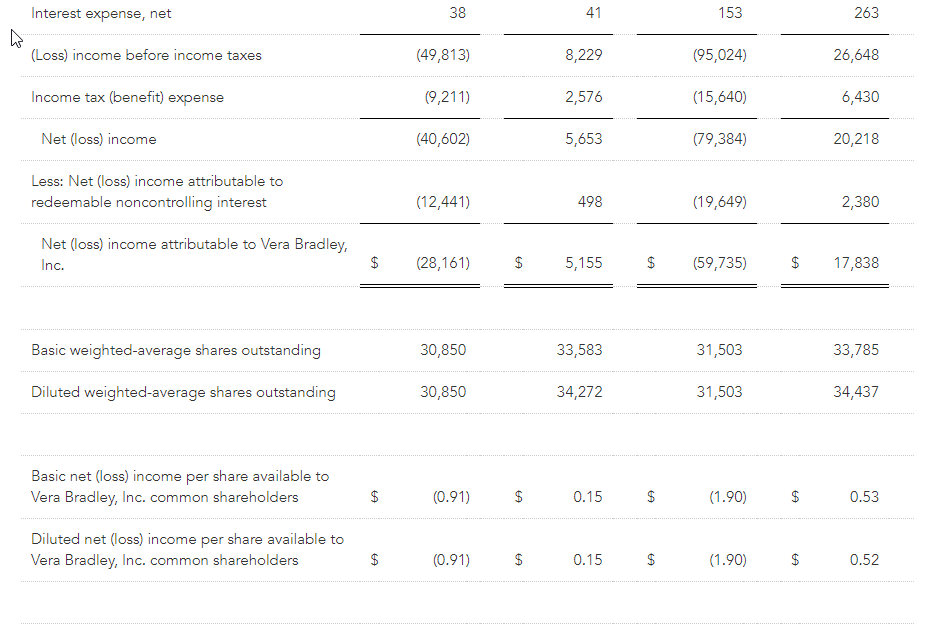
Net loss totaled ($59.7) million, or ($1.90) per diluted share, for fiscal year; excluding certain items, non-GAAP net income totaled $7.6 million, or $0.24 per diluted share
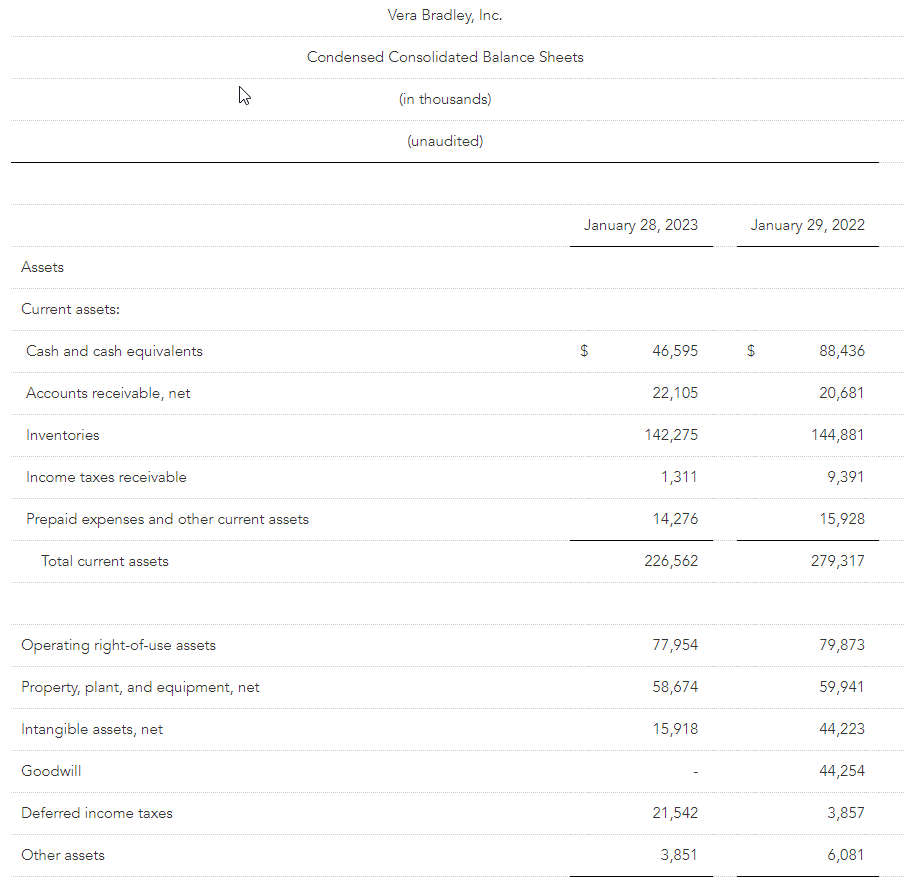
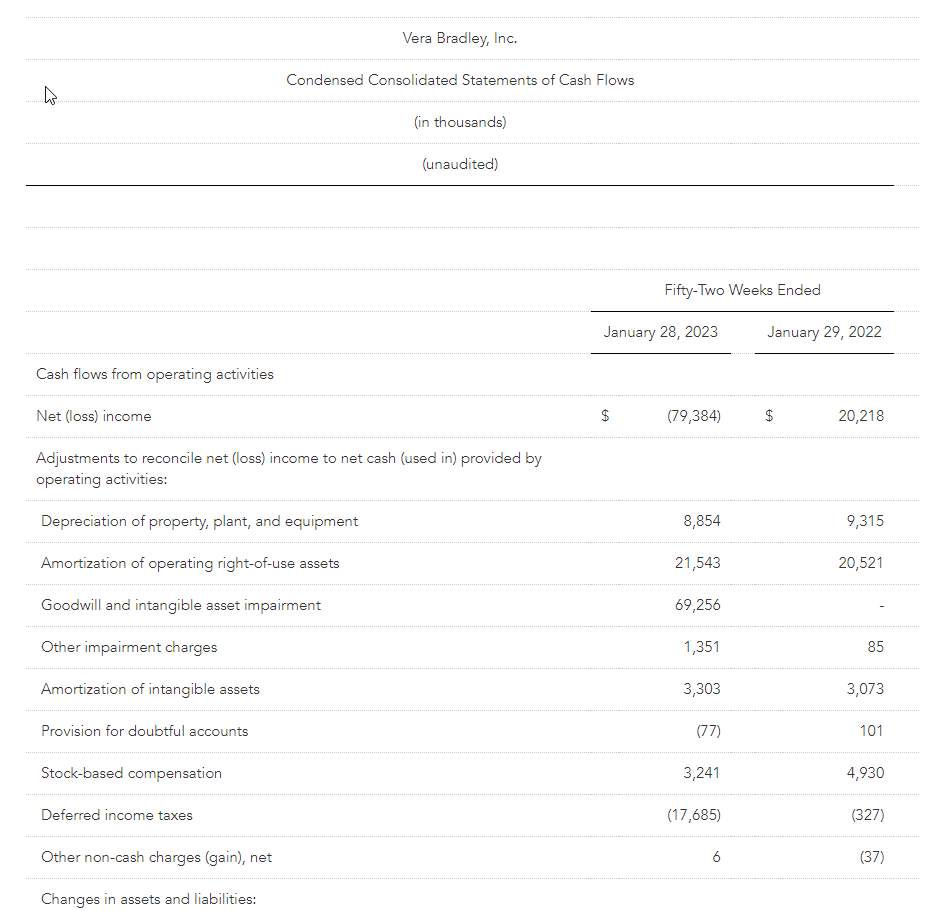
Balance sheet remains strong, with cash and cash equivalents of $46.6 million and no debt
Management provides guidance for fiscal year ending February 3, 2024
FORT WAYNE, Ind., March 08, 2023 (GLOBE NEWSWIRE) — Vera Bradley, Inc. (Nasdaq: VRA) (or the “Company”) today announced its financial results for the fourth quarter and fiscal year ended January 28, 2023 (“Fiscal 2023”).
In this release, Vera Bradley, Inc. or “the Company” refers to the entire enterprise and includes both the Vera Bradley and Pura Vida brands. “Vera Bradley” on a stand-alone basis refers only to the Vera Bradley brand.
Fourth Quarter and Fiscal Year Comments
Jackie Ardrey, Chief Executive Officer of the Company, noted, “We focused on driving revenues in the fourth quarter through targeted, strategic promotions on seasonal, giftable, and key items. As a result, total Company fourth quarter revenues outperformed our guidance, although gross margins remained under pressure. Diligent expense control enabled us to deliver fourth quarter non-GAAP diluted EPS of $0.16, which was nearly flat with last year.
“In the fourth quarter, sales trends at both Vera Bradley and Pura Vida improved over prior quarters, with Vera Bradley total sales down just 1% and Pura Vida sales down less than 5% on a year-over-year basis. For the fourth consecutive quarter, the Vera Bradley Indirect Channel experienced year-over-year revenue growth. Targeted customer retention efforts led to increased Vera Bradley e-commerce revenues, while Full-Line and Factory store revenues continued to be negatively affected by traffic levels, although trends improved throughout the quarter.”
Ardrey continued, “At Pura Vida, e-commerce trends improved over previous quarters due to strategic promotions; however, overall challenges continued to persist in our social and digital media effectiveness coupled with rising digital media costs. And, we experienced a year-over-year sales decline in our wholesale channel. On the plus side, Pura Vida Full-Line retail stores continued to perform ahead of our expectations, and they drove improved e-commerce traffic and revenues in their markets.
“We also took the opportunity in the fourth quarter to reset and appropriately position the Pura Vida business for the future, by recording goodwill and tradename impairments and necessary inventory write-offs.
“We ended the fiscal year with consolidated revenues of $500 million. During the year, we began to see stabilization in our supply chain, diligently controlled our expenses, and carefully managed our cash. During the fourth quarter, we meaningfully reduced our year-end inventory levels from the third quarter.”
Ardrey added, “Although Fiscal 2023 had its challenges, we took actions and laid the groundwork to position the Company for the future.
“On a corporate basis:
In mid-2022, we collaboratively identified $25 million in annualized cost-reduction initiatives and efficiency processes. The expense savings were derived across various areas of the Company, including payroll reductions, retail store efficiencies, marketing expenses, information technology contracts and projects, professional services, and logistics and operational costs. Many of the savings were realized in Fiscal 2023.
In January 2023, we further streamlined our corporate structure by eliminating the positions of Vera Bradley Brand President, Chief Creative Officer, and Chief Revenue Officer, and by adding the position of Chief Marketing Officer, designed to drive additional annual cost savings of approximately $2 million, add more focus on marketing and merchandising, and position the Company to deliver steady top- and bottom-line growth. These decisions were made in order to right-size our leadership team and cost structure for the size of our business, to address the continuing challenging macro environment, and to best position us to achieve our long-term strategic plans.
Subsequent to the end of Fiscal 2023, in January 2023, we acquired the remaining 25% interest in Pura Vida from founders Griffin Thall and Paul Goodman for $10 million.
We continued to make investments in customer data science, business analytics, and pricing optimization, allowing us to collect and analyze data and make fact-based decisions to more efficiently run our business.
“At the Vera Bradley brand:
We expanded our robust product innovation pipeline, including launching our Featherweight Collection; continued another year of iconic product collaborations, including with Disney, Harry Potter, and Crocs; and expanded our cozy, sleep, and outerwear collections.
We continued to strengthen and rationalize our store base. We opened five new Factory stores and closed 19 underperforming Full-Line stores and one Factory store, ending the fiscal year with 51 Full-Line and 79 Factory locations. We also continued to expand options for customers to shop, like enhancing our presence in third-party marketplaces and adding boutiques in select high-traffic airports.
“At the Pura Vida brand:
We entered into several high-profile product collaborations, with brands such as Hello Kitty, Disney, and Harry Potter, and expanded our product offerings by launching our demi-fine collection and expanding our assortment of engravable jewelry, all designed to bring new customers to our brand.
We focused on building a more diverse, innovative, effective, and performance-based marketing program to drive Pura Vida e-commerce sales. We began the process of implementing a comprehensive customer data platform to build a single, coherent, complete view of each Pura Vida customer so that we can better target and personalize marketing and become less reliant on third-party marketing. This project is scheduled for completion this spring. We continued to engage our micro influencers, significantly expanded our TikTok presence, launched impactful ads on connected TV, optimized SMS, and aggressively explored other methods to effectively reach our customers.
We opened three new Pura Vida Full-Line stores during the year, bringing our Full-Line store count to four, which collectively are exceeding our expectations. These four stores are playing a role in driving new customer acquisition as we continue to diversify our marketing platforms, and they demonstrate the power a retail presence can have in driving digital sales, omni-channel loyalty, and spending.”
Summary of Financial Performance for the Fourth Quarter
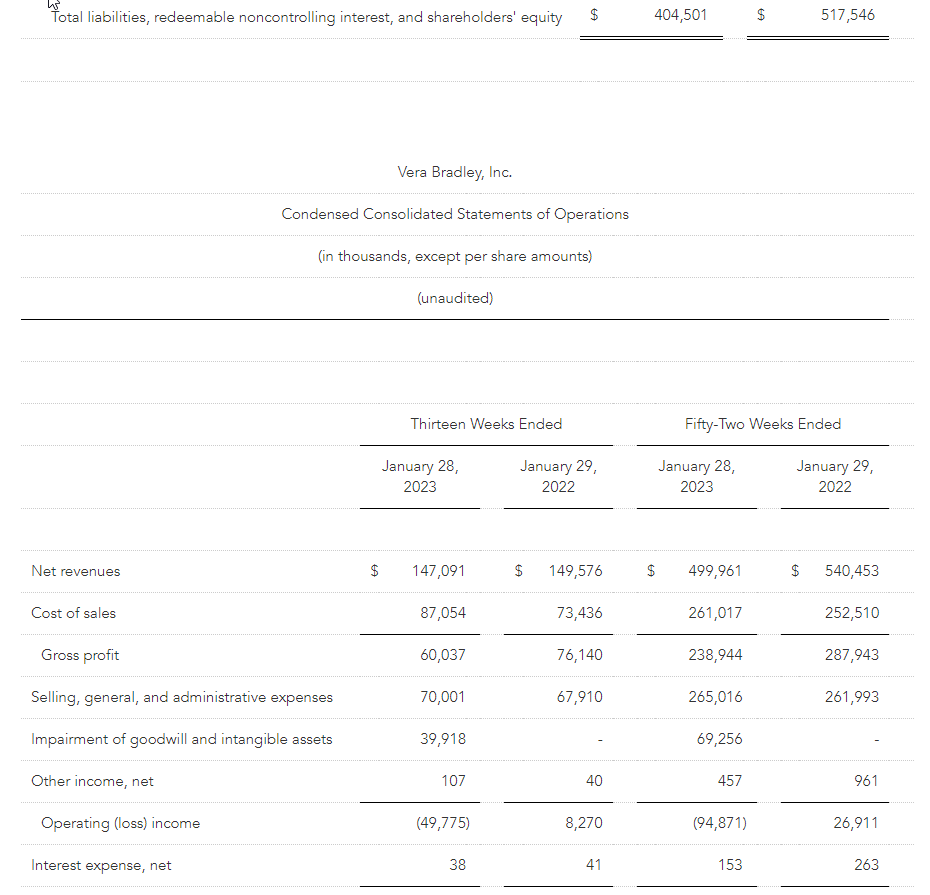
Consolidated net revenues totaled $147.1 million for the current year fourth quarter compared to $149.6 million in the prior year fourth quarter.
For the current year fourth quarter, Vera Bradley, Inc.’s consolidated net loss totaled ($28.2) million, or ($0.91) per diluted share. These results included $33.1 million of net after tax charges, comprised of $22.4 million of goodwill and intangible asset impairment charges; $6.7 million of net inventory and purchase order-related adjustments; $2.4 million of severance, retention, and stock-based retirement compensation charges; $0.8 million related to new CEO sign-on bonus and relocation expenses; $0.5 million for the amortization of definite-lived intangible assets; and $0.3 million of consulting and professional fees primarily associated with strategic initiatives. On a non-GAAP basis, Vera Bradley, Inc.’s consolidated fourth quarter net income totaled $5.0 million, or $0.16 per diluted share.
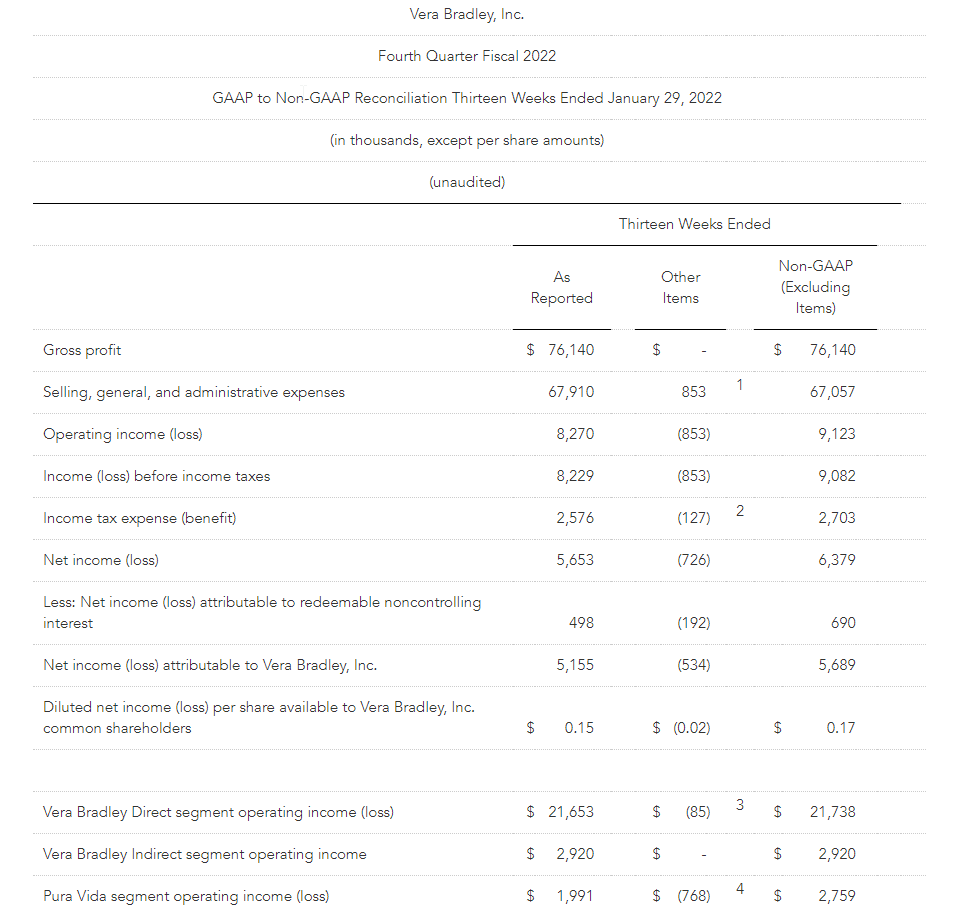
For the prior year fourth quarter, Vera Bradley, Inc. consolidated net income totaled $5.2 million, or $0.15 per diluted share. These results included $0.5 million of net after tax charges primarily related to intangible asset amortization. On a non-GAAP basis, excluding these charges, Vera Bradley, Inc.’s prior year consolidated fourth quarter net income totaled $5.7 million, or $0.17 per diluted share.
Summary of Financial Performance for the Fiscal Year
Consolidated net revenues totaled $500.0 million for Fiscal 2023 compared to $540.5 million for Fiscal 2022.
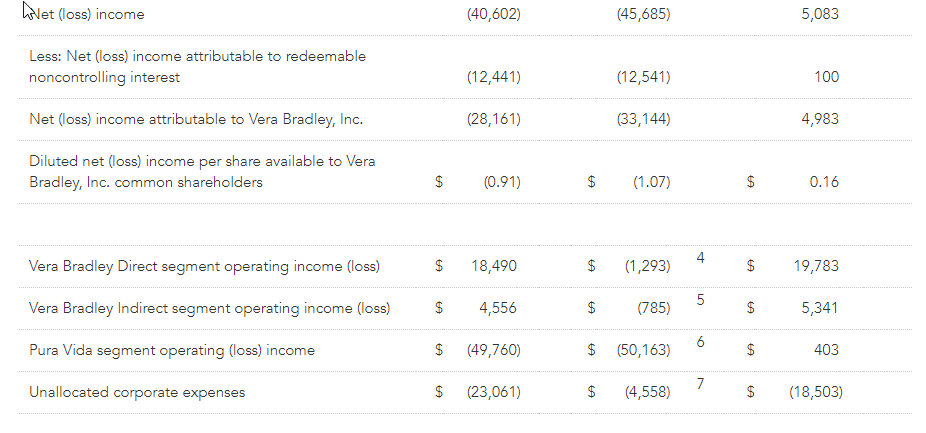
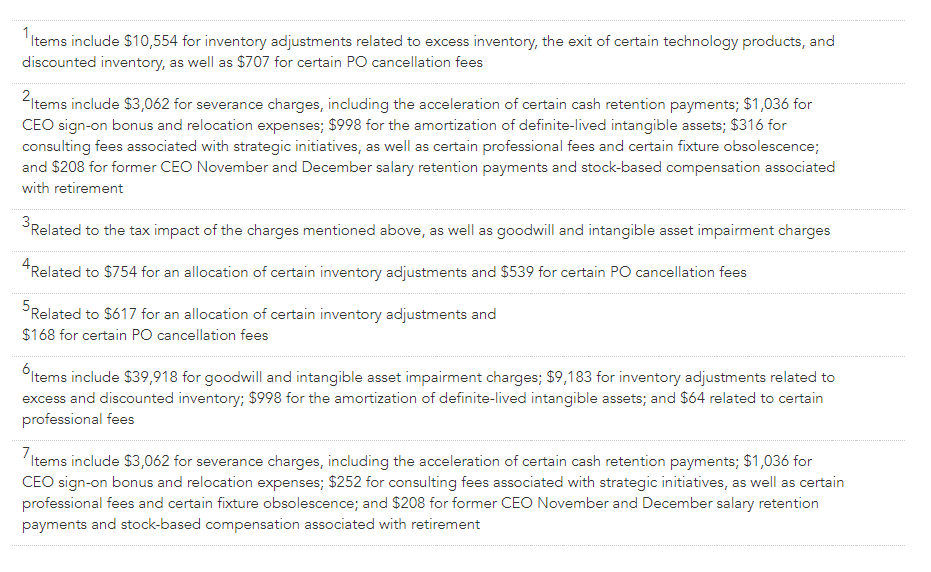
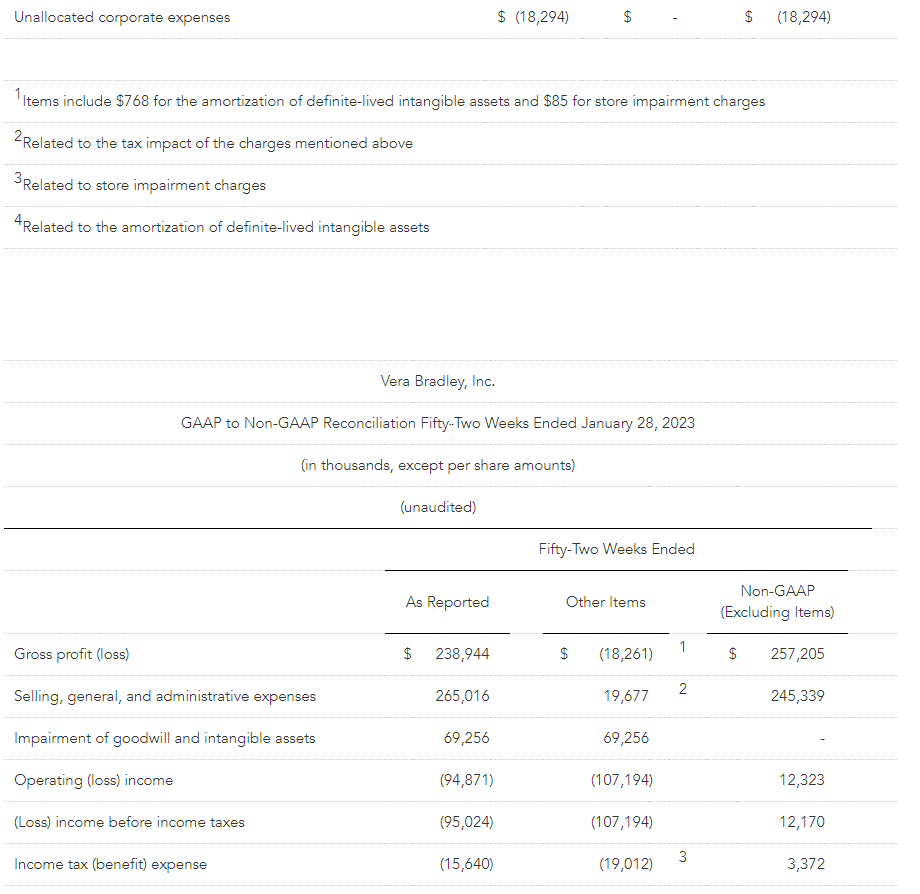
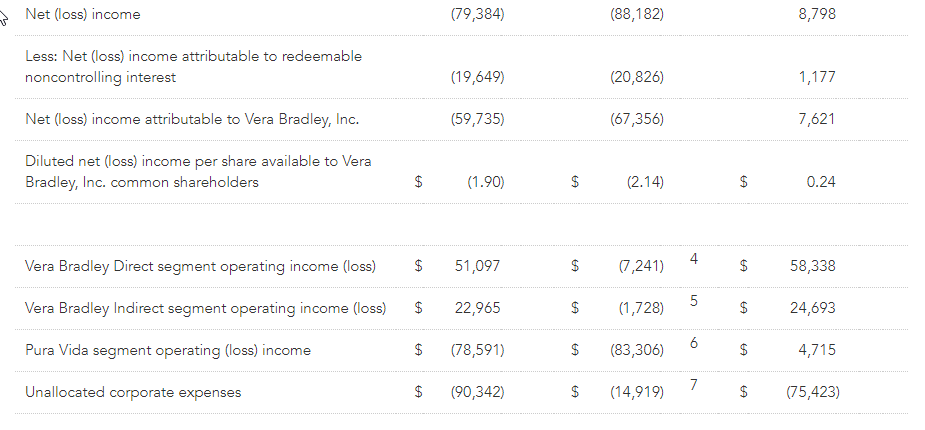
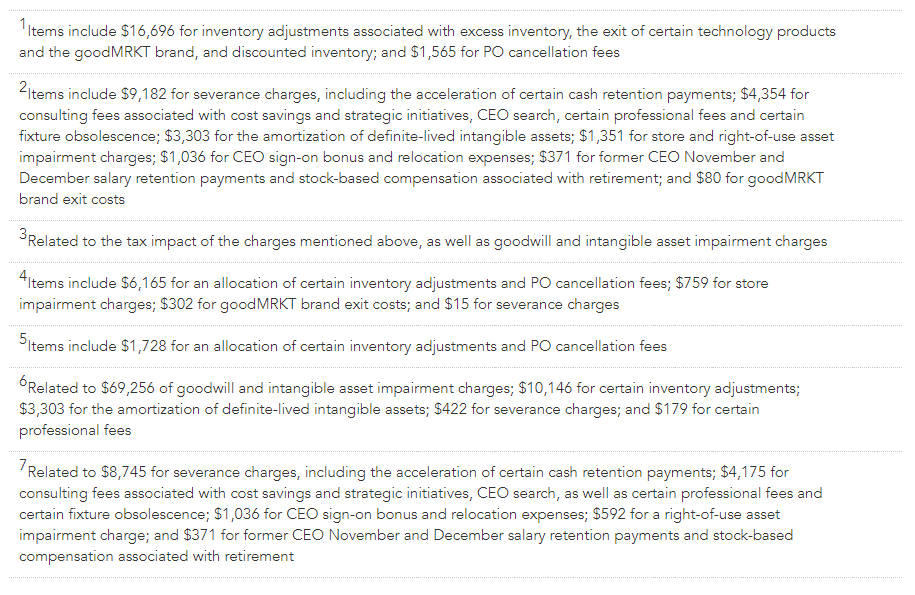
For the current fiscal year, Vera Bradley, Inc.’s consolidated net loss totaled ($59.7) million, or ($1.90) per diluted share. These results included $67.4 million of net after tax charges, comprised of $40.6 million of goodwill and intangible asset impairment charges; $12.2 million of net inventory and purchase order-related adjustments; $7.4 million of severance, retention, and stock-based retirement compensation charges; $3.3 million of consulting and professional fees primarily associated with cost savings initiatives, the CEO search, and strategic initiatives; $1.8 million for the amortization of definite-lived intangible assets; $1.0 million of store and right-of-use asset impairment charges; $0.8 million related to the new CEO sign-on bonus and relocation expenses; and $0.3 million of goodMRKT exit costs. On a non-GAAP basis, Vera Bradley, Inc.’s consolidated net income totaled $7.6 million, or $0.24 per diluted share.
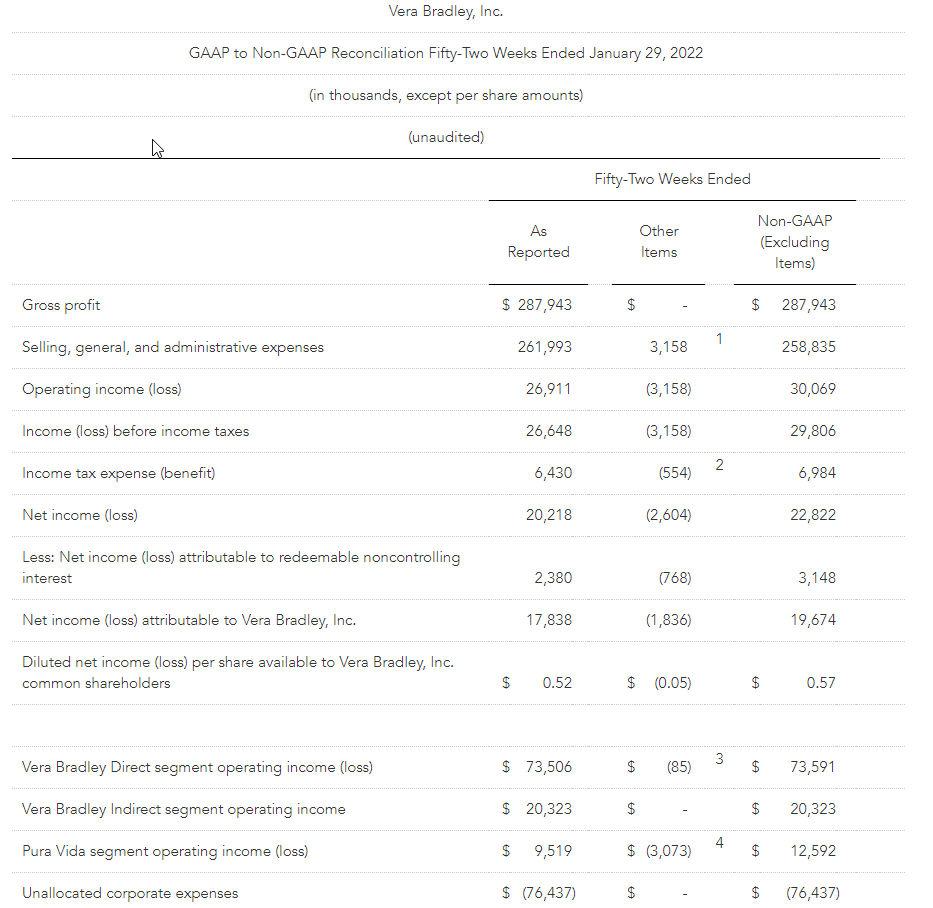
For the prior fiscal year, Vera Bradley, Inc.’s consolidated net income totaled $17.8 million, or $0.52 per diluted share. These results included $1.8 million of net after tax charges primarily related to intangible asset amortization. On a non-GAAP basis, excluding these charges, Vera Bradley, Inc.’s prior year consolidated net income totaled $19.7 million, or $0.57 per diluted share.
Looking Ahead
Ardrey noted, “We are committed to returning Vera Bradley and Pura Vida to profitable growth and generating strong cash flow as a Company, which I believe will deliver value to our shareholders over the long term. Since joining the Company in November, I am more convinced than ever that both brands have enormous potential, and I am very excited about the future of Vera Bradley, Inc. We have a portfolio of two iconic, lifestyle brands; multi-generational customers with remarkable loyalty and devotion; impressive brand recognition; a solid balance sheet; and an extraordinary culture. We have some heavy lifting to do in fiscal 2024, but I am confident that we will emerge a stronger Company.”
Ardrey continued, “At both brands, we are embarking on Project Restoration and will focus on four key pillars – Consumer, Brand, Product, and Channel – to drive this long-term profitable growth.
“At Vera Bradley:
Consumer: We will focus on restoring brand relevancy, targeting casual and feminine 35 to 54 year old women who value both fashion and function.
Brand: We will strategically market our distinctive and unique position as a feminine, fashionable brand that connects with consumers on a deep, emotional level.
Product: We will refocus on core categories and items we are “best at,” by innovating and expanding within our core products. We will elevate our colorful feminine heritage, keeping it distinctive but more trend relevant through updated print and design. We also will innovate into strategic adjacent lifestyle item introductions that make sense for our customers.
Channel: We will accelerate our digital-first focus and online presence, build a balanced footprint that more clearly differentiates Full-Line from Factory stores, and target and/or strengthen relationships with strategically-aligned wholesale partners.
“At Pura Vida:
Consumer: We will sharpen our focus on the care-free 18 to 24 collegiate girl, who both those younger and older aspire to be.
Brand: We will recenter our brand ethos on “living life to the fullest,” with marketing authentically sharing real moments, places, and faces.
Product: We will focus on delivering unique, fun, playful designs that are affordable and accessible with a dominant emphasis on bracelets and jewelry, as well as other strategic, adjacent categories.
Channel: We will have a strong focus on restoring e-commerce growth; strategic growth of wholesale by pursuing larger, more strategic partnerships and expanding larger existing accounts; and refining our existing store model.”
“To support growth and development of our two brands, on a corporate basis, we will continue to make strategic investments in the right talent to help drive the transformation and diligently manage our supply chain, gross margin, SG&A expenses, and cash flow,” Ardrey concluded.
Non-GAAP Numbers
The current year non-GAAP fourth quarter income statement numbers referenced below exclude the previously outlined charges for goodwill and intangible asset impairment; net inventory and purchase order-related adjustments; severance, retention, and stock-based retirement compensation; new CEO sign-on bonus and relocation; amortization of definite-lived intangible assets; and consulting and professional fees primarily associated with strategic initiatives. The current year non-GAAP fiscal year income statement numbers also exclude the previously outlined charges for cost savings initiatives and the CEO search, store and right-of-use asset impairment charges, and goodMRKT exit costs. The prior year non-GAAP fourth quarter and fiscal year income statement numbers referenced below exclude the previously outlined intangible asset amortization and store impairment charges.
Fourth Quarter Details
Current year fourth quarter Vera Bradley Direct segment revenues totaled $99.5 million, a 4.6% decrease from $104.4 million in the prior year fourth quarter. Comparable sales decreased 4.5% from the prior year. The Company permanently closed 19 Full-Line stores and one Factory store and opened five Factory stores in the last twelve months.
Vera Bradley Indirect segment revenues totaled $16.7 million, a 28.5% increase over $13.0 million in the prior year fourth quarter. The increase was broad-based with both specialty and key accounts posting year-over-year sales gains.
Pura Vida segment revenues totaled $30.9 million, a 4.2% decrease from $32.2 million in the prior year fourth quarter. The decline was primarily related to lower wholesale sales, partially offset by new store openings.
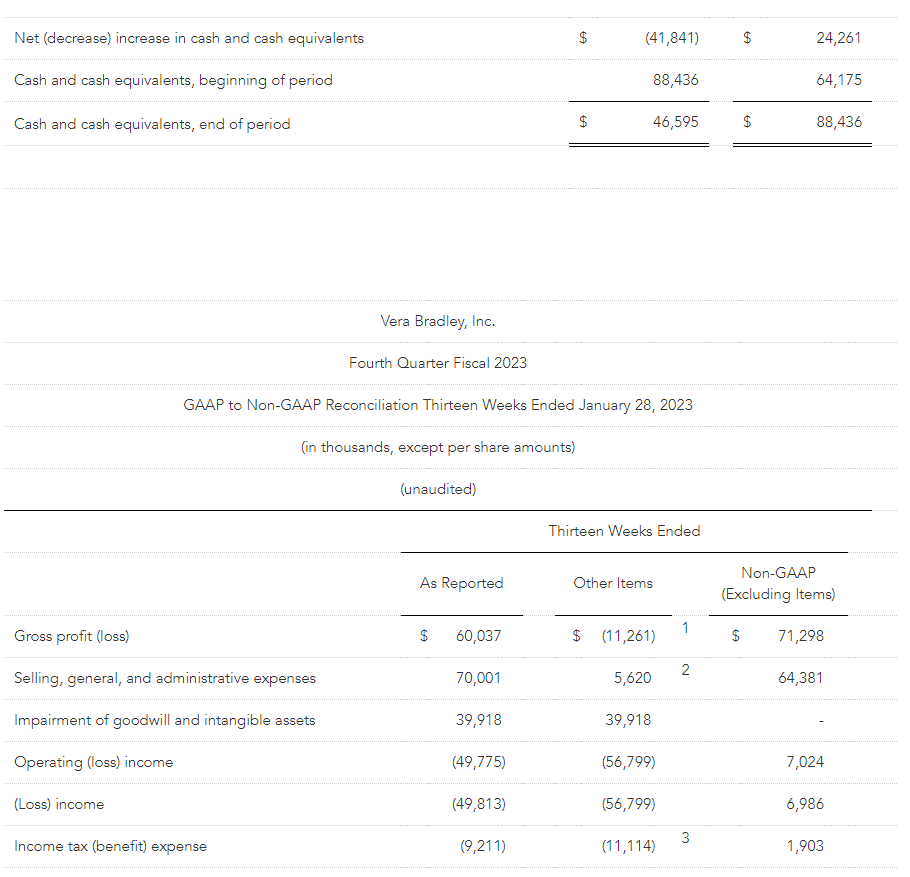
Fourth quarter consolidated gross profit totaled $60.0 million, or 40.8% of net revenues, compared to $76.1 million, or 50.9% of net revenues, in the prior year fourth quarter. On a non-GAAP basis, current year consolidated gross profit totaled $71.3 million, or 48.5% of net revenues. The current year gross profit rate primarily was negatively affected by higher inbound and outbound freight expense and increased promotional activity, partially offset by price increases.
Consolidated SG&A expense totaled $70.0 million, or 47.6% of net revenues, compared to $67.9 million, or 45.4% of net revenues, in the prior year fourth quarter. On a non-GAAP basis, consolidated SG&A expense totaled $64.4 million, or 43.8% of net revenues, compared to $67.1 million, or 44.8% of net revenues, in the prior year fourth quarter. Vera Bradley’s SG&A current year expenses were lower than the prior year primarily due to cost reduction initiatives and a reduction in variable-related expenses due to the lower sales volume.
The Company’s fourth quarter consolidated operating loss totaled ($49.8) million, or (33.8%) of net revenues, compared to operating income of $8.3 million, or 5.5% of net revenues, in the prior year fourth quarter. On a non-GAAP basis, fourth quarter consolidated operating income totaled $7.0 million, or 4.8% of net revenues, compared to $9.1 million, or 6.1% of net revenues, in the prior year.
By segment:
Vera Bradley Direct fourth quarter operating income was $18.5 million, or 18.6% of Direct net revenues, compared to $21.7 million, or 20.7% of Direct net revenues, in the prior year. On a non-GAAP basis, current year Direct fourth quarter operating income was $19.8 million, or 19.9% of Direct net revenues, compared to $21.7 million, or 20.8% of Direct net revenues, in the prior year.
Vera Bradley Indirect fourth quarter operating income was $4.6 million, or 27.3% of Indirect net revenues, compared to $2.9 million, or 22.5% of Indirect net revenues, in the prior year. On a non-GAAP basis, current year Indirect fourth quarter operating income was $5.3 million, or 32.0% of Indirect net revenues.
Pura Vida’s current year fourth quarter operating loss was ($49.8) million, or (161.2%) of Pura Vida net revenues, compared to operating income of $2.0 million, or 6.2% of Pura Vida net revenues, in the prior year. On a non-GAAP basis, Pura Vida’s current year fourth quarter operating income was $0.4 million, or 1.3% of Pura Vida net revenues, compared to $2.8 million, or 8.6% of Pura Vida net revenues, in the prior year.
Details for the Fiscal Year
Vera Bradley Direct segment revenues for the current fiscal year totaled $328.2 million, 7.5% decrease from $354.9 million in the prior year. Comparable sales declined 9.5% for the fiscal year.
Vera Bradley Indirect segment revenues for the fiscal year totaled $73.3 million, an 11.1% increase over $66.0 million in the prior year, primarily reflecting an increase in certain key account orders.
Current year Pura Vida segment revenues totaled $98.4 million, a 17.7% decrease from $119.6 million in the prior year. Pura Vida’s e-commerce revenues continue to be negatively impacted by the shift in social and digital media effectiveness and rising digital media costs, and a decline in sales to wholesale accounts.
Consolidated gross profit for the current fiscal year totaled $238.9 million, or 47.8% of net revenues, compared to $287.9 million, or 53.3% of net revenues, last year. On a non-GAAP basis, gross profit for the current fiscal year totaled $257.2 million, or 51.4% of net revenues. The current year gross profit rate primarily was negatively affected by higher inbound and outbound freight expense and increased promotional activity, partially offset by price increases.
For the fiscal year, consolidated SG&A expense totaled $265.0 million, or 53.0% of net revenues, compared to $262.0 million, or 48.5% of net revenues, in the prior year. On a non-GAAP basis, SG&A expense totaled $245.3 million, or 49.1% of net revenues, in the current year, compared to $258.8 million, or 47.9% of net revenues, in the prior year. Vera Bradley’s SG&A current year expenses were lower than the prior year primarily due to cost reduction initiatives and a reduction in variable-related expenses due to the lower sales volume.
For the fiscal year, the Company’s consolidated operating loss totaled ($94.9) million, or (19.0%) of net revenues, compared to operating income of $26.9 million, or 5.0% of net revenues, in the prior year. On a non-GAAP basis, the Company’s consolidated operating income was $12.3 million, or 2.5% of net revenues, compared to $30.1 million, or 5.6% of net revenues, in the prior year.
By segment:
Vera Bradley Direct operating income was $51.1 million, or 15.6% of Direct net revenues, compared to $73.5 million, or 20.7% of Direct net revenues, in the prior year. On a non-GAAP basis, Direct operating income was $58.3 million, or 17.8% of Direct net revenues, for the current year, compared to $73.6 million, or 20.7% of Direct net revenues, in the prior year.
Vera Bradley Indirect operating income was $23.0 million, or 31.3% of Indirect net revenues, compared to $20.3 million, or 30.8% of Indirect net revenues, in the prior year. On a non-GAAP basis, current year Indirect operating income totaled $24.7 million, or 33.7% of Indirect net revenues.
Pura Vida’s operating loss was ($78.6) million, or (79.9%) of Pura Vida net revenues, compared to operating income of $9.5 million, or 8.0% of Pura Vida net revenues, in the prior year. On a non-GAAP basis, Pura Vida’s operating income was $4.7 million, or 4.8% of Pura Vida net revenues, compared to $12.6 million, or 10.5% of Pura Vida net revenues, in the prior year.
Balance Sheet
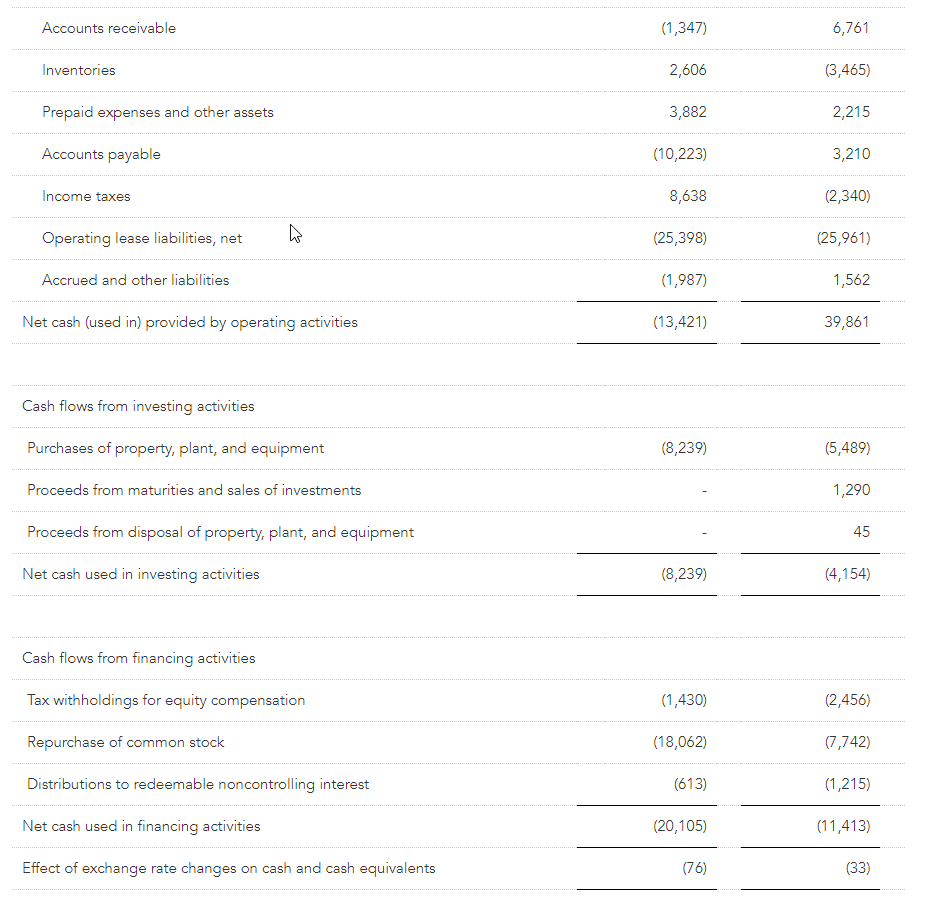
Net capital spending for the fiscal year totaled $8.2 million compared to $5.5 million in the prior year.
Cash and cash equivalents as of January 28, 2023 totaled $46.6 million compared to $88.4 million at the prior fiscal year end. The Company had no borrowings on its $75 million ABL credit facility at fiscal year end.
Total fiscal year-end inventory was $142.3 million, compared to $144.9 million at last fiscal year end. Total current year inventory was lower than the prior year primarily due to inventory adjustments associated with excess and discounted inventory, partially offset by incremental logistics costs burdening overall inventory.
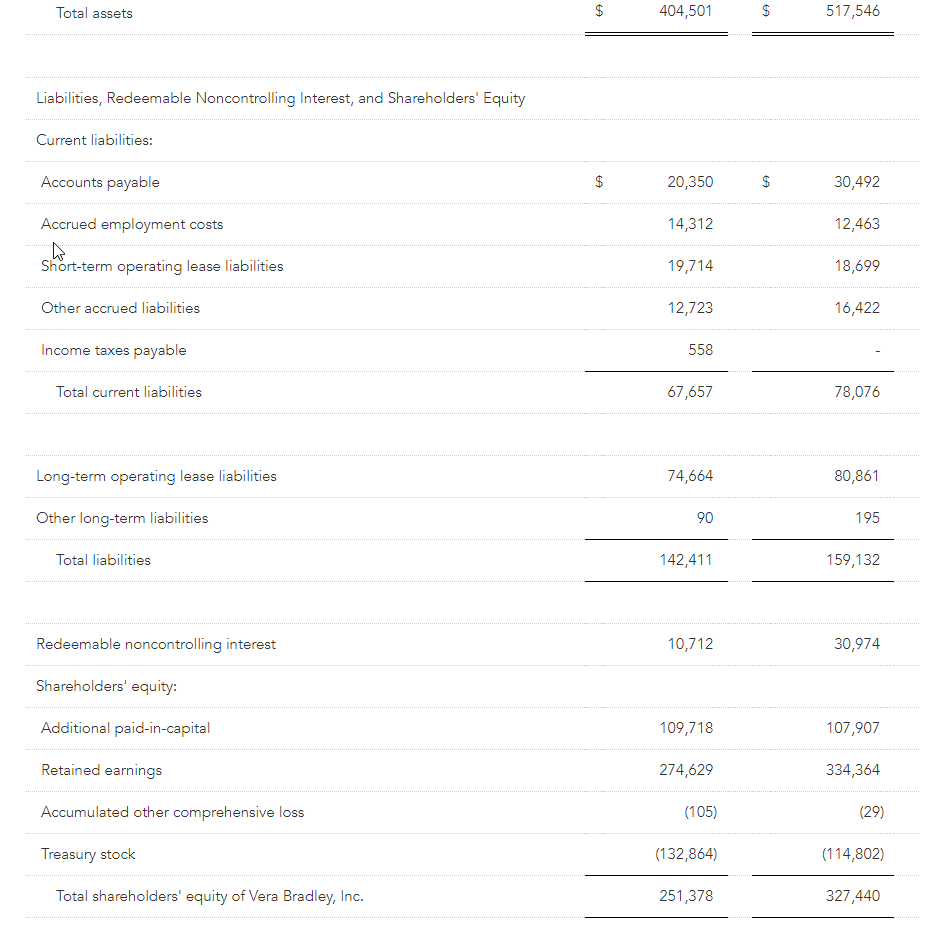
During the fourth quarter, the Company repurchased approximately $0.8 million of its common stock (approximately 187,000 shares at an average price of $4.20), bringing the Company’s Fiscal 2023 purchases to $18.1 million (approximately 2.8 million shares at an average price of $6.40). The Company’s $50.0 million share repurchase authorization expires in December 2024. Since Fiscal 2015, the Company has repurchased $132.9 million, or approximately 12.1 million shares, of its common stock.
Forward Outlook
Management is providing estimates for the fiscal year ending February 3, 2024 (“Fiscal 2024”) based on current macroeconomic trends and expectations. Ardrey noted, “We anticipate the Fiscal 2024 macroeconomic environment to continue to be unpredictable and that this year will be a rebuilding year for both of our brands. We expect to take advantage of gross margin improvement opportunities and manage our expense structure diligently.”
The Company is not providing detailed guidance for the first fiscal quarter of 2024 but expects revenues and diluted loss per share to be approximately in line with the prior year. Ardrey stated, “In the first quarter, we will work to stabilize the business. We hope to see momentum build as the year progresses.”
Excluding net revenues, all forward-looking guidance numbers referenced below are non-GAAP. The prior year income statement numbers exclude the previously disclosed charges for goodwill and intangible asset impairment; net inventory and purchase order-related adjustments; severance, retention, and stock-based retirement compensation; consulting and professional fees primarily associated with cost savings initiatives, the CEO search, and strategic initiatives; amortization of definite-lived intangible assets; store and right-of-use asset impairment charges; new CEO sign-on bonus and relocation; and goodMRKT exit costs. Current year guidance excludes any similar charges.
For Fiscal 2024, the Company’s expectations are as follows:
Consolidated net revenues of $490 to $510 million. Net revenues totaled $500.0 million in Fiscal 2023. Both Vera Bradley and Pura Vida revenues are expected to be approximately flat on a year-over-year basis.
A consolidated gross profit percentage of 52.6% to 53.6% compared to 51.4% in Fiscal 2023. The expected year-over-year increase is primarily related to reduced inbound freight expense, partially offset by deleveraged overhead costs related to reduced inventory purchases.
Consolidated SG&A expense of $241 to $251 million compared to $245.3 million in Fiscal 2023. Year-over-year changes in SG&A expense primarily are being driven by restoring short-term and long-term incentive compensation to normal levels, offset by Company-wide cost reduction initiatives.
Consolidated operating income of $17.3 to $21.7 million compared to $12.3 million in Fiscal 2023.
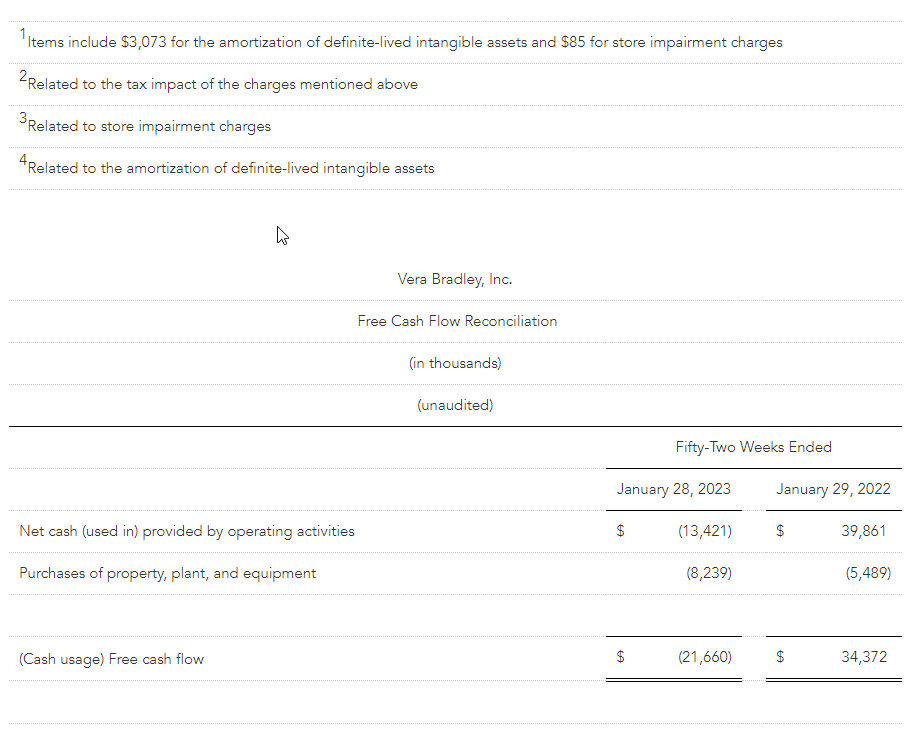
Free cash flow of between $25 and $30 million compared to a cash usage of $21.7 million in Fiscal 2023.
Consolidated diluted EPS of $0.40 to $0.50 based on diluted weighted-average shares outstanding of 31.0 million and an effective tax rate of approximately 28%. Diluted EPS totaled $0.24 last year.
Net capital spending of approximately $5 million compared to $8.2 million in the prior year, reflecting investments associated with new Vera Bradley Factory stores and technology and logistics enhancements.
Disclosure Regarding Non-GAAP Measures
The Company’s management does not, nor does it suggest that investors should, consider the supplemental non-GAAP financial measures in isolation from, or as a substitute for, financial information prepared in accordance with accounting principles generally accepted in the United States (“GAAP”). Further, the non-GAAP measures utilized by the Company may be unique to the Company, as they may be different from non-GAAP measures used by other companies.
The Company believes that the non-GAAP measures presented in this earnings release, including (cash usage) free cash flow; cost of sales; gross profit; selling, general, and administrative expenses; impairment of goodwill and intangible assets; operating (loss) income; net (loss) income; net (loss) income attributable and available to Vera Bradley, Inc.; and diluted net (loss) income per share available to Vera Bradley, Inc. common shareholders, along with the associated percentages of net revenues, are helpful to investors because they allow for a more direct comparison of the Company’s year-over-year performance and are consistent with management’s evaluation of business performance. A reconciliation of the non-GAAP measures to the most directly comparable GAAP measures can be found in the Company’s supplemental schedules included in this earnings release.
Call Information
A conference call to discuss results for the fourth quarter and fiscal year is scheduled for today, Wednesday, March 8, 2023, at 9:30 a.m. Eastern Time. A broadcast of the call will be available via Vera Bradley’s Investor Relations section of its website, www.verabradley.com. Alternatively, interested parties may dial into the call at (888) 204-4368, and enter the access code 3761893. A replay will be available shortly after the conclusion of the call and remain available through March 22, 2023. To access the recording, listeners should dial (844) 512-2921, and enter the access code 3761893.
About Vera Bradley, Inc.
Vera Bradley, Inc. operates two unique lifestyle brands – Vera Bradley and Pura Vida. Vera Bradley and Pura Vida are complementary businesses, both with devoted, emotionally-connected, and multi-generational female customer bases; alignment as casual, comfortable, affordable, and fun brands; positioning as “gifting” and socially-connected brands; strong, entrepreneurial cultures; a keen focus on community, charity, and social consciousness; multi-channel distribution strategies; and talented leadership teams aligned and committed to the long-term success of their brands.
Vera Bradley, based in Fort Wayne, Indiana, is a leading designer of women’s handbags, luggage and other travel items, fashion and home accessories, and unique gifts. Founded in 1982 by friends Barbara Bradley Baekgaard and Patricia R. Miller, the brand is known for its innovative designs, iconic patterns, and brilliant colors that inspire and connect women unlike any other brand in the global marketplace.
In July 2019, Vera Bradley, Inc. acquired a 75% interest in Creative Genius, Inc., which also operates under the name Pura Vida Bracelets (“Pura Vida”). Pura Vida, based in La Jolla, California, is a digitally native, highly-engaging lifestyle brand founded in 2010 by friends Paul Goodman and Griffin Thall. Pura Vida has a differentiated and expanding offering of bracelets, jewelry, and other lifestyle accessories. The Company acquired the remaining 25% of Pura Vida in January 2023, subsequent to the end of Fiscal 2023.
The Company has three reportable segments: Vera Bradley Direct (“VB Direct”), Vera Bradley Indirect (“VB Indirect”), and Pura Vida. The VB Direct business consists of sales of Vera Bradley products through Vera Bradley Full-Line and Factory stores in the United States, www.verabradley.com, www.verabradley.ca, Vera Bradley’s online outlet site, and the Vera Bradley annual outlet sale in Fort Wayne, Indiana. The VB Indirect business consists of sales of Vera Bradley products to approximately 1,700 specialty retail locations throughout the United States, as well as select department stores, national accounts, third party e-commerce sites, and third-party inventory liquidators, and royalties recognized through licensing agreements related to the Vera Bradley brand. The Pura Vida segment consists of sales of Pura Vida products through the Pura Vida websites, www.puravidabracelets.com, www.puravidabracelets.eu, and www.puravidabracelets.ca; through the distribution of its products to wholesale retailers and department stores; and through its Pura Vida retail stores.
Website Information
We routinely post important information for investors on our website www.verabradley.com in the “Investor Relations” section. We intend to use this webpage as a means of disclosing material, non-public information and for complying with our disclosure obligations under Regulation FD. Accordingly, investors should monitor the Investor Relations section of our website, in addition to following our press releases, SEC filings, public conference calls, presentations and webcasts. The information contained on, or that may be accessed through, our webpage is not incorporated by reference into, and is not a part of, this document.
Investors and other interested parties may also access the Company’s most recent Corporate Responsibility and Sustainability Report outlining its ESG (Environmental, Social, and Governance) initiatives at https://verabradley.com/pages/corporate-responsibility.
Vera Bradley Safe Harbor Statement
Certain statements in this release are “forward-looking statements” made pursuant to the safe-harbor provisions of the Private Securities Litigation Reform Act of 1995. Such forward-looking statements reflect the Company’s current expectations or beliefs concerning future events and are subject to various risks and uncertainties that may cause actual results to differ materially from those that we expected, including: possible adverse changes in general economic conditions and their impact on consumer confidence and spending; possible inability to predict and respond in a timely manner to changes in consumer demand; possible loss of key management or design associates or inability to attract and retain the talent required for our business; possible inability to maintain and enhance our brands; possible inability to successfully implement the Company’s long-term strategic plans; possible inability to successfully open new stores, close targeted stores, and/or operate current stores as planned; incremental tariffs or adverse changes in the cost of raw materials and labor used to manufacture our products; possible adverse effects resulting from a significant disruption in our distribution facilities; or business disruption caused by pandemics. Risks, uncertainties, and assumptions also include the possibility that Pura Vida acquisition benefits may not materialize as expected and that Pura Vida’s business may not perform as expected. More information on potential factors that could affect the Company’s financial results is included from time to time in the “Risk Factors” and “Management’s Discussion and Analysis of Financial Condition and Results of Operations” sections of the Company’s public reports filed with the SEC, including the Company’s Form 10-K for the fiscal year ended January 29, 2022. We undertake no obligation to publicly update or revise any forward-looking statement. Financial schedules are attached to this release.
CONTACTS: Investors: Julia Bentley, VP of Investor Relations and Communications jbentley@verabradley.com (260) 207-5116
Mustard-derived intellectual property portfolio has significantly advanced in quantity and scope.
Patents have been filed across six continents.
Patent portfolio has grown from 23 to 84 in three year period.
SASKATOON, Saskatchewan, Canada, Mar. 8, 2023 – MustGrow Biologics Corp. (TSXV: MGRO) (OTC: MGROF) (FRA: 0C0) (the “Company” or “MustGrow”), is pleased to report on the growth of its intellectual property portfolio (the “IP Portfolio”) in both quantity and scope, particularly with respect to the Company’s patents.
“The growth of our IP Portfolio enhances the potential commercial value of MustGrow’s organic mustard-derived crop protection and food preservation technologies through potential product sales, licensing fees and royalities, and/or other commercial transactions – all of which would contribute to driving shareholder value,” remarked Corey Giasson, MustGrow’s President & CEO.
MustGrow’s global IP Portfolio has grown from 23 to 84 total patents issued and pending over the last three years. Of the 84 total patents, 62 have been issued, an increase from 18 issued patents three years ago. The IP Portfolio also includes trade secrets and protects MustGrow’s mustard-derived technology across six continents, including various composition, production process, and end-use applications. The IP Portfolio covers MustGrow’s three key areas of focus: pre-plant soil fumigation, postharvest food preservation, and bioherbicide.
Since 2021, MustGrow has been developing its biologic technologies with four global partners – Janssen PMP, Bayer, Sumitomo Corporation, and NexusBioAg – and retains the ability to commercialize all of its partnership-generated data and discoveries. These arrangements have allowed MustGrow to substantially accelerate technology development and potential future commercialization. MustGrow continues to innovate in biological crop protection and food preservation with the breadth and depth of its IP Portfolio, driven by laboratory, greenhouse, and field trials.
———
About MustGrow
MustGrow is an agriculture biotech company developing organic biopesticides and bioherbicides by harnessing the natural defense mechanism of the mustard plant to protect the global food supply from diseases, insect pests, and weeds. MustGrow and its leading global partners – Janssen PMP (pharmaceutical division of Johnson & Johnson), Bayer, Sumitomo Corporation, and Univar Solutions’ NexusBioAg – are developing mustard-based organic solutions to potentially replace harmful synthetic chemicals. Over 150 independent tests have been completed, validating MustGrow’s safe and effective approach to crop and food protection. Pending regulatory approval, MustGrow’s patented technology could be applied through injection, standard drip or spray equipment, improving functionality and performance features. Now a platform technology, MustGrow and its global partners are pursuing applications in several different industries from preplant soil treatment and weed control, to postharvest disease control and food preservation. MustGrow has approximately 49.7 million basic common shares issued and outstanding and 55.6 million shares fully diluted. For further details, please visit www.mustgrow.ca.
Certain statements included in this news release constitute “forward-looking statements” which involve known and unknown risks, uncertainties and other factors that may affect the results, performance or achievements of MustGrow.
Generally, forward-looking information can be identified by the use of forward-looking terminology such as “plans”, “expects”, “is expected”, “budget”, “estimates”, “intends”, “anticipates” or “does not anticipate”, or “believes”, or variations of such words and phrases or statements that certain actions, events or results “may”, “could”, “would”, “might”, “occur” or “be achieved”. Examples of forward-looking statements in this news release include, among others, statements MustGrow makes regarding: (i) enhancements to potential commercial value of its organic mustard-derived crop protection and food preservation technologies through potential product sales, licensing fees and royalities, and/or other commercial transactions; and (ii) the potential outcomes stemming from the Company’s efforts with respect to its IP Portfolio to continue driving shareholder value.
Forward-looking statements are subject to a number of risks and uncertainties that may cause the actual results of MustGrow to differ materially from those discussed in such forward-looking statements, and even if such actual results are realized or substantially realized, there can be no assurance that they will have the expected consequences to, or effects on, MustGrow. Important factors that could cause MustGrow’s actual results and financial condition to differ materially from those indicated in the forward-looking statements include, among others, the following: (i) the preferences and choices of agricultural regulators with respect to product approval timelines; (ii) the ability of MustGrow’s partners to meet obligations under their respective agreements; and (iii) other risks described in more detail in MustGrow’s Annual Information Form for the year ended December 31, 2021 and other continuous disclosure documents filed by MustGrow with the applicable securities regulatory authorities which are available at www.sedar.com. Readers are referred to such documents for more detailed information about MustGrow, which is subject to the qualifications, assumptions and notes set forth therein.
This release does not constitute an offer for sale of, nor a solicitation for offers to buy, any securities in the United States.
Neither the TSXV, nor their Regulation Services Provider (as that term is defined in the policies of the TSXV), nor the OTC Markets has approved the contents of this release or accepts responsibility for the adequacy or accuracy of this release.
Onconova Therapeutics is a clinical-stage biopharmaceutical company focused on discovering and developing novel products for patients with cancer. The Company has proprietary targeted anti-cancer agents designed to disrupt specific cellular pathways that are important for cancer cell proliferation. Onconova’s novel, proprietary multi-kinase inhibitor narazaciclib (formerly ON 123300) is being evaluated in two Phase 1 dose-escalation and expansion studies. These trials are currently underway in the United States and China. Onconova’s product candidate rigosertib is being studied in an investigator-sponsored study program, including in a dose-escalation and expansion Phase 1/2a investigator-sponsored study with oral rigosertib in combination with nivolumab for patients with KRAS+ non-small cell lung cancer.
Robert LeBoyer, Vice President, Research Analyst, Life Sciences , Noble Capital Markets, Inc.
Refer to the full report for the price target, fundamental analysis, and rating.
New Data Shows Mechanisms of Inflammation and Cell Death. Onconova presented new preclinical data on the mechanisms of action for Rigosertib, its cell-signal inhibitor for cancer. The poster presentation at the AACR Special Conference for Targeting RAS included new data showing additional targets and mechanisms of action. We believe the presentation expands on the previous mechanism of action data and differentiates rigosertib from other KRAS drugs.
Data Shows Effects On Early and Late In Cancer Pathways. Rigosertib was shown to activate early targets which then trigger inhibition of the RAS/RAF pathway, as well as inflammation and interruption of cell division. Rigosertib also activates the inflammasome NLRP3, increasing levels of the pro-inflammatory cytokines IL1beta and IL-18. This inflammatory response supports the combination of Rigosertib with a checkpoint inhibitor, currently in clinical trials.
Equity Research is available at no cost to Registered users of Channelchek. Not a Member? Click ‘Join’ to join the Channelchek Community. There is no cost to register, and we never collect credit card information.
This Company Sponsored Research is provided by Noble Capital Markets, Inc., a FINRA and S.E.C. registered broker-dealer (B/D).
*Analyst certification and important disclosures included in the full report. NOTE: investment decisions should not be based upon the content of this research summary. Proper due diligence is required before making any investment decision.
Harte Hanks (NASDAQ: HHS) is a leading global customer experience company whose mission is to partner with clients to provide them with CX strategy, data-driven analytics and actionable insights combined with seamless program execution to better understand, attract, and engage their customers. Using its unparalleled resources and award-winning talent in the areas of Customer Care, Fulfillment and Logistics, and Marketing Services, Harte Hanks has a proven track record of driving results for some of the world’s premier brands including Bank of America, GlaxoSmithKline, Unilever, Pfizer, HBOMax, Volvo, Ford, FedEx, Midea, Sony, and IBM among others. Headquartered in Chelmsford, Massachusetts , Harte Hanks has over 2,500 employees in offices across the Americas, Europe and Asia Pacific .
Michael Kupinski, Director of Research, Noble Capital Markets, Inc.
Patrick McCann, Research Associate, Noble Capital Markets, Inc.
Refer to the full report for the price target, fundamental analysis, and rating.
Solid Q4 & full year results. The company reported Q4 revenue of $54.8 million, up 5.4%, and Adj. EBITDA of $5 million, in line with our estimates. Revenue growth was driven by fulfillment & logistics, which grew 34.4% from year earlier results. Full year revenue and Adj. EBITDA grew by 6% and 12%, respectively, a solid performance given the robust growth in 2021, where revenue and Adj. EBITDA grew by 10% and 467%, respectively.
Slow start to 2023. The company faces a difficult comp in Q1 due to non-recurring customer care revenue and lower margin revenue mix in the seasonally light quarter. Notably, we are tweaking upward our Q1 adj. EBITDA estimate given a slightly higher margin expectation.
Equity Research is available at no cost to Registered users of Channelchek. Not a Member? Click ‘Join’ to join the Channelchek Community. There is no cost to register, and we never collect credit card information.
This Company Sponsored Research is provided by Noble Capital Markets, Inc., a FINRA and S.E.C. registered broker-dealer (B/D).
*Analyst certification and important disclosures included in the full report. NOTE: investment decisions should not be based upon the content of this research summary. Proper due diligence is required before making any investment decision.
Joe Gomes, Managing Director – Generalist Analyst, Noble Capital Markets, Inc.
Joshua Zoepfel, Research Associate, Noble Capital Markets, Inc.
Refer to the full report for the price target, fundamental analysis, and rating.
4Q22 Bottom Line Impacted By Special Items. CVG reported GAAP EPS of a loss of $0.98. Adjusting for one-time items, adjusted EPS was $0.04. Further adjusting for special items, high program start-up costs and foreign exchange, special item adjusted EPS was $0.14, or much more in-line with our $0.17 forecast, which did not include any of the above.
A Refined Long-term Roadmap. Management put out a more refined long-term roadmap with a goal of $1.5 billion of revenue and a 9.0% adjusted EBITDA margin for 2027. While the new revenue goal is below the previous $1.9 billion goal, the adjusted EBITDA margin rises from a prior 8.5%. We believe the updated road map reflects management’s goal of focusing on adding only higher margin growth and not just growth for growth’s sake.
Equity Research is available at no cost to Registered users of Channelchek. Not a Member? Click ‘Join’ to join the Channelchek Community. There is no cost to register, and we never collect credit card information.
This Company Sponsored Research is provided by Noble Capital Markets, Inc., a FINRA and S.E.C. registered broker-dealer (B/D).
*Analyst certification and important disclosures included in the full report. NOTE: investment decisions should not be based upon the content of this research summary. Proper due diligence is required before making any investment decision.
Steps to Discover Which Biotech Stocks May Get Hot
The biotech sector is in and of itself exciting. A company developing an idea that can improve human lives, decrease suffering, or even prevent death, by nature, could be a more rewarding endeavor than investing in a company that, by comparison, does little to make a big difference. If, at the same time, the opportunity to return the investor a multiple over returns available elsewhere in the market, then the motivation to allocate a portion of investment capital increases dramatically. But how does an investor gauge a company in the biotech sector and evaluate its chance of survival and likelihood of success?
As with much of investing, sure things don’t often provide a good return. And adding risk doesn’t necessarily equate to added return. The higher perceived risk of a sector such as biotech needs to be offset by research. Filtering stocks through a selection process is key, so the probability of picking those that survive and thrive is higher than average.
I spoke with Robert LeBoyer, the Senior Life Sciences Analyst at Noble Capital Markets, and asked him to list factors to improve the likelihood of choosing a successful biotech company. His knowledge and enthusiasm for the sector caused me to want to share what I learned.
Differentiation
Companies developing a drug that is different than all that came before for what it proposes to treat or prevent stand a good chance of getting funding to make it through the different phases of study. With a development time of 3-5 years, it is best if there is a clear unmet need for the therapy or no current therapies at all.
Investors should determine if there are treatments presently and ask whether the drug or treatment mechanism is a significant improvement over any current product. Also is the field crowded or will it soon be crowded with alternatives to what a company may bring to market? LeBoyer recommended asking where there is an improvement. He gave the example of many cholesterol-lowering drugs, which he said all target the same enzyme. A company with a drug that similarly targets that enzyme may not be worth exploring. Learning of a company that has a different mechanism of action, one which shows promise of greater efficacy, or, reduced cost, or fewer side effects may be worth exploring further.
As an example of a company that had met these criteria some years back, Gilead received approval for a once-daily tablet to treat hepatitis C. Prior to this, the only treatment options involved a year-long regimen of weekly interferon injections and ribavirin tablets. The side effects were depression, nausea, flu-like symptoms, and a reduction in some blood cells. The cost of the injections and treatments could cost a health insurer $1 million over the life of the patient. The Gilead treatment, which has a price tag of $93,000, is mathematically more cost-effective. The therapy which Gilead got approved in the U.S. in 2013 was a better treatment than what existed, and even better tolerated by patients. The stock went from $20 to $120 in about a years time after approval.
Development
Clinical development was another attribute brought up by Noble’s analyst. With even the best proof of concept or early-stage trial success, assessing the chance that clinical stage trials may fail for pipeline candidates is difficult. This is why a company with a diverse pipeline with a number of products being developed or in later stages of clinical trials, increases the probability of successful biotech investment. Many companies easily pass stage one trials and even stage two, but don’t get past the final hurdle. LeBoyer shared with me a story of a company he now covers that had a vaccine for Covid-19 early on. The human clinical trials, however, were not done in the U.S., but were instead the result of trials on persons mostly of similar lineage. The FDA required a sampling comparable to the diversification of heritage or gene pool in the U.S.
Obtaining a basic understanding of the FDA side of development is important for anyone making decisions on biotech stocks.
The drug approval process in the U.S. involves multi-layered (Step One through Step Four) with each representing an important milestone on the path to full approval so the product can be brought to market or meet rejection along the path.
Step One is the development phase, Step Two is research, Step Three is Clinical Trials, and Step Four is FDA Approval.
Knowing where companies stands in the FDA step process can help an investor assess the likelihood of approval. Many products, can get to the last step and not be approved, but those just starting out on Step One are a greater risk both in the time it will take and the chance for something to not be to the FDA’s liking.
Finances
Biotech companies, by and large burn through cash in their research, development and trial periods. Understanding how long the cash on hand and other available sources can last before they need to raise more cash, then comparing this with how close to an expected finish line they are, could help an investor steer away from a company that may have a product in the pipeline that meets other key elements investors should look at, but unfortunately, funds may stand in the way of success.
Robert LeBoyer explained that the current high-interest rate environment, coupled with depressed stock prices, makes this particularly important now. For those companies that can borrow, the cost of money is now far more expensive than it had been in the last decade and a half. And issuing more shares, essentially selling more of the company, dilutes the value of shares currently held. It could become a tricky situation that stockholders or those deciding to become a stockholder should monitor
Take Away
Are there companies with a pipeline that includes drugs that meet a large unmet need (as one example, Alzheimer’s), or can attack a disease like cancer in a unique way that would be embraced by the medical community and patients? “Unicorn” companies do exist, but finding them, assessing them, and doing it before a louder investment buzz occurs takes some digging. A solid place to start digging is under the biotech company section on Channelchek. Available by clicking here, here investors are exposed to many opportunities and the underlying data, the latest news, and of course, thorough company descriptions.
Biotech companies covered by analyst Robert LeBoyer, along with his current research are available here. Channelchek will be highlighting interesting biotechs in future articles and discussing their work and status against the criteria presented above. Join Channelchek to receive emails and gain free access to these articles, video presentations, updated research reports, and news of company roadshows. Visit Rob LeBoyers coverage list here.
Is the Fed Doing Too Much, Not Enough, or Just Right?
The Fed Reserve Chair Jerome Powell has an ongoing credibility problem. The problem is that markets, economists, and now Congress find him extremely credible. So credible that they have already declared him a winner fighting inflation, or of more pertinence, the economy a loser because Powell and the Fed policymakers have been so resolute in their fight against the rising cost of goods and services that soon there will be an abundance of newly unemployed, businesses will falter, and the stock market will be left in tatters. This view that he has already done too much and that the economy has been overkilled, even while it shows remarkable strength, was echoed many times during his visit to Capital Hill for his twice a year testimony.
“As of the end of December, there were 1.9 job openings for each unemployed individual, close to the all-time peak recorded last March, while unemployment insurance claims have remained near historic lows.” – Federal Reserve Chair Jay Powell (March 8, 2023).
Powell’s Address
Perhaps the most influential individual on financial markets in the U.S. and around the world, Fed Chair Powell continued his hawkish (inflation fighter, interest rate hiker) tone at his Senate and House testimonies. The overall message was; inflation is bad, inflation has been persistent, we will continue on the path to bring it down, also employment is incredibly strong, the employment situation is such that we can do more, we will do more to protect the U.S. economy from the ravages of inflation.
Powell began, “My colleagues and I are acutely aware that high inflation is causing significant hardship, and we are strongly committed to returning inflation to our 2 percent goal.” Powell discussed the forceful actions taken to date and added, “we have more work to do. Our policy actions are guided by our dual mandate to promote maximum employment and stable prices. Without price stability, the economy does not work for anyone. In particular, without price stability, we will not achieve a sustained period of labor market conditions that benefit all.”
Powell discussed the slowed growth last year; there were two periods of negative GDP growth reported during the first two quarters. He mentioned how the once red-hot housing sector is weakening under higher interest rates and that “Higher interest rates and slower output growth also appear to be weighing on business fixed investment.” He then discussed the impact on labor markets, “Despite the slowdown in growth, the labor market remains extremely tight. The unemployment rate was 3.4 percent in January, its lowest level since 1969. Job gains remained very strong in January, while the supply of labor has continued to lag.1 As of the end of December, there were 1.9 job openings for each unemployed individual, close to the all-time peak recorded last March, while unemployment insurance claims have remained near historic lows.”
On the subject of monetary policy, the head of the Federal Reserve mentioned that the target of 2% inflation has not been met and that recent numbers have it moving in the wrong direction. Powell also discussed that the Fed had raised short-term interest rates by adding 4.50%. He suggested that recent economic numbers require that an increase to where the sufficient height of fed funds peaks is likely higher than previously thought. All the while, he added, “we are continuing the process of significantly reducing the size of our balance sheet.”
Powell acknowledged some headway, “We are seeing the effects of our policy actions on demand in the most interest-sensitive sectors of the economy. It will take time, however, for the full effects of monetary restraint to be realized, especially on inflation. In light of the cumulative tightening of monetary policy and the lags with which monetary policy affects economic activity and inflation, the Committee slowed the pace of interest rate increases over its past two meetings.” Powell added, “We will continue to make our decisions meeting by meeting, taking into account the totality of incoming data and their implications for the outlook for economic activity and inflation.”
Questions and Answers
Congressmen both in the Senate and the House use the Semiannual Monetary Policy Report to Congress (formerly known as Humphrey Hawkins Testimony) to ask questions of the person with the most economic insight in Washington. Often their questions have already been covered in the Chair’s opening address, but Congresspeople will ask anyway to show their constituents at home that they are looking after them.
Elizabeth Warren is on the Senate Banking Committee; her math concluded the result of even a 1% increase in unemployment is a two million-worker job loss. Warren asked Powell, “Do you call laying off two million people this year not a sharp increase in unemployment?” “Explain that to the two million families who are going to be out of work.” In his response, Powell went back to historical numbers and reminded the Senator that an increase in unemployment would still rank the current economy above what Americans have lived through in most of our lifetimes, “We’re not, again, we’re not targeting any of that. But I would say even 4.5 percent unemployment is well better than most of the time for the last, you know, 75 years,” Chair Powell answered.
U.S. House Financial Services Committee on Wednesday heard Congressman Frank Lucas concerned about the pressure for the Fed to include climate concerns as an additional Fed mandate. Lucas from Oklahoma asked, “How careful are you in ensuring that the Fed does not place itself into the climate debate, and how can Congress ensure that the Fed’s regulatory tool kit is not warped into creating policy outcomes?” Powell answered that the Fed has a narrow but real role involving bank supervision. It’s important that individual banks understand and can manage over time their risks from any climate change and it’s impact on business and the economy. He wants to make sure the Fed never assumes a role where they are becoming a climate policymaker.
Other non-policy questions included Central Bank Digital Currencies. House Congressman Steven Lynch showed concerns that the Fed was experimenting with digital currencies. His question concerned receiving a public update on where they are with their partnership with MIT, their testing, and what they are trying to accomplish. Powell’s response seemed to satisfy the Congressman. “we engage with the public on an ongoing basis, we are also doing research on policy, and also technology,” said Powell. Follow-up questions on the architecture of a CBDC, were met with responses that indicated that the Fed, they are not at the stage of making decisions, instead, they are experimenting and learning. “How would this work, does it work, what is the best technology, what’s the most efficient.” Powell emphasized that the U.S. Federal Reserve is at an early stage, but making technological progress. They have not decided from a policy perspective if this is something that the country needs or desires.
Issues at Stake
As it relates to the stock and bond markets, the Fed has been holding overnight interest rates at a level that is more than one percentage point below the rate of inflation. The reality of this situation is that investors and savers that are earning near the Fed Funds rate on their deposits are losing buying power to the erosive effects of inflation. Those that are investing farther out on the yield curve are earning even less than overnight money. The impact here could be worse if inflation remains at current levels or higher, or better if the locked-in yields out longer on the curve are met with inflation coming down early on.
The Fed Chair indicated at the two testimony before both Houses of Congress that inflation has been surprisingly sticky. He also indicated that they might increase their expected stopping point on tightening credit. Interest rates out in the periods are actually lower than they had been in recent days and as much as 0.25% lower than they were last Fall. The lower market rates and inverted yield curve suggest the market thinks the Fed has already won and has likely gone too far. This thought process has made it difficult for the Fed Chair and others at the Fed that discuss a further need to throw cold water on an overheated economy. Fed Tightening has not led to an equal amount of upward movement out on the yield curve. This trust or expectation that the Fed has inflation under control would seem to be undermining the Fed’s efforts. With this, the Fed is likely to have to move even further to get the reaction it desires. The risk of an unwanted negative impact on the economy is heightened by the trust the bond market gives to Powell that he has this under control and may have already won.
Powell’s words are that the Fed has lost ground and has much more work to do.
Take Away
At his semiannual testimony to Congress, an important message was sent to the markets. The Fed has the right tools to do the job of bringing inflation down to the 2% range, but those tools operate on the demand side. In the U.S. we are fortunate to have two jobs open for every person seeking employment. While this is inflationary, it provides policy with more options.
As of the reporting of January economic numbers, a trend may be beginning indicating the Fed is losing its fight against inflation. It is likely that it will have to do more, but the Fed stands willing to do what it takes. Powell ended his prepared address by saying, “Everything we do is in service to our public mission. We at the Federal Reserve will do everything we can to achieve our maximum-employment and price-stability goals.”
Company Expects Continued Revenue and EBITDA Growth in 2023
CHELMSFORD, MA / ACCESSWIRE / March 7, 2023 / Harte Hanks, Inc. (NASDAQ:HHS), a leading global customer experience company focused on bringing companies closer to customers for 100 years, today announced financial results for the fourth quarter and full-year period ended December 31, 2022. The results include one month of contribution from the acquisition of InsideOut Solutions in 2022, with no contribution in 2021. In addition, the results reflect the impact of the repurchase of all the Company’s outstanding Series A Convertible Preferred Shares (the “Preferred Shares”) from Wipro, LLC, the sole holder of the Preferred Shares, for a cash payment of $9.9 million, equal to the liquidation value, and 100,000 shares of Harte Hanks common stock.
Harte Hanks CEO, Brian Linscott, commented: “This was an important year for Harte Hanks, with results that reflect the successful culmination of our restructuring and the emergence of sustainable, profitable growth based on a differentiated offering and solid relationships with our top-tier customers. Our improved financial results have enabled us to materially strengthen our balance sheet. We have streamlined our capital structure by eliminating our debt and redeeming our preferred shares, thereby eliminating the dilutive effect of preferred shares going forward. Simultaneously, our pension liability was reduced by nearly $15 million, positioning us to commence the process to transfer one of our qualified pensions to a third party.”
“We have proven our operating leverage and earnings power with continued growth. Our 6% full-year revenue growth translated to a near doubling of operating income and a 75% increase in EBITDA,” concluded Linscott. “Demand for our solutions continues to grow, offsetting headwinds from the culmination of pandemic-related projects. We anticipate continued revenue and EBITDA growth for the full year of 2023, even though our first quarter results will include modest revenue growth and lower EBITDA on a year-over-year basis as result of an abnormally strong comparison period in 2022 driven by revenue mix.”
Fourth Quarter Financial Highlights
Revenues increased by 5.4% to $54.8 million, compared to $52.0 million in the same period in the prior year. Revenue for the fourth quarter of 2022 included approximately $1 million in revenue from InsideOut Solutions, acquired on December 1, 2022, with no contribution in the prior-year.
Fulfillment & Logistics Services grew 34.4%, offsetting decreases of 6.8% in Marketing Services and 12.9% in Customer Care. Customer Care decreases were largely related to the completion of pandemic-related projects.
Operating income of $3.4 million, compared to operating income of $2.9 million in the same period in the prior year, an increase of 19.8%.
Net income of $21.8 million, inclusive of a one-time $19.8 million tax benefit due to release of valuation allowance due to the expectation of sustained profitability, and $1.4 million in other expenses mainly related to pension expense and foreign currency loss. This compared to net income of $1.8 million in the same period in the prior year, which included income tax expense of $271,000.
Diluted EPS was $2.70 for the fourth quarter of 2022 vs. $0.20 for the same period in the prior year. The tax benefit accounted for approximately $2.62 of the current-period earnings per share.
EBITDA was $4.4 million compared to $3.5 million in the same period in the prior year.[1]
[1] EBITDA is a non-GAAP financial measure. See “Supplemental Non-GAAP Financial Measures” below. EBITDA is also the Company’s measure of segment profitability.
Full-Year Financial Highlights
Revenues increased by 6.0% to $206.3 million, compared to $194.6 million in the prior year.
Fulfillment & Logistics Services grew 35.6%, offsetting declines in Marketing Services of 6.1% and Customer Care of 10.0%.
Operating income of $15.1 million, compared to operating income of $7.6 million last year, an increase of 97.8%.
Net income of $36.8 million, compared to net income of $15.0 million, last year. The 2022 results included a $19.8 million tax benefit due to release of valuation allowance due to the expectation of sustained profitability, while the 2021 results included a one-time gain of $10.0 million related to the extinguishment of the Company’s PPP loan.
Earnings per diluted share of $4.75 compared to $1.76 per diluted share last year.
EBITDA 1was $17.8 million compared to $10.2 million last year.1
Segment Highlights
Customer Care, $16.7 million in revenue, 30% of total – Revenue decreased by 12.9%, or $2.5 million, from the prior year quarter, and year-over-year EBITDA increased by 24.4% to $3.2 million from $2.6 million. Decrease in revenue was driven by sunsetting of pandemic-related projects, but continuous improvement in retention and reduction in labor costs drove the EBITDA increase. New business wins for the quarter included:
A community-based health plan company selected Harte Hanks to support its members with plan related customer support. The company selected Harte Hanks to provide extended support hours for its members while maintaining its CMS 5-star rating. Harte Hanks has consistently delivered high CMS ratings for its clients through its rigorous training and certification process for employees and systems.
A global beverage company expanded services with Harte Hanks by extending its Customer Care solution to additional markets. The expansion allows our client to benefit from our lower cost facilities in the Philippines, while improving its customer experience with faster and easier access for support.
Fulfillment & Logistics Services, $24.5 million in revenue, 45% of total – Revenue increased by 34.4%, or $6.3 million, compared to the prior year quarter; and year-over-year EBITDA improved 5.9% to $2.3 million from $2.1 million. New business wins for the quarter included:
A growing international investment firm with approximately $30 billion of assets under management selected Harte Hanks to provide digital print and premium item fulfillment services to its brokers. Our financial services sector experience and streamlined onboarding to support a rapid pivot from a competitor were key differentiators in the selection process.
A leading branding company selected Harte Hanks Fulfillment to manage the production, kitting, and distribution of 250,000 makeup kits for a Fortune 200 retail partner. This partnership continues to lead to new value-added product fulfillment opportunities, unlocked by our investment in flexible, automated production lines.
Marketing Services, $13.6 million in revenue, 25% of total – Revenue decreased by 6.8% compared to the prior year quarterand year-over-year EBITDA decreased 18.4% to $2.1 million from $2.6 million. Decrease in revenue was driven by a reduction of Direct Mail work for clients. New business wins for the quarter included:
A leading premium brand retailer of Kitchen, Bath and Outdoor products selected Harte Hanks to design and execute a series of lead generation programs. Harte Hanks was chosen based on our extensive experience in retail strategy and ability to deliver a full suite of creative, data, analytics and campaign execution.
A leading global technology manufacturer expanded our successful B2B demand generation program into South America by utilizing Harte Hanks Audience Finder product to identify buyers with intent.
Consolidated Fourth Quarter 2022 Results
Fourth quarter revenues were $54.8 million, up 5.4% from $52.0 million in the fourth quarter of 2021. The Company’s Fulfillment & Logistics Services segment grew, more than offsetting declines in Marketing Services and Customer Care.
Fourth quarter operating income was $3.4 million, compared to operating income of $2.9 million in the fourth quarter of 2021. The improvement resulted from the elimination of restructuring expense and higher revenues.
Net income for the quarter was $21.8 million inclusive of $19.8 million tax benefit and $1.4 million in expenses related to pension and currency loss on intercompany receivables, compared to net income of $1.8 million in the fourth quarter last year. The Company recorded an income tax benefit of $19.8 million, or approximately $2.62 per diluted share, in the fourth quarter of 2022, compared to an expense of $271,000 in the fourth quarter of 2021. The tax benefit in the fourth quarter of 2022 was mainly related to the release of the majority of valuation allowances due to the improved profitability of the company. Income attributable to common stockholders for the fourth quarter was $20.4 million, or $2.81 per basic and $2.70 per diluted share (based on 7.6 million weighted average diluted shares outstanding), compared to net income attributable to common shareholders of $1.4 million, or $0.20 per basic and diluted share (based on 7.3 million weighted average diluted shares outstanding) during the prior year fourth quarter. Income attributable to common stockholders was reduced by a $1.4 million one-time loss on redemption of Preferred Stock.
Full-Year 2022 Results
Revenues for 2022 were $206.3 million, up 6.0% from $194.6 million last year. Operating income was $15.1 million, compared to operating income of $7.6 million last year. Net income for the year was $36.8 million (inclusive of a $19.8 million tax benefit due to release of valuation allowance due to the expectation of sustained profitability), compared to net income of $15.0 million (inclusive of a $10.0 million gain related to the forgiveness of the Company’s PPP loan), last year. Income attributable to common stockholders for the year was $35.4 million, or $4.98 per basic share and $4.75 per fully diluted share, compared to net income attributable to common shareholders of $12.6 million, or $1.85 per basic share and $1.76 per fully diluted share.
Balance Sheet and Liquidity
Harte Hanks ended the year with $10.4 million in cash, cash equivalents and restricted cash, compared to $15.1 million at December 31, 2021. At December 31, 2022, the Company had nothing drawn on its line of credit, and $37.8 million in outstanding long-term pension liability. On December 31, 2021, the Company had no short-term debt, $5 million in long-term debt and $52.5 million in outstanding long-term pension liability.
During 2022, Harte Hanks has decreased outstanding debt by $5 million and redeemed its preferred shares for $9.9 million.
The company anticipates receiving a Federal income tax refund related to a net operating loss (NOL) carryback claim of $5.3 million which will further enhance liquidity.
Conference Call Information
The Company will host a conference call and live webcast to discuss these results on Tuesday, March 7, 2023 at 4:30 p.m. EST. Interested parties may access the webcast at https://investors.hartehanks.com/events or may access the conference call by dialing (877) 545-0523 in the United States or (973) 528-0016 from outside the U.S. and using access code 471821.
A replay of the call can also be accessed via phone through March 21, 2023 by dialing (877) 481-4010 from the U.S., or (919) 882-2331 from outside the U.S. The conference call replay passcode is 47696.
About Harte Hanks:
Harte Hanks (NASDAQ:HHS) is a leading global customer experience company whose mission is to partner with clients to provide them with CX strategy, data-driven analytics and actionable insights combined with seamless program execution to better understand, attract and engage their customers.
Using its unparalleled resources and award-winning talent in the areas of Customer Care, Fulfillment and Logistics, and Marketing Services, Harte Hanks has a proven track record of driving results for some of the world’s premier brands, including Bank of America, GlaxoSmithKline, Unilever, Pfizer, HBOMax, Volvo, Ford, FedEx, Midea, Sony and IBM among others. Headquartered in Chelmsford, Massachusetts, Harte Hanks has over 2,500 employees in offices across the Americas, Europe, and Asia Pacific.
As used herein, “Harte Hanks” or “the Company” refers to Harte Hanks, Inc. and/or its applicable operating subsidiaries, as the context may require. Harte Hanks’ logo and name are trademarks of Harte Hanks.
Our press release and related earnings conference call contain “forward-looking statements” within the meaning of U.S. federal securities laws. All such statements are qualified by this cautionary note, provided pursuant to the safe harbor provisions of Section 27A of the Securities Act of 1933 and Section 21E of the Securities Exchange Act of 1934. Statements other than historical facts are forward-looking and may be identified by words such as “may,” “will,” “expects,” “believes,” “anticipates,” “plans,” “estimates,” “seeks,” “could,” “intends,” or words of similar meaning. These forward-looking statements are based on current information, expectations and estimates and involve risks, uncertainties, assumptions and other factors that are difficult to predict and that could cause actual results to vary materially from what is expressed in or indicated by the forward-looking statements. In that event, our business, financial condition, results of operations or liquidity could be materially adversely affected and investors in our securities could lose part or all of their investments. These risks, uncertainties, assumptions and other factors include: (a) local, national and international economic and business conditions, including (i) the outbreak of diseases, such as the COVID-19 coronavirus, which has curtailed travel to and from certain countries and geographic regions, created supply chain disruption and shortages, disrupted business operations and reduced consumer spending, (ii) market conditions that may adversely impact marketing expenditures, (iii) the impact of the Russia/Ukraine conflict on the global economy and our business, including impacts from related sanctions and export controls and (iv) the impact of economic environments and competitive pressures on the financial condition, marketing expenditures and activities of our clients and prospects; (b) the demand for our products and services by clients and prospective clients, including (i) the willingness of existing clients to maintain or increase their spending on products and services that are or remain profitable for us, and (ii) our ability to predict changes in client needs and preferences; (c) economic and other business factors that impact the industry verticals we serve, including competition and consolidation of current and prospective clients, vendors and partners in these verticals; (d) our ability to manage and timely adjust our facilities, capacity, workforce and cost structure to effectively serve our clients; (e) our ability to improve our processes and to provide new products and services in a timely and cost-effective manner though development, license, partnership or acquisition; (f) our ability to protect our facilities against security breaches and other interruptions and to protect sensitive personal information of our clients and their customers; (g) our ability to respond to increasing concern, regulation and legal action over consumer privacy issues, including changing requirements for collection, processing and use of information; (h) the impact of privacy and other regulations, including restrictions on unsolicited marketing communications and other consumer protection laws; (i) fluctuations in fuel prices, paper prices, postal rates and postal delivery schedules; (j) the number of shares, if any, that we may repurchase in connection with our repurchase program; (k) unanticipated developments regarding litigation or other contingent liabilities; (l) our ability to complete anticipated divestitures and reorganizations, including cost-saving initiatives; (m) our ability to realize the expected tax refunds; and (n) other factors discussed from time to time in our filings with the Securities and Exchange Commission, including under “Item 1A. Risk Factors” in our Annual Report on Form 10-K for the year ended December 31, 2021 which was filed on March 21, 2022. The forward-looking statements in this press release and our related earnings conference call are made only as of the date hereof, and we undertake no obligation to update publicly any forward-looking statement, even if new information becomes available or other events occur in the future.
Supplemental Non-GAAP Financial Measures:
The Company reports its financial results in accordance with generally accepted accounting principles (“GAAP”). However, the Company may use certain non-GAAP measures of financial performance in order to provide investors with a better understanding of operating results and underlying trends to assess the Company’s performance and liquidity in this press release and our related earnings conference call. We have presented herein a reconciliation of these measures to the most directly comparable GAAP financial measure.
The Company presents the non-GAAP financial measure “Adjusted Operating Income (Loss)” as a measure useful to both management and investors in their analysis of the Company’s financial results because it facilitates a period-to-period comparison of Operating Revenue and Operating Income (Loss) by excluding restructuring expense, impairment expense and stock-based compensation. The most directly comparable measure for this non-GAAP financial measure is Operating Income (Loss).
The Company presents the non-GAAP financial measure “EBITDA” as a supplemental measure of operating performance in order to provide an improved understanding of underlying performance trends. The Company defines “Adjusted EBITDA” as earnings before interest expense net, income tax expense (benefit) and depreciation expense. The most directly comparable measure for EBITDA is Net Income (Loss). We believe EBITDA is an important performance metric because it facilitates the analysis of our results, exclusive of certain non-cash items, including items which do not directly correlate to our business operations; however, we urge investors to review the reconciliation of non-GAAP EBITDA to the comparable GAAP Net Income (Loss), which is included in this press release, and not to rely on any single financial measure to evaluate the Company’s financial performance.
The use of non-GAAP measures do not serve as a substitute and should not be construed as a substitute for GAAP performance but should provide supplemental information concerning our performance that our investors and we find useful. The Company evaluates its operating performance based on several measures, including this non-GAAP financial measures. The Company believes that the presentation of this non-GAAP financial measures in this press release and earnings conference call presentations are useful supplemental financial measures of operating performance for investors because they facilitate investors’ ability to evaluate the operational strength of the Company’s business. However, there are limitations to the use of this non-GAAP measures, including that they may not be calculated the same by other companies in our industry limiting their use as a tool to compare results. Any supplemental non-GAAP financial measures referred to herein are not calculated in accordance with GAAP and they should not be considered in isolation or as substitutes for the most comparable GAAP financial measures.
EBITDA is the Company’s measure of segment profitability.
Investor Relations Contact:
Rob Fink or Tom Baumann 646.809.4048 / 646.349.6641 FNK IR HHS@fnkir.com