BY THE COMTECH EDITORIAL TEAM – DEC 6, 2023 | 3 MIN READ
MELVILLE, N.Y. – Dec. 6, 2023– Comtech (NASDAQ: CMTL), a global technology leader, today announced the appointment of satellite communications (SATCOM) and defense technology industry leader John Ratigan as the company’s first Chief Corporate Development Officer (CCDO).
With differentiated expertise across the global satellite technology sector, Ratigan brings over three decades of leadership experience to his position as Comtech’s CCDO. Ratigan’s experience is uniquely well aligned with Comtech’s strategic business priorities and continued expansion into new growth markets.
Prior to joining Comtech, Ratigan served as CEO and President of iDirect Government as well as holding a position as an Executive Committee Member of ST Engineering iDirect. As its first employee, Ratigan established iDirect Government and grew the company to over $100 million in annual revenue. During his tenure as CEO and President, Ratigan assembled a team of over 200 outstanding professionals and was responsible for taking iDirect Government from a startup to a well-known technology leader that deployed thousands of innovative modem solutions and satellite technologies supporting U.S. government and Department of Defense (DoD) customers across the globe. Ratigan was also responsible for acquiring GlowLink and its unique interference mitigation technology (CSIR) and fused it with iDirect’s own Evolution technology, which helped the company become the largest provider of Time Division Multiple Access (TDMA) SATCOM capabilities for the U.S. DoD.
“As a renowned leader in the satellite and defense industry, John’s deep expertise and unique experience will help enhance our strategic positioning, accelerate Comtech’s new technology trajectories, and further improve our ability to accomplish our near and long-term strategic priorities,” said Ken Peterman, President and CEO, Comtech. “John will be instrumental in identifying new opportunities, strategic partnerships, and technology synergies that will help Comtech democratize access to communications technologies, bridge the digital divide, and empower a truly connected planet. We are thrilled to have him on board as we enter our next chapter as One Comtech.”
In his position as CCDO, Ratigan will oversee new business initiatives aligned with Comtech’s strategic pursuits as the company continues its One Comtech journey.
“I’m excited to be part of Comtech’s transformational growth and it’s an honor to help lead a company where I spent 10 years earlier in my career,” said Ratigan. “I’m thrilled to be working with Ken Peterman and this incredible Comtech team where we’re bringing some of the best and brightest minds together to push the limits of innovation and make a lasting, positive impact in the world. As CCDO, I’m looking forward to helping the company identify and secure new opportunities that can unleash the full potential of the One Comtech transformation.”
Earlier in his career, Ratigan ran east coast operations for Fairchild Data, and EF DATA (now Comtech). As a company leader, Ratigan was instrumental in helping EF DATA grow from $20 million to $120 million in revenue in under eight years. During his tenure, Ratigan played a key role helping EFDATA become the preeminent leader in Single Channel Per Carrier (SCPC) satellite technology, which provided him with valuable insights related to technology migration and leadership experience that has continued to serve him well in subsequent roles. In addition to starting his own company, Ratigan held the position of Senior Vice President of North and South American sales for the start-up Broadlogic, just as companies started to run IP directly over satellite.
Ratigan began his career in the United States Senate working for Senator Bill Armstrong (R-Colorado) and held multiple sales positions with the Xerox Corporation as a member of the legal sales team.
Ratigan holds a Bachelor of Science degree in Marketing from the University of Maryland.
About Comtech
Comtech Telecommunications Corp. is a leading global technology company providing terrestrial and wireless network solutions, next-generation 9-1-1 emergency services, satellite and space communications technologies, and cloud native capabilities to commercial and government customers around the world. Our unique culture of innovation and employee empowerment unleashes a relentless passion for customer success. With multiple facilities located in technology corridors throughout the United States and around the world, Comtech leverages our global presence, technology leadership, and decades of experience to create the world’s most innovative communications solutions.For more information, please visit www.comtech.com.
Forward-Looking Statements
Certain information in this press release contains statements that are forward-looking in nature and involve certain significant risks and uncertainties. Actual results and performance could differ materially from such forward-looking information. The Company’s Securities and Exchange Commission filings identify many such risks and uncertainties. Any forward-looking information in this press release is qualified in its entirety by the risks and uncertainties described in such Securities and Exchange Commission filings.
December 6, 2023 – Vancouver, Canada – Century Lithium Corp. (TSXV:LCE) (OTCQX: CYDVF) (Frankfurt: C1Z) (“Century Lithium” or “the Company”) is pleased to provide an update on its ongoing Feasibility Study for its Clayton Valley Lithium Project (“Project”) in Clayton Valley, Nevada, and has commenced a market study on sodium hydroxide as a soluble by-product.
Highlights
Feasibility Study continues with work on options for a phased approach to production
Market study on sodium hydroxide as salable by-product to be included in the Feasibility Study
Throughout the year, Century Lithium remained focused on the development of its Clayton Valley Lithium Project. The work included ongoing testing of lithium extraction at the Pilot Plant and continuing work on the Feasibility Study for the Project, with reviews of capital and operating cost estimates with consultants Wood PLC, Global Resource Engineers, thyssenkrupp nucera USA, Saltworks Technologies Inc., and WSP USA Environment & Infrastructure Inc. This comprehensive study covers all areas of the lithium extraction process from shallow surface mining of lithium-bearing clay to on-site production of battery-grade lithium carbonate. Target production for the study follows that of the project’s earlier Pre-Feasibility Study, which was based on a mill feed of 15,000 tonnes per day and average annual output of 27,000 tonnes per year of lithium carbonate equivalent.
To date, the Company has worked with its Feasibility Study team to revise and update estimates based on optimization. Given volatility in the lithium market, the Company is examining a phased approach to full scale production to provide prospective parties with a lower risk alternative in financing. The Company is working with its consultants to determine viable phases and underlying schedules.
The scope of the Project is multi-faceted in its approach to processing, and includes clay leaching and filtration, ion-exchange based direct lithium extraction (“DLE”) from leach solutions, and the production of battery-grade lithium carbonate from the DLE product solutions via concentration, purification, and precipitation. The process is driven by locally sourced sodium chloride brine (salt solution) which is treated by electrolysis in a chlor-alkali plant to produce all the leaching and neutralization reagents required for the process on-site.
In the operation of the chlor-alkali plant, the neutralizing reagent generated is sodium hydroxide, also commonly known as lye, caustic soda, or simply caustic. In the plant, sodium hydroxide is produced as a by-product of the generation of the leaching reagent, hydrochloric acid, in an amount that is slightly greater than the production of hydrochloric acid. The acid and base are both produced in liquid form at concentrations in the range of 30-37%, The hydrochloric acid is fully utilized in the leaching process. Sodium hydroxide is used at various points in the operation for neutralization and removal of impurities.
Pilot plant testing has shown a significant amount of the sodium hydroxide will be surplus to the production process and therefore available as a by-product for potential sale. The western United States is largely dependent on imports of this essential chemical for water treatment and other industrial uses. A market study, to be incorporated in the Feasibility Study, recognizes the potential for revenue from sodium hydroxide sales, tapping into the need for a domestic supply of sodium hydroxide.
In order to properly evaluate the alternatives and incorporate economic benefits of by-product sales, described above, the Company anticipates completion of the Feasibility Study in Q1 2024.
Qualified Person
Todd Fayram, MMSA-QP and Senior Vice President, Metallurgy of Century Lithium is the qualified person as defined by National Instrument 43-101 and has approved the technical information in this release.
About Century Lithium Corp.
Century Lithium Corp. (formerly Cypress Development Corp.) is an advanced stage lithium company, focused on developing its 100%-owned Clayton Valley Lithium Project in west-central Nevada, USA. Century Lithium is currently in the pilot stage of testing on material from its lithium-bearing claystone deposit at its Lithium Extraction Facility in Amargosa Valley, Nevada and progressing towards completing a Feasibility Study and permitting, with the goal of becoming a domestic producer of lithium for the growing electric vehicle and battery storage market.
ON BEHALF OF CENTURY LITHIUM CORP. WILLIAM WILLOUGHBY, PhD., PE President & Chief Executive Officer
NEITHER THE TSX VENTURE EXCHANGE NOR ITS REGULATION SERVICES PROVIDER ACCEPTS RESPONSIBILITY FOR THE ADEQUACY OR ACCURACY OF THE CONTENT OF THIS NEWS RELEASE.
This release includes certain statements that may be deemed to be “forward-looking statements”. Forward-looking statements are subject to risks, uncertainties and assumptions and are identified by words such as “expects,” “estimates,” “projects,” “anticipates,” “believes,” “could,” “scheduled,” and other similar words. All statements in this release, other than statements of historical facts, that address events or developments that management of the Company expects, are forward-looking statements. Although management believes the expectations expressed in such forward-looking statements are based on reasonable assumptions, such statements are not guarantees of future performance, and actual results or developments may differ materially from those in the forward-looking statements. The Company undertakes no obligation to update these forward-looking statements if management’s beliefs, estimates or opinions, or other factors, should change. Factors that could cause actual results to differ materially from those in forward-looking statements, include market prices, exploration, and development successes, continued availability of capital and financing, and general economic, market or business conditions. Please see the public filings of the Company atwww.sedar.com for further information.
Net income totaled $5.1 million, or $0.16 per diluted share; non-GAAP net income totaled $6.1 million, or $0.19 per diluted share
Balance sheet strengthens, with cash and cash equivalents of $52.3 million, no debt, and year-over-year inventories down 27.6%
FORT WAYNE, Ind., Dec. 06, 2023 (GLOBE NEWSWIRE) — Vera Bradley, Inc. (Nasdaq: VRA) today announced its financial results for the third quarter and nine months ended October 28, 2023.
In this release, Vera Bradley, Inc. or “the Company” refers to the entire enterprise and includes both the Vera Bradley and Pura Vida brands. Vera Bradley on a stand-alone basis refers to the Vera Bradley brand.
Third Quarter Comments
Jackie Ardrey, Chief Executive Officer of the Company, stated, “Our efforts continue on Project Restoration, and we are very pleased with our progress to date as our associates across the Company work together to position Vera Bradley, Inc. for long-term, profitable growth. Year-over-year third quarter non-GAAP income was essentially flat, as we delivered solid gross margin expansion and carefully managed our expenses, despite sales challenges.”
“Total third quarter revenues for the Vera Bradley brand decreased 5.0% from last year,” Ardrey noted. “Vera Bradley Direct revenue declines primarily resulted from continued weakness in the outlet store channel and the impact of store closures. Year-over-year Vera Bradley Indirect revenues were up as compared to last year.
“Pura Vida year-over-year sales decreased 18.3%, with declines in both wholesale and ecommerce revenues, as prior year sales were driven by meaningfully higher levels of marketing spend, along with increased liquidation and clearance activity. Store sales remained strong. With our diligent expense management and focus on profitability, Pura Vida year-over-year third quarter operating income improved.
“At both brands, customers have responded to our latest iconic product collaborations and to our new, innovative, and on-trend product offerings, even as they have been more careful and thoughtful with their discretionary spending in the current macro environment.”
Ardrey continued, “We continue to diligently manage our debt-free balance sheet, adding to our year-over-year cash position while strategically lowering our inventory levels. Strength in this area is important in navigating an uncertain retail environment as well as in supporting our Project Restoration initiatives.
“Presently, we are taking targeted and prudent actions to stabilize revenues, and we remain focused on strong financial discipline and controlling what we can control as we react both strategically and tactically to current market conditions. Simultaneously, we have made meaningful progress on our long-term strategic plan, Project Restoration, focusing on four key pillars of the business for each brand – Consumer, Brand, Product, and Channel. We believe execution of Project Restoration will drive long-term profitable growth and deliver value to our shareholders.”
Summary of Financial Performance for the Third Quarter
Consolidated net revenues totaled $115.0 million compared to $124.0 million in the prior year third quarter ended October 29, 2022.
For the current year third quarter, Vera Bradley, Inc.’s consolidated net income totaled $5.1 million, or $0.16 per diluted share. These results included $1.0 million of net after tax charges, comprised of $0.6 million for the amortization of definite-lived intangible assets, $0.2 million of severance charges, and $0.2 million of consulting fees primarily associated with strategic initiatives. On a non-GAAP basis, Vera Bradley, Inc.’s consolidated third quarter net income totaled $6.1 million, or $0.19 per diluted share.
For the prior year third quarter, Vera Bradley, Inc.’s consolidated net income totaled $5.2 million, or $0.17 per diluted share. These results included $1.1 million of net after tax charges, comprised of $0.6 million of consulting and professional fees primarily associated with cost savings initiatives and the CEO search, $0.4 million for the amortization of definite-lived intangible assets, and $0.3 million of severance and stock-based retirement compensation charges, partially offset by a benefit of $0.2 million for the reversal of certain purchase order cancellation fees. On a non-GAAP basis, Vera Bradley, Inc.’s consolidated third quarter net income totaled $6.3 million, or $0.20 per diluted share.
Summary of Financial Performance for the Nine Months
Consolidated net revenues totaled $337.5 million for the current year nine months ended October 28, 2023, compared to $352.9 million in the prior year nine-month period ended October 29, 2022.
For the current year nine months, Vera Bradley, Inc.’s consolidated net income totaled $9.7 million, or $0.31 per diluted share. These results included $4.0 million of net after tax charges, comprised of $1.8 million of severance charges, $1.7 million for the amortization of definite-lived intangible assets, and $0.5 million of consulting and professional fees primarily associated with strategic initiatives. On a non-GAAP basis, Vera Bradley, Inc.’s consolidated net income for the nine months totaled $13.7 million, or $0.44 per diluted share.
For the prior year nine months, Vera Bradley, Inc.’s consolidated net loss totaled ($31.6) million, or ($1.00) per diluted share. These results included $34.2 million of net after tax charges, comprised of $18.2 million of Pura Vida goodwill and intangible asset impairment charges, $5.0 million of severance and stock-based retirement compensation retirement charges and other employee costs, $4.7 million of inventory adjustments associated with the exit of certain technology products and the write-off of excess mask inventory, $3.0 million of consulting and professional fees primarily associated with cost savings initiatives and the CEO search, $1.3 million of intangible asset amortization, $1.0 million of store and right-of-use asset impairment charges, $0.7 million of purchase order cancellation fees for spring 2023 goods, and $0.3 million of goodMRKT exit costs. On a non-GAAP basis, Vera Bradley, Inc.’s consolidated net income for the nine months totaled $2.6 million, or $0.08 per diluted share.
Non-GAAP Numbers
The current year non-GAAP third quarter and nine-month income statement numbers referenced below exclude the previously outlined severance charges, intangible asset amortization, and consulting and professional fees. The prior year non-GAAP third quarter income statement numbers referenced below exclude the previously outlined consulting and professional fees, amortization of definite-lived intangible assets, severance and stock-based retirement compensation charges, and a benefit for the reversal of certain purchase order cancellation fees. The prior year non-GAAP income statement numbers for the nine months referenced below exclude the previously outlined goodwill and intangible asset impairment charges, severance and stock-based retirement compensation retirement charges and other employee costs, inventory adjustments and write-offs, consulting and professional fees, intangible asset amortization, store and right-of-use asset impairment charges, purchase order cancellation fees, and goodMRKT exit costs.
Third Quarter Details
Current year third quarter Vera Bradley Direct segment revenues totaled $72.3 million, a 9.7% decrease from $80.1 million in the prior year third quarter. Comparable sales declined 8.2% in the third quarter, primarily driven by weakness in the outlet channel. Total revenues were also impacted by store closures over the last twelve months, including 15 full-line and two outlet stores. The Company also opened three outlet stores over the last twelve months.
Vera Bradley Indirect segment revenues totaled $25.0 million, a 12.0% increase over $22.3 million in the prior year third quarter, reflecting a significant one-time key account order that did not take place in the prior period.
Pura Vida segment revenues totaled $17.7 million, an 18.3% decrease from $21.7 million in the prior year third quarter, reflecting a decline in sales to wholesale accounts and a decline in ecommerce sales, partially offset by growth in retail store sales.
Third quarter consolidated gross profit totaled $63.0 million, or 54.8% of net revenues, compared to $65.9 million, or 53.1% of net revenues, in the prior year. On a non-GAAP basis, prior year gross profit totaled $65.6 million, or 52.9% of net revenues. The current year gross profit rate compared to the prior year non-GAAP rate was favorably impacted by lower year-over-year inbound and outbound freight expense, lower supply chain costs, and the sell-through of previously-reserved inventory, partially offset by increased promotional activity. Prior year gross profit was materially impacted by high inbound and outbound freight expense as well as deleverage of overhead costs.
Third quarter consolidated SG&A expense totaled $56.4 million, or 49.0% of net revenues, compared to $60.1 million, or 48.4% of net revenues, in the prior year. On a non-GAAP basis, consolidated SG&A expense totaled $55.1 million, or 48.0% of net revenues for the current year third quarter, compared to $57.6 million, or 46.4% of net revenues, in the prior year. Vera Bradley’s current year non-GAAP SG&A expenses were lower than the prior year primarily due to Company-wide cost reduction initiatives across various areas of the enterprise. The expense deleverage resulted from lower revenues.
The Company’s third quarter consolidated operating income totaled $6.8 million, or 5.9% of net revenues, compared to $6.0 million, or 4.8% of net revenues, in the prior year third quarter. On a non-GAAP basis, the Company’s current year consolidated operating income totaled $8.0 million, or 7.0% of net revenues, compared to $8.2 million, or 6.6%, of net revenues, in the prior year.
By segment:
Vera Bradley Direct operating income was $15.7 million, or 21.7% of Direct net revenues, for the third quarter, compared to $17.1 million, or 21.3% of Direct net revenues, in the prior year. On a non-GAAP basis, prior year Direct operating income totaled $16.8 million, or 21.0% of Direct net revenues.
Vera Bradley Indirect operating income was $9.0 million, or 35.9% of Indirect net revenues, for the third quarter, compared to $9.0 million, or 40.4% of Indirect net revenues, in the prior year. On a non-GAAP basis, prior year Indirect operating income totaled $9.0 million, or 40.2% of Indirect net revenues.
Pura Vida’s operating loss was ($0.6) million, or (3.3%) of Pura Vida net revenues, in the current year, compared to an operating loss of ($1.4) million, or (6.2%) of Pura Vida net revenues, in the prior year. On a non-GAAP basis, Pura Vida’s operating income was $0.1 million, or 0.8% of Pura Vida net revenues, compared to an operating loss of ($0.1) million, or (0.3%) of Pura Vida net revenues, in the prior year.
Details for the Nine Months
Vera Bradley Direct segment revenues for the current year nine-month period totaled $216.9 million, a 5.2% decrease from $228.7 million in the prior year. Comparable sales declined 5.8% for the nine months.
Vera Bradley Indirect segment revenues for the nine months totaled $57.7 million, a 2.0% increase over $56.6 million in the prior year.
Pura Vida segment revenues for the nine months totaled $62.9 million, a 6.9% decrease from $67.5 million in the prior year, reflecting a decline in sales to wholesale accounts and a decline in ecommerce sales, partially offset by growth in retail store sales.
Consolidated gross profit for the nine months totaled $186.8 million, or 55.3% of net revenues, compared to $178.9 million, or 50.7% of net revenues, in the prior year. On a non-GAAP basis, prior year gross profit totaled $185.9 million, or 52.7% of net revenues. The current year gross profit rate compared to the prior year non-GAAP rate was favorably impacted by lower year-over-year inbound and outbound freight expense, lower supply chain costs, and the sell-through of previously-reserved inventory, partially offset by an increase in promotional activity.
For the nine months, consolidated SG&A expense totaled $174.3 million, or 51.6% of net revenues, compared to $195.0 million, or 55.3% of net revenues, in the prior year. On a non-GAAP basis, current year consolidated SG&A expense totaled $169.1 million, or 50.1% of net revenues, compared to $181.0 million, or 51.3% of net revenues, in the prior year. Vera Bradley’s current year non-GAAP SG&A expenses were lower than the prior year primarily due Company-wide cost reduction initiatives across various areas of the enterprise.
For the nine months, the Company’s consolidated operating income totaled $13.3 million, or 3.9% of net revenues, compared to a consolidated operating loss of ($45.1) million, or (12.8%) of net revenues, in the prior year. On a non-GAAP basis, the Company’s current year consolidated operating income was $18.5 million, or 5.5% of net revenues, compared to $5.3 million, or 1.5% of net revenues, in the prior year.
By segment:
Vera Bradley Direct operating income was $43.7 million, or 20.1% of net revenues, compared to $32.6 million, or 14.3% of Direct net revenues, in the prior year. On a non-GAAP basis, current year Direct operating income was $44.0 million, or 20.3% of Direct net revenues, compared to $38.6 million, or 16.9% of Direct net revenues, in the prior year.
Vera Bradley Indirect operating income was $19.9 million, or 34.4% of Indirect net revenues, compared to $18.4 million, or 32.5% of Indirect net revenues, in the prior year. On a non-GAAP basis, prior year Indirect operating income totaled $19.4 million, or 34.2% of Indirect net revenues.
Pura Vida’s operating income was $5.0 million, or 7.9% of Pura Vida net revenues, compared to an operating loss of ($28.8) million, or (42.7%) of Pura Vida net revenues, in the prior year. On a non-GAAP basis, Pura Vida’s operating income was $7.2 million, or 11.5% of Pura Vida net revenues, for the current year, compared to $4.3 million, or 6.4% of Pura Vida net revenues, for the prior year.
Balance Sheet
Net capital spending for the nine months ended October 28, 2023 totaled $2.5 million compared to $7.0 million in the prior year.
Cash and cash equivalents as of October 28, 2023 totaled $52.3 million compared to $25.2 million at the end of last year’s third quarter. The Company had no borrowings on its $75 million asset-based lending (“ABL”) facility at quarter end.
Total quarter-end inventory was $129.1 million, compared to $178.3 million at the end of the third quarter last year.
During the third quarter, the Company repurchased approximately $0.5 million of its common stock (71,807 shares at an average price of $6.76), bringing the total repurchased for the nine months to approximately $1.9 million (320,127 shares at an average price of $5.94). The Company has $25.8 million remaining under its $50.0 million repurchase authorization that expires in December 2024.
Forward Outlook
Management is updating certain components of guidance for the fiscal year ending February 3, 2024 (“Fiscal 2024”) based on performance for the first nine months, Company initiatives underway, and current macroeconomic trends and expectations. The Company has revised the guidance range for diluted earnings per share for the fiscal year.
Excluding net revenues, all forward-looking guidance numbers referenced below are non-GAAP. The prior year income statement numbers exclude the previously disclosed goodwill and intangible asset impairment charges, severance and stock-based retirement compensation retirement charges and other employee costs, inventory adjustments and write-offs, certain consulting and professional fees, intangible asset amortization, store and right-of-use asset impairment charges, purchase order cancellation fees, and goodMRKT exit costs. Current year guidance excludes any similar charges.
For Fiscal 2024, the Company’s updated expectations are as follows:
Consolidated net revenues of $472 to $478 million. Net revenues totaled $500.0 million in Fiscal 2023.
A consolidated gross profit percentage of 54.0% to 54.5% compared to 51.4% in Fiscal 2023. The Fiscal 2024 gross profit rate is expected to be favorably impacted by lower year-over-year freight expense, cost reduction initiatives, and the sell-through of previously-reserved inventory, partially offset by an increase in promotional activity.
Consolidated SG&A expense of $232.5 to $235.5 million compared to $245.3 million in Fiscal 2023. An expected decline in SG&A expense is being driven by Company-wide cost reduction initiatives, partially offset by restoring short-term and long-term incentive compensation to more normalized levels and incremental marketing investment intended to accelerate customer file growth.
Consolidated operating income of $23.3 to $25.9 million compared to $12.3 million in Fiscal 2023.
Free cash flow of between $40 and $43 million compared to a cash usage of $21.7 million in Fiscal 2023.
Consolidated diluted EPS of $0.56 to $0.62 based on diluted weighted-average shares outstanding of approximately 31.0 million and an effective tax rate of approximately 28%. Diluted EPS totaled $0.24 last year.
Net capital spending of approximately $4 million compared to $8.2 million in the prior year, reflecting investments associated with new Vera Bradley outlet stores and technology and logistics enhancements.
Disclosure Regarding Non-GAAP Measures
The Company’s management does not, nor does it suggest that investors should, consider the supplemental non-GAAP financial measures in isolation from, or as a substitute for, financial information prepared in accordance with accounting principles generally accepted in the United States (“GAAP”). Further, the non-GAAP measures utilized by the Company may be unique to the Company, as they may be different from non-GAAP measures used by other companies.
The Company believes that the non-GAAP measures presented in this earnings release, including free cash flow (cash usage); gross profit; selling, general, and administrative expenses; operating income (loss); net income (loss); net income (loss) attributable and available to Vera Bradley, Inc.; and diluted net income (loss) per share available to Vera Bradley, Inc. common shareholders, along with the associated percentages of net revenues, are helpful to investors because they allow for a more direct comparison of the Company’s year-over-year performance and are consistent with management’s evaluation of business performance. A reconciliation of the non-GAAP measures to the most directly comparable GAAP measures can be found in the Company’s supplemental schedules included in this earnings release.
Call Information
A conference call to discuss results for the third quarter is scheduled for today, Wednesday, December 6, 2023, at 9:30 a.m. Eastern Time. A broadcast of the call will be available via Vera Bradley’s Investor Relations section of its website, www.verabradley.com. Alternatively, interested parties may dial into the call at (888) 204-4368, and enter the access code 7089328. A replay will be available shortly after the conclusion of the call and remain available through December 20, 2023. To access the recording, listeners should dial (844) 512-2921, and enter the access code 7089328.
About Vera Bradley, Inc.
Vera Bradley, Inc. operates two unique lifestyle brands – Vera Bradley and Pura Vida. Vera Bradley and Pura Vida are complementary businesses, both with devoted, emotionally-connected, and multi-generational female customer bases; alignment as casual, comfortable, affordable, and fun brands; positioning as “gifting” and socially-connected brands; strong, entrepreneurial cultures; a keen focus on community, charity, and social consciousness; multi-channel distribution strategies; and talented leadership teams aligned and committed to the long-term success of their brands.
Vera Bradley, based in Fort Wayne, Indiana, is a leading designer of women’s handbags, luggage and other travel items, fashion and home accessories, and unique gifts. Founded in 1982 by friends Barbara Bradley Baekgaard and Patricia R. Miller, the brand is known for its innovative designs, iconic patterns, and brilliant colors that inspire and connect women unlike any other brand in the global marketplace.
In July 2019, Vera Bradley, Inc. acquired a 75% interest in Creative Genius, Inc., which also operates under the name Pura Vida Bracelets (“Pura Vida”). Pura Vida, based in La Jolla, California, is a digitally native, highly-engaging lifestyle brand founded in 2010 by friends Paul Goodman and Griffin Thall. Pura Vida has a differentiated and expanding offering of bracelets, jewelry, and other lifestyle accessories. The Company acquired the remaining 25% of Pura Vida in January 2023.
The Company has three reportable segments: Vera Bradley Direct (“VB Direct”), Vera Bradley Indirect (“VB Indirect”), and Pura Vida. The VB Direct business consists of sales of Vera Bradley products through Vera Bradley Full-Line and Factory Outlet stores in the United States, www.verabradley.com, Vera Bradley’s online outlet site, and the Vera Bradley annual outlet sale in Fort Wayne, Indiana. The VB Indirect business consists of sales of Vera Bradley products to approximately 1,600 specialty retail locations throughout the United States, as well as select department stores, national accounts, third party e-commerce sites, and third-party inventory liquidators, and royalties recognized through licensing agreements related to the Vera Bradley brand. The Pura Vida segment consists of sales of Pura Vida products through the Pura Vida websites, www.puravidabracelets.com, www.puravidabracelets.ca, and www.puravidabracelets.eu; through the distribution of its products to wholesale retailers and department stores; and through its Pura Vida retail stores.
Website Information
We routinely post important information for investors on our website www.verabradley.com in the “Investor Relations” section. We intend to use this webpage as a means of disclosing material, non-public information and for complying with our disclosure obligations under Regulation FD. Accordingly, investors should monitor the Investor Relations section of our website, in addition to following our press releases, SEC filings, public conference calls, presentations and webcasts. The information contained on, or that may be accessed through, our webpage is not incorporated by reference into, and is not a part of, this document.
Investors and other interested parties may also access the Company’s most recent Corporate Responsibility and Sustainability Report outlining its ESG (Environmental, Social, and Governance) initiatives at https://verabradley.com/pages/corporate-responsibility.
Vera Bradley Safe Harbor Statement
Certain statements in this release are “forward-looking statements” made pursuant to the safe-harbor provisions of the Private Securities Litigation Reform Act of 1995. Such forward-looking statements reflect the Company’s current expectations or beliefs concerning future events and are subject to various risks and uncertainties that may cause actual results to differ materially from those that we expected, including: possible adverse changes in general economic conditions and their impact on consumer confidence and spending; possible inability to predict and respond in a timely manner to changes in consumer demand; possible loss of key management or design associates or inability to attract and retain the talent required for our business; possible inability to maintain and enhance our brands; possible inability to successfully implement the Company’s long-term strategic plans; possible inability to successfully open new stores, close targeted stores, and/or operate current stores as planned; incremental tariffs or adverse changes in the cost of raw materials and labor used to manufacture our products; possible adverse effects resulting from a significant disruption in our distribution facilities; or business disruption caused by pandemics. More information on potential factors that could affect the Company’s financial results is included from time to time in the “Risk Factors” and “Management’s Discussion and Analysis of Financial Condition and Results of Operations” sections of the Company’s public reports filed with the SEC, including the Company’s Form 10-K for the fiscal year ended January 28, 2023. We undertake no obligation to publicly update or revise any forward-looking statement. Financial schedules are attached to this release.
Liabilities, Redeemable Noncontrolling Interest, and Shareholders’ Equity
Current liabilities:
Accounts payable
$
12,297
$
20,350
$
31,125
Accrued employment costs
11,756
14,312
12,252
Short-term operating lease liabilities
18,673
19,714
19,742
Other accrued liabilities
13,671
12,723
14,771
Income taxes payable
570
558
501
Total current liabilities
56,967
67,657
78,391
Long-term operating lease liabilities
63,915
74,664
80,109
Other long-term liabilities
71
90
85
Total liabilities
120,953
142,411
158,585
Redeemable noncontrolling interest
–
10,712
23,153
Shareholders’ equity:
Additional paid-in-capital
112,397
109,718
109,070
Retained earnings
284,322
274,629
302,790
Accumulated other comprehensive loss
(74
)
(105
)
(181
)
Treasury stock
(134,764
)
(132,864
)
(132,080
)
Total shareholders’ equity of Vera Bradley, Inc.
261,881
251,378
279,599
Total liabilities, redeemable noncontrolling interest, and shareholders’ equity
$
382,834
$
404,501
$
461,337
Vera Bradley, Inc.
Condensed Consolidated Statements of Operations
(in thousands, except per share amounts)
(unaudited)
Thirteen Weeks Ended
Thirty-Nine Weeks Ended
October 28, 2023
October 29, 2022
October 28, 2023
October 29, 2022
Net revenues
$
114,987
$
124,040
$
337,521
$
352,870
Cost of sales
51,980
58,164
150,749
173,963
Gross profit
63,007
65,876
186,772
178,907
Selling, general, and administrative expenses
56,363
60,059
174,274
195,015
Impairment of goodwill and intangible assets
–
–
–
29,338
Other income, net
142
141
773
350
Operating income (loss)
6,786
5,958
13,271
(45,096
)
Interest (income) expense, net
(285
)
39
(241
)
115
Income (loss) before income taxes
7,071
5,919
13,512
(45,211
)
Income tax expense (benefit)
1,953
1,090
3,819
(6,429
)
Net income (loss)
5,118
4,829
9,693
(38,782
)
Less: Net loss attributable to redeemable noncontrolling interest
–
(338
)
–
(7,208
)
Net income (loss) attributable to Vera Bradley, Inc.
$
5,118
$
5,167
$
9,693
$
(31,574
)
Basic weighted-average shares outstanding
30,814
31,061
30,836
31,721
Diluted weighted-average shares outstanding
31,322
31,229
31,246
31,721
Basic net income (loss) per share available to Vera Bradley, Inc. common shareholders
$
0.17
$
0.17
$
0.31
$
(1.00
)
Diluted net income (loss) per share available to Vera Bradley, Inc. common shareholders
$
0.16
$
0.17
$
0.31
$
(1.00
)
Vera Bradley, Inc.
Condensed Consolidated Statements of Cash Flows
(in thousands)
(unaudited)
Thirty-Nine Weeks Ended
October 28, 2023
October 29, 2022
Cash flows from operating activities
Net income (loss)
$
9,693
$
(38,782)
Adjustments to reconcile net income (loss) to net cash provided by (used in) operating activities:
Depreciation of property, plant, and equipment
5,988
6,685
Amortization of operating right-of-use assets
15,622
16,151
Goodwill and intangible asset impairment
–
29,338
Other impairment charges
–
1,351
Amortization of intangible assets
2,187
2,305
Provision for doubtful accounts
87
(80)
Stock-based compensation
2,365
2,593
Deferred income taxes
3,155
(5,524)
Other non-cash loss, net
50
–
Changes in assets and liabilities:
Accounts receivable
(3,581)
(4,354)
Inventories
13,135
(33,453)
Prepaid expenses and other assets
(688)
2,764
Accounts payable
(8,134)
49
Income taxes
(53)
5,772
Operating lease liabilities, net
(16,495)
(19,262)
Accrued and other liabilities
(2,273)
(2,311)
Net cash provided by (used in) operating activities
21,058
(36,758)
Cash flows from investing activities
Purchases of property, plant, and equipment
(2,546)
(6,968)
Cash paid for business acquisition
(10,000)
–
Net cash used in investing activities
(12,546)
(6,968)
Cash flows from financing activities
Tax withholdings for equity compensation
(972)
(1,430)
Repurchase of common stock
(1,900)
(17,278)
Distributions to redeemable noncontrolling interest
–
(613)
Net cash used in financing activities
(2,872)
(19,321)
Effect of exchange rate changes on cash and cash equivalents
31
(152)
Net increase (decrease) in cash and cash equivalents
$
5,671
$
(63,199)
Cash and cash equivalents, beginning of period
46,595
88,436
Cash and cash equivalents, end of period
$
52,266
$
25,237
Vera Bradley, Inc.
Third Quarter Fiscal 2024
GAAP to Non-GAAP Reconciliation Thirteen Weeks Ended October 28, 2023
(in thousands, except per share amounts)
(unaudited)
Thirteen Weeks Ended
As Reported
Other Items
Non-GAAP (Excluding Items)
Gross profit
$
63,007
$
–
$
63,007
Selling, general, and administrative expenses
56,363
1,216
1
55,147
Operating income (loss)
6,786
(1,216
)
8,002
Income (loss) before income taxes
7,071
(1,216
)
8,287
Income tax expense (benefit)
1,953
(234
)
2
2,187
Net income (loss)
5,118
(982
)
6,100
Less: Net loss attributable to redeemable noncontrolling interest
–
–
–
Net income (loss) attributable to Vera Bradley, Inc.
5,118
(982
)
6,100
Diluted net income (loss) per share available to Vera Bradley, Inc. common shareholders
$
0.16
$
(0.03
)
$
0.19
Vera Bradley Direct segment operating income
$
15,708
$
–
$
15,708
Vera Bradley Indirect segment operating income
$
8,967
$
–
$
8,967
Pura Vida segment operating (loss) income
$
(580
)
$
(729
)
3
$
149
Unallocated corporate expenses
$
(17,309
)
$
(487
)
4
$
(16,822
)
1Items include $729 for the amortization of definite-lived intangible assets; $304 for severance charges; and $183 for certain professional fees and consulting fees associated with strategic initiatives
2Related to the tax impact of the items mentioned above
3Related to $729 for the amortization of definite-lived intangible assets
4Related to $304 for severance charges; and $183 for certain professional fees and consulting fees associated with strategic initiatives
Vera Bradley, Inc.
Third Quarter Fiscal 2023
GAAP to Non-GAAP Reconciliation Thirteen Weeks Ended October 29, 2022
(in thousands, except per share amounts)
(unaudited)
Thirteen Weeks Ended
As Reported
Other Items
Non-GAAP (Excluding Items)
Gross profit
$
65,876
$
276
1
$
65,600
Selling, general, and administrative expenses
60,059
2,470
2
57,589
Impairment of goodwill and intangible assets
–
–
–
Operating income (loss)
5,958
(2,194
)
8,152
Income (loss) before income taxes
5,919
(2,194
)
8,113
Income tax expense (benefit)
1,090
(763
)
3
1,853
Net income (loss)
4,829
(1,431
)
6,260
Less: Net loss attributable to redeemable noncontrolling interest
(338
)
(322
)
(16
)
Net income (loss) attributable to Vera Bradley, Inc.
5,167
(1,109
)
6,276
Diluted net income (loss) per share available to Vera Bradley, Inc. common shareholders
$
0.17
$
(0.04
)
$
0.20
Vera Bradley Direct segment operating income
$
17,060
$
225
4
$
16,835
Vera Bradley Indirect segment operating income
$
9,012
$
51
4
$
8,961
Pura Vida segment operating loss
$
(1,353
)
$
(1,289
)
5
$
(64
)
Unallocated corporate expenses
$
(18,761
)
$
(1,181
)
6
$
(17,580
)
1Related to the reversal of certain PO cancellation fees
2Items include $1,133 for consulting fees associated with cost savings initiatives and CEO search, as well as certain Pura Vida professional fees; $768 for the amortization of definite-lived intangible assets; $406 for severance charges; and $163 for CEO stock-based compensation associated with retirement
3Related to the tax impact of the charges mentioned above
4Related to an allocation for reversals of certain PO cancellation fees
5Related to $768 for the amortization of definite-lived intangible assets; and $406 for severance charges; and $115 for certain professional fees
6Related to $1,018 for consulting fees associated with cost savings initiatives and CEO search and $163 for CEO stock-based compensation associated with retirement
Vera Bradley, Inc.
GAAP to Non-GAAP Reconciliation Thirty-Nine Weeks Ended October 28, 2023
(in thousands, except per share amounts)
(unaudited)
Thirty-Nine Weeks Ended
As Reported
Other Items
Non-GAAP (Excluding Items)
Gross profit
$
186,772
$
–
$
186,772
Selling, general, and administrative expenses
174,274
5,217
1
169,057
Operating income (loss)
13,271
(5,217
)
18,488
Income (loss) before income taxes
13,512
(5,217
)
18,729
Income tax expense (benefit)
3,819
(1,247
)
2
5,066
Net income (loss)
9,693
(3,970
)
13,663
Less: Net loss attributable to redeemable noncontrolling interest
–
–
–
Net income (loss) attributable to Vera Bradley, Inc.
9,693
(3,970
)
13,663
Diluted net income (loss) per share available to Vera Bradley, Inc. common shareholders
$
0.31
$
(0.13
)
$
0.44
Vera Bradley Direct segment operating income (loss)
$
43,669
$
(342
)
3
$
44,011
Vera Bradley Indirect segment operating income
$
19,877
$
–
$
19,877
Pura Vida segment operating income (loss)
$
4,982
$
(2,266
)
4
$
7,248
Unallocated corporate expenses
$
(55,257
)
$
(2,609
)
5
$
(52,648
)
1Items include $2,372 for severance charges; $2,187 for the amortization of definite-lived intangible assets; and $658 for certain professional fees and consulting fees associated with strategic initiatives
2Related to the tax impact of the items mentioned above
3Related to severance charges
4Related to $2,187 for the amortization of definite-lived intangible assets and $79 for severance charges
5Items include $1,951 for severance charges and $658 associated with certain professional fees and consulting fees for strategic initiatives
Vera Bradley, Inc.
GAAP to Non-GAAP Reconciliation Thirty-Nine Weeks Ended October 29, 2022
(in thousands, except per share amounts)
(unaudited)
Thirty-Nine Weeks Ended
As Reported
Other Items
Non-GAAP (Excluding Items)
Gross profit (loss)
$
178,907
$
(7,000
)
1
$
185,907
Selling, general, and administrative expenses
195,015
14,057
2
180,958
Impairment of goodwill and intangible assets
29,338
29,338
–
Operating (loss) income
(45,096
)
(50,395
)
5,299
(Loss) income before income taxes
(45,211
)
(50,395
)
5,184
Income tax (benefit) expense
(6,429
)
(7,898
)
3
1,469
Net (loss) income
(38,782
)
(42,497
)
3,715
Less: Net (loss) income attributable to redeemable noncontrolling interest
(7,208
)
(8,285
)
1,077
Net (loss) income attributable to Vera Bradley, Inc.
(31,574
)
(34,212
)
2,638
Diluted net (loss) income per share available to Vera Bradley, Inc. common shareholders
$
(1.00
)
$
(1.08
)
$
0.08
Vera Bradley Direct segment operating income (loss)
$
32,607
$
(5,948
)
4
$
38,555
Vera Bradley Indirect segment operating income (loss)
$
18,409
$
(943
)
5
$
19,352
Pura Vida segment operating (loss) income
$
(28,831
)
$
(33,143
)
6
$
4,312
Unallocated corporate expenses
$
(67,281
)
$
(10,361
)
7
$
(56,920
)
1Items include $6,142 for inventory adjustments associated with the exit of certain technology products and the goodMRKT brand, as well as excess mask products and $858 for PO cancellation fees
2Items include $6,120 for severance charges; $4,038 for consulting fees associated with cost savings initiatives, CEO search, and certain Pura Vida professional fees; $2,305 for the amortization of definite-lived intangible assets; $1,351 for store and right-of-use asset impairment charges; $163 for CEO stock-based compensation associated with retirement; and $80 for goodMRKT brand exit costs
3Related to the tax impact of the charges mentioned above, as well as goodwill and intangible asset impairment charges
4Related to $4,872 related to an allocation for certain inventory adjustments and PO cancellation fees; $759 for store impairment charges; $302 for goodMRKT brand exit costs; and $15 for severance charges
5Related to an allocation for certain inventory adjustments and PO cancellation fees
6Related to $29,338 of goodwill and intangible asset impairment charges; $2,305 for the amortization of definite-lived intangible assets; $963 for inventory adjustments associated with mask products; $422 for severance charges; and $115 for certain professional fees
7Related to $5,683 for severance charges; $3,923 for consulting fees associated with cost savings initiatives and CEO search; $592 for a right-of-use asset impairment charge; and $163 for CEO stock-based compensation associated with retirement
BOTHELL, Wash., Dec. 06, 2023 (GLOBE NEWSWIRE) — Cocrystal Pharma, Inc. (Nasdaq: COCP) (“Cocrystal” or the “Company”) announces the achievement of first-patient-in for the Phase 2a human challenge clinical trial with CC-42344, an investigational new oral antiviral inhibitor for the treatment of pandemic and seasonal influenza A. This randomized, double-blind, placebo-controlled study will evaluate the safety, tolerability, viral and clinical measurements of influenza A infection in subjects dosed with oral CC-42344 treatment.
“There is an urgent need for new oral antivirals targeting pandemic and seasonal influenza that address drug resistance. CC-42344 was discovered using our proprietary structure-based drug discovery platform technology to inhibit the viral replication process. The data from this proof-of-concept clinical study will further validate CC-42344’s novel mechanism of action,” said Sam Lee, Ph.D., Cocrystal’s President and co-CEO. “We expect to report topline data from this clinical trial in 2024.”
“We are excited about the potential CC-42344 holds to create a paradigm shift in the treatment of one the world’s most common viral infections,” added James Martin, Cocrystal’s CFO and co-CEO. “Currently approved antiviral treatments for influenza are prone to viral resistance, increasing the need for improved influenza treatments for patients that also provide significant cost savings to the global healthcare system.”
About Cocrystal Pharma, Inc. Cocrystal Pharma, Inc. is a clinical-stage biotechnology company discovering and developing novel antiviral therapeutics that target the replication process of influenza viruses, coronaviruses (including SARS-CoV-2) noroviruses and hepatitis C viruses. Cocrystal employs unique structure-based technologies and Nobel Prize-winning expertise to create first- and best-in-class antiviral drugs. For further information about Cocrystal, please visit www.cocrystalpharma.com.
Cautionary Note Regarding Forward-Looking Statements This press release contains forward-looking statements within the meaning of the Private Securities Litigation Reform Act of 1995, including statements regarding the initiation and characteristics of a Phase 2a study for CC-42344 as a product candidate for oral antiviral inhibitor for the treatment of pandemic and seasonal influenza A, the potential efficacy and clinical benefits of, and market for, such product candidate, and the expected results and topline data from this clinical trial in 2024. The words “believe,” “may,” “estimate,” “continue,” “anticipate,” “intend,” “should,” “plan,” “could,” “target,” “potential,” “is likely,” “will,” “expect” and similar expressions, as they relate to us, are intended to identify forward-looking statements. We have based these forward-looking statements largely on our current expectations and projections about future events. Some or all of the events anticipated by these forward-looking statements may not occur. Important factors that could cause actual results to differ from those in the forward-looking statements include, but are not limited to, risks relating to our ability to proceed with the Phase 2a study including recruiting volunteers and procuring materials for such study by our clinical research organizations and vendors, and the results of such study. Further information on our risk factors is contained in our filings with the SEC, including our Annual Report on Form 10-K for the year ended December 31, 2022. Any forward-looking statement made by us herein speaks only as of the date on which it is made. Factors or events that could cause our actual results to differ may emerge from time to time, and it is not possible for us to predict all of them. We undertake no obligation to publicly update any forward-looking statement, whether as a result of new information, future developments or otherwise, except as may be required by law.
Atherosclerosis, an inflammatory disease characterized by buildup of cholesterol, lipids, and other substances (plaque) in arteries leading to heart attack and stroke, is accelerated in patients with diabetes.
The study published in Diabetes demonstrates that AIM2 and NLRP3 inflammasome activation leads to development of atherosclerotic lesions in diabetic mice.
ZyVersa is developing Inflammasome ASC Inhibitor IC 100, which inhibits multiple inflammasome pathways (including NLRP3 and AIM2) to attenuate initiation and perpetuation of damaging inflammation that is pathogenic in numerous diseases.
WESTON, Fla., Dec. 06, 2023 (GLOBE NEWSWIRE) — ZyVersa Therapeutics, Inc. (Nasdaq: ZVSA, or “ZyVersa”), a clinical stage specialty biopharmaceutical company developing first-in-class drugs for treatment of inflammatory and renal diseases, announces publication of an article in the peer-reviewed journal, Diabetes, demonstrating that AIM2 and NLRP3 inflammasome activation contributes to development of atherosclerosis in two different animal models of type 1 diabetes.
In the paper titled, “Hematopoietic NLRP3 and AIM2 inflammasomes promote diabetes-accelerated atherosclerosis, but increased necrosis is independent of pyroptosis,” the authors studied mouse models of type 1 diabetes and atherosclerosis. Following are key findings reported in the paper:
Diabetic animals demonstrated activation of inflammasome pathways, based on increased levels of plasma IL-1β and IL-18, and elevated levels of cleaved caspase- 1 in the peritoneal cavity fluid.
Each of the two different type 1 diabetes models exhibited similar levels of plasma IL- 1β and IL-18 and similar aortic lesion sizes and severity.
Diabetic mice deficient in NLRP3 and/or AIM2 had reduced aortic lesion size compared to diabetic controls, indicating that NLRP3 and AIM2 inflammasome activation contributes to atherosclerotic lesion development.
Results are consistent with other animal model studies showing deficiencies in essential inflammasome components, such as NLRP3, AIM2, ASC, and caspase-1, appear to protect against atherosclerosis.
“The research published in Diabetes reinforces that inhibition of multiple types of inflammasomes, not just NLRP3, may be required to effectively control inflammation in diseases, such as atherosclerosis, in which activation of more than one type of inflammasome is pathogenic,” commented Stephen C. Glover, ZyVersa’s Co-founder, Chairman, CEO and President. “ZyVersa’s Inflammasome ASC inhibitor IC 100 is designed to inhibit formation of multiple types of inflammasomes and their associated ASC specks to attenuate initiation and perpetuation of damaging inflammation contributing to numerous diseases.” To review a white paper summarizing the mechanism of action and preclinical data for IC 100, Click Here.
About Inflammasome ASC Inhibitor IC 100
IC 100 is a novel humanized IgG4 monoclonal antibody that inhibits the inflammasome adaptor protein ASC. IC 100 was designed to attenuate both initiation and perpetuation of the inflammatory response. It does so by binding to a specific region of the ASC component of multiple types of inflammasomes, including NLRP1, NLRP2, NLRP3, NLRC4, AIM2, Pyrin. Intracellularly, IC 100 binds to ASC monomers, inhibiting inflammasome formation, thereby blocking activation of IL-1β early in the inflammatory cascade. IC 100 also binds to ASC Specks, both intracellularly and extracellularly, further blocking activation of IL-1β and the perpetuation of the inflammatory response that is pathogenic in inflammatory diseases. Because active cytokines amplify adaptive immunity through various mechanisms, IC 100, by attenuating cytokine activation, also attenuates the adaptive immune response.
About ZyVersa Therapeutics, Inc.
ZyVersa (Nasdaq: ZVSA) is a clinical stage specialty biopharmaceutical company leveraging advanced, proprietary technologies to develop first-in-class drugs for patients with renal and inflammatory diseases who have significant unmet medical needs. The Company is currently advancing a therapeutic development pipeline with multiple programs built around its two proprietary technologies – Cholesterol Efflux Mediator™ VAR 200 for treatment of kidney diseases, and Inflammasome ASC Inhibitor IC 100, targeting damaging inflammation associated with numerous CNS and other inflammatory diseases. For more information, please visit www.zyversa.com.
Certain statements contained in this press release regarding matters that are not historical facts, are forward-looking statements within the meaning of Section 21E of the Securities Exchange Act of 1934, as amended, and the Private Securities Litigation Reform Act of 1995. These include statements regarding management’s intentions, plans, beliefs, expectations, or forecasts for the future, and, therefore, you are cautioned not to place undue reliance on them. No forward-looking statement can be guaranteed, and actual results may differ materially from those projected. ZyVersa Therapeutics, Inc (“ZyVersa”) uses words such as “anticipates,” “believes,” “plans,” “expects,” “projects,” “future,” “intends,” “may,” “will,” “should,” “could,” “estimates,” “predicts,” “potential,” “continue,” “guidance,” and similar expressions to identify these forward-looking statements that are intended to be covered by the safe-harbor provisions. Such forward-looking statements are based on ZyVersa’s expectations and involve risks and uncertainties; consequently, actual results may differ materially from those expressed or implied in the statements due to a number of factors, including ZyVersa’s plans to develop and commercialize its product candidates, the timing of initiation of ZyVersa’s planned preclinical and clinical trials; the timing of the availability of data from ZyVersa’s preclinical and clinical trials; the timing of any planned investigational new drug application or new drug application; ZyVersa’s plans to research, develop, and commercialize its current and future product candidates; the clinical utility, potential benefits and market acceptance of ZyVersa’s product candidates; ZyVersa’s commercialization, marketing and manufacturing capabilities and strategy; ZyVersa’s ability to protect its intellectual property position; and ZyVersa’s estimates regarding future revenue, expenses, capital requirements and need for additional financing.
New factors emerge from time-to-time, and it is not possible for ZyVersa to predict all such factors, nor can ZyVersa assess the impact of each such factor on the business or the extent to which any factor, or combination of factors, may cause actual results to differ materially from those contained in any forward-looking statements. Forward-looking statements included in this press release are based on information available to ZyVersa as of the date of this press release. ZyVersa disclaims any obligation to update such forward-looking statements to reflect events or circumstances after the date of this press release, except as required by applicable law.
Corporate and IR Contact: Karen Cashmere Chief Commercial Officer kcashmere@zyversa.com 786-251-9641
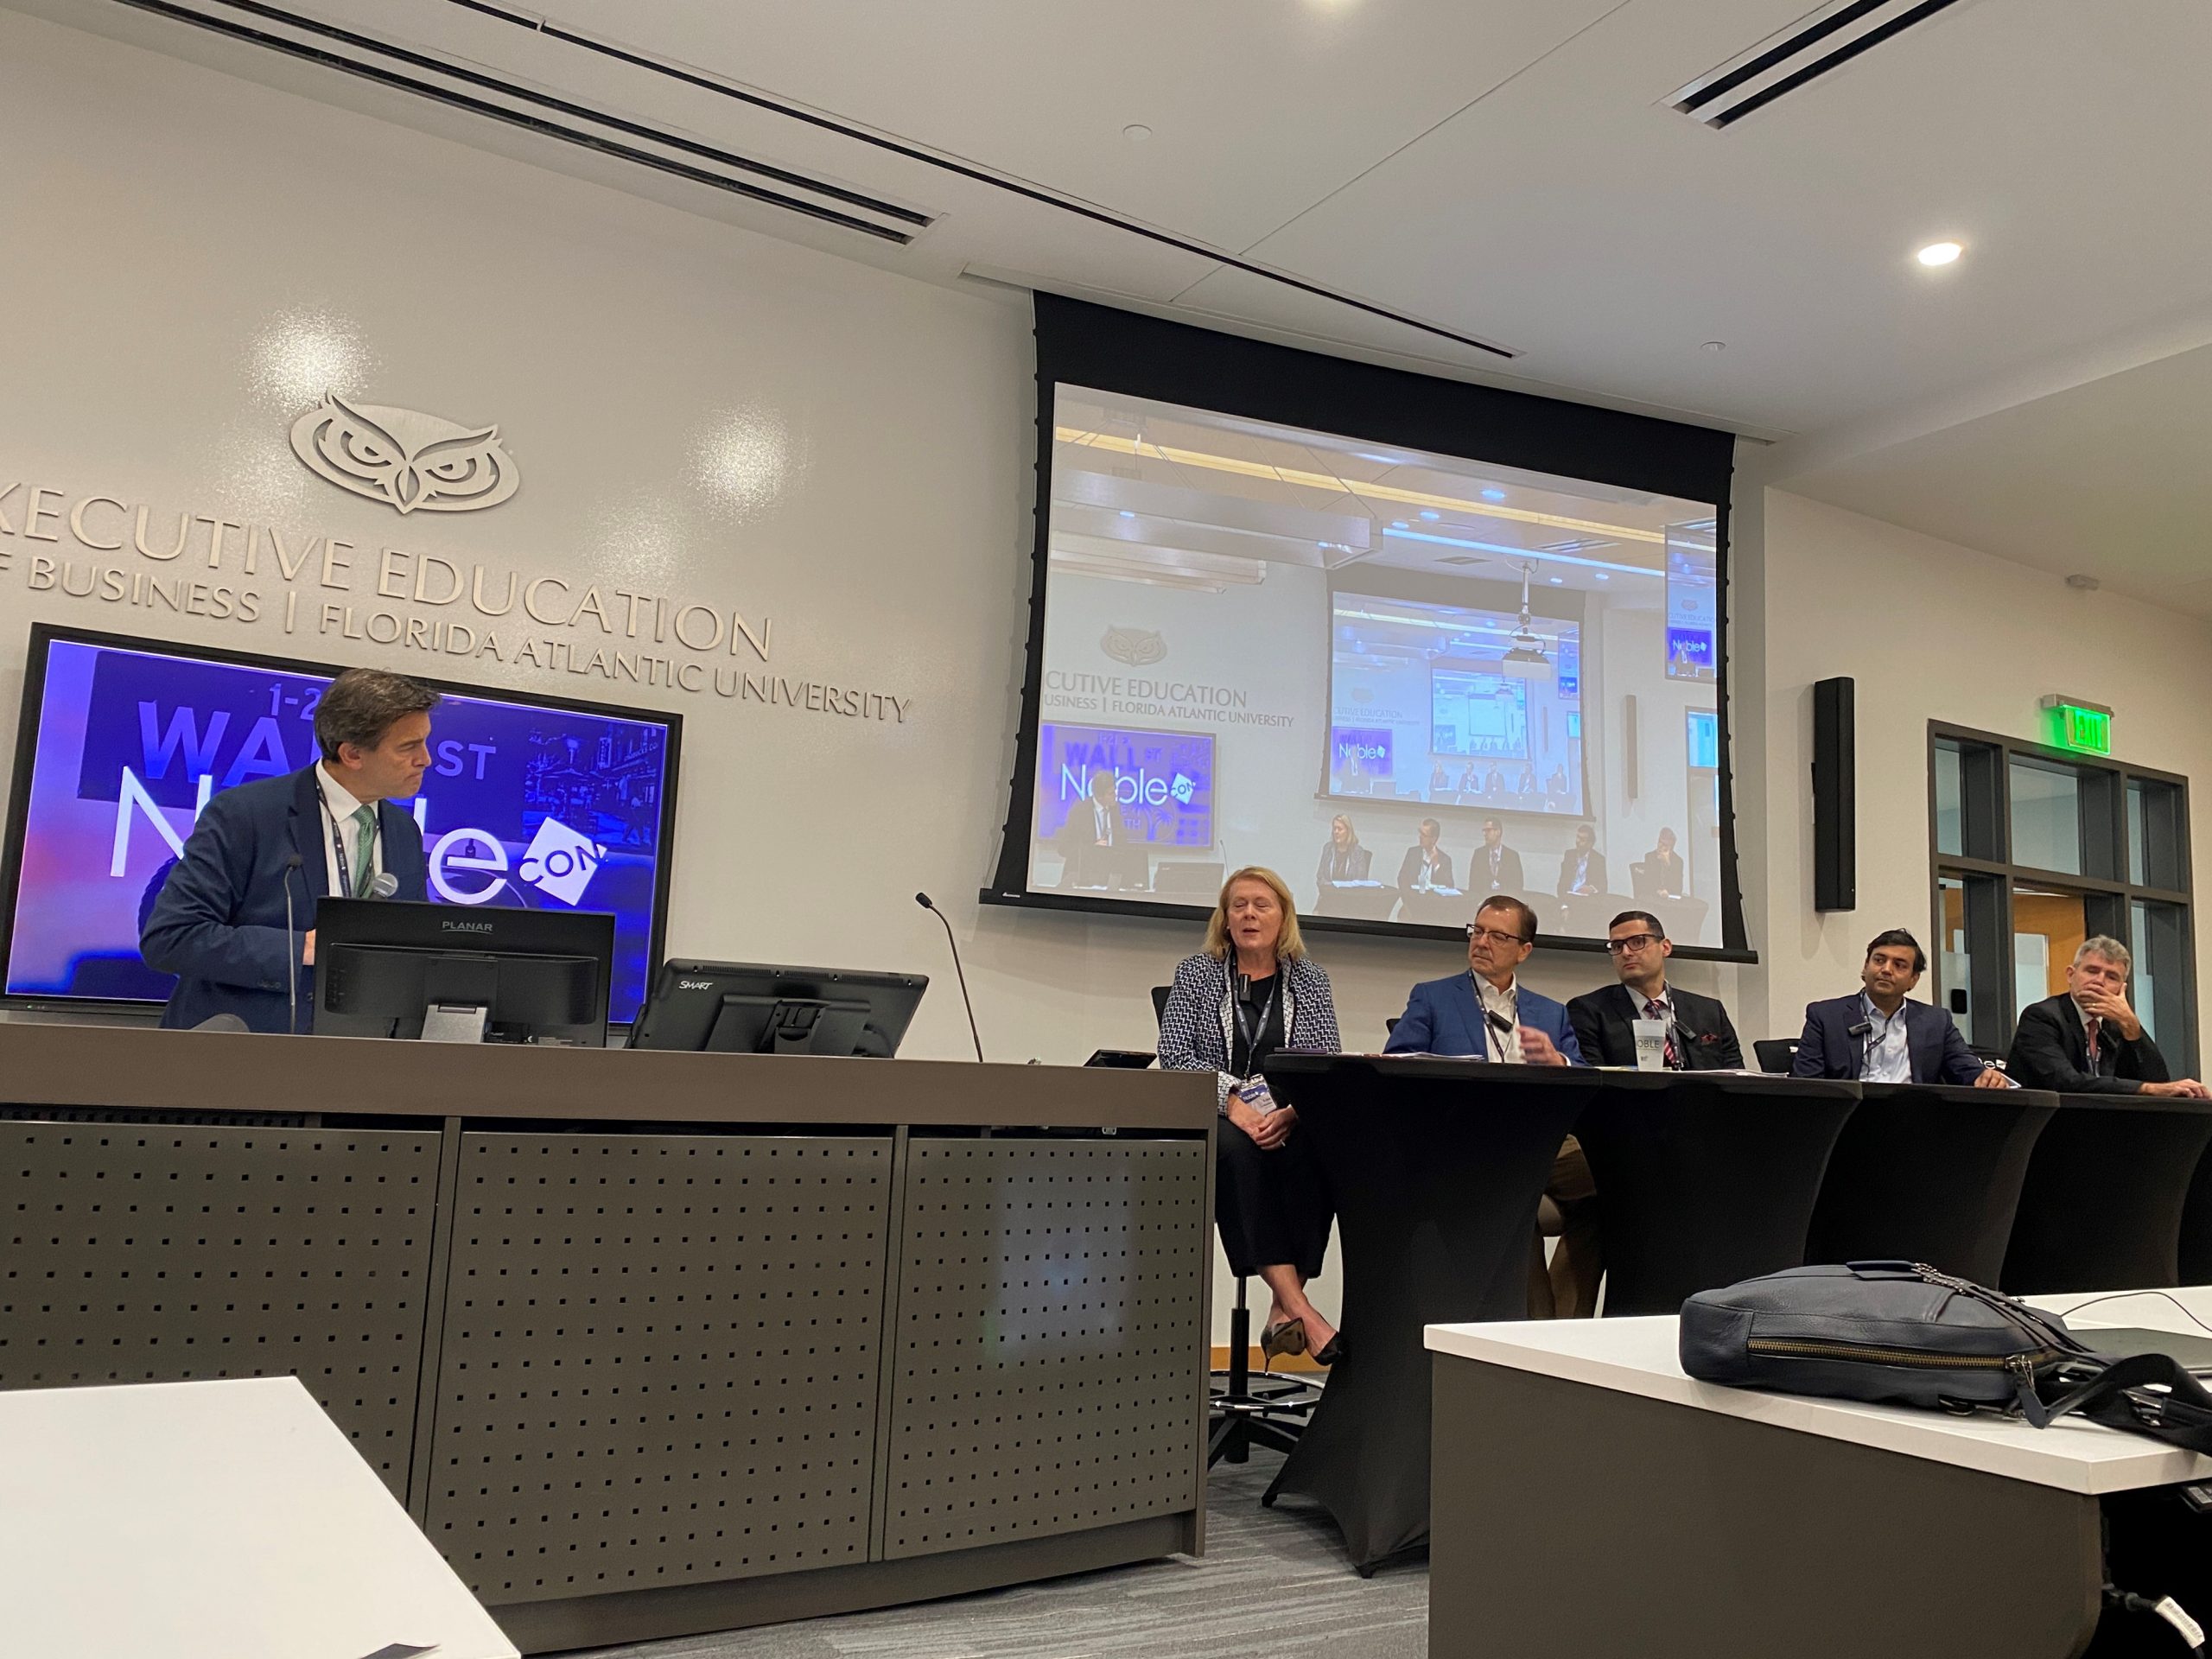
The Economic Perspectives Panel’s discussions at the recent NobleCon19 emerging growth conference not only provided valuable insights into various sectors and the broader economic landscape but also served as a comprehensive analysis that captivated the audience’s attention. The panel, featuring a diverse range of experts from industry leaders to economists, offered nuanced perspectives on the challenges that have characterized markets since 2021 and identified potential opportunities, notably emphasizing the potential for undervalued small-cap investments.
The conference kicked off with an Economic Outlook Panel, expertly moderated by Michael Williams, a seasoned News Anchor at WPTV/NBC in West Palm Beach. Williams adeptly steered the discussions through key topics, leveraging the wealth of knowledge from panelists such as Lisa Knutson, COO of E.W. Scripps;Cary Marshall, CFO of Alliance Resource Partners; Jose Torres, Senior Economist at Interactive Brokers; Shanoop Kothari, Co-CEO of LuxUrban Hotels; and Dan Thelen, Managing Director of Small/Mid Caps at Ancora.
A prevailing sentiment among the panelists was the intriguing possibility of 2024 mirroring the economic resurgence experienced in 1990, a year that followed a challenging period. Notably, the consensus was that small-cap investments tend to outperform larger companies during economic recoveries due to their inherent agility and greater potential for growth. The panel expressed cautious optimism, suggesting that the Russell 2000 index might pleasantly surprise investors in the upcoming year.
The discussion also spotlighted sectors of particular interest, with media and advertising taking center stage. The anticipation of heavy political ad spending, estimated at an impressive $10-12 billion leading up to the 2024 election, captured the attention of the panel. Additionally, the oil and gas markets were under scrutiny, with a notable supply response identified as a contributing factor in curbing recent inflation concerns. Projections indicated a forecasted addition of 2.2 million extra barrels per day in the US in 2023, with prices already having experienced a 17% drop from their earlier peak in the year.
Delving into broader economic discussions, the panel highlighted the resilience observed in 2023 to date, supported by a robust labor market and excess pandemic savings fueling consumption. However, the panel cautioned against undue optimism, pointing to expectations of a potential slowdown in 2024, particularly as the Federal Reserve eases interest rates and government spending recedes. The acceptance of a 3-3.5% baseline inflation in the long term was posited as a necessary acknowledgment, notwithstanding the official 2% target.
While acknowledging potential risks in the commercial real estate sector, the panel expressed confidence that forward-thinking companies were actively engaged in cost-cutting measures and prudent inventory management. The overarching expectation was that stock returns would follow a trajectory reminiscent of the positive trends witnessed in 1990, thereby making small-cap investments an attractive prospect for investors keen on capitalizing on emerging opportunities.
Addressing the transformative impact of artificial intelligence (AI) on various facets of business and society, the panel collectively agreed that AI is not just a passing trend but a transformative force that is here to stay. Cary Marshall went as far as declaring, “AI is the electrification of this country.” While recognizing the potential for AI to reduce labor costs, the panelists cautioned that widespread adoption might take longer than initially anticipated. Jose Torres added a nuanced perspective, suggesting that AI could lead to shorter workdays but expressed concerns about the potential erosion of interpersonal skills critical for persuasion and influence.
In conclusion, the panel emphasized the indispensable need for mental toughness, emotion management, and discipline in navigating the inevitable cycles of the markets. Despite the multifaceted challenges, the prevailing sentiment was one of guarded optimism for the road ahead. As markets continue to evolve and present new dynamics, these key takeaways from the Economic Perspectives Panel offer invaluable insights for investors seeking to navigate the intricate landscape of emerging growth and economic recovery, providing a robust foundation for strategic decision-making in the ever-changing financial environment.
TNX-2900 is a proprietary magnesium-potentiated formulation of intranasal oxytocin, a naturally occurring hormone that reduces appetite and eating
Preclinical data show magnesium-potentiation increases the potency of exogenous oxytocin
Formulations of intranasal oxytocin without magnesium have reported inconsistent results in clinical trials of Prader Willi Syndrome1,2
CHATHAM, N.J., Dec. 04, 2023 (GLOBE NEWSWIRE) — Tonix Pharmaceuticals Holding Corp. (Nasdaq: TNXP), a biopharmaceutical company with marketed products and a pipeline of development candidates, today announced the U.S. Food and Drug Administration (FDA) has cleared the Investigational New Drug (IND) application to support clinical development of TNX-2900 (intranasal potentiated oxytocin), a proprietary magnesium (Mg2+)-enhanced formulation of intranasal oxytocin, to treat Prader-Willi syndrome (PWS) in children and adolescents. TNX-2900 for the treatment of PWS was granted Orphan Drug designation by the FDA in 2022.
The Phase 2 study approved by the IND is a dose-finding study involving approximately 36 PWS patients divided into four groups with approximately nine PWS patients per group. One group will receive placebo and three groups will receive different dosage regimens of TNX-2900. Tonix intends to seek a partner to advance TNX-2900 for PWS in clinical development.
“We are pleased that TNX-2900 is cleared for clinical studies for the treatment of PWS in children and adolescents as there remains a significant need for new therapies, particularly for PWS hyperphagia, which currently has no approved treatments,” said Seth Lederman, M.D., Chief Executive Officer of Tonix Pharmaceuticals. “PWS is the most common genetic cause of life-threatening childhood obesity.3,4 We believe adding Mg2+ to the formulation has the potential to improve intranasal oxytocin’s therapeutic action.”
The IND application for TNX-2900 was supported by preclinical data demonstrating that Mg2+ enhances the potency of oxytocin. Oxytocin is a naturally-occurring hormone that reduces appetite and eating and regulates hunger, anxiety and prosocial behavior. PWS is a genetic disorder associated with abnormalities of the oxytocin system5. Several previous clinical studies in PWS of intranasal oxytocin without Mg2+-potentiation have shown trends toward improvement, but the results have been inconsistent.1,2 Tonix believes that Mg2+-potentiation of intranasal oxytocin in PWS may improve consistency in clinical trials because in animal studies Mg2+-potentiation appears to eliminate the high-dose suppression of oxytocin’s inverted “U”-shaped dose response.6
Gregory Sullivan, M.D., Chief Medical Officer of Tonix Pharmaceuticals added, “Recent reports show Mg2+ is necessary for oxytocin to fully activate the oxytocin receptor.3,6 Oxytocin has potent effects in adult mice correcting behavioral characteristics of the Magel2 knock-out mouse model for PWS and autism.4 Oxytocin has many potential therapeutic roles in reducing appetite, eating, weight, migraine pain and autistic spectrum behaviors. Tonix recently completed enrollment in a Phase 2 study of TNX-1900, a related Mg2+-potentiated intranasal oxytocin candidate, for the prevention of migraine headaches, and is also studying TNX-1900 through external collaborations for the treatment of obesity in adolescents, binge eating disorder, bone health in autism, and social anxiety disorder.”
About Prader-Willi Syndrome (PWS) PWS is recognized as the most common genetic cause of life-threatening childhood obesity and affects males and females with equal frequency and all races and ethnicities. PWS results from the absence of expression of a group of genes on the paternally acquired chromosome 15. The hallmarks of PWS are lack of suckling in newborns and, in children and adolescents, severe hyperphagia, an overriding physiological drive to eat, leading to severe obesity and other complications associated with significant mortality. A systematic review of the morbidity and mortality as a consequence of hyperphagia in PWS found that the average age of death in PWS was 22.1 years.7 There is no approved medication to treat poor feeding in newborns or hyperphagia in children and adolescents with PWS. Given these serious or life-threatening manifestations of these conditions, there is a critical need for effective treatments to decrease morbidity and mortality, improve quality of life, and increase life expectancy in people with PWS. Oxytocin has potent effects in adult mice correcting behavioral characteristics of the Magel2 knock-out mouse model for PWS and autism.4 In addition, oxytocin has potent effects in correcting behavioral characteristics of the neonatal Magel2 knock-out mouse model for PWS and autism8 and intriguing effects in a clinical trial of neonates with PWS.9
About TNX-2900 and Tonix’s Potentiated Oxytocin Platform TNX-2900 is based on Tonix’s patented intranasal potentiated oxytocin formulation intended for use by adults and adolescents. Tonix’s patented potentiated oxytocin formulation is believed to increase specificity for oxytocin receptors relative to vasopressin receptors as well as to enhance the potency of oxytocin. Tonix is also developing a different intranasal formulation, designated TNX-1900, for prophylaxis of chronic migraine as well as for adolescent obesity, binge eating disorder, bone health in autism and social anxiety disorder. Oxytocin is a naturally occurring human hormone that acts as a neurotransmitter in the brain. Oxytocin is believed to be more than 600 million years old and is present in vertebrates including mammals, birds, reptiles, amphibians and fish.10,11 It was originally approved by the U.S. Food and Drug Administration as Pitocin®*, an intravenous infusion or intramuscular injection drug, for use in pregnant women to induce labor. An intranasal formulation of oxytocin is marketed in some European countries to assist in the production of breast milk as Syntocinon®** (oxytocin nasal 40 units/ml). *Pitocin® is a trademark of Par Pharmaceutical, Inc.
**Syntocinon® is a trademark of BGP Products Operations GmbH
Citations
Shalma NM, et al. Diabetes Metab Syndr. 2023. 17(2):102711.
Rice LJ, et al. Curr Opin Psychiatry. 2018. 31(2):123-127.
Meyerowitz JG, et al. Nat Struct Mol Biol. 2022. 29(3):274-281.
Meziane H, et al. Biol Psychiatry. 2015. 78(2):85-94.
Correa-da-Silva F, et al. J Neuroendocrinol. 2021. 33(7):e12994.
Bharadwaj VN, et al. Pharmaceutics. 2022. 14(5):1105.
Bellis SA, et al. Eur J Med Genet. 2022. 65(1):104379.
Bertoni A, et al. Mol Psychiatry. 2021. 26(12):7582-7595.
Tauber M, et al. Pediatrics. 2017. 139(2):e20162976.
Oxytocin in Wikipedia https://en.wikipedia.org/wiki/Oxytocin (accessed 8-8-23)
Tonix Pharmaceuticals Holding Corp.* Tonix is a biopharmaceutical company focused on commercializing, developing, discovering and licensing therapeutics to treat and prevent human disease and alleviate suffering. Tonix Medicines, our commercial subsidiary, markets Zembrace® SymTouch® (sumatriptan injection) 3 mg and Tosymra® (sumatriptan nasal spray) 10 mg under a transition services agreement with Upsher-Smith Laboratories, LLC from whom the products were acquired on June 30, 2023. Zembrace SymTouch and Tosymra are each indicated for the treatment of acute migraine with or without aura in adults. Tonix’s development portfolio is composed of central nervous system (CNS), rare disease, immunology and infectious disease product candidates. Tonix’s CNS development portfolio includes both small molecules and biologics to treat pain, neurologic, psychiatric and addiction conditions. Tonix’s lead development CNS candidate, TNX-102 SL (cyclobenzaprine HCl sublingual tablet), is in mid-Phase 3 development for the management of fibromyalgia, having completed the clinical phase of a potentially confirmatory Phase 3 study in the fourth quarter of 2023, with topline data expected in late December 2023. TNX-102 SL is also being developed to treat fibromyalgia-type Long COVID, a chronic post-acute COVID-19 condition, and topline results were reported in the third quarter of 2023. TNX-1900 (intranasal potentiated oxytocin), is in development as a preventive treatment in chronic migraine, and enrollment has completed in a Phase 2 proof-of-concept study with topline data expected in early December 2023. TNX-1900 is also being studied in binge eating disorder, pediatric obesity and social anxiety disorder by academic collaborators under investigator-initiated INDs. TNX-1300 (cocaine esterase) is a biologic designed to treat cocaine intoxication and has been granted Breakthrough Therapy designation by the FDA. A Phase 2 study of TNX-1300 is expected to be initiated in the fourth quarter of 2023. Tonix’s rare disease development portfolio includes TNX-2900 (intranasal potentiated oxytocin) for the treatment of Prader-Willi syndrome. TNX-2900 has been granted Orphan Drug designation by the FDA. Tonix’s immunology development portfolio includes biologics to address organ transplant rejection, autoimmunity and cancer, including TNX-1500, which is a humanized monoclonal antibody targeting CD40-ligand (CD40L or CD154) being developed for the prevention of allograft rejection and for the treatment of autoimmune diseases. A Phase 1 study of TNX-1500 was initiated in the third quarter of 2023. Tonix’s infectious disease pipeline includes TNX-801, a vaccine in development to prevent smallpox and mpox. TNX-801 also serves as the live virus vaccine platform or recombinant pox vaccine platform for other infectious diseases, including TNX-1800, in development as a vaccine to protect against COVID-19. During the fourth quarter of 2023, TNX-1800 was selected by the U.S. National Institutes of Health (NIH), National Institute of Allergy and Infectious Diseases (NIAID) Project NextGen for inclusion in Phase 1 clinical trials. The infectious disease development portfolio also includes TNX-3900 and TNX-4000, which are classes of broad-spectrum small molecule oral antivirals.
*Tonix’s product development candidates are investigational new drugs or biologics and have not been approved for any indication.
Zembrace SymTouch and Tosymra are registered trademarks of Tonix Medicines. Intravail is a registered trademark of Aegis Therapeutics, LLC, a wholly owned subsidiary of Neurelis, Inc. All other marks are property of their respective owners.
This press release and further information about Tonix can be found at www.tonixpharma.com.
Forward Looking Statements Certain statements in this press release are forward-looking within the meaning of the Private Securities Litigation Reform Act of 1995. These statements may be identified by the use of forward-looking words such as “anticipate,” “believe,” “forecast,” “estimate,” “expect,” and “intend,” among others. These forward-looking statements are based on Tonix’s current expectations and actual results could differ materially. There are a number of factors that could cause actual events to differ materially from those indicated by such forward-looking statements. These factors include, but are not limited to, risks related to the failure to obtain FDA clearances or approvals and noncompliance with FDA regulations; risks related to the failure to successfully market any of our products; risks related to the timing and progress of clinical development of our product candidates; our need for additional financing; uncertainties of patent protection and litigation; uncertainties of government or third party payor reimbursement; limited research and development efforts and dependence upon third parties; and substantial competition. As with any pharmaceutical under development, there are significant risks in the development, regulatory approval and commercialization of new products. Tonix does not undertake an obligation to update or revise any forward-looking statement. Investors should read the risk factors set forth in the Annual Report on Form 10-K for the year ended December 31, 2022, as filed with the Securities and Exchange Commission (the “SEC”) on March 13, 2023, and periodic reports filed with the SEC on or after the date thereof. All of Tonix’s forward-looking statements are expressly qualified by all such risk factors and other cautionary statements. The information set forth herein speaks only as of the date thereof.
Gold prices have been on a dazzling run in recent months, with the precious metal notching consecutive monthly gains to reach new all-time highs. On Monday, spot gold prices topped $2,100 an ounce for the first time ever, hitting $2,110 before pulling back slightly. This adds to the previous record set back on Friday when prices exceeded $2,075, blowing past 2020’s earlier high point.
Analysts say gold still has room to run in 2023 and 2024 as key conditions line up to support further upside for bullion. Low interest rates, a weakening US dollar, rising inflation concerns globally, and an array of simmering geopolitical conflicts should all conspire to keep safe haven demand elevated.
“There is simply less leverage this time around versus 2011 in gold,” said Nicky Shiels of MKS PAMP, noting that the current dynamics put $2,200/oz within reach. Other experts concur, with UOB strategist Heng Koon How targeting $2,200 gold by end-2024, and TD Securities anticipating average prices around $2,100 in Q2 2024.
Fueling this gold fever has been robust central bank buying, especially across emerging markets. Recent data shows 24% of central banks worldwide intend to pad their gold reserves over the next year as economic uncertainty persists. With these institutions showing waning faith in traditional reserve assets like the US dollar, their bullion accumulation provides a sturdy pillar of support.
Geopolitical Flare-Ups Stoke Safe Haven Appeal
Mounting geopolitical tensions represent another propellant behind gold’s rise. The bloody conflict between Israel and Palestine has recently stoked investor fears, driving many towards gold’s relative stability. Looking ahead, strategists believe various other hotspots could flare up and lift bullion demand more.
Besides the Middle East, worsening frictions between China and Taiwan or a resurgence of the crisis in Ukraine could shock markets. And if the US gets dragged into any new foreign entanglements, it may have to ramp up defense spending and borrowing, potentially weakening both growth and the dollar.
With so many risks swirling, portfolio managers and retail buyers appear increasingly eager to hedge with gold. Notably, demand has climbed even as gold prices touched multi-year highs. This underscores bullion’s unique status as a tried-and-true safe haven asset.
Fed Policy Outlook Could Offer Further Boost
Though gold has powered higher despite a spate of Fed rate hikes, any change in this tightening cycle would provide another major catalyst. After lifting interest rates rapidly from near-zero, policymakers must now decide whether to keep tightening or ease off the brakes.
Several officials, including Governor Christopher Waller, have hinted rates may not rise much further if inflation keeps slowing as expected. Markets thus see potential Fed rate cuts arriving sometime in 2024.
If implemented, this dovish shift would likely hamstring the dollar and bond yields, stirring more demand for non-interest-bearing gold. Hence analysts view Fed pivots as a probable linchpin that keeps prices locked above $2,000 over the next couple of years.
With stars aligned for gold both fundamentally and geopolitically, all the ingredients seem in place for its dazzling run to continue. That leaves bulls dreaming ever more ambitiously of how high prices could yet soar. However, given gold’s inherent volatility, traders should steel themselves for pullbacks as well while enjoying the ride upwards.
DAVENPORT, Iowa, Dec. 01, 2023 (GLOBE NEWSWIRE) — Lee Enterprises, Incorporated (NASDAQ: LEE), a major subscription and advertising platform and a leading provider of high quality, trusted, local news and information in 75 markets, has scheduled an audio webcast and conference call for Thursday, December 7, 2023, at 9 a.m. Central Time. Lee plans to issue a news release before market opens that day with preliminary results for its year ended September 24, 2023.
A live webcast of the conference call may be accessed via the Investor Relations portion of Lee’s website or here and will be available for replay 24 hours later.
ABOUT LEE
Lee Enterprises is a major subscription and advertising platform and a leading provider of local news and information with daily newspapers, rapidly growing digital products and, nearly 350 weekly and specialty publications serving 75 markets in 26 states. Lee’s newspapers have average daily circulation of 1.0 million, and reach more than 31 million digital unique visitors. Lee’s markets include St. Louis, MO; Buffalo, NY; Omaha, NE; Richmond, VA; Lincoln, NE; Madison, WI; Davenport, IA; and Tucson, AZ. Lee Common Stock is traded on the NASDAQ under the symbol LEE. For more information about Lee, please visit www.lee.net.
Federal Reserve Chair Jerome Powell threw cold water on mounting speculation that the central bank is nearing the end of its tightening campaign and will soon reverse course to cutting interest rates.
In a speech at Spelman College on Friday, Powell asserted “it would be premature” for investors to conclude the Fed’s policy stance is restrictive enough given lingering inflation pressures. He stated plainly that more rate hikes could still be on the table if appropriate.
His sobering comments follow the latest inflation data showing core PCE, the Fed’s preferred gauge, ticked down slightly to 3.5% annually in October. Though marking a fourth consecutive month of slow improvement, Powell emphasized the number remains well above the Fed’s 2% target.
“While the lower inflation readings of the past few months are welcome, that progress must continue if we are to reach our 2% objective,” he said.
Nonetheless, overeager investors have jumped the gun on declaring victory over inflation and penciling in imminent rate cuts. Billionaire Bill Ackman predicted this week that cuts could come as soon as Q1 2024.
But Powell asserted the full impact of the Fed’s blistering pace of rate hikes this year has likely not yet transmitted through the economy. Plus, he noted core PCE has averaged 2.5% over the past six months – still too high for comfort.
Key Takeaways for Investors The Fed chair’s remarks make clear that policymakers see their inflation-taming mission as incomplete despite markets cheering each new downward tick. Here are the big implications for investors:
Rate cuts are not coming anytime soon. The Fed wants concrete evidence that inflation is reverting steadily to its 2% goal before it contemplates easing policy. Powell admission that more hikes could happen dispels investor hopes for a swift policy pivot.
Stocks may face renewed volatility. Exuberant bets on imminent rate cuts provided major tailwinds for this year’s risk asset rebound. With the Fed dampening that narrative, investors may recalibrate positions. Powell cautioned about the unusual uncertainty still permeating the economic outlook.
Recession risks linger in 2024. The full brunt of the Fed’s Super-Size rate hikes has yet to impact the real economy. Powell made clear policy will stay restrictive for some time to have its intended effect of slowing demand and consumer spending. That keeps recession risks on the radar, especially in the back half of next year.
Navigating the Volatility Ahead With the Fed determined to remain the grinch raining on investor enthusiasms around pivots, next year promises more turbulence for markets. Savvy investors should:
Trim exposure to interest-rate sensitive assets: Risks remain heavily skewed towards more volatility as the Fed asserts its hawkish credibility. ratchet down exposure to bonds, utilities, real estate and other rate-vulnerable sectors.
Emphasize inflation hedges: The Fed’s clear-eyed focus on returning inflation to 2% means investors should still prioritize inflation-fighting assets like commodities, TIPS, floating-rate bank loans, and short-duration bonds. These provide buffers against rising prices.
Stay nimble amid cross-currents: Between lingering inflation and slowing growth, crosswinds for investors abound. Being opportunistic yet disciplined will be critical, as risk appetites could sour quickly depending on upcoming data and guidance from the Fed. Maintaining flexibility and even selective hedges allows investors to adeptly navigate the turbulence ahead under Powell’s resolute hawkish watch.
NEW YORK, Dec. 01, 2023 (GLOBE NEWSWIRE) — Xcel Brands, Inc. (NASDAQ: XELB) (“Xcel” or the “Company”), a media and consumer products company with significant expertise in livestream shopping and social commerce, today announced that it is scheduled to present at the following investor conferences:
Noble Capital Markets 19th Annual Emerging Growth Equity Conference Location: Boca Raton, FL Date: December 4 – 5, 2023 Presentation Time: December 5 at 3:00 pm ET Webcast: www.nobleconference.com
Robert W. D’Loren, Chairman and Chief Executive Officer of Xcel Brands, will be leading the formal presentation and answering questions from investors. Xcel Brands will also provide an overview of its growth opportunities and business transformation, including a first look at the Company’s new livestream shopping technology and social commerce platform.
About Xcel Brands
Xcel Brands, Inc. (NASDAQ: XELB) is a media and consumer products company engaged in the design, production, marketing, live streaming, and social commerce sales of branded apparel, footwear, accessories, fine jewelry, home goods and other consumer products, and the acquisition of dynamic consumer lifestyle brands. Xcel was founded in 2011 with a vision to reimagine shopping, entertainment, and social media as one thing. Xcel owns the Judith Ripka, Halston, LOGO by Lori Goldstein, and C. Wonder brands and a minority stake in the Isaac Mizrahi brand. It also owns and manages the Longaberger brand through its controlling interest in Longaberger Licensing LLC. Xcel is pioneering a true modern consumer products sales strategy which includes the promotion and sale of products under its brands through interactive television, digital live-stream shopping, social commerce, brick-and-mortar retail, and e-commerce channels to be everywhere its customers shop. The company’s brands have generated in excess of $4 billion in retail sales via livestreaming in interactive television and digital channels alone, and over 20,000 hours of live-stream and social commerce. Headquartered in New York City, Xcel Brands is led by an executive team with significant live streaming, production, merchandising, design, marketing, retailing, and licensing experience, and a proven track record of success in elevating branded consumer products companies. www.xcelbrands.com
Forward Looking Statements
This press release contains forward-looking statements. All statements other than statements of historical fact contained in this press release, including statements regarding future events, our future financial performance, business strategy and plans and objectives of management for future operations, are forward-looking statements. We have attempted to identify forward-looking statements by terminology including “anticipates,” “believes,” “can,” “continue,” “ongoing,” “could,” “estimates,” “expects,” “intends,” “may,” “appears,” “suggests,” “future,” “likely,” “goal,” “plans,” “potential,” “projects,” “predicts,” “seeks,” “should,” “would,” “guidance,” “confident” or “will” or the negative of these terms or other comparable terminology. These forward-looking statements include, but are not limited to, statements regarding our anticipated revenue, expenses, profitability, strategic plans, and capital needs. These statements are based on information available to us on the date hereof and our current expectations, estimates and projections and are not guarantees of future performance. Forward-looking statements involve known and unknown risks, uncertainties, assumptions and other factors, including, without limitation, the risks discussed in the “Risk Factors” section and elsewhere in the Company’s Annual Report on form 10-K for the year ended December 31, 2022 and its other filings with the SEC, which may cause our or our industry’s actual results, levels of activity, performance, or achievements to differ materially from those expressed or implied by these forward-looking statements. Moreover, we operate in a very competitive and rapidly changing environment. New risks emerge from time to time and it is not possible for us to predict all risk factors, nor can we address the impact of all factors on our business or the extent to which any factor, or combination of factors, may cause our actual results to differ materially from those contained in any forward-looking statements. You should not place undue reliance on any forward-looking statements. Except as expressly required by the federal securities laws, we undertake no obligation to update any forward-looking statements, whether as a result of new information, future events, changed circumstances, or any other reason.
For further information please contact: Andrew Berger SM Berger & Company, Inc. 216-464-6400 andrew@smberger.com
HOUSTON, Nov. 30, 2023 (GLOBE NEWSWIRE) — Orion Group Holdings, Inc. (NYSE: ORN) (the “Company”), a leading specialty construction company, announced today that CEO Travis Boone and CFO Scott Thanisch will be participating in NobleCon 19 Emerging Growth Equity Conference being held at Florida Atlantic University in Boca Raton. Orion Management will be presenting on December 4, 2023, at 2:30 p.m. Eastern Time. Following the presentation there will be a breakout session with investors as well as scheduled one-on-one meetings.
A high-definition video webcast of the presentation will be available the following day on the Company’s website at https://www.oriongroupholdingsinc.com. The presentation will also be available on Noble Capital Markets’ Conference website www.nobleconference.com and on Channelchek www.channelchek.com, Noble Capital’s investor portal. The webcast will be archived for 90 days following the event.
About Orion Group Holdings Orion Group Holdings, Inc., a leading specialty construction company serving the infrastructure, industrial and building sectors, provides services both on and off the water in the continental United States, Alaska, Hawaii, Canada and the Caribbean Basin through its marine segment and its concrete segment. The Company’s marine segment provides construction and dredging services relating to marine transportation facility construction, marine pipeline construction, marine environmental structures, dredging of waterways, channels and ports, environmental dredging, design, and specialty services. Its concrete segment provides turnkey concrete construction services including place and finish, site prep, layout, forming, and rebar placement for large commercial, structural and other associated business areas. The Company is headquartered in Houston, Texas with regional offices throughout its operating areas. https://www.oriongroupholdingsinc.com.
About Noble Capital Markets, Inc. Noble Capital Markets (“Noble”) is a research-driven investment bank that has supported small & microcap companies since 1984. As a FINRA and SEC licensed broker dealer Noble provides institutional-quality equity research, merchant and investment banking, and order execution services. In 2005, Noble established NobleCon, an investor conference that has grown substantially over the last decade. Noble launched www.channelchek.com in 2018 – an investor community dedicated exclusively to public small and micro-cap companies and their industries. Channelchek is the first service to offer institutional-quality research to the public, for FREE at every level without a subscription. More than 6,000 public emerging growth companies are listed on the site, with growing content including research, webcasts, podcasts, and balanced news.
The GEO Group, Inc. (NYSE: GEO) is a leading diversified government service provider, specializing in design, financing, development, and support services for secure facilities, processing centers, and community reentry centers in the United States, Australia, South Africa, and the United Kingdom. GEO’s diversified services include enhanced in-custody rehabilitation and post-release support through the award-winning GEO Continuum of Care®, secure transportation, electronic monitoring, community-based programs, and correctional health and mental health care. GEO’s worldwide operations include the ownership and/or delivery of support services for 103 facilities totaling approximately 83,000 beds, including idle facilities and projects under development, with a workforce of up to approximately 18,000 employees.
Joe Gomes, Managing Director, Equity Research Analyst, Generalist , Noble Capital Markets, Inc.
Joshua Zoepfel, Research Associate, Noble Capital Markets, Inc.
Refer to the full report for the price target, fundamental analysis, and rating.
New CEO. Yesterday, GEO announced Brian Evans, who has been with the Company for 23 years and has served as the Company’s Chief Financial Officer for 14 years, has been appointed Chief Executive Officer, effective January 1, 2024. Current CEO Jose Gordo is transitioning to an advisor role, by mutual agreement. Given Mr. Evans’ familiarity with GEO and his strong performance as CFO, we believe this is a strong choice for the Company.
Zoley Term. Company founder and Executive Chairman George Zoley will step down as Executive Chairman as of June 30, 2026, the end of his current employment term. Mr. Zoley then will transition into the role as an advisor to the Company, while continuing to serve as the Company’s non-Executive Chairman of the Board of Directors.
Equity Research is available at no cost to Registered users of Channelchek. Not a Member? Click ‘Join’ to join the Channelchek Community. There is no cost to register, and we never collect credit card information.
This Company Sponsored Research is provided by Noble Capital Markets, Inc., a FINRA and S.E.C. registered broker-dealer (B/D).
*Analyst certification and important disclosures included in the full report. NOTE: investment decisions should not be based upon the content of this research summary. Proper due diligence is required before making any investment decision.