Schwazze (OTCQX:SHWZ, NEO:SHWZ) is building a premier vertically integrated regional cannabis company with assets in Colorado and New Mexico and will continue to take its operating system to other states where it can develop a differentiated regional leadership position. Schwazze is the parent company of a portfolio of leading cannabis businesses and brands spanning seed to sale. The Company is committed to unlocking the full potential of the cannabis plant to improve the human condition. Schwazze is anchored by a high-performance culture that combines customer-centric thinking and data science to test, measure, and drive decisions and outcomes. The Company’s leadership team has deep expertise in retailing, wholesaling, and building consumer brands at Fortune 500 companies as well as in the cannabis sector. Schwazze is passionate about making a difference in our communities, promoting diversity and inclusion, and doing our part to incorporate climate-conscious best practices.
Joe Gomes, CFA, Managing Director, Equity Research Analyst, Generalist , Noble Capital Markets, Inc.
Joshua Zoepfel, Research Associate, Noble Capital Markets, Inc.
Refer to the full report for the price target, fundamental analysis, and rating.
1Q24 Results. Revenue of $41.6 million was up 4% y-o-y, driven by new store growth. Gross margin declined to 43.1% from 54.6% due to pricing pressure in New Mexico and a higher mix of lower margined medical sales. Schwazze reported an operating loss of $2.7 million compared to $5.6 million of operating profit in 1Q23. GAAP net loss totaled $18.2 million, or a loss of $0.24/sh, versus essentially breakeven last year. We had estimated revenue of $42.5 million and a net loss of $11.6 million, or a loss of $0.16/sh.
Environment Still Challenging. The Colorado and New Mexico markets remain some of the most competitive cannabis markets in the country. A supply/demand situation still coming into balance and too many retail locations will continue to impact both markets in the near-term.
Equity Research is available at no cost to Registered users of Channelchek. Not a Member? Click ‘Join’ to join the Channelchek Community. There is no cost to register, and we never collect credit card information.
This Company Sponsored Research is provided by Noble Capital Markets, Inc., a FINRA and S.E.C. registered broker-dealer (B/D).
*Analyst certification and important disclosures included in the full report. NOTE: investment decisions should not be based upon the content of this research summary. Proper due diligence is required before making any investment decision.
Joe Gomes, CFA, Managing Director, Equity Research Analyst, Generalist , Noble Capital Markets, Inc.
Joshua Zoepfel, Research Associate, Noble Capital Markets, Inc.
Refer to the full report for the price target, fundamental analysis, and rating.
AI Adding to Growth. Total revenue for the first quarter was $30.3 million compared to $8.3 million in the prior year. This surpassed our $23.5 million estimate, as a higher bitcoin price and the Company’s inclusion of AI revenue led to the increase. The AI revenue comes from the Company’s anchor AI contract with expected annualized revenue of $50 million. We believe the AI contract provides an alternative revenue stream non-correlated to the cryptocurrency market.
Potential for More Soon. Although the $50 million contract is in place, earlier in the year Bit Digital received a proposal for an expansion of its contract. With the expansion, the proposal calls for an additional 2,048 GPUs on top of the 2,048 GPUs already in the contract, effectively doubling revenue to $100 million. The Company is currently in talks with the client on the terms of the expansion and we expect an announcement in the coming weeks.
Equity Research is available at no cost to Registered users of Channelchek. Not a Member? Click ‘Join’ to join the Channelchek Community. There is no cost to register, and we never collect credit card information.
This Company Sponsored Research is provided by Noble Capital Markets, Inc., a FINRA and S.E.C. registered broker-dealer (B/D).
*Analyst certification and important disclosures included in the full report. NOTE: investment decisions should not be based upon the content of this research summary. Proper due diligence is required before making any investment decision.
In a transformative transaction for the U.S. shale industry, Crescent Energy Company has agreed to acquire rival Eagle Ford producer SilverBow Resources in an all-stock deal valued at $2.1 billion. The combination solidifies Crescent’s position as a leading player in the prolific Eagle Ford basin of South Texas, creating the second largest operator in the region.
The deal significantly bolsters Crescent’s scale and low-cost inventory. SilverBow shareholders can elect to receive 3.125 Crescent shares for each SilverBow share owned, or opt for $38 per share in cash up to a $400 million cap. Post-closing, expected in Q3 2024, existing Crescent investors will own between 69-79% of the combined entity.
The merged company boasts imposing production of around 250,000 boe/d from a complementary portfolio of high-quality, long-life assets spanning the Eagle Ford and Uinta basins. This large-scale, high-margin asset base underpins robust free cash flow generation backed by a deep inventory of high-return drilling locations to drive compelling growth.
For Crescent, the deal achieves increased scale and premiumization of its portfolio through SilverBow’s attractive Eagle Ford position assembled over 30 years in the region. The combination enhances corporate returns through $65-$100 million of expected annual synergies from combined operating efficiencies and cost of capital benefits.
Crescent characterizes the transaction as highly accretive on all key per share metrics. It aligns with the company’s proven strategy of pursuing disciplined acquisitions at attractive valuations to augment its free cash flow, production, and inventory depth. Maintaining a fortress investment-grade balance sheet post-merger affords financial flexibility to further consolidate the fragmented shale landscape.
The deal represents a compelling value proposition for SilverBow shareholders. They gain exposure to Crescent’s larger-scale diversified assets while participating in the upside from performance improvements, synergy realization, and further consolidation. Alternatively, investors can opt for immediate cash consideration at a premium.
Crescent’s leadership expressed high confidence in the strategic merits of the transaction. Chairman John Goff labeled it “a compelling transaction…creating a premier growth platform”, while CEO David Rockecharlie highlighted SilverBow’s “complementary and high-quality” Eagle Ford position enhancing Crescent’s “unique value proposition.”
The merger exemplifies the accelerating consolidation across the U.S. shale patch as producers pursue scale, streamlining, and consistent shareholder returns. Crescent emerges exceptionally well-positioned to lead this rationalization as a serial acquirer given its sector-leading free cash flow generation, returns philosophy, and strong balance sheet.
Want small cap opportunities delivered straight to your inbox? Channelchek’s free newsletter will give you exclusive access to our expert research, news, and insights to help you make informed investment decisions.
In a strategic move to strengthen its dermatology portfolio, pharmaceutical giant Johnson & Johnson has agreed to acquire Proteologix, a privately-held biotech developing bispecific antibody therapies for inflammatory skin diseases like atopic dermatitis. The $850 million all-cash deal gives J&J access to promising clinical and preclinical stage assets.
The crown jewel of the acquisition is Proteologix’s lead candidate PX128, a Phase 1-ready bispecific antibody targeting two key drivers of atopic dermatitis and asthma – interleukin-13 (IL-13) and thymic stromal lymphopoietin (TSLP). By simultaneously blocking these complementary inflammatory pathways, PX128 could provide a substantial efficacy boost over current monospecific antibody treatments.
Proteologix’s second asset, the preclinical bispecific PX130, goes after IL-13 and IL-22 for the treatment of moderate to severe atopic dermatitis. J&J cited the differentiated design of these dual-acting antibodies, highlighting their potential for infrequent, convenient dosing that could improve adherence.
The acquisition aligns with J&J’s strategic focus on building an immunology pipeline centered around bispecific antibodies for improved disease control across a range of inflammatory conditions.
Atopic dermatitis, a chronic inflammatory skin disease, impacts over 100 million adults worldwide, representing a massive market opportunity. However, up to 70% of patients fail to achieve remission on standard systemic treatments, underscoring a significant unmet need.
“We see an opportunity for best-in-disease efficacy for both PX128 and PX130,” said David Lee, global immunology therapeutic area head at J&J. The company believes the bispecifics could be game-changers for underserved patient subgroups by more comprehensively targeting the heterogenous drivers of atopic dermatitis.
The deal comes on the heels of positive Phase 3 data from Eli Lilly’s IL-13 antibody lebrikizumab in atopic dermatitis. After manufacturing setbacks, Lilly resubmitted its lebrikizumab filing in April and anticipates a decision later this year, setting up a potential commercial clash with J&J’s dual-acting antibodies down the road.
Proteologix, based in California, will be eligible for additional milestone payments on top of the $850 million upfront cash paid by J&J. The transaction, expected to close in mid-2024 pending regulatory approval, will fold in Proteologix’s other preclinical bispecific antibody programs focused on autoimmune diseases and cancer.
For J&J, the deal provides a promising path toward next-generation, differentiated therapies for the significant population of atopic dermatitis patients struggling with existing treatment options. Proteologix’s dual-acting bispecific antibodies represent potentially transformative medicines for a disease area that has proven stubbornly difficult to treat.
The acquisition reinforces J&J’s commitment to immunology and dermatology while bolstering its pipeline with innovative, clinically advanced assets that could drive future growth. As the atopic dermatitis market heats up, J&J has made a preemptive strike to secure a competitive edge through its newest biotech addition.
Want small cap opportunities delivered straight to your inbox? Channelchek’s free newsletter will give you exclusive access to our expert research, news, and insights to help you make informed investment decisions.
Completed acquisition of Trawsfynydd and concurrent $14 million Capital Raise
Excellent pipeline progress, led by candidates for COVID 19, influenza, and oncology programs
Poised to initiate Phase 2 studies in H2 2024 for our influenza candidate and ritonavir-free COVID 19 protease inhibitor
NEWTOWN, Pa., May 16, 2024 (GLOBE NEWSWIRE) — Traws Pharma, Inc. (“Traws” or “Traws Pharma”), a clinical stage biopharmaceutical company developing oral small molecules for respiratory viral diseases and cancer, today announced financial results for the first quarter of 2024, and provided a business update.
“2024 has already been a transformative year for Traws Pharma to advance our portfolio of novel treatments for serious respiratory infections and oncology programs. We completed the acquisition of Trawsfynydd and concluded a concurrent $14 million private placement financing. In addition, we initiated first-in-human dosing for our COVID 19 product candidate, including completion of the first cohort dosing group. Furthermore, we completed the last dose escalation cohort for our CDK4+ inhibitor, narazaciclib,” stated Werner Cautreels, Ph.D., Chief Executive Officer of Traws Pharma. “We believe that we are poised to make even more meaningful progress in the second half of 2024, as we advance our influenza treatment and ritonavir-free protease inhibitor for COVID 19 into expanded Phase 1 dose escalation studies and begin Phase 2 development.”
“Based on the preclinical profile and early clinical data from our infectious disease candidates and narazaciclib, I am optimistic about the outlook for Traws’ portfolio and look forward to updating our investors with our progress through the year,” concluded Dr. Cautreels.
Traws Proprietary Portfolio Highlights:
TRX100 (tivoxavir marboxil): a cap-dependent endonuclease inhibitor for influenza: Phase 1
Targets the cap-dependent endonuclease of influenza and is a potent inhibitor of influenza virus replication including A and B strains
First Phase 1 study demonstrated safety and tolerability in healthy volunteers with pharmacokinetics and pharmacodynamics (PK/PD) data to support the potential use of a single oral dose for treatment or prophylaxis
We plan to initiate Phase 1 dose extension to evaluate one additional, higher dose prior to the initiation of Phase 2 studies in H2 2024. Topline data from the Phase 2 study are expected in H1 2025
TRX01 (ratutrelvir): a ritonavir-free Mpro protease inhibitor for COVID19: Phase 1
Potent oral inhibitor of SARS-CoV-2 Mpro (3CL protease), effective against the original, delta, and omicron variants of SARS-CoV-2, that does not require co-administration with ritonavir, reducing the risk of drug-drug interactions. Preclinical data support once-daily dosing for 10days which could overcome viral rebound seen with other agents.
We are in the process of conducting a Phase 1 first-in-human single ascending dose/multiple ascending dose (SAD/MAD) study in normal volunteers. The second dosing cohort is underway and topline data are expected H2 2024. A Phase 2 study is also planned to begin in H2 2024 in patients with moderate to severe COVID19. Topline data are expected H1 2025
Narazaciclib: CDK 4+ to treat solid tumors: Phase 1/2
Available preclinical and clinical data suggest that narazaciclib is active in numerous tumor types, inhibiting CDK 2/4/6, CSF1R and ARK 5/NUAK1. Preclinical studies also showed reduced neutropenia, as compared to palbociclib, and inhibition of palbociclib resistant cancer cells.
A dose escalation study to define the recommended Phase 2 dose (RP2D) recently enrolled the last cohort. A review of the clinical and PK/PD data is underway. We intend to utilize these data to define the clinical strategy, including selection of a lead indication and next steps in its development.
First Quarter 2024 Financial Results
Cash and cash equivalents as of March 31, 2024, were $16.4 million, compared with $20.8 million as of December 31, 2023.
In April 2024, the Company raised gross proceeds of $14 million from the sale of common and preferred stock to TPAV, LLC, an affiliate of Torrey Pines, and OrbiMed Private Investments VIII, LP, an affiliate of OrbiMed Advisors.
The Company believes that its cash and cash equivalents will be sufficient to fund ongoing clinical trials and business operations into the fourth quarter of 2024.
Revenue was fifty-six thousand dollars for the first quarter of 2024, consistent with the same period in 2023.
General and administrative (G&A) expenses were $3.4 million for the first quarter of 2024, compared with $2.1 million for the same period in 2023. The increase in G&A expenses was caused by higher legal and professional fees related to the Trawsfynydd acquisition on April 1, 2024, partially offset by lower bonus accrual as well as lower insurance, meeting, and public company expenses.
Research and development (R&D) expenses were $1.9 million for the first quarter of 2024, compared with $4.1 million for the same period in 2023. The decrease was primarily caused by lower costs related to narazaciclib drug substance and drug product manufacturing, a reduction in clinical development and consulting costs and lower personnel expenses due to lower bonus accrual.
Net loss for the first quarter of 2024 was $5.0 million, or $0.24 per share on 20.8 million weighted average shares outstanding, compared with a net loss of $5.8 million, or $0.28 per share for the same period in 2023, based on 20.8 million weighted average shares outstanding.
About Traws Pharma, Inc.
Traws Pharma is a clinical stage biopharmaceutical company developing oral small molecule therapies for the treatment of respiratory viral diseases and cancer. The viral respiratory disease program includes an oral inhibitor of the SARS-CoV-2 Mpro (3CL protease), ratutrelvir, and tivoxavir marboxil, a new oral antiviral drug candidate for influenza which targets the influenza cap-dependent endonuclease and has shown activity in cell-based assays against drug resistant viruses as well as against avian flu.
In the cancer program, Traws is developing the novel, proprietary multi-kinase CDK4-plus inhibitor narazaciclib potentially for refractory endometrial cancer and other solid tumor cancers. Narazaciclib targets pathways involved in the development of resistance to CDK inhibitors.
Traws Pharma is committed to delivering novel compounds for unmet medical needs using state-of-the-art drug development technology. With a focus on product safety and a commitment to patients in need or that are specifically vulnerable, we build solutions for important medical challenges, aiming to alleviate the burden of viral infections and cancer.
Forward-Looking Statements
Some of the statements in this release are forward-looking statements within the meaning of Section 27A of the Securities Act of 1933, as amended, Section 21E of the Securities Exchange Act of 1934, as amended, and the Private Securities Litigation Reform Act of 1995, and involve risks and uncertainties including statements regarding the Phase 1 study of ratutrelvir in Australia and its design, timing and potential results and the timing of a planned Phase 2 study. Traws has attempted to identify forward-looking statements by terminology including “believes”, “estimates”, “anticipates”, “expects”, “plans”, “intends”, “may”, “could”, “might”, “will”, “should”, “preliminary”, “encouraging”, “approximately” or other words that convey uncertainty of future events or outcomes. Although Traws believes that the expectations reflected in such forward-looking statements are reasonable as of the date made, expectations may prove to have been materially different from the results expressed or implied by such forward looking statements. These statements are only predictions and involve known and unknown risks, uncertainties, and other factors, including the success and timing of Traws’ clinical trials, collaborations, market conditions and those discussed under the heading “Risk Factors” in Traws’ filings with the Securities and Exchange Commission. Any forward-looking statements contained in this release speak only as of its date. Traws undertakes no obligation to update any forward-looking statements contained in this release to reflect events or circumstances occurring after its date or to reflect the occurrence of unanticipated events.
Traws Pharma, Inc. Contact: Mark Guerin Traws Pharma, Inc. 267-759-3680 www.trawspharma.com
NEW YORK, May 16, 2024 (GLOBE NEWSWIRE) — Xcel Brands, Inc. (NASDAQ: XELB) (“Xcel” or the “Company”), today announced that it will report its first quarter 2024 financial results on May 20, 2024. The Company will hold a conference call with the investment community on May 20, 2024, at 5:00 p.m. ET.
Interested parties unable to access the conference call via the webcast may dial 800-715-9871 or 646-307-1963 and use the Conference ID 3975904. A replay of the webcast will be available on Xcel’s website.
About Xcel Brands
Xcel Brands, Inc. (NASDAQ: XELB) is a media and consumer products company engaged in the design, marketing, live streaming, social commerce sales of branded apparel, footwear, accessories, fine jewelry, home goods and other consumer products, and the acquisition of dynamic consumer lifestyle brands. Xcel was founded in 2011 with a vision to reimagine shopping, entertainment, and social media as one thing. Xcel owns the Judith Ripka, Halston, LOGO by Lori Goldstein, and C. Wonder by Christian Siriano brands and a minority stake in the Isaac Mizrahi brand. It also owns and manages the Longaberger brand through its controlling interest in Longaberger Licensing LLC and a 50% interest in a JV in TWRHLL (“Tower Hill”) by Christie Brinkley. Also Xcel owns a 30% interest in Orme, a short-form video market place. Xcel is pioneering a true modern consumer products sales strategy which includes the promotion and sale of products under its brands through interactive television, digital live-stream shopping, social commerce, brick-and-mortar retail, and e-commerce channels to be everywhere its customer’s shop. The company’s brands have generated in excess of $4 billion in retail sales via livestreaming in interactive television and digital channels alone. Headquartered in New York City, Xcel Brands is led by an executive team with significant live streaming, production, merchandising, design, marketing, retailing, and licensing experience, and a proven track record of success in elevating branded consumer products companies. For more information, visit www.xcelbrands.com.
SEPTA pilots Conduent’s solution with plans to expand the number of fare gates in the future
Conduent’s 3D Fare Gate Solution is designed to detect, deter and quantify fare evasion, benefiting both agencies and riders
FLORHAM PARK, N.J. — Conduent Transportation, a global provider of smart mobility technology solutions and business unit of Conduent Incorporated (Nasdaq: CNDT), today announced a pilot program by the Southeastern Pennsylvania Transportation Authority (SEPTA) using Conduent’s 3D Fare Gate Solution at a Philadelphia area transit station. The pilot aims to track and curb incidents of fare evasion, which costs SEPTA an estimated $30 million to $40 million annually.
“We’re excited to be part of this important pilot for SEPTA to help detect, deter and quantify fare evasion, while simultaneously offering both the agency and riders increased security and convenience”
SEPTA selected the 69th Street station in Upper Darby as its test location for riders traveling on the Market-Frankford and Norristown High Speed lines. The gates, each measuring 7 feet, 8 inches tall, began operating in April. Following the three-month pilot program, the agency plans to expand the fare gates’ availability to other stations, including those with high reported incidents of fare evasion.
“We’re excited to be part of this important pilot for SEPTA to help detect, deter and quantify fare evasion, while simultaneously offering both the agency and riders increased security and convenience,” said Adam Appleby, President, Transportation Solutions at Conduent. “As transit agencies across the country and around the world grapple with how to curb fare evasion, Conduent is poised and ready to deliver our solution, which has shown to deliver meaningful results and helps ensure riders pay their fares.”
Conduent’s 3D Fare Gate Solution uses innovative 3D detection optical sensors, allowing travelers fast and convenient access while detecting and deterring ticketing fraud. The gates also provide transit authorities quick access to reporting and analytics, aiding in enforcement decisions by identifying precisely when and where fare evasion occurs.
The gates, which were also implemented in Paris by Transilien SNCF in 2019, are designed to detect the most common types of fare evasion using advanced, sensor-based feedback mechanisms. The solution, which is ADA-compliant and adaptable to meet agency needs, improves equity in transportation by improving accessibility for all riders as well as helping to ensure passengers pay their share.
SEPTA is one of the largest transit systems in the country, serving five counties in the Greater Philadelphia area and connecting to Delaware and New Jersey transit systems. It operates across six transportation modes and has 2,800 vehicles in service, 285 subway and rail stations, plus 13,000 bus and trolley stops.
Conduent Transportation is a leading provider of streamlined, high-volume mobility services and solutions, spanning road usage charging and advanced transit systems, that enhance the services provided by transportation agencies to benefit the citizens who use them. For over 50 years, the company has helped clients advance transportation solutions in more than 20 countries.
About Conduent Conduent delivers digital business solutions and services spanning the commercial, government and transportation spectrum – creating valuable outcomes for its clients and the millions of people who count on them. The Company leverages cloud computing, artificial intelligence, machine learning, automation and advanced analytics to deliver mission-critical solutions. Through a dedicated global team of approximately 59,000 associates, process expertise and advanced technologies, Conduent’s solutions and services digitally transform its clients’ operations to enhance customer experiences, improve performance, increase efficiencies and reduce costs. Conduent adds momentum to its clients’ missions in many ways including disbursing approximately $100 billion in government payments annually, enabling 2.3 billion customer service interactions annually, empowering millions of employees through HR services every year and processing nearly 13 million tolling transactions every day. Learn more at www.conduent.com.
Trademarks Conduent is a trademark of Conduent Incorporated in the United States and/or other countries. Other names may be trademarks of their respective owners.
“We are proud to accept ASCO’s invitation to present at its 2024 Annual Meeting, the most significant gathering of oncology professionals worldwide,” said Vlad Vitoc, M.D., MAIA’s Chairman and Chief Executive Officer. “We look forward to revealing the newest efficacy results from THIO-101 and discussing our pioneering telomere targeting science underlying THIO, the first and only cancer treatment of its kind in clinical development.”
MAIA’s abstract will be available online at the ASCO Annual Meeting 2024 website during the week prior to the conference start date, and the poster will be published on maiabiotech.com on the day of the presentation, June 3, 2024.
The 2024 ASCO Annual Meeting will feature more than 200 sessions and 5,000 posters complementing the theme, “The Art and Science of Cancer Care: From Comfort to Cure.”
About ASCO
Founded in 1964, the American Society of Clinical Oncology is the world’s leading professional organization for physicians and oncology professionals caring for people with cancer. Its mission is to conquer cancer through research, education, and promotion of the highest quality, equitable patient care. ASCO’s vision is a world where cancer is prevented or cured, and every survivor is healthy. asco.org
About MAIA Biotechnology, Inc.
MAIA is a targeted therapy, immuno-oncology company focused on the development and commercialization of potential first-in-class drugs with novel mechanisms of action that are intended to meaningfully improve and extend the lives of people with cancer. Our lead program is THIO, a potential first-in-class cancer telomere targeting agent in clinical development for the treatment of NSCLC patients with telomerase-positive cancer cells. For more information, please visit www.maiabiotech.com.
Forward Looking Statements
MAIA cautions that all statements, other than statements of historical facts contained in this press release, are forward-looking statements. Forward-looking statements are subject to known and unknown risks, uncertainties, and other factors that may cause our or our industry’s actual results, levels or activity, performance or achievements to be materially different from those anticipated by such statements. The use of words such as “may,” “might,” “will,” “should,” “could,” “expect,” “plan,” “anticipate,” “believe,” “estimate,” “project,” “intend,” “future,” “potential,” or “continue,” and other similar expressions are intended to identify forward looking statements. However, the absence of these words does not mean that statements are not forward-looking. For example, all statements we make regarding (i) the initiation, timing, cost, progress and results of our preclinical and clinical studies and our research and development programs, (ii) our ability to advance product candidates into, and successfully complete, clinical studies, (iii) the timing or likelihood of regulatory filings and approvals, (iv) our ability to develop, manufacture and commercialize our product candidates and to improve the manufacturing process, (v) the rate and degree of market acceptance of our product candidates, (vi) the size and growth potential of the markets for our product candidates and our ability to serve those markets, and (vii) our expectations regarding our ability to obtain and maintain intellectual property protection for our product candidates, are forward looking. All forward-looking statements are based on current estimates, assumptions and expectations by our management that, although we believe to be reasonable, are inherently uncertain. Any forward-looking statement expressing an expectation or belief as to future events is expressed in good faith and believed to be reasonable at the time such forward-looking statement is made. However, these statements are not guarantees of future events and are subject to risks and uncertainties and other factors beyond our control that may cause actual results to differ materially from those expressed in any forward-looking statement. Any forward-looking statement speaks only as of the date on which it was made. We undertake no obligation to publicly update or revise any forward-looking statement, whether as a result of new information, future events or otherwise, except as required by law. In this release, unless the context requires otherwise, “MAIA,” “Company,” “we,” “our,” and “us” refers to MAIA Biotechnology, Inc. and its subsidiaries.
NEW YORK, May 16, 2024 (GLOBE NEWSWIRE) — AdTheorent Holding Company, Inc. (“AdTheorent” or the “Company”) (Nasdaq: ADTH), a machine learning pioneer delivering measurable value for programmatic advertisers, today announced that the third party that had submitted a non-binding acquisition proposal to acquire the Company for $3.35 per share has withdrawn such proposal, and has informed the Company that it does not intend to submit another acquisition proposal. This proposal had been submitted during the go-shop period that followed AdTheorent’s announcement of the execution of a definitive merger agreement (the “Merger Agreement”) pursuant to which Cadent, LLC (“Cadent”), a leading provider of platform-based converged TV advertising solutions and a portfolio company of Novacap, one of North America’s established private equity firms, agreed to acquire all outstanding shares of AdTheorent common stock for $3.21 per share in cash, or approximately $324 million.
The Company recently disclosed that the waiting period under the Hart-Scott-Rodino (“HSR”) Antitrust Improvements Act of 1976 expired on May 6, 2024. Expiration of the HSR waiting period was a condition to the closing of the pending transaction with Cadent.
The Company and Cadent continue to remain subject to the Merger Agreement, and pursuant thereto, the Company intends to mail as promptly as reasonably practicable a definitive proxy statement to its stockholders in connection with a special meeting of stockholders to approve the Cadent transaction.
About AdTheorent:
AdTheorent uses advanced machine learning technology and privacy-forward solutions to deliver impactful advertising campaigns for marketers. AdTheorent’s advanced machine learning-powered media buying platform powers its predictive targeting, predictive audiences, geo-intelligence, audience extension solutions and in-house creative capability, Studio A\T. Focused on the predictive value of machine learning models, AdTheorent’s product suite and flexible transaction models allow advertisers to identify the most qualified potential consumers coupled with the optimal creative experience to deliver superior results, measured by each advertiser’s real-world business goals. AdTheorent is headquartered in New York, with fourteen locations across the United States and Canada.
AdTheorent is consistently recognized with numerous technology, product, growth and workplace awards. AdTheorent was named “Best Buy-Side Programmatic Platform” in the 2023 Digiday Technology Awards and was honored with an AI Breakthrough Award and “Most Innovative Product” (B.I.G. Innovation Awards) for six consecutive years. Additionally, AdTheorent is the only seven-time recipient of Frost & Sullivan’s “Digital Advertising Leadership Award.” In September 2023, evidencing its continued prioritization of its team, AdTheorent was named a Crain’s Top 100 Best Place to Work in NYC for the tenth consecutive year. AdTheorent ranked tenth in the Large Employer Category and 26th Overall in 2023. For more information, visit adtheorent.com.
Additional Information and Where to Find It:
This release may be deemed to be solicitation material in respect of the transaction contemplated by the Merger Agreement (the “proposed merger”). In connection with the proposed merger, the Company filed its Preliminary Proxy Statement on April 30, 2024. This communication is not a substitute for the Preliminary Proxy Statement or any other document that AdTheorent may file with the SEC or send to its stockholders in connection with the proposed merger. When the Company files its proxy statement in definitive form (the “Definitive Proxy Statement”) with the SEC, the Company will mail the Definitive Proxy Statement and a proxy card to each stockholder entitled to vote at the special meeting relating to the proposed merger. INVESTORS AND STOCKHOLDERS OF THE COMPANY ARE URGED TO READ ALL RELEVANT DOCUMENTS FILED WITH THE SEC, INCLUDING THE COMPANY’S DEFINITIVE PROXY STATEMENT (WHEN AVAILABLE), BECAUSE THEY CONTAIN OR WILL CONTAIN IMPORTANT INFORMATION ABOUT THE PROPOSED MERGER. Investors and security holders are or will be able to obtain the documents (when available) free of charge at the SEC’s website at www.sec.gov, or free of charge from the Company by directing a request to David DeStefano, Investor Relations at AdTheorentIR@icrinc.com or (203) 682-8383.
Participants in the Solicitation:
AdTheorent, Cadent, and their respective directors, executive officers and other members of management and employees, under SEC rules, may be deemed to be “participants” in the solicitation of proxies from stockholders of AdTheorent in favor of the proposed merger. Additional information about AdTheorent’s directors and executive officers is set forth in AdTheorent’s Form 10-K/A for the year ended December 31, 2023, which was filed with the SEC on April 25, 2024 (the “Form 10-K/A”). To the extent holdings of AdTheorent’s securities by its directors or executive officers have changed since the amounts set forth in the Form 10-K/A, such changes have been or will be reflected on Initial Statements of Beneficial Ownership on Form 3 or Statements of Change in Ownership on Form 4 filed with the SEC. Additional information concerning the interests of AdTheorent’s participants in the solicitation, which may, in some cases, be different than those of AdTheorent’s stockholders generally, will be set forth in the Definitive Proxy Statement relating to the proposed merger when it becomes available.
No Offer or Solicitation:
This release is not intended to and shall not constitute an offer to buy or sell or the solicitation of an offer to buy or sell any securities, or a solicitation of any vote or approval, nor shall there be any offer, solicitation or sale of securities in any jurisdiction in which such offer, solicitation or sale would be unlawful prior to registration or qualification under the securities laws of any such jurisdiction. No offer of securities shall be made in the United States absent registration under the Securities Act of 1933, as amended, or pursuant to an exemption from, or in a transaction not subject to, such registration requirements.
Forward Looking Statements:
This release contains “forward-looking statements” within the meaning of the safe harbor provisions of the U.S. Private Securities Litigation Reform Act of 1995. Forward-looking statements include, without limitation, any statement that may predict, forecast, indicate or imply future results, performance or achievements, and may contain words such as “believe,” “anticipate,” “expect,” “estimate,” “intend,” “project,” “plan,” or words or phrases with similar meaning. Such statements may also include statements regarding the completion of the proposed merger and the expected timing of the completion of the proposed merger, the management of AdTheorent upon completion of the proposed merger and AdTheorent’s plans upon completion of the proposed merger. Forward-looking statements should not be read as a guarantee of future performance or results and will not necessarily be accurate indications of the times at, or by, which such performance or results will be achieved. Forward-looking statements are based on current expectations, forecasts and assumptions that involve risks and uncertainties, including, but not limited to, the market for programmatic advertising developing slower or differently than AdTheorent’s expectations, the demands and expectations of clients and the ability to attract and retain clients and other economic, competitive, governmental and technological factors outside of AdTheorent’s control, that may cause AdTheorent’s business, strategy or actual results to differ materially from the forward-looking statements. Actual future results, performance or achievements may differ materially from historical results or those anticipated depending on a variety of factors, some of which are beyond the control of AdTheorent, including, but not limited to, the occurrence of any event, change or other circumstances that could give rise to the termination of the Merger Agreement, including under circumstances that would require the Company to pay a termination fee; the inability to complete the proposed merger due to the failure to obtain stockholder approval for the proposed merger or the failure to satisfy other conditions to completion of the proposed merger; risks related to disruption of management’s attention from AdTheorent’s ongoing business operations due to the proposed merger; unexpected costs, charges or expenses resulting from the proposed merger; AdTheorent’s ability to retain and hire key personnel in light of the proposed merger; certain restrictions during the pendency of the proposed merger that may impact AdTheorent’s ability to pursue certain business opportunities or strategic transactions; the ability of the buyer to obtain the necessary financing arrangements set forth in the commitment letters received in connection with the proposed merger; potential litigation relating to the proposed merger that could be instituted against the parties to the Merger Agreement or their respective directors, managers or officers, including the effects of any outcomes related thereto; the effect of the announcement of the proposed merger on AdTheorent’s relationships with its customers, operating results and business generally; and the risk that the proposed merger will not be consummated in a timely manner, if at all. AdTheorent refers you to the “Risk Factors” and “Management’s Discussion and Analysis of Financial Condition and Results of Operations” sections of the Company’s Form 10-K for the fiscal year ended December 31, 2023, and comparable sections of the Company’s Quarterly Reports on Form 10-Q and other filings, which have been filed with the SEC and are available on the SEC’s website at www.sec.gov. All of the forward-looking statements made in this report are expressly qualified by the cautionary statements contained or referred to herein. The actual results or developments anticipated may not be realized or, even if substantially realized, they may not have the expected consequences to or effects on AdTheorent or its business or operations. Readers are cautioned not to rely on the forward-looking statements contained in this report. Forward-looking statements speak only as of the date they are made and AdTheorent does not undertake any obligation to update, revise or clarify these forward-looking statements, whether as a result of new information, future events or otherwise, except as may be required by applicable law.
The Annual Russell Index Revision and Dates to Watch (2024)
The yearly process of recasting the Russell Indexes begins on Tuesday, April 30 and will be complete by market opening on June 30. During the period in between, FTSE Russell will rank stocks for additions, for deletions and evaluate the companies to make sure they conform overall. The methodology for inserting and removing tickers in the Russell 3000, Russell 2000, and Russell 1000 is intentionally transparent to help eliminate price shocks. Price movements do of course occur along the way, and investors try to foresee and capitalize on them. Channelchek will be providing updates that may uncover opportunities, or at least provide an understanding of stock price swings during this period.
Background
Russell index products are widely used by institutional and retail investors throughout the world. There is more than $20.1 trillion currently benchmarked to a Russell index. This includes approximately $12.1 trillion benchmarked to the Russell US Equity indexes. The trading volume of some companies moving into an index will heighten around the last Friday in June as fund managers seek to maintain level tracking with their benchmark target.
Opportunity
For non-passive investing, determining which stocks may benefit from moving up to a large-cap index, down to a smaller one, or into or out of the measurements is an annual event causing volatility around stocks. There has, of course, the potential for very profitable long and short trades. And the potential for an unwitting investor to be holding a company moving out of an index, which could cause less interest in the stock, and perhaps unfortunate performance.
Active investors should make themselves aware of the forces at play so they may either get out of the way or determine if they should become involved by taking positions with those being added or those at the end of their reign within one of the Russell measurements.
Dramatic Valuation Shifts
The leading industries and altered market-cap of companies of a year ago have changed dramatically from last year’s reconstitution. This will be reflected in the 2023 rebalancing and is going to impact a much larger number of companies than most years. That is to say, a higher percentage of companies than normal will move in, out, or to another index, and may be subject to amplified price movement.
The 2024 Russell Reconstitution Schedule:
• Tuesday, April 30th – “Rank Day” – Index membership eligibility for 2024 Russell Reconstitution determined from constituent market capitalization at market close.
• Friday, May 24 – Preliminary index additions & deletions membership lists posted to the FTSE Russell website after 6 PM US eastern time.
• Friday, May 31st, June 7th, 14th and 21st – Preliminary membership lists (reflecting any updates) posted to the FTSE Russell website after 6 PM US eastern time.
• Monday, June 10th – “Lock-down” period begins with the updates to reconstitution membership considered to be final.
• Friday, June 28th – Russell Reconstitution is final after the close of the US equity markets.
• Monday, July 1st – Equity markets open with the newly reconstituted Russell US Indexes.
Take-Away
The annual reconstitution is a significant driver of dramatic shifts in some stock prices as portfolio managers have their holding needs shifted within a very short period of time. Longer-term demand for certain equities is altered as well. Sizable price movements and volatility are expected, especially around the last week in June. In fact, the opening day of the reconstitution is typically one of the highest trading-volume days of the year in the US equity markets.
The market event impacts more than $9 trillion of investor assets benchmarked to or invested in products based on the Russell US Indexes. Portfolio managers that are required to track one of these indexes will work to have minimal portfolio slippage away from their benchmark. The days and weeks from April 30 through the last Friday in June can create opportunities for investors seeking to benefit from price moves, Channelchek will be covering the event as stocks to be added to, or removed from this year’s Russell Reconstitution and other information plays out.
Want small cap opportunities delivered straight to your inbox? Channelchek’s free newsletter will give you exclusive access to our expert research, news, and insights to help you make informed investment decisions.
NEW YORK, May 15, 2024 /PRNewswire/ — Bit Digital, Inc. (Nasdaq: BTBT) (the “Company”), a sustainable platform for digital assets and artificial intelligence (“AI”) infrastructure headquartered in New York City, today announced its unaudited financial results for the First Quarter ended March 31, 2024.
Financial Highlights for the First Quarter of 2024
Total revenue was $30.3 million for the First Quarter of 2024, a 266% increase compared to the First Quarter of 2023. The increase was primarily driven by the commencement of our Bit Digital AI business and by a higher realized bitcoin price.
Revenue from bitcoin mining was $21.9 million for the First Quarter of 2024, a 166% increase compared to the prior year’s quarter. The Company’s Bit Digital AI business, referred to as High performance computing services (“HPC”), began generating revenue in January 2024, and recognized $8.1 million of revenue during the quarter. The Company issued a one-time service credit of $1.3 million to its HPC customer as compensation for decreased utilization during the initial deployment period, which included testing and optimization phases. Illustratively, adding back this credit would yield pro forma gross margins of approximately 72% on a net basis compared to reported gross margins of 61% for the segment. Revenue from ETH staking was approximately $0.3 million.
The Company had cash, cash equivalents and restricted cash of $35.5 million, and total liquidity (defined as cash equivalents and restricted cash, USDC, and the fair market value of digital assets) of approximately $163.21 million, as of March 31, 2024.
Total assets were $291.1 million and Shareholders’ Equity amounted to $265.2 million as of March 31, 2024.
Adjusted EBITDA2 was $58.5 million for the First Quarter of 2024 compared to $1.5 million for the First Quarter of 2023.
GAAP earnings per share was $0.43 on a fully-diluted basis for the First Quarter of 2024 compared to a loss of $0.03 for the First Quarter of 2023.
Operational Highlights for the First Quarter 2024
The Company earned 410.7 bitcoins during the First Quarter of 2024, a 13% increase from the prior year. Growth was primarily driven by a higher active hash rate and partially offset by an increase in network difficulty.
The Company paid approximately $0.05 per kilowatt hour to its hosting partners for electricity consumed during the First Quarter of 2024.
The average fleet efficiency for the active fleet was approximately 28.3 J/TH as of March 31, 2024.
The Company earned 111.1 ETH in native staking and 1.3 ETH in liquid staking, respectively, in the First Quarter of 2024.
Treasury holdings of BTC and ETH were 956.4 and 16,031.43, respectively, with a fair market value of approximately $68.2 million and $58.5 million on March 31, 2024, respectively.
The BTC equivalent4 of our digital asset holdings as of March 31, 2024 (defined as if all ETH and USDC holdings were converted into BTC as of that date) was approximately 1,790.0 BTC5, or approximately $127.7 million.
As of March 31, 2024, we had 48,898 miners owned or operating (in Iceland) for bitcoin mining with a total maximum hash rate of 4.2 EH/S.
The Company’s active hash rate of its bitcoin mining fleet was approximately 2.76 EH/s as of March 31, 2024.
The Company purchased approximately 2,350 bitcoin mining units during the First Quarter of 2024.
Approximately 85% of our fleet’s run-rate electricity consumption was generated from carbon-free energy sources as of March 31, 2024. These figures are based on data provided by our hosts, publicly available sources, and internal estimates, demonstrating our commitment to sustainable practices in the digital asset mining industry.
The Company had approximately 3,008 ETH actively staked in native staking protocols as of March 31, 2024. The decrease relative to the prior quarter was due to the Company changing its provider for native staking solutions. As of April 30, 2024, the Company had approximately 17,184 ETH actively staked in native staking protocols.
On January 22, 2024, approximately 192 servers (1,536 GPUs) began generating revenue from the Company’s AI customer contract. Subsequently, approximately 64 additional servers (512 GPUs) commenced revenue generation on February 2, 2024.
On January 26, 2024, the Company finalized an agreement with Coinmint for up to 6 MW of additional mining capacity at Coinmint’s hosting facility in Massena, New York. This new agreement brings the Company’s total contracted hosting capacity with Coinmint to approximately 46 MW.
Management Commentary
“Our First Quarter 2024 results represent a strong start to the year with revenue growing by more than 250% and GAAP Net Income in excess of $50 million. The primary drivers for the improved performance were the commencement of our Bit Digital AI business and a higher realized bitcoin price.
We were well prepared for the halving which occurred in April 2024. Our balance sheet remains a core strength with over $160 million of total liquidity as of March 31, 2024, zero debt, and a growing revenue stream that is not correlated to the economics of bitcoin mining. While we continue to evaluate the post-halving bitcoin mining landscape, our goal of reaching 6.0 EH/s this year remains intact. We are actively engaged in discussions for both incremental hosting opportunities and potential acquisitions.
We continue to believe that capital allocation optionality provided by our complementary business lines is a key differentiator for our Company. We are actively evaluating a number of growth opportunities, both organic and inorganic, across each of our business lines. We are in the late stages of finalizing an agreement to double the size of the GPU fleet for our anchor client and our negotiations with prospective clients are progressing well. Our target of reaching a $100 million annualized revenue run-rate by year-end for this segment remains intact.”
About Bit Digital
Bit Digital, Inc. is a sustainable platform for digital assets and artificial intelligence (“AI”) infrastructure headquartered in New York City. Our bitcoin mining operations are located in the US, Canada, and Iceland. The Company has established a business line, Bit Digital AI, that offers infrastructure services for artificial intelligence applications. For additional information, please contact ir@bit-digital.com or visit our website at www.bit-digital.com.
Investor Notice
Investing in our securities involves a high degree of risk. Before making an investment decision, you should carefully consider the risks, uncertainties and forward-looking statements described under “Risk Factors” in Item 3.D of our Annual Report on Form 20-F for the fiscal year ended December 31, 2023. If any material risk was to occur, our business, financial condition or results of operations would likely suffer. In that event, the value of our securities could decline and you could lose part or all of your investment. The risks and uncertainties we describe are not the only ones facing us. Additional risks not presently known to us or that we currently deem immaterial may also impair our business operations. In addition, our past financial performance may not be a reliable indicator of future performance, and historical trends should not be used to anticipate results in the future. Future changes in the network-wide mining difficulty rate or bitcoin hash rate may also materially affect the future performance of Bit Digital’s production of bitcoin. Actual operating results will vary depending on many factors including network difficulty rate, total hash rate of the network, the operations of our facilities, the status of our miners, and other factors. See “Safe Harbor Statement” below.
Safe Harbor Statement
This press release may contain certain “forward-looking statements” relating to the business of Bit Digital, Inc., and its subsidiary companies. All statements, other than statements of historical fact included herein are “forward-looking statements.” These forward-looking statements are often identified by the use of forward-looking terminology such as “believes,” “expects,” or similar expressions, involving known and unknown risks and uncertainties. Although the Company believes that the expectations reflected in these forward-looking statements are reasonable, they do involve assumptions, risks and uncertainties, and these expectations may prove to be incorrect. Investors should not place undue reliance on these forward-looking statements, which speak only as of the date of this press release. The Company’s actual results could differ materially from those anticipated in these forward-looking statements as a result of a variety of factors, including those discussed in the Company’s periodic reports that are filed with the Securities and Exchange Commission and available on its website at http://www.sec.gov. All forward-looking statements attributable to the Company or persons acting on its behalf are expressly qualified in their entirety by these factors. Other than as required under the securities laws, the Company does not assume a duty to update these forward-looking statements.
Footnotes:
1 This figure excludes approximately 2,701 ETH that were transferred to an internally managed fund.
2 Adjusted EBITDA refers to earnings before interest expense, income tax expense and depreciation and amortization expense (“EBITDA”) adjusted to eliminate the effects of certain non-cash and / or non-recurring items.
3 This figure excludes approximately 2,701 ETH that were transferred to an internally managed fund.
4 “BTC equivalent” is a hypothetical illustration of the value of our digital asset portfolio in bitcoin terms. BTC equivalent is defined as if all non-BTC digital assets, comprised of ETH and USDC, were converted into BTC as of March 31, 2024, and added to our existing BTC balance. Conversion values are found using the closing price on coinmarketcap.com.
5 This figure excludes approximately 2,701 ETH that were transferred to an internally managed fund.
DENVER, May 15, 2024 /CNW/ – Medicine Man Technologies, Inc., operating as Schwazze, (OTCQX: SHWZ) (Cboe CA: SHWZ) (“Schwazze” or the “Company”), today announced financial and operational results for the first quarter ended March 31, 2024.
“We delivered another period of revenue growth in Q1 as we further refined our retail strategy while contending with the prolonged competitive challenges in Colorado and New Mexico,” said Forrest Hoffmaster, Interim CEO of Schwazze. “Throughout the quarter, we continued to sharpen our pricing and promotional efforts while enhancing the in-store experience, widening assortment, improving in-stock position, and advancing our loyalty program to attract and retain new customers. We also strengthened our wholesale business with quarter-over-quarter growth, while surpassing 30% total door penetration across both states.”
“The Colorado market remains highly competitive with more than 680 active recreational licenses, underscoring the importance of delivering an exceptional customer experience and fully integrated retail support program. Although retail pricing has recently stabilized, Colorado sales in Q1 were down 10% year-over-year due to lower volumes. Nonetheless, we significantly outpaced the market as our sales were up 9%, demonstrating the effectiveness of our operating playbook to compete in challenging environments. We expect to continue driving improvements in customer acquisition, retention, and loyalty as we further increase market share in the state.”
“In New Mexico, the proliferation of new licenses continued to outpace state cannabis sales as store count in Q1 increased 31% year-over-year while the market grew only 13%. In addition to pricing and promotional efforts, we’ve focused on driving traffic into our stores by expanding assortment with high quality flower and delivering an elevated customer experience. The New Mexico regulatory body has also increased its license enforcement efforts in recent months, contributing to more than 70 store closures and a 33% sequential decrease in net new store openings in the first quarter. We will continue to support the New Mexico Cannabis Control Division as it develops its regulatory framework.”
“Over the past four years we have rapidly scaled our footprint through 13 acquisitions, building a leading retail presence in both Colorado and New Mexico. We are beginning to see positive momentum from our pricing and promotional strategy and will remain focused on driving operating efficiencies while further optimizing our assets as we consolidate cultivation facilities and eliminate underperforming stores that do not meet our high-margin thresholds. We believe these initiatives, coupled with our operating playbook and strict cost controls, will enable us to return to stronger levels of profitability moving forward.”
First Quarter 2024 Financial Summary
Announced the grand opening of a medical and recreational dispensary in March under the Everest Apothecary banner in Las Cruces, New Mexico, increasing the Company’s retail footprint to 34 stores across the state.
Increased wholesale penetration in the first quarter to more than 30% of total doors in Colorado and New Mexico.
Lowell Herb Co. pre-roll sales increased more than 3x quarter-over-quarter in Colorado, where it continues to be the #1 pre-roll in the state.
Wana gummy sales up more than 2x quarter-over-quarter in New Mexico.
First Quarter 2024 Financial Results
Total revenue in the first quarter of 2024 increased 4% to $41.6 million compared to $40.0 million for the same quarter last year. The increase was primarily due to growth from new stores compared to the prior year period, partially offset by continued pricing pressure and the proliferation of new licenses in New Mexico.
Gross profit for the first quarter of 2024 was $17.9 million or 43.1% of total revenue, compared to $21.8 million or 54.6% of total revenue for the same quarter last year. The decrease in gross margin was primarily driven by the aforementioned pricing pressure in New Mexico, as well as higher medical sales mix in Colorado.
____________________________
1 Q4 2023 Gross Profit includes one-time, non-cash inventory adjustments of approximately $13.1 million comprised of $3.1 million of product consolidation, obsolescence, and shrinkage expenses, $4.3 million of net realizable value adjustments, and $5.8 million of fair value adjustments on acquired inventory in New Mexico in 2023. 2 Adjusted EBITDA is a non-GAAP measure as defined by the SEC, and represents earnings before interest, taxes, depreciation, and amortization, adjusted for other income, non-cash share-based compensation, one-time transaction related expenses, or other non-operating costs. The Company uses Adjusted EBITDA as it believes it better explains the results of its core business. See “ADJUSTED EBITDA RECONCILIATION (NON-GAAP)” section herein for an explanation and reconciliations of non-GAAP measure used throughout this release.
Operating expenses for the first quarter of 2024 were $20.6 million compared to $16.2 million for the same quarter last year. The year-ago period benefitted from a payroll tax credit of $3.9M. The remaining increase was primarily driven by personnel expenses and four-wall SG&A costs associated with 21 additional stores in Colorado and New Mexico that are still ramping.
Loss from operations for the first quarter of 2024 was $2.7 million compared to income from operations of $5.6 million in the same quarter last year. Net loss was $16.1 million for the first quarter of 2024 compared to net income of $1.7 million for the same quarter last year.
Adjusted EBITDA for the first quarter of 2024 was $7.3 million compared to $14.5 million for the same quarter last year. The decrease in Adjusted EBITDA was primarily driven by lower gross margin and higher operating expenses associated with the 21 additional stores that are still ramping.
As of March 31, 2024, cash and cash equivalents were $13.2 million compared to $19.2 million on December 31, 2023. Total debt as of March 31, 2024, was $159.7 million compared to $156.8 million on December 31, 2023.
Conference Call
The Company will conduct a conference call today, May 15, 2024, at 5:00 p.m. Eastern time to discuss its results for the first quarter ended March 31, 2024.
Schwazze management will host the conference call, followed by a question-and-answer period. Interested parties may submit questions to the Company prior to the call by emailing ir@schwazze.com.
Date: Wednesday, May 15, 2024 Time: 5:00 p.m. Eastern time Toll-free dial-in: (888) 664-6383 International dial-in: (416) 764-8650 Conference ID: 84167910 Webcast: SHWZ Q1 2024 Earnings Call
The conference call will also be broadcast live and available for replay on the investor relations section of the Company’s website at https://ir.schwazze.com.
If you have any difficulty registering or connecting with the conference call, please contact Elevate IR at (720) 330-2829.
About Schwazze
Schwazze (OTCQX: SHWZ) (Cboe CA: SHWZ) is building a premier vertically integrated regional cannabis company with assets in Colorado and New Mexico and will continue to explore taking its operating system to other states where it can develop a differentiated regional leadership position. Schwazze is the parent company of a portfolio of leading cannabis businesses and brands spanning seed to sale.
Schwazze is anchored by a high-performance culture that combines customer-centric thinking and data science to test, measure, and drive decisions and outcomes. The Company’s leadership team has deep expertise in retailing, wholesaling, and building consumer brands at Fortune 500 companies as well as in the cannabis sector.
Medicine Man Technologies, Inc. was Schwazze’s former operating trade name. The corporate entity continues to be named Medicine Man Technologies, Inc. Schwazze derives its name from the pruning technique of a cannabis plant to enhance plant structure and promote healthy growth. To learn more about Schwazze, visit https://schwazze.com/.
Forward-Looking Statements
This press release contains “forward-looking statements” within the meaning of the U.S. Private Securities Litigation Reform Act of 1995, Section 27A of the Securities Act of 1933, as amended, and Section 21E of the Securities Exchange Act of 1934, as amended. These forward-looking statements include financial outlooks; any projections of net sales, earnings, or other financial items; any statements of the strategies, plans and objectives of our management team for future operations; expectations in connection with the Company’s previously announced business plans; any statements regarding future economic conditions or performance; and statements regarding the intent, belief or current expectations of our management team. Such statements may be preceded by the words “may,” “will,” “could,” “would,” “should,” “expect,” “intends,” “plans,” “strategy,” “prospects,” “anticipate,” “believe,” “approximately,” “estimate,” “predict,” “project,” “potential,” “continue,” “ongoing,” or the negative of these terms or other words of similar meaning in connection with a discussion of future events or future operating or financial performance, although the absence of these words does not necessarily mean that a statement is not forward-looking. We have based our forward-looking statements on management’s current expectations and assumptions about future events and trends affecting our business and industry. Although we do not make forward-looking statements unless we believe we have a reasonable basis for doing so, we cannot guarantee their accuracy. Therefore, forward-looking statements are not guarantees of future events or performance, are based on certain assumptions, and are subject to various known and unknown risks and uncertainties, many of which are beyond the Company’s control and cannot be predicted or quantified. Consequently, actual events and results may differ materially from those expressed or implied by such forward-looking statements. Such risks and uncertainties include, without limitation, risks and uncertainties associated with (i) regulatory limitations on our products and services and the uncertainty in the application of federal, state, and local laws to our business, and any changes in such laws; (ii) our ability to manufacture our products and product candidates on a commercial scale on our own or in collaboration with third parties; (iii) our ability to identify, consummate, and integrate anticipated acquisitions; (iv) general industry and economic conditions; (v) our ability to access adequate capital upon terms and conditions that are acceptable to us; (vi) our ability to pay interest and principal on outstanding debt when due; (vii) volatility in credit and market conditions; (viii) the loss of one or more key executives or other key employees; and (ix) other risks and uncertainties related to the cannabis market and our business strategy. More detailed information about the Company and the risk factors that may affect the realization of forward-looking statements is set forth in the Company’s filings with the Securities and Exchange Commission (SEC), including the Company’s Annual Report on Form 10-K and its Quarterly Reports on Form 10-Q. Investors and security holders are urged to read these documents free of charge on the SEC’s website at http://www.sec.gov. The Company assumes no obligation to publicly update or revise its forward-looking statements as a result of new information, future events or otherwise except as required by law.
Investor Relations Contact Sean Mansouri, CFA or Aaron D’Souza Elevate IR (720) 330-2829 ir@schwazze.com
MEDICINE MAN TECHNOLOGIES, INC. CONDENSED CONSOLIDATED BALANCE SHEETS For the Periods Ended March 31, 2024 and December 31, 2023 Expressed in U.S. Dollars
Snail is a leading, global independent developer and publisher of interactive digital entertainment for consumers around the world, with a premier portfolio of premium games designed for use on a variety of platforms, including consoles, PCs and mobile devices.
Michael Kupinski, Director of Research, Equity Research Analyst, Digital, Media & Technology , Noble Capital Markets, Inc.
Patrick McCann, CFA, Research Analyst, Noble Capital Markets, Inc.
Refer to the full report for the price target, fundamental analysis, and rating.
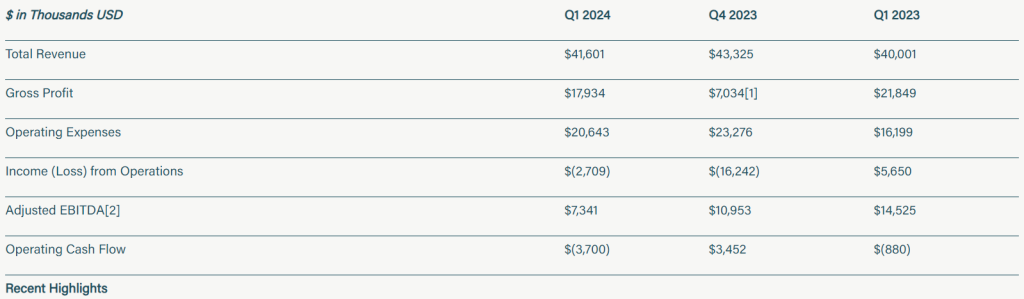
Q1 results. The company reported Q1 revenue of $14.1 million, and adj. EBITDA loss of $1.9 million, both of which were lower than our estimates of $24.0 million and $2.8 million, respectively, as illustrated in Figure #1 Results. Importantly, the company deferred $5.5 million of revenue in the quarter, which contributed to the results falling short of expectations. We expect revenue deferrals to be the cause of some noise in operating results during 2024, as the company prepares for the launch of ARK 2.
Deferred revenue recognition. The deferred ASA revenue will be split evenly across five DLCS that are included in the sale of the game and recognized as the DLCs are released. Three of the DLCs included in ASA will be released in 2024 (Q2, Q3, Q4) with the remaining two expected in 2025. Importantly, a portion of the revenue from the sale of ASA are being deferred, but not all of the associated costs are being deferred.
Equity Research is available at no cost to Registered users of Channelchek. Not a Member? Click ‘Join’ to join the Channelchek Community. There is no cost to register, and we never collect credit card information.
This Company Sponsored Research is provided by Noble Capital Markets, Inc., a FINRA and S.E.C. registered broker-dealer (B/D).
*Analyst certification and important disclosures included in the full report. NOTE: investment decisions should not be based upon the content of this research summary. Proper due diligence is required before making any investment decision.